| 1.7 |
5.0 |
GO:0030300 |
regulation of intestinal cholesterol absorption(GO:0030300) |
| 1.7 |
8.3 |
GO:0015671 |
oxygen transport(GO:0015671) |
| 1.6 |
4.9 |
GO:0070366 |
regulation of hepatocyte differentiation(GO:0070366) |
| 1.3 |
6.3 |
GO:0015705 |
iodide transport(GO:0015705) |
| 1.2 |
16.0 |
GO:0042573 |
retinoic acid metabolic process(GO:0042573) |
| 1.2 |
4.9 |
GO:0048819 |
regulation of hair follicle maturation(GO:0048819) regulation of catagen(GO:0051794) |
| 1.1 |
1.1 |
GO:0007354 |
zygotic determination of anterior/posterior axis, embryo(GO:0007354) |
| 1.1 |
3.4 |
GO:0061537 |
glycine secretion(GO:0061536) glycine secretion, neurotransmission(GO:0061537) |
| 1.1 |
4.3 |
GO:0031581 |
hemidesmosome assembly(GO:0031581) |
| 1.1 |
5.3 |
GO:0046654 |
tetrahydrofolate biosynthetic process(GO:0046654) |
| 1.1 |
3.2 |
GO:0001803 |
type III hypersensitivity(GO:0001802) regulation of type III hypersensitivity(GO:0001803) positive regulation of type III hypersensitivity(GO:0001805) |
| 1.0 |
4.1 |
GO:0097211 |
response to gonadotropin-releasing hormone(GO:0097210) cellular response to gonadotropin-releasing hormone(GO:0097211) |
| 1.0 |
9.1 |
GO:0019800 |
peptide cross-linking via chondroitin 4-sulfate glycosaminoglycan(GO:0019800) |
| 0.9 |
2.8 |
GO:0014738 |
regulation of muscle hyperplasia(GO:0014738) muscle hyperplasia(GO:0014900) |
| 0.9 |
2.7 |
GO:0015889 |
cobalamin transport(GO:0015889) |
| 0.9 |
0.9 |
GO:0035036 |
binding of sperm to zona pellucida(GO:0007339) sperm-egg recognition(GO:0035036) |
| 0.9 |
3.6 |
GO:0010940 |
positive regulation of necrotic cell death(GO:0010940) |
| 0.9 |
2.7 |
GO:1901552 |
positive regulation of endothelial cell development(GO:1901552) positive regulation of establishment of endothelial barrier(GO:1903142) |
| 0.8 |
2.4 |
GO:0010814 |
substance P catabolic process(GO:0010814) calcitonin catabolic process(GO:0010816) endothelin maturation(GO:0034959) |
| 0.8 |
4.8 |
GO:0046070 |
dGTP metabolic process(GO:0046070) |
| 0.8 |
5.6 |
GO:2000491 |
positive regulation of hepatic stellate cell activation(GO:2000491) |
| 0.8 |
2.4 |
GO:0086017 |
response to inactivity(GO:0014854) response to muscle inactivity(GO:0014870) response to muscle inactivity involved in regulation of muscle adaptation(GO:0014877) response to denervation involved in regulation of muscle adaptation(GO:0014894) Purkinje myocyte action potential(GO:0086017) membrane depolarization during SA node cell action potential(GO:0086046) |
| 0.8 |
4.6 |
GO:0021797 |
forebrain anterior/posterior pattern specification(GO:0021797) |
| 0.8 |
4.6 |
GO:0003433 |
chondrocyte development involved in endochondral bone morphogenesis(GO:0003433) |
| 0.8 |
1.5 |
GO:0061074 |
regulation of neural retina development(GO:0061074) |
| 0.7 |
3.7 |
GO:0071205 |
protein localization to juxtaparanode region of axon(GO:0071205) |
| 0.7 |
2.2 |
GO:0033634 |
positive regulation of cell-cell adhesion mediated by integrin(GO:0033634) |
| 0.7 |
2.1 |
GO:0010725 |
regulation of primitive erythrocyte differentiation(GO:0010725) |
| 0.7 |
2.7 |
GO:0035606 |
peptidyl-cysteine S-trans-nitrosylation(GO:0035606) |
| 0.7 |
2.7 |
GO:0046391 |
5-phosphoribose 1-diphosphate biosynthetic process(GO:0006015) 5-phosphoribose 1-diphosphate metabolic process(GO:0046391) |
| 0.7 |
2.0 |
GO:0097623 |
potassium ion export across plasma membrane(GO:0097623) |
| 0.6 |
3.2 |
GO:0046864 |
retinol transport(GO:0034633) isoprenoid transport(GO:0046864) terpenoid transport(GO:0046865) alveolar primary septum development(GO:0061143) |
| 0.6 |
1.9 |
GO:0003032 |
detection of oxygen(GO:0003032) |
| 0.6 |
6.4 |
GO:0070574 |
cadmium ion transport(GO:0015691) cadmium ion transmembrane transport(GO:0070574) |
| 0.6 |
3.2 |
GO:0070327 |
thyroid hormone transport(GO:0070327) |
| 0.6 |
2.5 |
GO:1903966 |
monounsaturated fatty acid metabolic process(GO:1903964) monounsaturated fatty acid biosynthetic process(GO:1903966) |
| 0.6 |
1.8 |
GO:2000418 |
positive regulation of eosinophil migration(GO:2000418) |
| 0.6 |
1.8 |
GO:0033566 |
gamma-tubulin complex localization(GO:0033566) |
| 0.6 |
1.8 |
GO:0046022 |
regulation of transcription from RNA polymerase II promoter, mitotic(GO:0046021) positive regulation of transcription from RNA polymerase II promoter during mitosis(GO:0046022) axial mesoderm morphogenesis(GO:0048319) |
| 0.6 |
1.2 |
GO:0014016 |
neuroblast differentiation(GO:0014016) |
| 0.6 |
1.2 |
GO:0002513 |
tolerance induction to self antigen(GO:0002513) |
| 0.6 |
0.6 |
GO:0048389 |
intermediate mesoderm development(GO:0048389) pattern specification involved in mesonephros development(GO:0061227) anterior/posterior pattern specification involved in kidney development(GO:0072098) ureter urothelium development(GO:0072190) |
| 0.6 |
1.8 |
GO:0070625 |
zymogen granule exocytosis(GO:0070625) |
| 0.6 |
2.4 |
GO:0071449 |
cellular response to lipid hydroperoxide(GO:0071449) |
| 0.6 |
1.8 |
GO:1904457 |
positive regulation of neuronal action potential(GO:1904457) |
| 0.6 |
0.6 |
GO:0003245 |
cardiac muscle tissue growth involved in heart morphogenesis(GO:0003245) |
| 0.6 |
1.7 |
GO:0002408 |
myeloid dendritic cell chemotaxis(GO:0002408) |
| 0.6 |
2.3 |
GO:0070829 |
heterochromatin maintenance(GO:0070829) |
| 0.6 |
1.7 |
GO:0010871 |
negative regulation of receptor biosynthetic process(GO:0010871) opioid receptor signaling pathway(GO:0038003) regulation of opioid receptor signaling pathway(GO:2000474) |
| 0.6 |
1.7 |
GO:0051902 |
negative regulation of mitochondrial depolarization(GO:0051902) negative regulation of membrane depolarization(GO:1904180) |
| 0.6 |
2.2 |
GO:0014846 |
esophagus smooth muscle contraction(GO:0014846) |
| 0.6 |
4.4 |
GO:0006004 |
fucose metabolic process(GO:0006004) |
| 0.6 |
1.7 |
GO:0030421 |
defecation(GO:0030421) |
| 0.5 |
1.6 |
GO:0002586 |
positive regulation of antigen processing and presentation of peptide or polysaccharide antigen via MHC class II(GO:0002582) regulation of antigen processing and presentation of peptide antigen via MHC class II(GO:0002586) positive regulation of antigen processing and presentation of peptide antigen via MHC class II(GO:0002588) |
| 0.5 |
1.1 |
GO:0002034 |
angiotensin mediated vasoconstriction involved in regulation of systemic arterial blood pressure(GO:0001998) regulation of blood vessel size by renin-angiotensin(GO:0002034) renal control of peripheral vascular resistance involved in regulation of systemic arterial blood pressure(GO:0003072) |
| 0.5 |
2.1 |
GO:0032901 |
positive regulation of neurotrophin production(GO:0032901) |
| 0.5 |
2.1 |
GO:2000823 |
regulation of androgen receptor activity(GO:2000823) |
| 0.5 |
1.0 |
GO:0003404 |
optic vesicle morphogenesis(GO:0003404) |
| 0.5 |
0.5 |
GO:0061515 |
myeloid cell development(GO:0061515) |
| 0.5 |
2.0 |
GO:0032914 |
positive regulation of transforming growth factor beta1 production(GO:0032914) |
| 0.5 |
0.5 |
GO:0098908 |
regulation of neuronal action potential(GO:0098908) |
| 0.5 |
3.5 |
GO:0070458 |
detoxification of nitrogen compound(GO:0051410) cellular detoxification of nitrogen compound(GO:0070458) |
| 0.5 |
0.5 |
GO:0071374 |
cellular response to parathyroid hormone stimulus(GO:0071374) |
| 0.5 |
2.0 |
GO:0030576 |
Cajal body organization(GO:0030576) |
| 0.5 |
1.5 |
GO:0002309 |
T cell proliferation involved in immune response(GO:0002309) |
| 0.5 |
1.5 |
GO:0015938 |
coenzyme A catabolic process(GO:0015938) nucleoside bisphosphate catabolic process(GO:0033869) ribonucleoside bisphosphate catabolic process(GO:0034031) purine nucleoside bisphosphate catabolic process(GO:0034034) |
| 0.5 |
0.5 |
GO:0042744 |
hydrogen peroxide catabolic process(GO:0042744) |
| 0.5 |
0.9 |
GO:0031587 |
positive regulation of inositol 1,4,5-trisphosphate-sensitive calcium-release channel activity(GO:0031587) |
| 0.5 |
1.4 |
GO:1904879 |
positive regulation of calcium ion transmembrane transport via high voltage-gated calcium channel(GO:1904879) |
| 0.5 |
1.9 |
GO:0072061 |
inner medullary collecting duct development(GO:0072061) |
| 0.5 |
1.9 |
GO:1900145 |
regulation of nodal signaling pathway involved in determination of left/right asymmetry(GO:1900145) regulation of nodal signaling pathway involved in determination of lateral mesoderm left/right asymmetry(GO:1900175) positive regulation of nodal signaling pathway involved in determination of lateral mesoderm left/right asymmetry(GO:1900224) |
| 0.5 |
1.4 |
GO:0010248 |
B cell negative selection(GO:0002352) establishment or maintenance of transmembrane electrochemical gradient(GO:0010248) |
| 0.5 |
1.4 |
GO:0048611 |
ectodermal digestive tract development(GO:0007439) embryonic ectodermal digestive tract development(GO:0048611) |
| 0.5 |
2.3 |
GO:2000483 |
negative regulation of interleukin-8 secretion(GO:2000483) |
| 0.4 |
6.3 |
GO:0035269 |
protein O-linked mannosylation(GO:0035269) |
| 0.4 |
1.3 |
GO:0044778 |
meiotic DNA integrity checkpoint(GO:0044778) |
| 0.4 |
4.4 |
GO:0061158 |
3'-UTR-mediated mRNA destabilization(GO:0061158) |
| 0.4 |
1.8 |
GO:0030950 |
establishment or maintenance of actin cytoskeleton polarity(GO:0030950) |
| 0.4 |
0.4 |
GO:0006982 |
response to lipid hydroperoxide(GO:0006982) |
| 0.4 |
3.1 |
GO:0000320 |
re-entry into mitotic cell cycle(GO:0000320) |
| 0.4 |
1.3 |
GO:0060244 |
negative regulation of cell proliferation involved in contact inhibition(GO:0060244) |
| 0.4 |
1.7 |
GO:0042590 |
antigen processing and presentation of exogenous peptide antigen via MHC class I(GO:0042590) |
| 0.4 |
1.7 |
GO:0002924 |
negative regulation of humoral immune response mediated by circulating immunoglobulin(GO:0002924) |
| 0.4 |
0.8 |
GO:0042264 |
peptidyl-aspartic acid hydroxylation(GO:0042264) |
| 0.4 |
2.5 |
GO:0045218 |
zonula adherens maintenance(GO:0045218) |
| 0.4 |
0.4 |
GO:0033122 |
regulation of purine nucleotide catabolic process(GO:0033121) negative regulation of purine nucleotide catabolic process(GO:0033122) |
| 0.4 |
1.7 |
GO:1904565 |
response to 1-oleoyl-sn-glycerol 3-phosphate(GO:1904565) cellular response to 1-oleoyl-sn-glycerol 3-phosphate(GO:1904566) |
| 0.4 |
3.3 |
GO:0046645 |
positive regulation of gamma-delta T cell differentiation(GO:0045588) positive regulation of gamma-delta T cell activation(GO:0046645) |
| 0.4 |
1.2 |
GO:0010989 |
negative regulation of low-density lipoprotein particle clearance(GO:0010989) |
| 0.4 |
1.6 |
GO:0033580 |
protein glycosylation at cell surface(GO:0033575) protein galactosylation at cell surface(GO:0033580) protein galactosylation(GO:0042125) |
| 0.4 |
0.4 |
GO:0033091 |
positive regulation of immature T cell proliferation(GO:0033091) |
| 0.4 |
2.0 |
GO:0019230 |
proprioception(GO:0019230) |
| 0.4 |
1.2 |
GO:0090324 |
negative regulation of oxidative phosphorylation(GO:0090324) |
| 0.4 |
4.8 |
GO:0097067 |
cellular response to thyroid hormone stimulus(GO:0097067) |
| 0.4 |
0.8 |
GO:0060681 |
branch elongation involved in ureteric bud branching(GO:0060681) |
| 0.4 |
1.2 |
GO:0001869 |
regulation of complement activation, lectin pathway(GO:0001868) negative regulation of complement activation, lectin pathway(GO:0001869) |
| 0.4 |
10.1 |
GO:0030212 |
hyaluronan metabolic process(GO:0030212) |
| 0.4 |
0.4 |
GO:0042698 |
ovulation cycle(GO:0042698) |
| 0.4 |
1.9 |
GO:0010815 |
bradykinin catabolic process(GO:0010815) |
| 0.4 |
3.4 |
GO:0006071 |
glycerol metabolic process(GO:0006071) |
| 0.4 |
0.4 |
GO:0050819 |
negative regulation of coagulation(GO:0050819) |
| 0.4 |
1.1 |
GO:0019659 |
glucose catabolic process to lactate(GO:0019659) glycolytic fermentation(GO:0019660) glucose catabolic process to lactate via pyruvate(GO:0019661) |
| 0.4 |
3.0 |
GO:0060613 |
fat pad development(GO:0060613) |
| 0.4 |
2.2 |
GO:0002317 |
plasma cell differentiation(GO:0002317) |
| 0.4 |
1.1 |
GO:0032497 |
detection of lipopolysaccharide(GO:0032497) |
| 0.4 |
1.1 |
GO:0046104 |
thymidine metabolic process(GO:0046104) |
| 0.4 |
1.1 |
GO:0000087 |
mitotic M phase(GO:0000087) |
| 0.4 |
1.1 |
GO:1904274 |
tricellular tight junction assembly(GO:1904274) |
| 0.4 |
1.1 |
GO:0018199 |
peptidyl-glutamine modification(GO:0018199) |
| 0.4 |
4.8 |
GO:0043589 |
skin morphogenesis(GO:0043589) |
| 0.4 |
0.7 |
GO:1903795 |
regulation of inorganic anion transmembrane transport(GO:1903795) |
| 0.4 |
1.1 |
GO:0042822 |
vitamin B6 metabolic process(GO:0042816) pyridoxal phosphate metabolic process(GO:0042822) pyridoxal phosphate biosynthetic process(GO:0042823) |
| 0.4 |
2.2 |
GO:0097368 |
establishment of Sertoli cell barrier(GO:0097368) |
| 0.4 |
0.4 |
GO:0060528 |
secretory columnal luminar epithelial cell differentiation involved in prostate glandular acinus development(GO:0060528) |
| 0.4 |
1.1 |
GO:1905098 |
negative regulation of guanyl-nucleotide exchange factor activity(GO:1905098) |
| 0.4 |
1.4 |
GO:0015888 |
thiamine transport(GO:0015888) |
| 0.4 |
0.4 |
GO:0071726 |
response to diacyl bacterial lipopeptide(GO:0071724) cellular response to diacyl bacterial lipopeptide(GO:0071726) |
| 0.4 |
0.4 |
GO:0018916 |
nitrobenzene metabolic process(GO:0018916) |
| 0.4 |
1.1 |
GO:0007406 |
negative regulation of neuroblast proliferation(GO:0007406) |
| 0.4 |
3.9 |
GO:0015884 |
folic acid transport(GO:0015884) |
| 0.4 |
1.1 |
GO:0072338 |
creatinine metabolic process(GO:0046449) cellular lactam metabolic process(GO:0072338) |
| 0.4 |
1.8 |
GO:0072513 |
positive regulation of secondary heart field cardioblast proliferation(GO:0072513) |
| 0.3 |
1.0 |
GO:0006420 |
arginyl-tRNA aminoacylation(GO:0006420) |
| 0.3 |
1.0 |
GO:0009644 |
response to high light intensity(GO:0009644) |
| 0.3 |
1.4 |
GO:0050904 |
diapedesis(GO:0050904) |
| 0.3 |
0.7 |
GO:0002295 |
T-helper cell lineage commitment(GO:0002295) CD4-positive, alpha-beta T cell lineage commitment(GO:0043373) |
| 0.3 |
1.4 |
GO:0019287 |
isopentenyl diphosphate biosynthetic process(GO:0009240) isopentenyl diphosphate biosynthetic process, mevalonate pathway(GO:0019287) isopentenyl diphosphate metabolic process(GO:0046490) |
| 0.3 |
1.3 |
GO:0043654 |
recognition of apoptotic cell(GO:0043654) |
| 0.3 |
3.7 |
GO:2000653 |
regulation of genetic imprinting(GO:2000653) |
| 0.3 |
1.3 |
GO:0021764 |
amygdala development(GO:0021764) |
| 0.3 |
0.7 |
GO:0006059 |
hexitol metabolic process(GO:0006059) |
| 0.3 |
2.6 |
GO:0033089 |
positive regulation of T cell differentiation in thymus(GO:0033089) positive regulation of thymocyte aggregation(GO:2000400) |
| 0.3 |
3.9 |
GO:0032463 |
negative regulation of protein homooligomerization(GO:0032463) |
| 0.3 |
1.6 |
GO:1903012 |
positive regulation of bone development(GO:1903012) |
| 0.3 |
1.3 |
GO:0006842 |
tricarboxylic acid transport(GO:0006842) succinate transport(GO:0015744) citrate transport(GO:0015746) |
| 0.3 |
1.9 |
GO:1903755 |
regulation of SUMO transferase activity(GO:1903182) positive regulation of SUMO transferase activity(GO:1903755) |
| 0.3 |
1.9 |
GO:0014029 |
neural crest formation(GO:0014029) |
| 0.3 |
1.0 |
GO:2000224 |
testosterone biosynthetic process(GO:0061370) regulation of testosterone biosynthetic process(GO:2000224) |
| 0.3 |
6.7 |
GO:0035115 |
embryonic forelimb morphogenesis(GO:0035115) |
| 0.3 |
1.6 |
GO:0014816 |
skeletal muscle satellite cell differentiation(GO:0014816) |
| 0.3 |
2.2 |
GO:0042730 |
fibrinolysis(GO:0042730) |
| 0.3 |
0.9 |
GO:0070212 |
protein poly-ADP-ribosylation(GO:0070212) |
| 0.3 |
5.9 |
GO:0046597 |
negative regulation of viral entry into host cell(GO:0046597) |
| 0.3 |
2.1 |
GO:0033567 |
DNA replication, Okazaki fragment processing(GO:0033567) |
| 0.3 |
1.2 |
GO:0071692 |
protein localization to extracellular region(GO:0071692) maintenance of protein location in extracellular region(GO:0071694) |
| 0.3 |
0.6 |
GO:0008228 |
opsonization(GO:0008228) |
| 0.3 |
1.2 |
GO:1901252 |
regulation of intracellular transport of viral material(GO:1901252) |
| 0.3 |
0.6 |
GO:0044336 |
canonical Wnt signaling pathway involved in negative regulation of apoptotic process(GO:0044336) |
| 0.3 |
2.1 |
GO:0038028 |
insulin receptor signaling pathway via phosphatidylinositol 3-kinase(GO:0038028) |
| 0.3 |
1.5 |
GO:1902031 |
regulation of NADP metabolic process(GO:1902031) |
| 0.3 |
1.8 |
GO:0006287 |
base-excision repair, gap-filling(GO:0006287) |
| 0.3 |
0.3 |
GO:0003418 |
growth plate cartilage chondrocyte differentiation(GO:0003418) |
| 0.3 |
0.9 |
GO:0010668 |
ectodermal cell differentiation(GO:0010668) |
| 0.3 |
0.9 |
GO:0038203 |
TORC2 signaling(GO:0038203) |
| 0.3 |
10.0 |
GO:0045746 |
negative regulation of Notch signaling pathway(GO:0045746) |
| 0.3 |
1.8 |
GO:0001980 |
regulation of systemic arterial blood pressure by ischemic conditions(GO:0001980) |
| 0.3 |
0.9 |
GO:0097460 |
ferrous iron import(GO:0070627) ferrous iron import into cell(GO:0097460) |
| 0.3 |
1.2 |
GO:0050862 |
positive regulation of T cell receptor signaling pathway(GO:0050862) |
| 0.3 |
1.1 |
GO:0006590 |
thyroid hormone generation(GO:0006590) |
| 0.3 |
2.0 |
GO:0002693 |
positive regulation of cellular extravasation(GO:0002693) |
| 0.3 |
0.9 |
GO:0006931 |
substrate-dependent cell migration, cell attachment to substrate(GO:0006931) |
| 0.3 |
0.9 |
GO:0045819 |
positive regulation of glycogen catabolic process(GO:0045819) |
| 0.3 |
0.6 |
GO:0033632 |
regulation of cell-cell adhesion mediated by integrin(GO:0033632) |
| 0.3 |
0.6 |
GO:0035633 |
maintenance of blood-brain barrier(GO:0035633) |
| 0.3 |
1.1 |
GO:0002572 |
pro-T cell differentiation(GO:0002572) |
| 0.3 |
2.0 |
GO:0022417 |
protein maturation by protein folding(GO:0022417) |
| 0.3 |
1.4 |
GO:0050861 |
positive regulation of B cell receptor signaling pathway(GO:0050861) |
| 0.3 |
0.6 |
GO:0000715 |
nucleotide-excision repair, DNA damage recognition(GO:0000715) |
| 0.3 |
0.8 |
GO:0072356 |
chromosome passenger complex localization to kinetochore(GO:0072356) |
| 0.3 |
1.7 |
GO:0046596 |
regulation of viral entry into host cell(GO:0046596) |
| 0.3 |
2.2 |
GO:0042135 |
neurotransmitter catabolic process(GO:0042135) |
| 0.3 |
3.9 |
GO:0003417 |
growth plate cartilage development(GO:0003417) |
| 0.3 |
1.7 |
GO:0032929 |
negative regulation of superoxide anion generation(GO:0032929) |
| 0.3 |
1.4 |
GO:0032713 |
negative regulation of interleukin-4 production(GO:0032713) |
| 0.3 |
0.6 |
GO:0060437 |
lung growth(GO:0060437) |
| 0.3 |
1.7 |
GO:0001831 |
trophectodermal cellular morphogenesis(GO:0001831) |
| 0.3 |
0.8 |
GO:0071104 |
response to interleukin-9(GO:0071104) |
| 0.3 |
1.4 |
GO:0070166 |
enamel mineralization(GO:0070166) |
| 0.3 |
0.5 |
GO:2001027 |
negative regulation of endothelial cell chemotaxis(GO:2001027) |
| 0.3 |
0.8 |
GO:0006348 |
chromatin silencing at telomere(GO:0006348) |
| 0.3 |
0.8 |
GO:0006566 |
threonine metabolic process(GO:0006566) |
| 0.3 |
1.3 |
GO:1990928 |
response to amino acid starvation(GO:1990928) |
| 0.3 |
3.1 |
GO:0050765 |
negative regulation of phagocytosis(GO:0050765) |
| 0.3 |
1.6 |
GO:0070447 |
positive regulation of oligodendrocyte progenitor proliferation(GO:0070447) |
| 0.3 |
2.3 |
GO:0006012 |
galactose metabolic process(GO:0006012) |
| 0.3 |
0.5 |
GO:2000587 |
regulation of platelet-derived growth factor receptor-beta signaling pathway(GO:2000586) negative regulation of platelet-derived growth factor receptor-beta signaling pathway(GO:2000587) |
| 0.3 |
1.3 |
GO:0051045 |
negative regulation of membrane protein ectodomain proteolysis(GO:0051045) |
| 0.3 |
1.0 |
GO:2000668 |
dendritic cell apoptotic process(GO:0097048) regulation of dendritic cell apoptotic process(GO:2000668) |
| 0.3 |
1.5 |
GO:0031652 |
positive regulation of heat generation(GO:0031652) |
| 0.3 |
0.8 |
GO:0010898 |
positive regulation of triglyceride catabolic process(GO:0010898) |
| 0.3 |
1.0 |
GO:0033631 |
cell-cell adhesion mediated by integrin(GO:0033631) |
| 0.3 |
0.8 |
GO:0018149 |
peptide cross-linking(GO:0018149) |
| 0.3 |
2.0 |
GO:0046415 |
urate metabolic process(GO:0046415) |
| 0.2 |
0.7 |
GO:0031990 |
mRNA export from nucleus in response to heat stress(GO:0031990) |
| 0.2 |
1.2 |
GO:0010387 |
COP9 signalosome assembly(GO:0010387) |
| 0.2 |
0.5 |
GO:0003199 |
endocardial cushion to mesenchymal transition involved in heart valve formation(GO:0003199) endocardial cushion to mesenchymal transition(GO:0090500) |
| 0.2 |
0.2 |
GO:1990564 |
protein polyufmylation(GO:1990564) protein K69-linked ufmylation(GO:1990592) |
| 0.2 |
1.7 |
GO:0000103 |
sulfate assimilation(GO:0000103) |
| 0.2 |
2.4 |
GO:0045040 |
protein import into mitochondrial outer membrane(GO:0045040) |
| 0.2 |
1.4 |
GO:0032782 |
bile acid secretion(GO:0032782) |
| 0.2 |
0.9 |
GO:0071475 |
cellular hyperosmotic salinity response(GO:0071475) |
| 0.2 |
0.7 |
GO:0051798 |
positive regulation of hair follicle development(GO:0051798) |
| 0.2 |
2.6 |
GO:0031274 |
positive regulation of pseudopodium assembly(GO:0031274) |
| 0.2 |
0.9 |
GO:0042447 |
hormone catabolic process(GO:0042447) |
| 0.2 |
0.5 |
GO:0072697 |
protein localization to cell cortex(GO:0072697) |
| 0.2 |
0.7 |
GO:0006436 |
tryptophanyl-tRNA aminoacylation(GO:0006436) |
| 0.2 |
0.5 |
GO:0016188 |
synaptic vesicle maturation(GO:0016188) |
| 0.2 |
1.6 |
GO:0016480 |
negative regulation of transcription from RNA polymerase III promoter(GO:0016480) |
| 0.2 |
0.7 |
GO:0006001 |
fructose catabolic process(GO:0006001) fructose catabolic process to hydroxyacetone phosphate and glyceraldehyde-3-phosphate(GO:0061624) glycolytic process through fructose-1-phosphate(GO:0061625) |
| 0.2 |
0.2 |
GO:0000478 |
endonucleolytic cleavage involved in rRNA processing(GO:0000478) |
| 0.2 |
1.1 |
GO:0051490 |
negative regulation of filopodium assembly(GO:0051490) |
| 0.2 |
1.6 |
GO:0001887 |
selenium compound metabolic process(GO:0001887) |
| 0.2 |
1.6 |
GO:0060290 |
transdifferentiation(GO:0060290) |
| 0.2 |
1.3 |
GO:0071883 |
activation of MAPK activity by adrenergic receptor signaling pathway(GO:0071883) |
| 0.2 |
1.3 |
GO:0042178 |
xenobiotic catabolic process(GO:0042178) |
| 0.2 |
0.7 |
GO:0060598 |
dichotomous subdivision of terminal units involved in mammary gland duct morphogenesis(GO:0060598) |
| 0.2 |
0.4 |
GO:0006956 |
complement activation(GO:0006956) |
| 0.2 |
0.4 |
GO:0006549 |
isoleucine metabolic process(GO:0006549) |
| 0.2 |
1.5 |
GO:0006002 |
fructose 6-phosphate metabolic process(GO:0006002) |
| 0.2 |
2.0 |
GO:0003084 |
positive regulation of systemic arterial blood pressure(GO:0003084) |
| 0.2 |
0.6 |
GO:1902310 |
positive regulation of peptidyl-serine dephosphorylation(GO:1902310) |
| 0.2 |
0.9 |
GO:0071500 |
cellular response to nitrosative stress(GO:0071500) |
| 0.2 |
0.9 |
GO:0006529 |
asparagine biosynthetic process(GO:0006529) |
| 0.2 |
0.2 |
GO:1903963 |
arachidonic acid secretion(GO:0050482) arachidonate transport(GO:1903963) |
| 0.2 |
0.6 |
GO:0060315 |
negative regulation of ryanodine-sensitive calcium-release channel activity(GO:0060315) |
| 0.2 |
0.6 |
GO:0007223 |
Wnt signaling pathway, calcium modulating pathway(GO:0007223) |
| 0.2 |
1.9 |
GO:0048711 |
positive regulation of astrocyte differentiation(GO:0048711) |
| 0.2 |
0.6 |
GO:0036233 |
glycine import(GO:0036233) |
| 0.2 |
0.2 |
GO:0010748 |
negative regulation of plasma membrane long-chain fatty acid transport(GO:0010748) |
| 0.2 |
0.4 |
GO:0006265 |
DNA topological change(GO:0006265) |
| 0.2 |
0.2 |
GO:0050855 |
regulation of B cell receptor signaling pathway(GO:0050855) |
| 0.2 |
0.8 |
GO:0036518 |
chemorepulsion of dopaminergic neuron axon(GO:0036518) |
| 0.2 |
0.2 |
GO:0007008 |
outer mitochondrial membrane organization(GO:0007008) |
| 0.2 |
1.0 |
GO:0006957 |
complement activation, alternative pathway(GO:0006957) |
| 0.2 |
1.0 |
GO:0014050 |
negative regulation of glutamate secretion(GO:0014050) |
| 0.2 |
1.0 |
GO:0042167 |
heme catabolic process(GO:0042167) pigment catabolic process(GO:0046149) |
| 0.2 |
0.2 |
GO:0031860 |
telomeric 3' overhang formation(GO:0031860) |
| 0.2 |
6.3 |
GO:0002474 |
antigen processing and presentation of peptide antigen via MHC class I(GO:0002474) |
| 0.2 |
2.4 |
GO:0051156 |
glucose 6-phosphate metabolic process(GO:0051156) |
| 0.2 |
0.6 |
GO:1900158 |
regulation of bone mineralization involved in bone maturation(GO:1900157) negative regulation of bone mineralization involved in bone maturation(GO:1900158) |
| 0.2 |
0.2 |
GO:2000646 |
positive regulation of receptor catabolic process(GO:2000646) |
| 0.2 |
0.6 |
GO:1904395 |
synaptic growth at neuromuscular junction(GO:0051124) positive regulation of receptor clustering(GO:1903911) regulation of skeletal muscle acetylcholine-gated channel clustering(GO:1904393) positive regulation of skeletal muscle acetylcholine-gated channel clustering(GO:1904395) |
| 0.2 |
0.6 |
GO:0031120 |
snRNA pseudouridine synthesis(GO:0031120) |
| 0.2 |
0.4 |
GO:1902990 |
telomere maintenance via semi-conservative replication(GO:0032201) mitotic telomere maintenance via semi-conservative replication(GO:1902990) |
| 0.2 |
2.4 |
GO:0043101 |
purine-containing compound salvage(GO:0043101) |
| 0.2 |
0.4 |
GO:0034382 |
chylomicron remnant clearance(GO:0034382) triglyceride-rich lipoprotein particle clearance(GO:0071830) |
| 0.2 |
0.6 |
GO:0034476 |
U1 snRNA 3'-end processing(GO:0034473) U5 snRNA 3'-end processing(GO:0034476) |
| 0.2 |
4.4 |
GO:0010569 |
regulation of double-strand break repair via homologous recombination(GO:0010569) |
| 0.2 |
0.6 |
GO:0006597 |
spermine biosynthetic process(GO:0006597) |
| 0.2 |
0.4 |
GO:0035793 |
negative regulation of phosphatidylinositol biosynthetic process(GO:0010512) cell migration involved in metanephros development(GO:0035788) metanephric mesenchymal cell migration(GO:0035789) positive regulation of metanephric mesenchymal cell migration by platelet-derived growth factor receptor-beta signaling pathway(GO:0035793) regulation of metanephric mesenchymal cell migration by platelet-derived growth factor receptor-beta signaling pathway(GO:1900238) regulation of metanephric mesenchymal cell migration(GO:2000589) positive regulation of metanephric mesenchymal cell migration(GO:2000591) |
| 0.2 |
0.6 |
GO:0035262 |
gonad morphogenesis(GO:0035262) |
| 0.2 |
0.6 |
GO:1903334 |
positive regulation of protein folding(GO:1903334) |
| 0.2 |
0.6 |
GO:0002002 |
regulation of angiotensin levels in blood(GO:0002002) |
| 0.2 |
2.7 |
GO:0048387 |
negative regulation of retinoic acid receptor signaling pathway(GO:0048387) |
| 0.2 |
2.3 |
GO:0044458 |
motile cilium assembly(GO:0044458) |
| 0.2 |
1.1 |
GO:0002072 |
optic cup morphogenesis involved in camera-type eye development(GO:0002072) |
| 0.2 |
1.0 |
GO:0033314 |
mitotic DNA replication checkpoint(GO:0033314) |
| 0.2 |
0.2 |
GO:0045617 |
negative regulation of keratinocyte differentiation(GO:0045617) |
| 0.2 |
0.6 |
GO:0034162 |
toll-like receptor 9 signaling pathway(GO:0034162) |
| 0.2 |
0.7 |
GO:0008343 |
adult feeding behavior(GO:0008343) |
| 0.2 |
0.4 |
GO:0061687 |
detoxification of inorganic compound(GO:0061687) |
| 0.2 |
0.4 |
GO:0006271 |
DNA strand elongation involved in DNA replication(GO:0006271) |
| 0.2 |
1.6 |
GO:0061045 |
negative regulation of wound healing(GO:0061045) |
| 0.2 |
0.5 |
GO:0001830 |
trophectodermal cell fate commitment(GO:0001830) |
| 0.2 |
0.2 |
GO:0046098 |
guanine metabolic process(GO:0046098) |
| 0.2 |
0.5 |
GO:0060743 |
epithelial cell maturation involved in prostate gland development(GO:0060743) |
| 0.2 |
1.3 |
GO:0035814 |
negative regulation of renal sodium excretion(GO:0035814) |
| 0.2 |
0.9 |
GO:0051012 |
microtubule sliding(GO:0051012) |
| 0.2 |
1.8 |
GO:0036297 |
interstrand cross-link repair(GO:0036297) |
| 0.2 |
0.7 |
GO:0003360 |
brainstem development(GO:0003360) |
| 0.2 |
1.2 |
GO:0006013 |
mannose metabolic process(GO:0006013) |
| 0.2 |
1.1 |
GO:0002934 |
desmosome organization(GO:0002934) |
| 0.2 |
0.5 |
GO:0035106 |
operant conditioning(GO:0035106) |
| 0.2 |
0.7 |
GO:0071169 |
establishment of protein localization to chromatin(GO:0071169) |
| 0.2 |
2.6 |
GO:0007213 |
G-protein coupled acetylcholine receptor signaling pathway(GO:0007213) |
| 0.2 |
1.2 |
GO:0043983 |
histone H4-K12 acetylation(GO:0043983) |
| 0.2 |
0.2 |
GO:1990481 |
mRNA pseudouridine synthesis(GO:1990481) |
| 0.2 |
1.4 |
GO:0033353 |
S-adenosylmethionine cycle(GO:0033353) |
| 0.2 |
2.1 |
GO:0070633 |
transepithelial transport(GO:0070633) |
| 0.2 |
0.3 |
GO:0060744 |
thelarche(GO:0042695) mammary gland branching involved in thelarche(GO:0060744) |
| 0.2 |
0.3 |
GO:0006269 |
DNA replication, synthesis of RNA primer(GO:0006269) |
| 0.2 |
0.5 |
GO:1902396 |
protein localization to bicellular tight junction(GO:1902396) |
| 0.2 |
1.7 |
GO:0006000 |
fructose metabolic process(GO:0006000) |
| 0.2 |
0.3 |
GO:0048597 |
post-embryonic camera-type eye morphogenesis(GO:0048597) |
| 0.2 |
4.9 |
GO:0048821 |
erythrocyte development(GO:0048821) |
| 0.2 |
0.8 |
GO:2000781 |
positive regulation of double-strand break repair(GO:2000781) |
| 0.2 |
0.5 |
GO:2000402 |
negative regulation of lymphocyte migration(GO:2000402) |
| 0.2 |
1.0 |
GO:0090527 |
actin filament reorganization(GO:0090527) |
| 0.2 |
0.2 |
GO:1900109 |
regulation of histone H3-K9 dimethylation(GO:1900109) |
| 0.2 |
5.3 |
GO:0006270 |
DNA replication initiation(GO:0006270) |
| 0.2 |
2.8 |
GO:0006613 |
cotranslational protein targeting to membrane(GO:0006613) |
| 0.2 |
1.3 |
GO:0090037 |
positive regulation of protein kinase C signaling(GO:0090037) |
| 0.2 |
1.0 |
GO:0000056 |
ribosomal small subunit export from nucleus(GO:0000056) |
| 0.2 |
0.5 |
GO:0001767 |
establishment of lymphocyte polarity(GO:0001767) establishment of T cell polarity(GO:0001768) |
| 0.2 |
0.5 |
GO:0019676 |
ammonia assimilation cycle(GO:0019676) |
| 0.2 |
0.8 |
GO:0045198 |
establishment of epithelial cell apical/basal polarity(GO:0045198) |
| 0.2 |
0.8 |
GO:0051661 |
maintenance of centrosome location(GO:0051661) |
| 0.2 |
1.0 |
GO:0035459 |
cargo loading into vesicle(GO:0035459) |
| 0.2 |
2.9 |
GO:0006910 |
phagocytosis, recognition(GO:0006910) |
| 0.2 |
0.3 |
GO:2000157 |
regulation of protein K48-linked deubiquitination(GO:1903093) negative regulation of protein K48-linked deubiquitination(GO:1903094) negative regulation of ubiquitin-specific protease activity(GO:2000157) |
| 0.2 |
0.8 |
GO:0007253 |
cytoplasmic sequestering of NF-kappaB(GO:0007253) |
| 0.2 |
0.2 |
GO:2001212 |
regulation of vasculogenesis(GO:2001212) |
| 0.2 |
0.8 |
GO:0006958 |
complement activation, classical pathway(GO:0006958) |
| 0.2 |
0.8 |
GO:0044351 |
macropinocytosis(GO:0044351) |
| 0.2 |
0.5 |
GO:0060018 |
astrocyte fate commitment(GO:0060018) |
| 0.2 |
2.4 |
GO:0048642 |
negative regulation of skeletal muscle tissue development(GO:0048642) |
| 0.2 |
0.3 |
GO:0045410 |
positive regulation of interleukin-6 biosynthetic process(GO:0045410) |
| 0.2 |
2.6 |
GO:0046685 |
response to arsenic-containing substance(GO:0046685) |
| 0.2 |
0.3 |
GO:0046084 |
adenine metabolic process(GO:0046083) adenine biosynthetic process(GO:0046084) |
| 0.2 |
0.5 |
GO:0060672 |
epithelial cell differentiation involved in embryonic placenta development(GO:0060671) epithelial cell morphogenesis involved in placental branching(GO:0060672) |
| 0.2 |
1.4 |
GO:0030322 |
stabilization of membrane potential(GO:0030322) |
| 0.2 |
0.6 |
GO:0032049 |
cardiolipin biosynthetic process(GO:0032049) |
| 0.2 |
0.5 |
GO:0060923 |
muscle cell fate commitment(GO:0042693) cardiac muscle cell fate commitment(GO:0060923) |
| 0.2 |
1.8 |
GO:0000463 |
maturation of LSU-rRNA from tricistronic rRNA transcript (SSU-rRNA, 5.8S rRNA, LSU-rRNA)(GO:0000463) |
| 0.2 |
0.5 |
GO:0006682 |
galactosylceramide biosynthetic process(GO:0006682) galactolipid biosynthetic process(GO:0019375) |
| 0.2 |
0.8 |
GO:0006451 |
selenocysteine incorporation(GO:0001514) translational readthrough(GO:0006451) |
| 0.2 |
0.8 |
GO:0030952 |
establishment or maintenance of microtubule cytoskeleton polarity(GO:0030951) establishment or maintenance of cytoskeleton polarity(GO:0030952) |
| 0.2 |
0.3 |
GO:0035754 |
B cell chemotaxis(GO:0035754) |
| 0.2 |
2.0 |
GO:2000353 |
positive regulation of endothelial cell apoptotic process(GO:2000353) |
| 0.2 |
0.6 |
GO:1900017 |
positive regulation of cytokine production involved in inflammatory response(GO:1900017) |
| 0.2 |
0.8 |
GO:0045657 |
positive regulation of monocyte differentiation(GO:0045657) |
| 0.2 |
0.3 |
GO:0070236 |
negative regulation of activation-induced cell death of T cells(GO:0070236) |
| 0.2 |
1.2 |
GO:0006398 |
mRNA 3'-end processing by stem-loop binding and cleavage(GO:0006398) |
| 0.2 |
0.5 |
GO:2000569 |
T-helper 2 cell activation(GO:0035712) positive regulation of T-helper 17 type immune response(GO:2000318) regulation of T-helper 2 cell activation(GO:2000569) positive regulation of T-helper 2 cell activation(GO:2000570) |
| 0.1 |
1.2 |
GO:0045719 |
negative regulation of glycogen biosynthetic process(GO:0045719) negative regulation of glycogen metabolic process(GO:0070874) |
| 0.1 |
0.6 |
GO:0006624 |
vacuolar protein processing(GO:0006624) |
| 0.1 |
0.3 |
GO:1903546 |
protein localization to photoreceptor outer segment(GO:1903546) |
| 0.1 |
0.6 |
GO:0018202 |
peptidyl-diphthamide metabolic process(GO:0017182) peptidyl-diphthamide biosynthetic process from peptidyl-histidine(GO:0017183) peptidyl-histidine modification(GO:0018202) |
| 0.1 |
2.4 |
GO:0035873 |
lactate transport(GO:0015727) lactate transmembrane transport(GO:0035873) plasma membrane lactate transport(GO:0035879) |
| 0.1 |
2.7 |
GO:0006825 |
copper ion transport(GO:0006825) |
| 0.1 |
0.9 |
GO:0042256 |
mature ribosome assembly(GO:0042256) |
| 0.1 |
4.0 |
GO:0000027 |
ribosomal large subunit assembly(GO:0000027) |
| 0.1 |
0.1 |
GO:0015920 |
lipopolysaccharide transport(GO:0015920) |
| 0.1 |
1.3 |
GO:2001214 |
positive regulation of vasculogenesis(GO:2001214) |
| 0.1 |
0.7 |
GO:0034372 |
very-low-density lipoprotein particle remodeling(GO:0034372) |
| 0.1 |
2.5 |
GO:0033235 |
positive regulation of protein sumoylation(GO:0033235) |
| 0.1 |
1.3 |
GO:0043568 |
positive regulation of insulin-like growth factor receptor signaling pathway(GO:0043568) |
| 0.1 |
0.3 |
GO:0072344 |
rescue of stalled ribosome(GO:0072344) |
| 0.1 |
0.1 |
GO:0097286 |
iron ion import(GO:0097286) |
| 0.1 |
0.4 |
GO:0010890 |
positive regulation of sequestering of triglyceride(GO:0010890) |
| 0.1 |
0.1 |
GO:1904996 |
positive regulation of leukocyte adhesion to vascular endothelial cell(GO:1904996) |
| 0.1 |
1.0 |
GO:2000601 |
positive regulation of Arp2/3 complex-mediated actin nucleation(GO:2000601) |
| 0.1 |
0.6 |
GO:0071294 |
cellular response to zinc ion(GO:0071294) |
| 0.1 |
1.1 |
GO:0016446 |
somatic hypermutation of immunoglobulin genes(GO:0016446) |
| 0.1 |
0.8 |
GO:0044829 |
positive regulation by host of viral genome replication(GO:0044829) |
| 0.1 |
0.3 |
GO:0071787 |
endoplasmic reticulum tubular network assembly(GO:0071787) |
| 0.1 |
0.4 |
GO:2000744 |
anterior head development(GO:0097065) regulation of anterior head development(GO:2000742) positive regulation of anterior head development(GO:2000744) |
| 0.1 |
0.1 |
GO:0045176 |
apical protein localization(GO:0045176) |
| 0.1 |
0.8 |
GO:0000447 |
endonucleolytic cleavage in ITS1 to separate SSU-rRNA from 5.8S rRNA and LSU-rRNA from tricistronic rRNA transcript (SSU-rRNA, 5.8S rRNA, LSU-rRNA)(GO:0000447) |
| 0.1 |
0.6 |
GO:0070345 |
negative regulation of fat cell proliferation(GO:0070345) |
| 0.1 |
0.3 |
GO:1903519 |
negative regulation of interleukin-1 beta secretion(GO:0050713) apoptotic process involved in mammary gland involution(GO:0060057) positive regulation of apoptotic process involved in mammary gland involution(GO:0060058) positive regulation of apoptotic process involved in morphogenesis(GO:1902339) regulation of mammary gland involution(GO:1903519) positive regulation of mammary gland involution(GO:1903521) positive regulation of apoptotic process involved in development(GO:1904747) |
| 0.1 |
0.4 |
GO:0014835 |
myoblast differentiation involved in skeletal muscle regeneration(GO:0014835) |
| 0.1 |
0.9 |
GO:0042517 |
positive regulation of tyrosine phosphorylation of Stat3 protein(GO:0042517) |
| 0.1 |
0.9 |
GO:0061032 |
visceral serous pericardium development(GO:0061032) |
| 0.1 |
0.4 |
GO:0046668 |
retinal cell programmed cell death(GO:0046666) regulation of retinal cell programmed cell death(GO:0046668) |
| 0.1 |
2.0 |
GO:0019835 |
cytolysis(GO:0019835) |
| 0.1 |
7.8 |
GO:0042274 |
ribosomal small subunit biogenesis(GO:0042274) |
| 0.1 |
0.7 |
GO:0060024 |
rhythmic synaptic transmission(GO:0060024) |
| 0.1 |
0.8 |
GO:0001706 |
endoderm formation(GO:0001706) |
| 0.1 |
0.4 |
GO:0048698 |
regulation of collateral sprouting in absence of injury(GO:0048696) negative regulation of collateral sprouting in absence of injury(GO:0048698) |
| 0.1 |
0.3 |
GO:0009142 |
nucleoside triphosphate biosynthetic process(GO:0009142) |
| 0.1 |
0.3 |
GO:0010543 |
regulation of platelet activation(GO:0010543) |
| 0.1 |
1.2 |
GO:0015868 |
purine ribonucleotide transport(GO:0015868) |
| 0.1 |
0.1 |
GO:0042487 |
regulation of odontogenesis of dentin-containing tooth(GO:0042487) |
| 0.1 |
0.5 |
GO:0006432 |
phenylalanyl-tRNA aminoacylation(GO:0006432) |
| 0.1 |
0.6 |
GO:0001553 |
luteinization(GO:0001553) |
| 0.1 |
0.3 |
GO:0048296 |
isotype switching to IgA isotypes(GO:0048290) regulation of isotype switching to IgA isotypes(GO:0048296) |
| 0.1 |
0.4 |
GO:2000675 |
negative regulation of type B pancreatic cell apoptotic process(GO:2000675) |
| 0.1 |
5.5 |
GO:0048844 |
artery morphogenesis(GO:0048844) |
| 0.1 |
0.5 |
GO:0038128 |
ERBB2 signaling pathway(GO:0038128) |
| 0.1 |
1.6 |
GO:0006298 |
mismatch repair(GO:0006298) |
| 0.1 |
0.7 |
GO:0042832 |
defense response to protozoan(GO:0042832) |
| 0.1 |
0.1 |
GO:0072044 |
collecting duct development(GO:0072044) |
| 0.1 |
0.4 |
GO:1903912 |
regulation of translation in response to endoplasmic reticulum stress(GO:0036490) regulation of translation initiation in response to endoplasmic reticulum stress(GO:0036491) eiF2alpha phosphorylation in response to endoplasmic reticulum stress(GO:0036492) negative regulation of endoplasmic reticulum stress-induced eIF2 alpha phosphorylation(GO:1903912) |
| 0.1 |
0.2 |
GO:0021506 |
anterior neuropore closure(GO:0021506) neuropore closure(GO:0021995) |
| 0.1 |
1.3 |
GO:0000244 |
spliceosomal tri-snRNP complex assembly(GO:0000244) |
| 0.1 |
1.6 |
GO:0051988 |
regulation of attachment of spindle microtubules to kinetochore(GO:0051988) |
| 0.1 |
0.2 |
GO:0099612 |
protein localization to axon(GO:0099612) |
| 0.1 |
1.0 |
GO:2000858 |
mineralocorticoid secretion(GO:0035931) aldosterone secretion(GO:0035932) regulation of mineralocorticoid secretion(GO:2000855) positive regulation of mineralocorticoid secretion(GO:2000857) regulation of aldosterone secretion(GO:2000858) positive regulation of aldosterone secretion(GO:2000860) |
| 0.1 |
0.8 |
GO:0031145 |
anaphase-promoting complex-dependent catabolic process(GO:0031145) |
| 0.1 |
1.2 |
GO:0010388 |
cullin deneddylation(GO:0010388) |
| 0.1 |
0.2 |
GO:0006041 |
glucosamine metabolic process(GO:0006041) |
| 0.1 |
0.4 |
GO:0002184 |
cytoplasmic translational termination(GO:0002184) |
| 0.1 |
0.4 |
GO:0018242 |
protein O-linked glycosylation via serine(GO:0018242) |
| 0.1 |
0.2 |
GO:2001185 |
regulation of CD8-positive, alpha-beta T cell activation(GO:2001185) |
| 0.1 |
0.7 |
GO:0010992 |
ubiquitin homeostasis(GO:0010992) |
| 0.1 |
0.1 |
GO:0071034 |
CUT catabolic process(GO:0071034) CUT metabolic process(GO:0071043) |
| 0.1 |
0.8 |
GO:0061299 |
retina vasculature morphogenesis in camera-type eye(GO:0061299) |
| 0.1 |
1.2 |
GO:0042347 |
negative regulation of NF-kappaB import into nucleus(GO:0042347) |
| 0.1 |
1.5 |
GO:0051044 |
positive regulation of membrane protein ectodomain proteolysis(GO:0051044) |
| 0.1 |
0.6 |
GO:2000780 |
negative regulation of double-strand break repair(GO:2000780) |
| 0.1 |
2.1 |
GO:0046931 |
pore complex assembly(GO:0046931) |
| 0.1 |
1.7 |
GO:0001779 |
natural killer cell differentiation(GO:0001779) |
| 0.1 |
0.3 |
GO:0016078 |
tRNA catabolic process(GO:0016078) |
| 0.1 |
1.8 |
GO:0021854 |
hypothalamus development(GO:0021854) |
| 0.1 |
0.7 |
GO:0060539 |
diaphragm development(GO:0060539) |
| 0.1 |
0.5 |
GO:0045039 |
protein import into mitochondrial inner membrane(GO:0045039) |
| 0.1 |
1.5 |
GO:0010954 |
positive regulation of protein processing(GO:0010954) positive regulation of protein maturation(GO:1903319) |
| 0.1 |
0.2 |
GO:2000501 |
natural killer cell chemotaxis(GO:0035747) regulation of natural killer cell chemotaxis(GO:2000501) |
| 0.1 |
0.6 |
GO:0019370 |
leukotriene biosynthetic process(GO:0019370) |
| 0.1 |
0.3 |
GO:0006428 |
isoleucyl-tRNA aminoacylation(GO:0006428) |
| 0.1 |
0.3 |
GO:0021940 |
positive regulation of cerebellar granule cell precursor proliferation(GO:0021940) |
| 0.1 |
0.6 |
GO:0016266 |
O-glycan processing(GO:0016266) |
| 0.1 |
0.6 |
GO:0001842 |
neural fold formation(GO:0001842) |
| 0.1 |
0.4 |
GO:0031536 |
positive regulation of exit from mitosis(GO:0031536) |
| 0.1 |
1.9 |
GO:0022027 |
interkinetic nuclear migration(GO:0022027) |
| 0.1 |
0.4 |
GO:0044243 |
multicellular organism catabolic process(GO:0044243) |
| 0.1 |
0.5 |
GO:0006072 |
glycerol-3-phosphate metabolic process(GO:0006072) |
| 0.1 |
1.2 |
GO:0006120 |
mitochondrial electron transport, NADH to ubiquinone(GO:0006120) |
| 0.1 |
0.7 |
GO:1904707 |
positive regulation of vascular smooth muscle cell proliferation(GO:1904707) |
| 0.1 |
1.0 |
GO:0044872 |
lipoprotein transport(GO:0042953) lipoprotein localization(GO:0044872) |
| 0.1 |
0.4 |
GO:0010624 |
regulation of Schwann cell proliferation(GO:0010624) Schwann cell proliferation(GO:0014010) |
| 0.1 |
3.0 |
GO:0046827 |
positive regulation of protein export from nucleus(GO:0046827) |
| 0.1 |
0.8 |
GO:0002862 |
negative regulation of inflammatory response to antigenic stimulus(GO:0002862) |
| 0.1 |
1.0 |
GO:0006104 |
succinyl-CoA metabolic process(GO:0006104) |
| 0.1 |
0.2 |
GO:0045041 |
protein import into mitochondrial intermembrane space(GO:0045041) |
| 0.1 |
0.2 |
GO:0031086 |
nuclear-transcribed mRNA catabolic process, deadenylation-independent decay(GO:0031086) deadenylation-independent decapping of nuclear-transcribed mRNA(GO:0031087) |
| 0.1 |
0.3 |
GO:0030210 |
heparin biosynthetic process(GO:0030210) |
| 0.1 |
0.4 |
GO:0002523 |
leukocyte migration involved in inflammatory response(GO:0002523) |
| 0.1 |
1.3 |
GO:0002063 |
chondrocyte development(GO:0002063) |
| 0.1 |
0.8 |
GO:0015074 |
DNA integration(GO:0015074) |
| 0.1 |
0.5 |
GO:0075525 |
viral translational termination-reinitiation(GO:0075525) |
| 0.1 |
0.3 |
GO:2000544 |
cell chemotaxis to fibroblast growth factor(GO:0035766) endothelial cell chemotaxis to fibroblast growth factor(GO:0035768) regulation of cell chemotaxis to fibroblast growth factor(GO:1904847) regulation of endothelial cell chemotaxis to fibroblast growth factor(GO:2000544) |
| 0.1 |
0.3 |
GO:0019441 |
tryptophan catabolic process(GO:0006569) tryptophan catabolic process to kynurenine(GO:0019441) indole-containing compound catabolic process(GO:0042436) indolalkylamine catabolic process(GO:0046218) kynurenine metabolic process(GO:0070189) |
| 0.1 |
0.8 |
GO:0006122 |
mitochondrial electron transport, ubiquinol to cytochrome c(GO:0006122) |
| 0.1 |
1.0 |
GO:0034312 |
diol biosynthetic process(GO:0034312) sphingosine biosynthetic process(GO:0046512) sphingoid biosynthetic process(GO:0046520) |
| 0.1 |
0.8 |
GO:0007095 |
mitotic G2 DNA damage checkpoint(GO:0007095) |
| 0.1 |
0.1 |
GO:0021523 |
somatic motor neuron differentiation(GO:0021523) |
| 0.1 |
0.8 |
GO:0048149 |
behavioral response to ethanol(GO:0048149) |
| 0.1 |
0.5 |
GO:0035188 |
blastocyst hatching(GO:0001835) hatching(GO:0035188) organism emergence from protective structure(GO:0071684) |
| 0.1 |
1.0 |
GO:0061179 |
negative regulation of insulin secretion involved in cellular response to glucose stimulus(GO:0061179) |
| 0.1 |
0.2 |
GO:0006528 |
asparagine metabolic process(GO:0006528) |
| 0.1 |
0.8 |
GO:1900262 |
regulation of DNA-directed DNA polymerase activity(GO:1900262) positive regulation of DNA-directed DNA polymerase activity(GO:1900264) |
| 0.1 |
0.8 |
GO:0031053 |
primary miRNA processing(GO:0031053) |
| 0.1 |
0.6 |
GO:0075522 |
IRES-dependent viral translational initiation(GO:0075522) |
| 0.1 |
0.4 |
GO:0090399 |
replicative senescence(GO:0090399) |
| 0.1 |
0.6 |
GO:1901029 |
negative regulation of mitochondrial outer membrane permeabilization involved in apoptotic signaling pathway(GO:1901029) |
| 0.1 |
0.4 |
GO:1902415 |
regulation of mRNA binding(GO:1902415) positive regulation of mRNA binding(GO:1902416) regulation of RNA binding(GO:1905214) positive regulation of RNA binding(GO:1905216) |
| 0.1 |
0.4 |
GO:0019276 |
UDP-N-acetylgalactosamine metabolic process(GO:0019276) |
| 0.1 |
0.2 |
GO:0002922 |
positive regulation of germinal center formation(GO:0002636) positive regulation of humoral immune response(GO:0002922) |
| 0.1 |
1.4 |
GO:0033622 |
integrin activation(GO:0033622) |
| 0.1 |
0.4 |
GO:0060155 |
platelet dense granule organization(GO:0060155) |
| 0.1 |
0.3 |
GO:0046381 |
CMP-N-acetylneuraminate metabolic process(GO:0046381) |
| 0.1 |
0.5 |
GO:0048934 |
peripheral nervous system neuron differentiation(GO:0048934) peripheral nervous system neuron development(GO:0048935) |
| 0.1 |
0.1 |
GO:0042228 |
interleukin-8 biosynthetic process(GO:0042228) |
| 0.1 |
1.5 |
GO:0006607 |
NLS-bearing protein import into nucleus(GO:0006607) |
| 0.1 |
0.6 |
GO:0070989 |
oxidative demethylation(GO:0070989) |
| 0.1 |
0.6 |
GO:2000672 |
negative regulation of motor neuron apoptotic process(GO:2000672) |
| 0.1 |
3.6 |
GO:0032233 |
positive regulation of actin filament bundle assembly(GO:0032233) |
| 0.1 |
0.5 |
GO:0070966 |
nuclear-transcribed mRNA catabolic process, no-go decay(GO:0070966) |
| 0.1 |
0.5 |
GO:0034080 |
CENP-A containing nucleosome assembly(GO:0034080) CENP-A containing chromatin organization(GO:0061641) |
| 0.1 |
0.7 |
GO:0006621 |
protein retention in ER lumen(GO:0006621) |
| 0.1 |
1.0 |
GO:0006610 |
ribosomal protein import into nucleus(GO:0006610) |
| 0.1 |
0.6 |
GO:0061732 |
mitochondrial acetyl-CoA biosynthetic process from pyruvate(GO:0061732) |
| 0.1 |
0.3 |
GO:0042745 |
circadian sleep/wake cycle(GO:0042745) |
| 0.1 |
2.2 |
GO:0051693 |
actin filament capping(GO:0051693) |
| 0.1 |
1.5 |
GO:0045943 |
positive regulation of transcription from RNA polymerase I promoter(GO:0045943) |
| 0.1 |
0.7 |
GO:0070206 |
protein trimerization(GO:0070206) |
| 0.1 |
0.5 |
GO:0090209 |
negative regulation of triglyceride metabolic process(GO:0090209) |
| 0.1 |
1.7 |
GO:0002089 |
lens morphogenesis in camera-type eye(GO:0002089) |
| 0.1 |
0.7 |
GO:0045947 |
negative regulation of translational initiation(GO:0045947) |
| 0.1 |
0.8 |
GO:0090435 |
protein localization to nuclear envelope(GO:0090435) |
| 0.1 |
0.7 |
GO:0043312 |
neutrophil degranulation(GO:0043312) |
| 0.1 |
0.3 |
GO:2000271 |
positive regulation of fibroblast apoptotic process(GO:2000271) |
| 0.1 |
0.2 |
GO:0046477 |
glycosylceramide catabolic process(GO:0046477) |
| 0.1 |
0.4 |
GO:0043490 |
malate-aspartate shuttle(GO:0043490) |
| 0.1 |
2.8 |
GO:0014068 |
positive regulation of phosphatidylinositol 3-kinase signaling(GO:0014068) |
| 0.1 |
1.3 |
GO:0009263 |
deoxyribonucleotide biosynthetic process(GO:0009263) |
| 0.1 |
0.5 |
GO:0033182 |
regulation of histone ubiquitination(GO:0033182) |
| 0.1 |
0.6 |
GO:0035845 |
photoreceptor cell outer segment organization(GO:0035845) |
| 0.1 |
0.3 |
GO:0000054 |
ribosomal subunit export from nucleus(GO:0000054) ribosome localization(GO:0033750) establishment of ribosome localization(GO:0033753) |
| 0.1 |
0.2 |
GO:0006578 |
amino-acid betaine biosynthetic process(GO:0006578) |
| 0.1 |
0.3 |
GO:0033145 |
positive regulation of intracellular steroid hormone receptor signaling pathway(GO:0033145) |
| 0.1 |
0.7 |
GO:0043923 |
positive regulation by host of viral transcription(GO:0043923) |
| 0.1 |
1.0 |
GO:0001913 |
T cell mediated cytotoxicity(GO:0001913) |
| 0.1 |
0.1 |
GO:0042270 |
protection from natural killer cell mediated cytotoxicity(GO:0042270) |
| 0.1 |
1.7 |
GO:0021511 |
spinal cord patterning(GO:0021511) |
| 0.1 |
2.5 |
GO:0051497 |
negative regulation of stress fiber assembly(GO:0051497) |
| 0.1 |
3.5 |
GO:0050830 |
defense response to Gram-positive bacterium(GO:0050830) |
| 0.1 |
0.2 |
GO:0090181 |
regulation of cholesterol metabolic process(GO:0090181) |
| 0.1 |
1.4 |
GO:0034198 |
cellular response to amino acid starvation(GO:0034198) |
| 0.1 |
0.3 |
GO:0018343 |
protein farnesylation(GO:0018343) |
| 0.1 |
0.3 |
GO:0048211 |
Golgi vesicle docking(GO:0048211) |
| 0.1 |
0.3 |
GO:0019695 |
choline metabolic process(GO:0019695) |
| 0.1 |
1.3 |
GO:0043248 |
proteasome assembly(GO:0043248) |
| 0.1 |
0.5 |
GO:0098532 |
histone H3-K27 trimethylation(GO:0098532) |
| 0.1 |
0.4 |
GO:0014886 |
transition between slow and fast fiber(GO:0014886) |
| 0.1 |
0.5 |
GO:0046909 |
intermembrane transport(GO:0046909) |
| 0.1 |
0.8 |
GO:0045793 |
positive regulation of cell size(GO:0045793) |
| 0.1 |
0.8 |
GO:0045663 |
positive regulation of myoblast differentiation(GO:0045663) |
| 0.1 |
0.9 |
GO:0007020 |
microtubule nucleation(GO:0007020) |
| 0.1 |
0.9 |
GO:0045899 |
positive regulation of RNA polymerase II transcriptional preinitiation complex assembly(GO:0045899) |
| 0.1 |
0.2 |
GO:0010944 |
negative regulation of transcription by competitive promoter binding(GO:0010944) |
| 0.1 |
1.3 |
GO:0000460 |
maturation of 5.8S rRNA(GO:0000460) |
| 0.1 |
0.7 |
GO:0051574 |
positive regulation of histone H3-K9 methylation(GO:0051574) |
| 0.1 |
1.0 |
GO:0016926 |
protein desumoylation(GO:0016926) |
| 0.1 |
0.3 |
GO:0006478 |
peptidyl-tyrosine sulfation(GO:0006478) |
| 0.1 |
2.2 |
GO:0032292 |
myelination in peripheral nervous system(GO:0022011) peripheral nervous system axon ensheathment(GO:0032292) |
| 0.1 |
0.3 |
GO:0071803 |
positive regulation of podosome assembly(GO:0071803) |
| 0.1 |
0.2 |
GO:0042511 |
positive regulation of tyrosine phosphorylation of Stat1 protein(GO:0042511) |
| 0.1 |
0.2 |
GO:0009595 |
detection of biotic stimulus(GO:0009595) detection of bacterium(GO:0016045) detection of other organism(GO:0098543) detection of external biotic stimulus(GO:0098581) |
| 0.1 |
0.4 |
GO:0051930 |
regulation of sensory perception of pain(GO:0051930) regulation of sensory perception(GO:0051931) |
| 0.1 |
0.2 |
GO:0046959 |
habituation(GO:0046959) |
| 0.1 |
0.7 |
GO:0006662 |
glycerol ether metabolic process(GO:0006662) ether metabolic process(GO:0018904) ether lipid metabolic process(GO:0046485) |
| 0.1 |
0.3 |
GO:0016139 |
glycoside catabolic process(GO:0016139) |
| 0.1 |
0.5 |
GO:0006452 |
translational frameshifting(GO:0006452) positive regulation of translational termination(GO:0045905) |
| 0.1 |
0.4 |
GO:0090502 |
RNA phosphodiester bond hydrolysis, endonucleolytic(GO:0090502) |
| 0.1 |
3.2 |
GO:0002181 |
cytoplasmic translation(GO:0002181) |
| 0.1 |
0.8 |
GO:0030238 |
male sex determination(GO:0030238) |
| 0.1 |
0.8 |
GO:0042733 |
embryonic digit morphogenesis(GO:0042733) |
| 0.1 |
2.0 |
GO:0045453 |
bone resorption(GO:0045453) |
| 0.1 |
1.3 |
GO:0001522 |
pseudouridine synthesis(GO:0001522) |
| 0.1 |
0.4 |
GO:0009235 |
cobalamin metabolic process(GO:0009235) |
| 0.1 |
0.1 |
GO:0060044 |
negative regulation of cardiac muscle cell proliferation(GO:0060044) |
| 0.1 |
0.5 |
GO:0071459 |
protein localization to kinetochore(GO:0034501) protein localization to chromosome, centromeric region(GO:0071459) |
| 0.1 |
0.3 |
GO:0019509 |
L-methionine biosynthetic process from methylthioadenosine(GO:0019509) |
| 0.1 |
0.1 |
GO:0033364 |
mast cell secretory granule organization(GO:0033364) |
| 0.1 |
0.9 |
GO:0051601 |
exocyst localization(GO:0051601) |
| 0.1 |
0.2 |
GO:0006787 |
porphyrin-containing compound catabolic process(GO:0006787) tetrapyrrole catabolic process(GO:0033015) |
| 0.1 |
0.6 |
GO:0046349 |
amino sugar biosynthetic process(GO:0046349) |
| 0.1 |
0.6 |
GO:0035092 |
sperm chromatin condensation(GO:0035092) |
| 0.1 |
0.7 |
GO:0007042 |
lysosomal lumen acidification(GO:0007042) |
| 0.1 |
0.3 |
GO:0033136 |
serine phosphorylation of STAT3 protein(GO:0033136) |
| 0.1 |
0.2 |
GO:0030422 |
production of siRNA involved in RNA interference(GO:0030422) |
| 0.1 |
0.4 |
GO:0007016 |
cytoskeletal anchoring at plasma membrane(GO:0007016) |
| 0.1 |
0.4 |
GO:0016925 |
protein sumoylation(GO:0016925) |
| 0.1 |
0.1 |
GO:0006533 |
aspartate catabolic process(GO:0006533) |
| 0.1 |
5.8 |
GO:0009636 |
response to toxic substance(GO:0009636) |
| 0.1 |
0.4 |
GO:0046459 |
short-chain fatty acid metabolic process(GO:0046459) |
| 0.1 |
0.9 |
GO:0008299 |
isoprenoid biosynthetic process(GO:0008299) |
| 0.1 |
0.3 |
GO:0097494 |
peptidyl-cysteine methylation(GO:0018125) regulation of vesicle size(GO:0097494) |
| 0.1 |
0.4 |
GO:0061484 |
hematopoietic stem cell homeostasis(GO:0061484) |
| 0.1 |
0.5 |
GO:0006729 |
tetrahydrobiopterin biosynthetic process(GO:0006729) tetrahydrobiopterin metabolic process(GO:0046146) |
| 0.1 |
0.1 |
GO:0051204 |
protein insertion into mitochondrial membrane(GO:0051204) |
| 0.1 |
0.1 |
GO:0019673 |
GDP-mannose metabolic process(GO:0019673) |
| 0.1 |
0.3 |
GO:1900364 |
regulation of mRNA polyadenylation(GO:1900363) negative regulation of mRNA polyadenylation(GO:1900364) |
| 0.1 |
1.2 |
GO:0001937 |
negative regulation of endothelial cell proliferation(GO:0001937) |
| 0.1 |
2.8 |
GO:0031122 |
cytoplasmic microtubule organization(GO:0031122) |
| 0.1 |
0.3 |
GO:0006177 |
GMP biosynthetic process(GO:0006177) |
| 0.1 |
0.5 |
GO:0030224 |
monocyte differentiation(GO:0030224) |
| 0.1 |
0.1 |
GO:0010988 |
regulation of low-density lipoprotein particle clearance(GO:0010988) |
| 0.1 |
0.2 |
GO:0021747 |
cochlear nucleus development(GO:0021747) |
| 0.1 |
0.4 |
GO:0070070 |
proton-transporting V-type ATPase complex assembly(GO:0070070) vacuolar proton-transporting V-type ATPase complex assembly(GO:0070072) |
| 0.1 |
1.5 |
GO:2000249 |
regulation of actin cytoskeleton reorganization(GO:2000249) |
| 0.1 |
0.3 |
GO:0061052 |
negative regulation of cell growth involved in cardiac muscle cell development(GO:0061052) |
| 0.1 |
0.2 |
GO:0015960 |
diadenosine polyphosphate biosynthetic process(GO:0015960) diadenosine tetraphosphate metabolic process(GO:0015965) diadenosine tetraphosphate biosynthetic process(GO:0015966) |
| 0.1 |
0.5 |
GO:0048680 |
positive regulation of axon regeneration(GO:0048680) positive regulation of neuron projection regeneration(GO:0070572) |
| 0.1 |
0.3 |
GO:0071361 |
cellular response to ethanol(GO:0071361) |
| 0.1 |
1.4 |
GO:0060323 |
head morphogenesis(GO:0060323) |
| 0.1 |
0.5 |
GO:0015862 |
uridine transport(GO:0015862) |
| 0.1 |
0.3 |
GO:0010759 |
positive regulation of macrophage chemotaxis(GO:0010759) |
| 0.1 |
0.6 |
GO:0034498 |
early endosome to Golgi transport(GO:0034498) |
| 0.1 |
0.3 |
GO:2000680 |
regulation of rubidium ion transport(GO:2000680) |
| 0.1 |
3.8 |
GO:0006413 |
translational initiation(GO:0006413) |
| 0.1 |
0.7 |
GO:0019368 |
fatty acid elongation, saturated fatty acid(GO:0019367) fatty acid elongation, unsaturated fatty acid(GO:0019368) fatty acid elongation, monounsaturated fatty acid(GO:0034625) fatty acid elongation, polyunsaturated fatty acid(GO:0034626) |
| 0.1 |
0.1 |
GO:1903887 |
motile primary cilium assembly(GO:1903887) |
| 0.1 |
0.2 |
GO:0071340 |
skeletal muscle acetylcholine-gated channel clustering(GO:0071340) |
| 0.1 |
0.2 |
GO:0070125 |
mitochondrial translational elongation(GO:0070125) |
| 0.1 |
0.2 |
GO:0031509 |
telomeric heterochromatin assembly(GO:0031509) negative regulation of chromosome condensation(GO:1902340) |
| 0.1 |
0.1 |
GO:0003273 |
cell migration involved in endocardial cushion formation(GO:0003273) |
| 0.1 |
0.2 |
GO:0090241 |
negative regulation of histone H4 acetylation(GO:0090241) |
| 0.1 |
0.3 |
GO:0045589 |
regulation of regulatory T cell differentiation(GO:0045589) |
| 0.1 |
0.1 |
GO:0010511 |
regulation of phosphatidylinositol biosynthetic process(GO:0010511) |
| 0.1 |
0.1 |
GO:0003062 |
regulation of heart rate by chemical signal(GO:0003062) |
| 0.1 |
0.8 |
GO:0050650 |
chondroitin sulfate proteoglycan biosynthetic process(GO:0050650) |
| 0.1 |
0.2 |
GO:0033762 |
response to glucagon(GO:0033762) |
| 0.1 |
0.9 |
GO:0097320 |
membrane tubulation(GO:0097320) |
| 0.1 |
0.8 |
GO:0008608 |
attachment of spindle microtubules to kinetochore(GO:0008608) |
| 0.1 |
0.6 |
GO:0051382 |
kinetochore assembly(GO:0051382) |
| 0.1 |
1.3 |
GO:0048025 |
negative regulation of mRNA splicing, via spliceosome(GO:0048025) |
| 0.1 |
0.1 |
GO:0060011 |
Sertoli cell proliferation(GO:0060011) |
| 0.1 |
0.4 |
GO:0005513 |
detection of calcium ion(GO:0005513) |
| 0.1 |
2.2 |
GO:2001238 |
positive regulation of extrinsic apoptotic signaling pathway(GO:2001238) |
| 0.1 |
0.7 |
GO:1900153 |
regulation of nuclear-transcribed mRNA catabolic process, deadenylation-dependent decay(GO:1900151) positive regulation of nuclear-transcribed mRNA catabolic process, deadenylation-dependent decay(GO:1900153) |
| 0.1 |
0.2 |
GO:1902224 |
cellular ketone body metabolic process(GO:0046950) ketone body metabolic process(GO:1902224) |
| 0.1 |
0.8 |
GO:0009083 |
branched-chain amino acid catabolic process(GO:0009083) |
| 0.1 |
0.2 |
GO:0043950 |
positive regulation of cAMP-mediated signaling(GO:0043950) |
| 0.1 |
0.2 |
GO:0002667 |
lymphocyte anergy(GO:0002249) regulation of T cell anergy(GO:0002667) T cell anergy(GO:0002870) regulation of lymphocyte anergy(GO:0002911) |
| 0.1 |
0.6 |
GO:0038166 |
angiotensin-activated signaling pathway(GO:0038166) |
| 0.1 |
0.6 |
GO:0018065 |
protein-cofactor linkage(GO:0018065) |
| 0.1 |
0.2 |
GO:0045987 |
positive regulation of smooth muscle contraction(GO:0045987) |
| 0.1 |
0.2 |
GO:0006207 |
'de novo' pyrimidine nucleobase biosynthetic process(GO:0006207) pyrimidine nucleobase biosynthetic process(GO:0019856) nucleobase biosynthetic process(GO:0046112) |
| 0.1 |
0.9 |
GO:0016180 |
snRNA processing(GO:0016180) |
| 0.1 |
0.2 |
GO:0000491 |
small nucleolar ribonucleoprotein complex assembly(GO:0000491) box C/D snoRNP assembly(GO:0000492) |
| 0.1 |
0.1 |
GO:0048563 |
post-embryonic organ morphogenesis(GO:0048563) |
| 0.1 |
0.2 |
GO:0021631 |
optic nerve morphogenesis(GO:0021631) |
| 0.1 |
1.0 |
GO:0000154 |
rRNA modification(GO:0000154) |
| 0.1 |
1.2 |
GO:0034063 |
stress granule assembly(GO:0034063) |
| 0.1 |
0.2 |
GO:2000623 |
regulation of nuclear-transcribed mRNA catabolic process, nonsense-mediated decay(GO:2000622) negative regulation of nuclear-transcribed mRNA catabolic process, nonsense-mediated decay(GO:2000623) |
| 0.1 |
0.5 |
GO:0034453 |
microtubule anchoring(GO:0034453) |
| 0.1 |
0.4 |
GO:0006953 |
acute-phase response(GO:0006953) |
| 0.1 |
0.3 |
GO:0031999 |
negative regulation of fatty acid beta-oxidation(GO:0031999) |
| 0.1 |
2.0 |
GO:0007229 |
integrin-mediated signaling pathway(GO:0007229) |
| 0.1 |
0.4 |
GO:0060712 |
spongiotrophoblast layer development(GO:0060712) |
| 0.1 |
0.9 |
GO:0015936 |
coenzyme A metabolic process(GO:0015936) |
| 0.1 |
0.6 |
GO:0010225 |
response to UV-C(GO:0010225) |
| 0.1 |
0.2 |
GO:1904936 |
cerebral cortex GABAergic interneuron migration(GO:0021853) interneuron migration(GO:1904936) |
| 0.0 |
0.2 |
GO:0060330 |
regulation of response to interferon-gamma(GO:0060330) |
| 0.0 |
0.4 |
GO:0032625 |
interleukin-21 production(GO:0032625) interleukin-21 secretion(GO:0072619) |
| 0.0 |
0.1 |
GO:0045879 |
negative regulation of smoothened signaling pathway(GO:0045879) |
| 0.0 |
0.2 |
GO:0019236 |
response to pheromone(GO:0019236) |
| 0.0 |
0.2 |
GO:0046294 |
formaldehyde catabolic process(GO:0046294) |
| 0.0 |
1.6 |
GO:0006418 |
tRNA aminoacylation for protein translation(GO:0006418) |
| 0.0 |
0.5 |
GO:0006509 |
membrane protein ectodomain proteolysis(GO:0006509) |
| 0.0 |
0.2 |
GO:1903025 |
regulation of RNA polymerase II regulatory region sequence-specific DNA binding(GO:1903025) |
| 0.0 |
1.2 |
GO:0000387 |
spliceosomal snRNP assembly(GO:0000387) |
| 0.0 |
0.7 |
GO:0010862 |
positive regulation of pathway-restricted SMAD protein phosphorylation(GO:0010862) |
| 0.0 |
1.4 |
GO:0034723 |
DNA replication-dependent nucleosome assembly(GO:0006335) DNA replication-dependent nucleosome organization(GO:0034723) |
| 0.0 |
0.2 |
GO:0006878 |
cellular copper ion homeostasis(GO:0006878) |
| 0.0 |
0.4 |
GO:0006490 |
oligosaccharide-lipid intermediate biosynthetic process(GO:0006490) |
| 0.0 |
2.3 |
GO:0006405 |
RNA export from nucleus(GO:0006405) |
| 0.0 |
0.7 |
GO:0050909 |
sensory perception of taste(GO:0050909) |
| 0.0 |
0.1 |
GO:0042196 |
dichloromethane metabolic process(GO:0018900) chlorinated hydrocarbon metabolic process(GO:0042196) halogenated hydrocarbon metabolic process(GO:0042197) |
| 0.0 |
0.3 |
GO:0043278 |
response to isoquinoline alkaloid(GO:0014072) response to morphine(GO:0043278) |
| 0.0 |
0.8 |
GO:0000578 |
embryonic axis specification(GO:0000578) |
| 0.0 |
0.4 |
GO:0032506 |
cytokinetic process(GO:0032506) |
| 0.0 |
0.5 |
GO:0030150 |
protein import into mitochondrial matrix(GO:0030150) |
| 0.0 |
0.2 |
GO:1903020 |
positive regulation of glycoprotein metabolic process(GO:1903020) |
| 0.0 |
1.0 |
GO:0042771 |
intrinsic apoptotic signaling pathway in response to DNA damage by p53 class mediator(GO:0042771) |
| 0.0 |
0.7 |
GO:1901522 |
positive regulation of transcription from RNA polymerase II promoter involved in cellular response to chemical stimulus(GO:1901522) |
| 0.0 |
0.4 |
GO:0032020 |
ISG15-protein conjugation(GO:0032020) |
| 0.0 |
0.2 |
GO:0071157 |
negative regulation of cell cycle arrest(GO:0071157) |
| 0.0 |
0.3 |
GO:0002755 |
MyD88-dependent toll-like receptor signaling pathway(GO:0002755) |
| 0.0 |
0.2 |
GO:0015786 |
UDP-glucose transport(GO:0015786) |
| 0.0 |
0.0 |
GO:0042663 |
regulation of endodermal cell fate specification(GO:0042663) |
| 0.0 |
0.1 |
GO:0036509 |
trimming of terminal mannose on B branch(GO:0036509) |
| 0.0 |
0.3 |
GO:0045047 |
protein targeting to ER(GO:0045047) |
| 0.0 |
0.5 |
GO:0006471 |
protein ADP-ribosylation(GO:0006471) |
| 0.0 |
0.2 |
GO:0006677 |
glycosylceramide metabolic process(GO:0006677) |
| 0.0 |
0.5 |
GO:0006801 |
superoxide metabolic process(GO:0006801) |
| 0.0 |
0.6 |
GO:0035886 |
vascular smooth muscle cell differentiation(GO:0035886) |
| 0.0 |
0.3 |
GO:0018026 |
peptidyl-lysine monomethylation(GO:0018026) |
| 0.0 |
0.1 |
GO:1903311 |
regulation of mRNA metabolic process(GO:1903311) |
| 0.0 |
0.0 |
GO:0042505 |
tyrosine phosphorylation of Stat6 protein(GO:0042505) regulation of tyrosine phosphorylation of Stat6 protein(GO:0042525) |
| 0.0 |
0.1 |
GO:0048496 |
maintenance of organ identity(GO:0048496) |
| 0.0 |
0.8 |
GO:0097006 |
regulation of plasma lipoprotein particle levels(GO:0097006) |
| 0.0 |
1.0 |
GO:0019915 |
lipid storage(GO:0019915) |
| 0.0 |
0.2 |
GO:0010922 |
positive regulation of phosphatase activity(GO:0010922) |
| 0.0 |
0.3 |
GO:0050858 |
negative regulation of antigen receptor-mediated signaling pathway(GO:0050858) |
| 0.0 |
0.4 |
GO:1904031 |
positive regulation of cyclin-dependent protein kinase activity(GO:1904031) |
| 0.0 |
0.2 |
GO:0044375 |
regulation of peroxisome size(GO:0044375) |
| 0.0 |
0.3 |
GO:0060662 |
tube lumen cavitation(GO:0060605) salivary gland cavitation(GO:0060662) |
| 0.0 |
0.6 |
GO:0048701 |
embryonic cranial skeleton morphogenesis(GO:0048701) |
| 0.0 |
0.5 |
GO:0003334 |
keratinocyte development(GO:0003334) |
| 0.0 |
0.1 |
GO:1903054 |
negative regulation of extracellular matrix organization(GO:1903054) |
| 0.0 |
0.3 |
GO:0033211 |
adiponectin-activated signaling pathway(GO:0033211) |
| 0.0 |
0.2 |
GO:0033299 |
secretion of lysosomal enzymes(GO:0033299) |
| 0.0 |
0.2 |
GO:0032515 |
negative regulation of phosphoprotein phosphatase activity(GO:0032515) |
| 0.0 |
0.1 |
GO:1901162 |
serotonin biosynthetic process(GO:0042427) primary amino compound biosynthetic process(GO:1901162) |
| 0.0 |
0.4 |
GO:0070498 |
interleukin-1-mediated signaling pathway(GO:0070498) |
| 0.0 |
0.5 |
GO:1902042 |
negative regulation of extrinsic apoptotic signaling pathway via death domain receptors(GO:1902042) |
| 0.0 |
0.3 |
GO:0033262 |
regulation of nuclear cell cycle DNA replication(GO:0033262) |
| 0.0 |
0.6 |
GO:0043968 |
histone H2A acetylation(GO:0043968) |
| 0.0 |
0.2 |
GO:0016255 |
attachment of GPI anchor to protein(GO:0016255) |
| 0.0 |
0.7 |
GO:0001658 |
branching involved in ureteric bud morphogenesis(GO:0001658) |
| 0.0 |
0.2 |
GO:1901409 |
regulation of phosphorylation of RNA polymerase II C-terminal domain(GO:1901407) positive regulation of phosphorylation of RNA polymerase II C-terminal domain(GO:1901409) |
| 0.0 |
0.0 |
GO:0006545 |
glycine biosynthetic process(GO:0006545) |
| 0.0 |
0.1 |
GO:0046469 |
platelet activating factor biosynthetic process(GO:0006663) platelet activating factor metabolic process(GO:0046469) |
| 0.0 |
0.2 |
GO:0018002 |
N-terminal peptidyl-serine acetylation(GO:0017198) N-terminal peptidyl-glutamic acid acetylation(GO:0018002) peptidyl-serine acetylation(GO:0030920) |
| 0.0 |
0.4 |
GO:0055059 |
asymmetric neuroblast division(GO:0055059) |
| 0.0 |
1.6 |
GO:0006635 |
fatty acid beta-oxidation(GO:0006635) |
| 0.0 |
1.0 |
GO:0045494 |
photoreceptor cell maintenance(GO:0045494) |
| 0.0 |
0.3 |
GO:0071763 |
nuclear membrane organization(GO:0071763) |
| 0.0 |
0.2 |
GO:0070995 |
NADPH oxidation(GO:0070995) |
| 0.0 |
0.1 |
GO:0043569 |
negative regulation of insulin-like growth factor receptor signaling pathway(GO:0043569) |
| 0.0 |
0.1 |
GO:0060340 |
positive regulation of type I interferon-mediated signaling pathway(GO:0060340) |
| 0.0 |
0.0 |
GO:1901491 |
negative regulation of lymphangiogenesis(GO:1901491) |
| 0.0 |
0.4 |
GO:0018206 |
peptidyl-methionine modification(GO:0018206) |
| 0.0 |
0.3 |
GO:0033119 |
negative regulation of RNA splicing(GO:0033119) |
| 0.0 |
0.5 |
GO:0045070 |
positive regulation of viral genome replication(GO:0045070) |
| 0.0 |
0.2 |
GO:0019532 |
oxalate transport(GO:0019532) |
| 0.0 |
0.8 |
GO:0051310 |
metaphase plate congression(GO:0051310) |
| 0.0 |
0.1 |
GO:0006116 |
NADH oxidation(GO:0006116) |
| 0.0 |
0.1 |
GO:0009227 |
UDP-N-acetylglucosamine catabolic process(GO:0006049) nucleotide-sugar catabolic process(GO:0009227) |
| 0.0 |
3.1 |
GO:0008033 |
tRNA processing(GO:0008033) |
| 0.0 |
0.6 |
GO:0006783 |
heme biosynthetic process(GO:0006783) |
| 0.0 |
0.1 |
GO:0070126 |
mitochondrial translational termination(GO:0070126) |
| 0.0 |
0.6 |
GO:0006099 |
tricarboxylic acid cycle(GO:0006099) |
| 0.0 |
0.0 |
GO:0060264 |
respiratory burst involved in inflammatory response(GO:0002536) regulation of respiratory burst involved in inflammatory response(GO:0060264) |
| 0.0 |
0.1 |
GO:0070589 |
cell wall mannoprotein biosynthetic process(GO:0000032) mannoprotein metabolic process(GO:0006056) mannoprotein biosynthetic process(GO:0006057) cell wall glycoprotein biosynthetic process(GO:0031506) cell wall biogenesis(GO:0042546) cell wall macromolecule metabolic process(GO:0044036) cell wall macromolecule biosynthetic process(GO:0044038) chain elongation of O-linked mannose residue(GO:0044845) cellular component macromolecule biosynthetic process(GO:0070589) cell wall organization or biogenesis(GO:0071554) |
| 0.0 |
1.4 |
GO:0006661 |
phosphatidylinositol biosynthetic process(GO:0006661) |
| 0.0 |
0.3 |
GO:0043162 |
ubiquitin-dependent protein catabolic process via the multivesicular body sorting pathway(GO:0043162) |
| 0.0 |
0.5 |
GO:0045722 |
positive regulation of gluconeogenesis(GO:0045722) |
| 0.0 |
0.1 |
GO:0072257 |
metanephric nephron tubule epithelial cell differentiation(GO:0072257) regulation of metanephric nephron tubule epithelial cell differentiation(GO:0072307) |
| 0.0 |
0.3 |
GO:0032467 |
positive regulation of cytokinesis(GO:0032467) |
| 0.0 |
0.3 |
GO:0045292 |
mRNA cis splicing, via spliceosome(GO:0045292) |
| 0.0 |
0.5 |
GO:0015985 |
energy coupled proton transport, down electrochemical gradient(GO:0015985) ATP synthesis coupled proton transport(GO:0015986) |
| 0.0 |
0.2 |
GO:0048385 |
regulation of retinoic acid receptor signaling pathway(GO:0048385) |
| 0.0 |
0.3 |
GO:0015825 |
L-serine transport(GO:0015825) |
| 0.0 |
0.4 |
GO:0045843 |
negative regulation of striated muscle tissue development(GO:0045843) |
| 0.0 |
0.4 |
GO:0016226 |
iron-sulfur cluster assembly(GO:0016226) metallo-sulfur cluster assembly(GO:0031163) |
| 0.0 |
0.4 |
GO:0042273 |
ribosomal large subunit biogenesis(GO:0042273) |
| 0.0 |
0.4 |
GO:0045333 |
cellular respiration(GO:0045333) |
| 0.0 |
0.3 |
GO:2001022 |
positive regulation of response to DNA damage stimulus(GO:2001022) |
| 0.0 |
0.3 |
GO:2000060 |
positive regulation of protein ubiquitination involved in ubiquitin-dependent protein catabolic process(GO:2000060) |
| 0.0 |
0.6 |
GO:1901343 |
negative regulation of vasculature development(GO:1901343) |
| 0.0 |
0.7 |
GO:0010501 |
RNA secondary structure unwinding(GO:0010501) |
| 0.0 |
0.2 |
GO:0048227 |
plasma membrane to endosome transport(GO:0048227) |
| 0.0 |
0.9 |
GO:1902653 |
cholesterol biosynthetic process(GO:0006695) secondary alcohol biosynthetic process(GO:1902653) |
| 0.0 |
0.9 |
GO:2000134 |
negative regulation of G1/S transition of mitotic cell cycle(GO:2000134) |
| 0.0 |
0.4 |
GO:0006851 |
mitochondrial calcium ion transport(GO:0006851) |
| 0.0 |
0.2 |
GO:0045945 |
positive regulation of transcription from RNA polymerase III promoter(GO:0045945) |
| 0.0 |
0.2 |
GO:0034244 |
negative regulation of DNA-templated transcription, elongation(GO:0032785) negative regulation of transcription elongation from RNA polymerase II promoter(GO:0034244) |
| 0.0 |
0.5 |
GO:0045739 |
positive regulation of DNA repair(GO:0045739) |
| 0.0 |
0.2 |
GO:1900745 |
positive regulation of p38MAPK cascade(GO:1900745) |
| 0.0 |
0.3 |
GO:0007190 |
activation of adenylate cyclase activity(GO:0007190) |
| 0.0 |
0.2 |
GO:0006693 |
prostanoid metabolic process(GO:0006692) prostaglandin metabolic process(GO:0006693) |
| 0.0 |
0.1 |
GO:0032486 |
Rap protein signal transduction(GO:0032486) |
| 0.0 |
0.1 |
GO:0000393 |
spliceosomal conformational changes to generate catalytic conformation(GO:0000393) |
| 0.0 |
0.1 |
GO:0002031 |
G-protein coupled receptor internalization(GO:0002031) |
| 0.0 |
1.0 |
GO:0006367 |
transcription initiation from RNA polymerase II promoter(GO:0006367) |
| 0.0 |
0.1 |
GO:0030579 |
ubiquitin-dependent SMAD protein catabolic process(GO:0030579) |
| 0.0 |
1.7 |
GO:0008654 |
phospholipid biosynthetic process(GO:0008654) |
| 0.0 |
0.5 |
GO:0035058 |
nonmotile primary cilium assembly(GO:0035058) |
| 0.0 |
0.9 |
GO:0043966 |
histone H3 acetylation(GO:0043966) |
| 0.0 |
0.4 |
GO:0035335 |
peptidyl-tyrosine dephosphorylation(GO:0035335) |
| 0.0 |
0.3 |
GO:0045862 |
positive regulation of proteolysis(GO:0045862) |
| 0.0 |
0.0 |
GO:0032513 |
negative regulation of protein phosphatase type 2B activity(GO:0032513) |
| 0.0 |
0.1 |
GO:0043117 |
positive regulation of vascular permeability(GO:0043117) |
| 0.0 |
0.0 |
GO:0002455 |
humoral immune response mediated by circulating immunoglobulin(GO:0002455) |
| 0.0 |
0.3 |
GO:0042149 |
cellular response to glucose starvation(GO:0042149) |
| 0.0 |
0.0 |
GO:0070317 |
negative regulation of G0 to G1 transition(GO:0070317) |
| 0.0 |
0.2 |
GO:0008053 |
mitochondrial fusion(GO:0008053) |
| 0.0 |
0.1 |
GO:0007130 |
synaptonemal complex assembly(GO:0007130) synaptonemal complex organization(GO:0070193) |
| 0.0 |
0.2 |
GO:0042921 |
glucocorticoid receptor signaling pathway(GO:0042921) |
| 0.0 |
0.8 |
GO:0032526 |
response to retinoic acid(GO:0032526) |
| 0.0 |
0.2 |
GO:0045471 |
response to ethanol(GO:0045471) |
| 0.0 |
0.1 |
GO:0070986 |
left/right axis specification(GO:0070986) |
| 0.0 |
0.0 |
GO:0006103 |
2-oxoglutarate metabolic process(GO:0006103) |
| 0.0 |
0.1 |
GO:0030575 |
nuclear body organization(GO:0030575) |
| 0.0 |
0.4 |
GO:0060395 |
SMAD protein signal transduction(GO:0060395) |
| 0.0 |
0.1 |
GO:1903504 |
regulation of mitotic cell cycle spindle assembly checkpoint(GO:0090266) regulation of mitotic spindle checkpoint(GO:1903504) |
| 0.0 |
0.0 |
GO:1903977 |
positive regulation of Schwann cell migration(GO:1900149) positive regulation of glial cell migration(GO:1903977) regulation of dopaminergic neuron differentiation(GO:1904338) |
| 0.0 |
0.8 |
GO:2001235 |
positive regulation of apoptotic signaling pathway(GO:2001235) |
| 0.0 |
0.1 |
GO:0007096 |
regulation of exit from mitosis(GO:0007096) |
| 0.0 |
0.2 |
GO:0048671 |
negative regulation of collateral sprouting(GO:0048671) |
| 0.0 |
0.2 |
GO:0001967 |
suckling behavior(GO:0001967) |
| 0.0 |
0.3 |
GO:0045116 |
protein neddylation(GO:0045116) |
| 0.0 |
0.1 |
GO:1901991 |
negative regulation of mitotic cell cycle phase transition(GO:1901991) |
| 0.0 |
0.2 |
GO:0033120 |
positive regulation of RNA splicing(GO:0033120) |
| 0.0 |
0.4 |
GO:0034314 |
Arp2/3 complex-mediated actin nucleation(GO:0034314) |
| 0.0 |
0.0 |
GO:1901727 |
positive regulation of histone deacetylase activity(GO:1901727) |
| 0.0 |
0.1 |
GO:0051451 |
myoblast migration(GO:0051451) |
| 0.0 |
0.2 |
GO:0048260 |
positive regulation of receptor-mediated endocytosis(GO:0048260) |
| 0.0 |
0.3 |
GO:0003382 |
epithelial cell morphogenesis(GO:0003382) |
| 0.0 |
0.1 |
GO:0001945 |
lymph vessel development(GO:0001945) |
| 0.0 |
0.3 |
GO:0046329 |
negative regulation of JNK cascade(GO:0046329) |
| 0.0 |
0.4 |
GO:0006352 |
DNA-templated transcription, initiation(GO:0006352) |
| 0.0 |
0.1 |
GO:0031468 |
nuclear envelope reassembly(GO:0031468) |
| 0.0 |
0.1 |
GO:0006767 |
water-soluble vitamin metabolic process(GO:0006767) |
| 0.0 |
0.2 |
GO:0032781 |
positive regulation of ATPase activity(GO:0032781) |
| 0.0 |
0.0 |
GO:0019919 |
peptidyl-arginine methylation, to asymmetrical-dimethyl arginine(GO:0019919) peptidyl-arginine N-methylation(GO:0035246) peptidyl-arginine omega-N-methylation(GO:0035247) |
| 0.0 |
0.9 |
GO:0051099 |
positive regulation of binding(GO:0051099) |
| 0.0 |
0.1 |
GO:0046599 |
regulation of centriole replication(GO:0046599) |
| 0.0 |
0.3 |
GO:0034260 |
negative regulation of GTPase activity(GO:0034260) |
| 0.0 |
0.1 |
GO:0034219 |
carbohydrate transmembrane transport(GO:0034219) |
| 0.0 |
0.0 |
GO:0042359 |
vitamin D metabolic process(GO:0042359) |
| 0.0 |
0.2 |
GO:0034497 |
protein localization to pre-autophagosomal structure(GO:0034497) |
| 0.0 |
0.1 |
GO:0035646 |
endosome to melanosome transport(GO:0035646) pigment accumulation(GO:0043476) cellular pigment accumulation(GO:0043482) endosome to pigment granule transport(GO:0043485) pigment granule maturation(GO:0048757) |
| 0.0 |
0.5 |
GO:0006749 |
glutathione metabolic process(GO:0006749) |
| 0.0 |
0.0 |
GO:0090155 |
negative regulation of sphingolipid biosynthetic process(GO:0090155) cellular sphingolipid homeostasis(GO:0090156) |
| 0.0 |
0.1 |
GO:0090220 |
meiotic telomere clustering(GO:0045141) chromosome localization to nuclear envelope involved in homologous chromosome segregation(GO:0090220) |
| 0.0 |
0.3 |
GO:0009060 |
aerobic respiration(GO:0009060) |
| 0.0 |
0.1 |
GO:0006368 |
transcription elongation from RNA polymerase II promoter(GO:0006368) |
| 0.0 |
0.1 |
GO:0000183 |
chromatin silencing at rDNA(GO:0000183) |
| 0.0 |
0.0 |
GO:0030327 |
prenylated protein catabolic process(GO:0030327) |
| 0.0 |
0.4 |
GO:0019882 |
antigen processing and presentation(GO:0019882) |
| 0.0 |
3.3 |
GO:0006412 |
translation(GO:0006412) |
| 0.0 |
0.1 |
GO:0042772 |
DNA damage response, signal transduction by p53 class mediator resulting in transcription of p21 class mediator(GO:0006978) DNA damage response, signal transduction resulting in transcription(GO:0042772) |
| 0.0 |
0.1 |
GO:0009649 |
entrainment of circadian clock(GO:0009649) |
| 0.0 |
0.1 |
GO:0046500 |
S-adenosylmethionine metabolic process(GO:0046500) |
| 0.0 |
0.1 |
GO:0043687 |
post-translational protein modification(GO:0043687) |

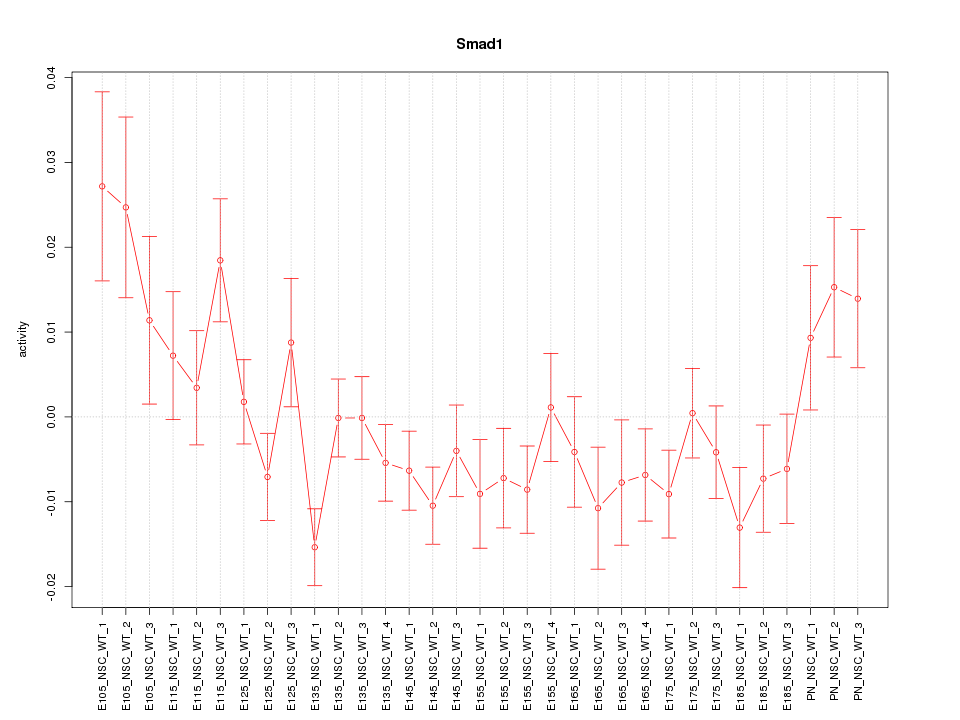
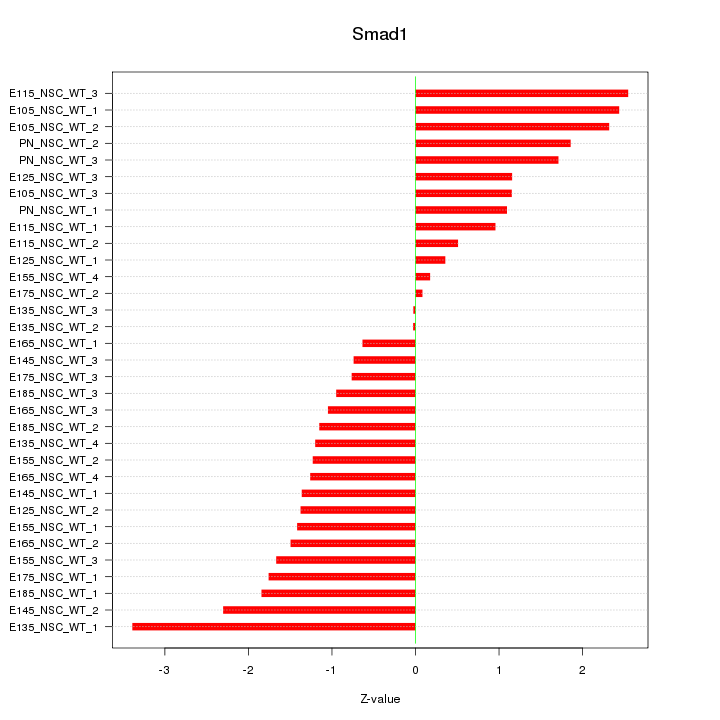

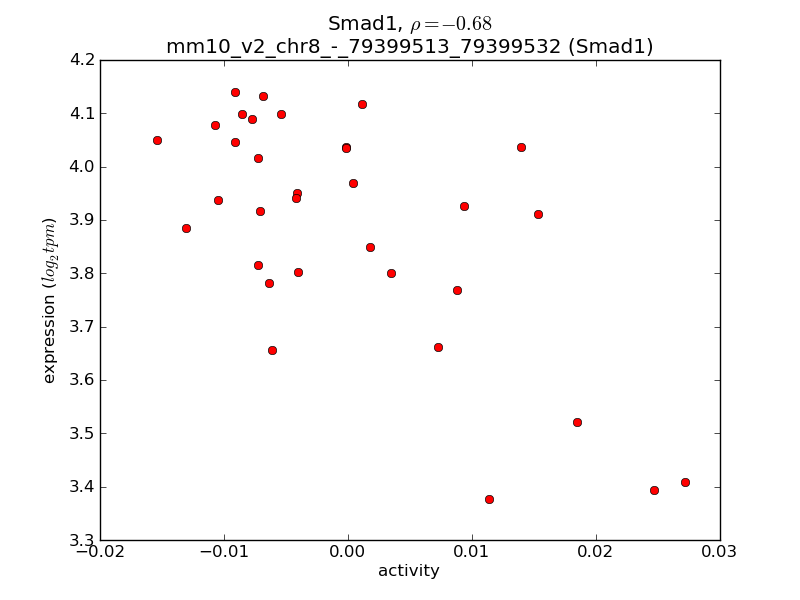
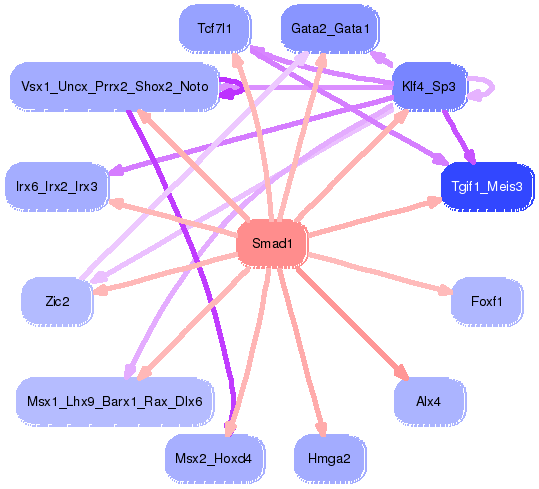