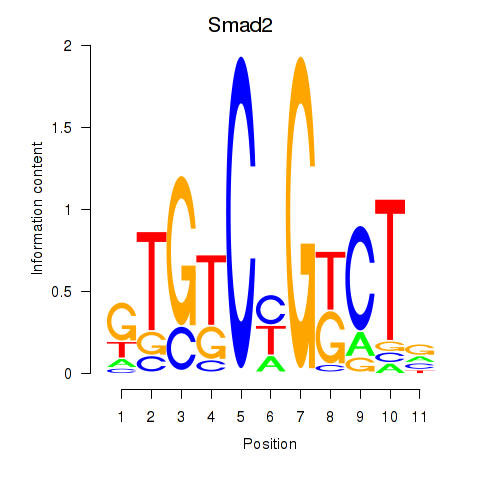
| 0.6 |
1.7 |
GO:0086017 |
response to inactivity(GO:0014854) response to muscle inactivity(GO:0014870) response to muscle inactivity involved in regulation of muscle adaptation(GO:0014877) response to denervation involved in regulation of muscle adaptation(GO:0014894) Purkinje myocyte action potential(GO:0086017) membrane depolarization during SA node cell action potential(GO:0086046) |
| 0.4 |
2.3 |
GO:0042866 |
pyruvate biosynthetic process(GO:0042866) |
| 0.4 |
2.2 |
GO:1904936 |
forebrain anterior/posterior pattern specification(GO:0021797) cerebral cortex GABAergic interneuron migration(GO:0021853) interneuron migration(GO:1904936) |
| 0.2 |
0.6 |
GO:0070844 |
misfolded protein transport(GO:0070843) polyubiquitinated protein transport(GO:0070844) polyubiquitinated misfolded protein transport(GO:0070845) Hsp90 deacetylation(GO:0070846) |
| 0.2 |
1.2 |
GO:0045218 |
zonula adherens maintenance(GO:0045218) |
| 0.2 |
0.6 |
GO:0072697 |
protein localization to cell cortex(GO:0072697) |
| 0.1 |
0.7 |
GO:1903012 |
positive regulation of bone development(GO:1903012) |
| 0.1 |
0.5 |
GO:2000546 |
positive regulation of cell chemotaxis to fibroblast growth factor(GO:1904849) positive regulation of endothelial cell chemotaxis to fibroblast growth factor(GO:2000546) |
| 0.1 |
0.6 |
GO:0015671 |
oxygen transport(GO:0015671) |
| 0.1 |
1.5 |
GO:0021796 |
cerebral cortex regionalization(GO:0021796) |
| 0.1 |
0.4 |
GO:0021764 |
amygdala development(GO:0021764) |
| 0.1 |
0.4 |
GO:0035360 |
positive regulation of peroxisome proliferator activated receptor signaling pathway(GO:0035360) |
| 0.1 |
0.4 |
GO:0006957 |
complement activation, alternative pathway(GO:0006957) |
| 0.1 |
0.6 |
GO:0034242 |
negative regulation of syncytium formation by plasma membrane fusion(GO:0034242) |
| 0.1 |
0.9 |
GO:0043248 |
proteasome assembly(GO:0043248) |
| 0.1 |
0.4 |
GO:0032020 |
ISG15-protein conjugation(GO:0032020) |
| 0.0 |
1.7 |
GO:0030513 |
positive regulation of BMP signaling pathway(GO:0030513) |
| 0.0 |
0.2 |
GO:0008295 |
spermidine biosynthetic process(GO:0008295) |
| 0.0 |
0.2 |
GO:0017183 |
peptidyl-diphthamide metabolic process(GO:0017182) peptidyl-diphthamide biosynthetic process from peptidyl-histidine(GO:0017183) |
| 0.0 |
0.2 |
GO:0051967 |
negative regulation of synaptic transmission, glutamatergic(GO:0051967) |
| 0.0 |
0.6 |
GO:0070979 |
protein K11-linked ubiquitination(GO:0070979) |
| 0.0 |
0.2 |
GO:0061302 |
smooth muscle cell-matrix adhesion(GO:0061302) |
| 0.0 |
0.5 |
GO:0034723 |
DNA replication-dependent nucleosome assembly(GO:0006335) DNA replication-dependent nucleosome organization(GO:0034723) |
| 0.0 |
0.1 |
GO:0048170 |
positive regulation of long-term neuronal synaptic plasticity(GO:0048170) |
| 0.0 |
0.4 |
GO:0007020 |
microtubule nucleation(GO:0007020) |
| 0.0 |
0.4 |
GO:0006270 |
DNA replication initiation(GO:0006270) |
| 0.0 |
1.6 |
GO:0009308 |
amine metabolic process(GO:0009308) |
| 0.0 |
0.1 |
GO:0045899 |
positive regulation of RNA polymerase II transcriptional preinitiation complex assembly(GO:0045899) |


