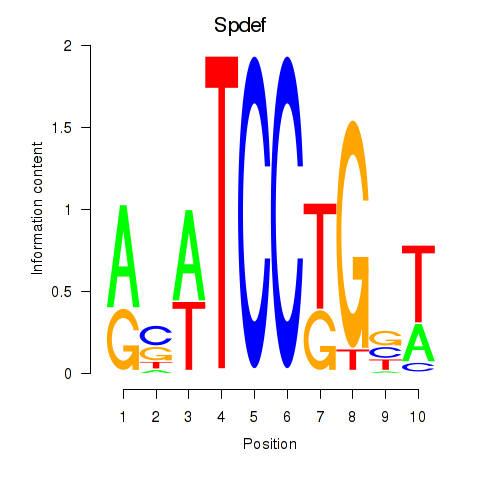
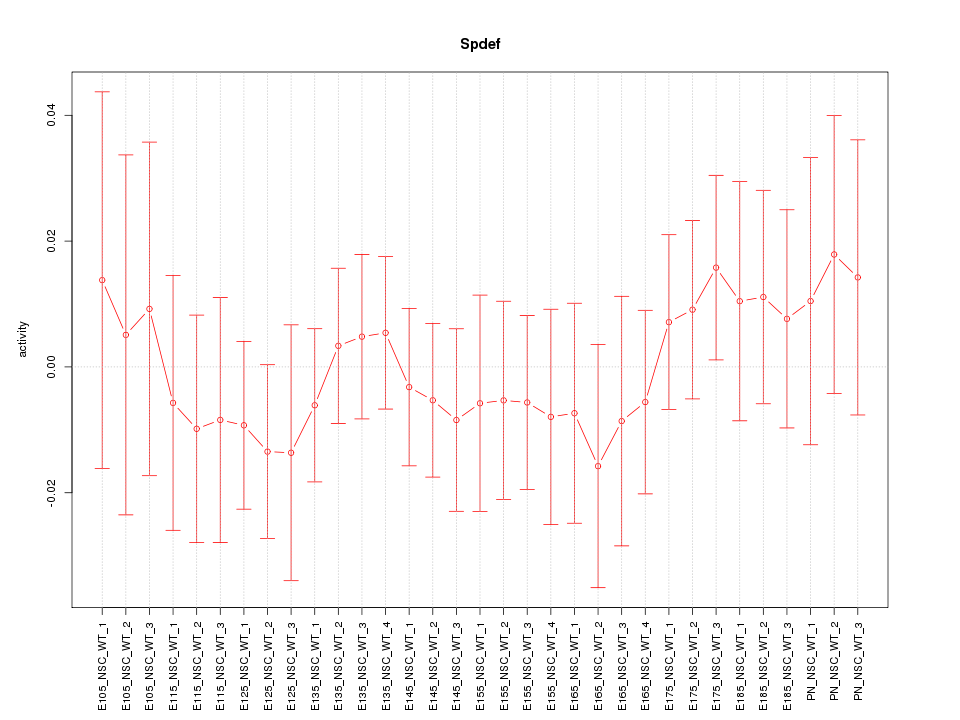
Motif ID: Spdef
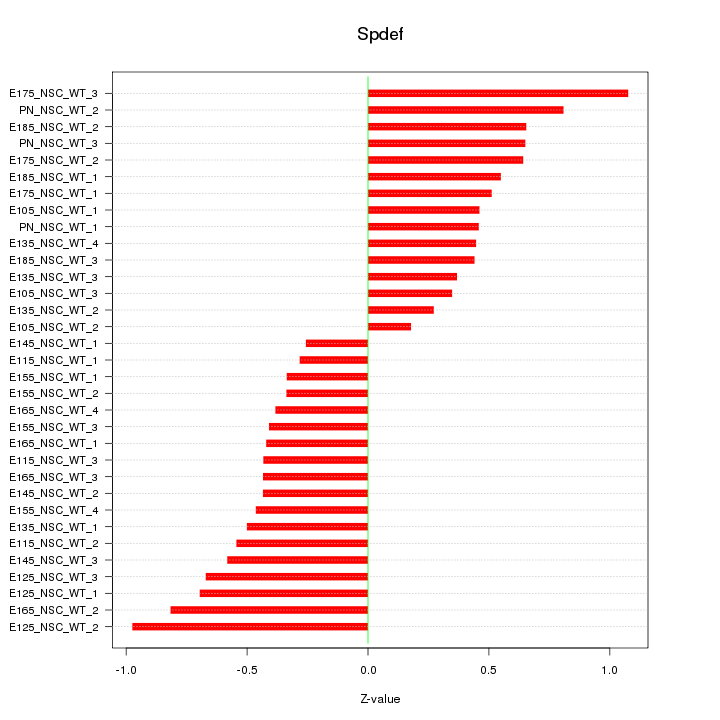
Z-value: 0.548
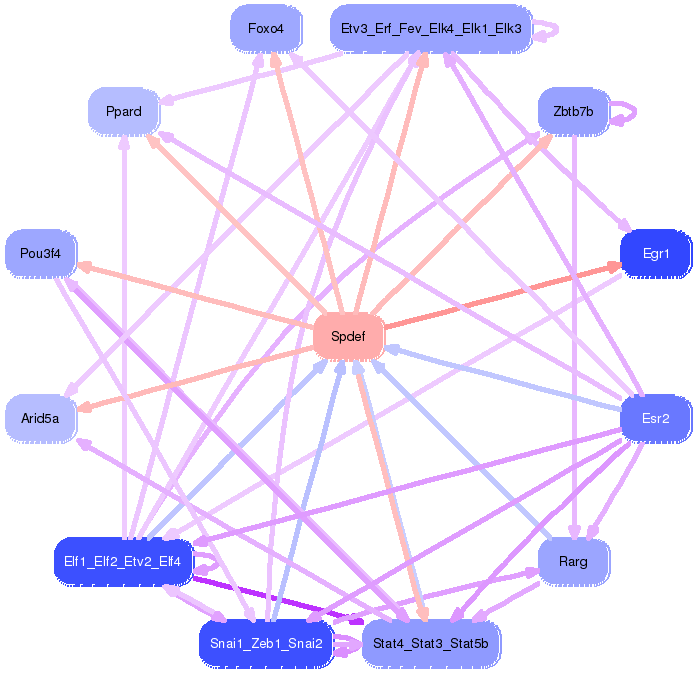
Transcription factors associated with Spdef:
| Gene Symbol | Entrez ID | Gene Name |
|---|---|---|
| Spdef | ENSMUSG00000024215.7 | Spdef |
Activity-expression correlation:
| Gene Symbol | Promoter | Pearson corr. coef. | P-value | Plot |
|---|---|---|---|---|
| Spdef | mm10_v2_chr17_-_27728889_27728956 | 0.02 | 9.0e-01 | Click! |

Top targets:
Gene overrepresentation in biological_process category:
| Log-likelihood per target | Total log-likelihood | Term | Description |
|---|---|---|---|
| 0.7 | 2.2 | GO:0072223 | metanephric glomerular mesangium development(GO:0072223) metanephric glomerular mesangial cell proliferation involved in metanephros development(GO:0072262) |
| 0.7 | 3.6 | GO:0051387 | negative regulation of neurotrophin TRK receptor signaling pathway(GO:0051387) |
| 0.5 | 1.5 | GO:0002765 | immune response-inhibiting signal transduction(GO:0002765) positive regulation of dendritic cell apoptotic process(GO:2000670) |
| 0.5 | 1.5 | GO:0035696 | monocyte extravasation(GO:0035696) regulation of monocyte extravasation(GO:2000437) |
| 0.4 | 1.1 | GO:0002447 | eosinophil activation involved in immune response(GO:0002278) eosinophil mediated immunity(GO:0002447) eosinophil degranulation(GO:0043308) regulation of eosinophil activation(GO:1902566) |
| 0.3 | 0.7 | GO:1900020 | regulation of protein kinase C activity(GO:1900019) positive regulation of protein kinase C activity(GO:1900020) |
| 0.3 | 0.9 | GO:0018214 | peptidyl-glutamic acid carboxylation(GO:0017187) protein carboxylation(GO:0018214) |
| 0.3 | 0.5 | GO:0070672 | response to interleukin-15(GO:0070672) |
| 0.2 | 0.7 | GO:0090187 | zymogen granule exocytosis(GO:0070625) positive regulation of pancreatic juice secretion(GO:0090187) |
| 0.2 | 1.6 | GO:0032534 | regulation of microvillus assembly(GO:0032534) |
| 0.2 | 1.8 | GO:0070574 | cadmium ion transport(GO:0015691) cadmium ion transmembrane transport(GO:0070574) |
| 0.2 | 1.5 | GO:0060662 | tube lumen cavitation(GO:0060605) salivary gland cavitation(GO:0060662) |
| 0.2 | 0.8 | GO:0060075 | regulation of resting membrane potential(GO:0060075) |
| 0.2 | 2.1 | GO:0071257 | cellular response to electrical stimulus(GO:0071257) |
| 0.2 | 0.5 | GO:2000170 | positive regulation of peptidyl-cysteine S-nitrosylation(GO:2000170) |
| 0.2 | 0.6 | GO:0019276 | UDP-N-acetylgalactosamine metabolic process(GO:0019276) |
| 0.1 | 0.7 | GO:0060398 | regulation of growth hormone receptor signaling pathway(GO:0060398) |
| 0.1 | 0.4 | GO:0051151 | negative regulation of smooth muscle cell differentiation(GO:0051151) |
| 0.1 | 0.4 | GO:0043988 | histone H3-S28 phosphorylation(GO:0043988) |
| 0.1 | 0.8 | GO:0006172 | ADP biosynthetic process(GO:0006172) |
| 0.1 | 0.4 | GO:0043323 | positive regulation of natural killer cell degranulation(GO:0043323) |
| 0.1 | 1.1 | GO:0035330 | regulation of hippo signaling(GO:0035330) |
| 0.1 | 0.7 | GO:0006046 | N-acetylglucosamine catabolic process(GO:0006046) |
| 0.1 | 0.3 | GO:0016256 | N-glycan processing to lysosome(GO:0016256) |
| 0.1 | 0.4 | GO:1901069 | guanosine-containing compound catabolic process(GO:1901069) |
| 0.1 | 0.6 | GO:0070166 | enamel mineralization(GO:0070166) |
| 0.1 | 1.0 | GO:0031584 | activation of phospholipase D activity(GO:0031584) |
| 0.1 | 1.1 | GO:0021684 | cerebellar granular layer formation(GO:0021684) cerebellar granule cell differentiation(GO:0021707) |
| 0.1 | 0.3 | GO:0036015 | response to interleukin-3(GO:0036015) cellular response to interleukin-3(GO:0036016) |
| 0.1 | 0.3 | GO:0006546 | glycine catabolic process(GO:0006546) glycine decarboxylation via glycine cleavage system(GO:0019464) |
| 0.1 | 0.7 | GO:2001185 | regulation of CD8-positive, alpha-beta T cell activation(GO:2001185) |
| 0.1 | 2.4 | GO:0006910 | phagocytosis, recognition(GO:0006910) |
| 0.1 | 0.7 | GO:0007016 | cytoskeletal anchoring at plasma membrane(GO:0007016) |
| 0.1 | 0.4 | GO:1903587 | regulation of blood vessel endothelial cell proliferation involved in sprouting angiogenesis(GO:1903587) |
| 0.1 | 0.4 | GO:0006776 | vitamin A metabolic process(GO:0006776) |
| 0.1 | 0.3 | GO:0043652 | engulfment of apoptotic cell(GO:0043652) |
| 0.1 | 0.4 | GO:0046864 | retinol transport(GO:0034633) isoprenoid transport(GO:0046864) terpenoid transport(GO:0046865) alveolar primary septum development(GO:0061143) |
| 0.1 | 0.5 | GO:0042985 | negative regulation of amyloid precursor protein biosynthetic process(GO:0042985) |
| 0.1 | 1.2 | GO:0006699 | bile acid biosynthetic process(GO:0006699) |
| 0.1 | 0.5 | GO:0032596 | protein transport into membrane raft(GO:0032596) dsRNA transport(GO:0033227) |
| 0.1 | 0.4 | GO:0000022 | mitotic spindle elongation(GO:0000022) mitotic spindle midzone assembly(GO:0051256) |
| 0.1 | 0.7 | GO:0006105 | succinate metabolic process(GO:0006105) |
| 0.1 | 0.9 | GO:0097152 | mesenchymal cell apoptotic process(GO:0097152) |
| 0.1 | 1.8 | GO:0045662 | negative regulation of myoblast differentiation(GO:0045662) |
| 0.1 | 0.2 | GO:0032058 | positive regulation of translational initiation in response to stress(GO:0032058) |
| 0.1 | 0.2 | GO:2000256 | positive regulation of male germ cell proliferation(GO:2000256) |
| 0.1 | 1.4 | GO:0034315 | regulation of Arp2/3 complex-mediated actin nucleation(GO:0034315) |
| 0.1 | 0.2 | GO:0035526 | retrograde transport, plasma membrane to Golgi(GO:0035526) |
| 0.1 | 0.5 | GO:0061042 | vascular wound healing(GO:0061042) |
| 0.1 | 0.8 | GO:0030238 | male sex determination(GO:0030238) |
| 0.1 | 0.3 | GO:2000623 | regulation of nuclear-transcribed mRNA catabolic process, nonsense-mediated decay(GO:2000622) negative regulation of nuclear-transcribed mRNA catabolic process, nonsense-mediated decay(GO:2000623) |
| 0.1 | 0.7 | GO:0018342 | protein prenylation(GO:0018342) prenylation(GO:0097354) |
| 0.1 | 0.1 | GO:2000646 | positive regulation of receptor catabolic process(GO:2000646) |
| 0.1 | 0.5 | GO:0006265 | DNA topological change(GO:0006265) |
| 0.1 | 0.2 | GO:0035752 | lysosomal lumen pH elevation(GO:0035752) |
| 0.1 | 0.9 | GO:0071801 | regulation of podosome assembly(GO:0071801) |
| 0.1 | 0.6 | GO:0036462 | TRAIL-activated apoptotic signaling pathway(GO:0036462) |
| 0.1 | 0.4 | GO:0031642 | negative regulation of myelination(GO:0031642) |
| 0.1 | 0.9 | GO:0006613 | cotranslational protein targeting to membrane(GO:0006613) |
| 0.1 | 0.2 | GO:0015712 | hexose phosphate transport(GO:0015712) glucose-6-phosphate transport(GO:0015760) |
| 0.0 | 0.2 | GO:0044314 | protein K27-linked ubiquitination(GO:0044314) |
| 0.0 | 0.3 | GO:2000042 | negative regulation of double-strand break repair via homologous recombination(GO:2000042) |
| 0.0 | 0.2 | GO:2000483 | negative regulation of interleukin-8 secretion(GO:2000483) |
| 0.0 | 0.5 | GO:0042473 | outer ear morphogenesis(GO:0042473) |
| 0.0 | 0.3 | GO:0043983 | histone H4-K12 acetylation(GO:0043983) |
| 0.0 | 0.5 | GO:0042711 | maternal behavior(GO:0042711) |
| 0.0 | 0.8 | GO:0097352 | autophagosome maturation(GO:0097352) |
| 0.0 | 0.4 | GO:0006691 | leukotriene metabolic process(GO:0006691) |
| 0.0 | 1.3 | GO:0001937 | negative regulation of endothelial cell proliferation(GO:0001937) |
| 0.0 | 0.1 | GO:0060244 | negative regulation of cell proliferation involved in contact inhibition(GO:0060244) |
| 0.0 | 0.1 | GO:2000501 | natural killer cell chemotaxis(GO:0035747) regulation of natural killer cell chemotaxis(GO:2000501) |
| 0.0 | 0.5 | GO:0032463 | negative regulation of protein homooligomerization(GO:0032463) |
| 0.0 | 1.8 | GO:0019915 | lipid storage(GO:0019915) |
| 0.0 | 0.9 | GO:0033539 | fatty acid beta-oxidation using acyl-CoA dehydrogenase(GO:0033539) |
| 0.0 | 0.2 | GO:2000253 | positive regulation of feeding behavior(GO:2000253) |
| 0.0 | 1.2 | GO:0031529 | ruffle organization(GO:0031529) |
| 0.0 | 0.1 | GO:0021506 | anterior neuropore closure(GO:0021506) neuropore closure(GO:0021995) |
| 0.0 | 0.3 | GO:0006490 | oligosaccharide-lipid intermediate biosynthetic process(GO:0006490) |
| 0.0 | 0.1 | GO:0071921 | establishment of sister chromatid cohesion(GO:0034085) cohesin loading(GO:0071921) regulation of cohesin loading(GO:0071922) |
| 0.0 | 0.8 | GO:0070306 | lens fiber cell differentiation(GO:0070306) |
| 0.0 | 0.9 | GO:0001921 | positive regulation of receptor recycling(GO:0001921) |
| 0.0 | 1.3 | GO:0051496 | positive regulation of stress fiber assembly(GO:0051496) |
| 0.0 | 0.1 | GO:1900060 | negative regulation of ceramide biosynthetic process(GO:1900060) |
| 0.0 | 0.1 | GO:0090611 | ubiquitin-independent protein catabolic process via the multivesicular body sorting pathway(GO:0090611) positive regulation of extracellular exosome assembly(GO:1903553) |
| 0.0 | 0.3 | GO:0060693 | regulation of branching involved in salivary gland morphogenesis(GO:0060693) |
| 0.0 | 0.3 | GO:0010748 | negative regulation of plasma membrane long-chain fatty acid transport(GO:0010748) |
| 0.0 | 1.0 | GO:0030520 | intracellular estrogen receptor signaling pathway(GO:0030520) |
| 0.0 | 0.7 | GO:0035066 | positive regulation of histone acetylation(GO:0035066) |
| 0.0 | 1.6 | GO:0003073 | regulation of systemic arterial blood pressure(GO:0003073) |
| 0.0 | 0.1 | GO:0036092 | phosphatidylinositol-3-phosphate biosynthetic process(GO:0036092) |
| 0.0 | 0.2 | GO:0007220 | Notch receptor processing(GO:0007220) membrane protein intracellular domain proteolysis(GO:0031293) |
| 0.0 | 0.8 | GO:0045669 | positive regulation of osteoblast differentiation(GO:0045669) |
| 0.0 | 0.3 | GO:0046855 | phosphorylated carbohydrate dephosphorylation(GO:0046838) inositol phosphate dephosphorylation(GO:0046855) |
| 0.0 | 0.3 | GO:0045943 | positive regulation of transcription from RNA polymerase I promoter(GO:0045943) |
| 0.0 | 0.4 | GO:0030201 | heparan sulfate proteoglycan metabolic process(GO:0030201) |
| 0.0 | 0.7 | GO:0031146 | SCF-dependent proteasomal ubiquitin-dependent protein catabolic process(GO:0031146) |
| 0.0 | 0.5 | GO:0006829 | zinc II ion transport(GO:0006829) |
| 0.0 | 0.3 | GO:1903020 | positive regulation of glycoprotein metabolic process(GO:1903020) |
| 0.0 | 0.1 | GO:0030836 | positive regulation of actin filament depolymerization(GO:0030836) |
| 0.0 | 0.0 | GO:0045472 | response to ether(GO:0045472) |
| 0.0 | 0.1 | GO:2000401 | regulation of lymphocyte migration(GO:2000401) |
| 0.0 | 0.1 | GO:0015867 | ATP transport(GO:0015867) |
| 0.0 | 0.1 | GO:0061051 | positive regulation of cell growth involved in cardiac muscle cell development(GO:0061051) |
| 0.0 | 0.3 | GO:0046854 | chondrocyte development(GO:0002063) phosphatidylinositol phosphorylation(GO:0046854) |
| 0.0 | 0.1 | GO:0090220 | meiotic telomere clustering(GO:0045141) chromosome localization to nuclear envelope involved in homologous chromosome segregation(GO:0090220) |
| 0.0 | 0.3 | GO:1902857 | positive regulation of nonmotile primary cilium assembly(GO:1902857) |
| 0.0 | 0.5 | GO:0031365 | N-terminal protein amino acid modification(GO:0031365) |
| 0.0 | 0.1 | GO:0051189 | Mo-molybdopterin cofactor biosynthetic process(GO:0006777) Mo-molybdopterin cofactor metabolic process(GO:0019720) molybdopterin cofactor biosynthetic process(GO:0032324) molybdopterin cofactor metabolic process(GO:0043545) prosthetic group metabolic process(GO:0051189) |
| 0.0 | 0.5 | GO:0050982 | detection of mechanical stimulus(GO:0050982) |
| 0.0 | 0.1 | GO:0000972 | transcription-dependent tethering of RNA polymerase II gene DNA at nuclear periphery(GO:0000972) |
| 0.0 | 0.2 | GO:0045948 | positive regulation of translational initiation(GO:0045948) |
| 0.0 | 0.3 | GO:0001881 | receptor recycling(GO:0001881) |
| 0.0 | 0.3 | GO:0006346 | methylation-dependent chromatin silencing(GO:0006346) |
| 0.0 | 0.1 | GO:0060363 | cranial suture morphogenesis(GO:0060363) |
| 0.0 | 0.3 | GO:0045747 | positive regulation of Notch signaling pathway(GO:0045747) |
| 0.0 | 0.1 | GO:0006398 | mRNA 3'-end processing by stem-loop binding and cleavage(GO:0006398) |
| 0.0 | 0.5 | GO:0002062 | chondrocyte differentiation(GO:0002062) |
| 0.0 | 0.5 | GO:0007029 | endoplasmic reticulum organization(GO:0007029) |
Gene overrepresentation in cellular_component category:
| Log-likelihood per target | Total log-likelihood | Term | Description |
|---|---|---|---|
| 0.5 | 1.5 | GO:0034666 | integrin alpha2-beta1 complex(GO:0034666) |
| 0.3 | 1.0 | GO:0097543 | ciliary inversin compartment(GO:0097543) |
| 0.3 | 1.2 | GO:0031092 | platelet alpha granule membrane(GO:0031092) |
| 0.2 | 0.9 | GO:0045251 | mitochondrial electron transfer flavoprotein complex(GO:0017133) electron transfer flavoprotein complex(GO:0045251) |
| 0.2 | 0.2 | GO:0000814 | ESCRT II complex(GO:0000814) |
| 0.2 | 0.6 | GO:0030690 | Noc1p-Noc2p complex(GO:0030690) |
| 0.2 | 1.1 | GO:0000322 | storage vacuole(GO:0000322) |
| 0.2 | 1.2 | GO:0016593 | Cdc73/Paf1 complex(GO:0016593) |
| 0.1 | 0.4 | GO:0000801 | central element(GO:0000801) |
| 0.1 | 0.4 | GO:0071001 | U4/U6 snRNP(GO:0071001) |
| 0.1 | 0.3 | GO:0034455 | t-UTP complex(GO:0034455) |
| 0.1 | 0.7 | GO:0030062 | mitochondrial tricarboxylic acid cycle enzyme complex(GO:0030062) |
| 0.1 | 0.7 | GO:0060293 | P granule(GO:0043186) pole plasm(GO:0045495) germ plasm(GO:0060293) |
| 0.1 | 2.1 | GO:0045334 | clathrin-coated endocytic vesicle(GO:0045334) |
| 0.1 | 0.3 | GO:0032280 | symmetric synapse(GO:0032280) |
| 0.1 | 0.5 | GO:0005964 | phosphorylase kinase complex(GO:0005964) |
| 0.1 | 0.9 | GO:0030027 | lamellipodium(GO:0030027) |
| 0.1 | 1.8 | GO:0032588 | trans-Golgi network membrane(GO:0032588) |
| 0.1 | 2.5 | GO:0005834 | heterotrimeric G-protein complex(GO:0005834) |
| 0.0 | 0.5 | GO:0031105 | septin complex(GO:0031105) |
| 0.0 | 0.3 | GO:0060091 | kinocilium(GO:0060091) |
| 0.0 | 0.1 | GO:0097443 | sorting endosome(GO:0097443) |
| 0.0 | 0.2 | GO:0070971 | endoplasmic reticulum exit site(GO:0070971) |
| 0.0 | 0.9 | GO:0002102 | podosome(GO:0002102) |
| 0.0 | 0.3 | GO:0034709 | methylosome(GO:0034709) |
| 0.0 | 0.2 | GO:0005796 | Golgi lumen(GO:0005796) |
| 0.0 | 0.3 | GO:0031080 | nuclear pore outer ring(GO:0031080) |
| 0.0 | 0.5 | GO:0097225 | sperm midpiece(GO:0097225) |
| 0.0 | 1.0 | GO:0032420 | stereocilium(GO:0032420) |
| 0.0 | 0.3 | GO:0044447 | axoneme part(GO:0044447) |
| 0.0 | 1.7 | GO:0005793 | endoplasmic reticulum-Golgi intermediate compartment(GO:0005793) |
| 0.0 | 1.8 | GO:0005811 | lipid particle(GO:0005811) |
| 0.0 | 1.6 | GO:0031985 | Golgi cisterna(GO:0031985) |
| 0.0 | 0.4 | GO:0000506 | glycosylphosphatidylinositol-N-acetylglucosaminyltransferase (GPI-GnT) complex(GO:0000506) |
| 0.0 | 0.5 | GO:0016327 | apicolateral plasma membrane(GO:0016327) |
| 0.0 | 0.1 | GO:0035339 | SPOTS complex(GO:0035339) |
| 0.0 | 0.3 | GO:0016460 | myosin II complex(GO:0016460) |
| 0.0 | 0.2 | GO:0071598 | neuronal ribonucleoprotein granule(GO:0071598) |
| 0.0 | 0.3 | GO:0032593 | insulin-responsive compartment(GO:0032593) |
| 0.0 | 0.2 | GO:0005682 | U5 snRNP(GO:0005682) |
| 0.0 | 0.3 | GO:1990124 | messenger ribonucleoprotein complex(GO:1990124) |
| 0.0 | 0.5 | GO:0046658 | anchored component of plasma membrane(GO:0046658) |
| 0.0 | 0.1 | GO:0031252 | cell leading edge(GO:0031252) |
| 0.0 | 0.1 | GO:0005687 | U4 snRNP(GO:0005687) |
| 0.0 | 1.5 | GO:0072562 | blood microparticle(GO:0072562) |
| 0.0 | 0.2 | GO:0032433 | filopodium tip(GO:0032433) |
| 0.0 | 0.5 | GO:0030904 | retromer complex(GO:0030904) |
| 0.0 | 1.1 | GO:0098878 | ionotropic glutamate receptor complex(GO:0008328) neurotransmitter receptor complex(GO:0098878) |
| 0.0 | 0.6 | GO:0005788 | endoplasmic reticulum lumen(GO:0005788) |
| 0.0 | 0.8 | GO:0031526 | brush border membrane(GO:0031526) |
| 0.0 | 0.1 | GO:0032937 | SREBP-SCAP-Insig complex(GO:0032937) |
| 0.0 | 0.1 | GO:0045261 | mitochondrial proton-transporting ATP synthase complex, catalytic core F(1)(GO:0000275) proton-transporting ATP synthase complex, catalytic core F(1)(GO:0045261) |
| 0.0 | 0.1 | GO:0031011 | Ino80 complex(GO:0031011) |
| 0.0 | 0.1 | GO:0035032 | phosphatidylinositol 3-kinase complex, class III(GO:0035032) |
| 0.0 | 0.2 | GO:0001891 | phagocytic cup(GO:0001891) |
| 0.0 | 0.3 | GO:0000407 | pre-autophagosomal structure(GO:0000407) |
| 0.0 | 0.2 | GO:0000159 | protein phosphatase type 2A complex(GO:0000159) |
Gene overrepresentation in molecular_function category:
| Log-likelihood per target | Total log-likelihood | Term | Description |
|---|---|---|---|
| 0.5 | 1.5 | GO:0005128 | erythropoietin receptor binding(GO:0005128) |
| 0.4 | 1.3 | GO:0031752 | D5 dopamine receptor binding(GO:0031752) |
| 0.3 | 0.9 | GO:0048039 | ubiquinone binding(GO:0048039) |
| 0.3 | 1.1 | GO:0016230 | sphingomyelin phosphodiesterase activator activity(GO:0016230) |
| 0.3 | 0.8 | GO:0046899 | nucleoside triphosphate adenylate kinase activity(GO:0046899) |
| 0.3 | 0.8 | GO:0008521 | acetyl-CoA transporter activity(GO:0008521) |
| 0.2 | 0.7 | GO:0005110 | frizzled-2 binding(GO:0005110) |
| 0.2 | 0.8 | GO:0045131 | pre-mRNA branch point binding(GO:0045131) |
| 0.2 | 0.6 | GO:0001888 | glucuronyl-galactosyl-proteoglycan 4-alpha-N-acetylglucosaminyltransferase activity(GO:0001888) |
| 0.2 | 1.6 | GO:0070290 | N-acylphosphatidylethanolamine-specific phospholipase D activity(GO:0070290) |
| 0.2 | 0.7 | GO:0032422 | purine-rich negative regulatory element binding(GO:0032422) |
| 0.1 | 2.2 | GO:0031702 | type 1 angiotensin receptor binding(GO:0031702) |
| 0.1 | 2.6 | GO:1990841 | promoter-specific chromatin binding(GO:1990841) |
| 0.1 | 0.6 | GO:0035877 | death effector domain binding(GO:0035877) |
| 0.1 | 0.7 | GO:0004342 | glucosamine-6-phosphate deaminase activity(GO:0004342) |
| 0.1 | 0.4 | GO:0035175 | histone kinase activity (H3-S10 specific)(GO:0035175) |
| 0.1 | 0.5 | GO:0097003 | adipokinetic hormone receptor activity(GO:0097003) |
| 0.1 | 2.0 | GO:0017166 | vinculin binding(GO:0017166) |
| 0.1 | 0.5 | GO:0070573 | tripeptidyl-peptidase activity(GO:0008240) metallodipeptidase activity(GO:0070573) |
| 0.1 | 0.5 | GO:0004095 | carnitine O-palmitoyltransferase activity(GO:0004095) |
| 0.1 | 0.5 | GO:0003917 | DNA topoisomerase type I activity(GO:0003917) |
| 0.1 | 1.5 | GO:0005161 | platelet-derived growth factor receptor binding(GO:0005161) |
| 0.1 | 0.4 | GO:0004954 | icosanoid receptor activity(GO:0004953) prostanoid receptor activity(GO:0004954) prostaglandin receptor activity(GO:0004955) |
| 0.1 | 0.9 | GO:0048038 | quinone binding(GO:0048038) |
| 0.1 | 0.3 | GO:0003976 | UDP-N-acetylglucosamine-lysosomal-enzyme N-acetylglucosaminephosphotransferase activity(GO:0003976) |
| 0.1 | 0.3 | GO:0042731 | PH domain binding(GO:0042731) |
| 0.1 | 0.8 | GO:0022841 | potassium ion leak channel activity(GO:0022841) |
| 0.1 | 0.4 | GO:0030621 | U4 snRNA binding(GO:0030621) |
| 0.1 | 0.5 | GO:0004689 | phosphorylase kinase activity(GO:0004689) |
| 0.1 | 0.3 | GO:0052833 | inositol monophosphate 1-phosphatase activity(GO:0008934) inositol monophosphate 3-phosphatase activity(GO:0052832) inositol monophosphate 4-phosphatase activity(GO:0052833) inositol monophosphate phosphatase activity(GO:0052834) |
| 0.1 | 0.7 | GO:0008318 | protein prenyltransferase activity(GO:0008318) |
| 0.1 | 1.8 | GO:0005385 | zinc ion transmembrane transporter activity(GO:0005385) |
| 0.1 | 0.5 | GO:0019869 | chloride channel inhibitor activity(GO:0019869) |
| 0.1 | 0.7 | GO:0034943 | acyl-CoA ligase activity(GO:0003996) 3-oxo-2-(2'-pentenyl)cyclopentane-1-octanoic acid CoA ligase activity(GO:0010435) 3-isopropenyl-6-oxoheptanoyl-CoA synthetase activity(GO:0018854) 2-oxo-delta3-4,5,5-trimethylcyclopentenylacetyl-CoA synthetase activity(GO:0018855) benzoyl acetate-CoA ligase activity(GO:0018856) 2,4-dichlorobenzoate-CoA ligase activity(GO:0018857) pivalate-CoA ligase activity(GO:0034783) cyclopropanecarboxylate-CoA ligase activity(GO:0034793) adipate-CoA ligase activity(GO:0034796) citronellyl-CoA ligase activity(GO:0034823) mentha-1,3-dione-CoA ligase activity(GO:0034841) thiophene-2-carboxylate-CoA ligase activity(GO:0034842) 2,4,4-trimethylpentanoate-CoA ligase activity(GO:0034865) cis-2-methyl-5-isopropylhexa-2,5-dienoate-CoA ligase activity(GO:0034942) trans-2-methyl-5-isopropylhexa-2,5-dienoate-CoA ligase activity(GO:0034943) branched-chain acyl-CoA synthetase (ADP-forming) activity(GO:0043759) aryl-CoA synthetase (ADP-forming) activity(GO:0043762) 3-hydroxypropionyl-CoA synthetase activity(GO:0043955) perillic acid:CoA ligase (ADP-forming) activity(GO:0052685) perillic acid:CoA ligase (AMP-forming) activity(GO:0052686) (3R)-3-isopropenyl-6-oxoheptanoate:CoA ligase (ADP-forming) activity(GO:0052687) (3R)-3-isopropenyl-6-oxoheptanoate:CoA ligase (AMP-forming) activity(GO:0052688) pristanate-CoA ligase activity(GO:0070251) malonyl-CoA synthetase activity(GO:0090409) |
| 0.1 | 0.8 | GO:0008484 | sulfuric ester hydrolase activity(GO:0008484) |
| 0.1 | 1.7 | GO:0070273 | phosphatidylinositol-4-phosphate binding(GO:0070273) |
| 0.1 | 2.2 | GO:0045309 | protein phosphorylated amino acid binding(GO:0045309) |
| 0.1 | 1.6 | GO:0043014 | alpha-tubulin binding(GO:0043014) |
| 0.0 | 1.1 | GO:0005234 | extracellular-glutamate-gated ion channel activity(GO:0005234) |
| 0.0 | 0.1 | GO:0031871 | proteinase activated receptor binding(GO:0031871) |
| 0.0 | 0.8 | GO:0080025 | phosphatidylinositol-3,5-bisphosphate binding(GO:0080025) |
| 0.0 | 0.2 | GO:0010385 | double-stranded methylated DNA binding(GO:0010385) |
| 0.0 | 1.8 | GO:0052771 | coenzyme F390-A hydrolase activity(GO:0052770) coenzyme F390-G hydrolase activity(GO:0052771) |
| 0.0 | 0.2 | GO:0008427 | calcium-dependent protein kinase inhibitor activity(GO:0008427) |
| 0.0 | 0.3 | GO:0051022 | Rho GDP-dissociation inhibitor binding(GO:0051022) |
| 0.0 | 0.3 | GO:0031730 | CCR5 chemokine receptor binding(GO:0031730) |
| 0.0 | 0.4 | GO:0008574 | ATP-dependent microtubule motor activity, plus-end-directed(GO:0008574) |
| 0.0 | 0.4 | GO:0004438 | phosphatidylinositol-3-phosphatase activity(GO:0004438) |
| 0.0 | 0.1 | GO:0004791 | thioredoxin-disulfide reductase activity(GO:0004791) |
| 0.0 | 0.8 | GO:0003785 | actin monomer binding(GO:0003785) |
| 0.0 | 0.6 | GO:0043539 | protein serine/threonine kinase activator activity(GO:0043539) |
| 0.0 | 0.5 | GO:0032266 | phosphatidylinositol-3-phosphate binding(GO:0032266) |
| 0.0 | 0.1 | GO:0001075 | transcription factor activity, RNA polymerase II core promoter sequence-specific binding involved in preinitiation complex assembly(GO:0001075) |
| 0.0 | 0.1 | GO:1990450 | linear polyubiquitin binding(GO:1990450) |
| 0.0 | 0.9 | GO:0016922 | ligand-dependent nuclear receptor binding(GO:0016922) |
| 0.0 | 0.2 | GO:0004445 | inositol-polyphosphate 5-phosphatase activity(GO:0004445) |
| 0.0 | 0.5 | GO:0035259 | glucocorticoid receptor binding(GO:0035259) |
| 0.0 | 0.1 | GO:0015217 | ADP transmembrane transporter activity(GO:0015217) coenzyme A transmembrane transporter activity(GO:0015228) adenosine 3',5'-bisphosphate transmembrane transporter activity(GO:0071077) AMP transmembrane transporter activity(GO:0080122) |
| 0.0 | 0.5 | GO:0008327 | methyl-CpG binding(GO:0008327) |
| 0.0 | 0.6 | GO:0001786 | phosphatidylserine binding(GO:0001786) |
| 0.0 | 2.4 | GO:0003774 | motor activity(GO:0003774) |
| 0.0 | 0.1 | GO:0031727 | CCR2 chemokine receptor binding(GO:0031727) |
| 0.0 | 1.8 | GO:0005125 | cytokine activity(GO:0005125) |
| 0.0 | 0.3 | GO:0008179 | adenylate cyclase binding(GO:0008179) |
| 0.0 | 0.7 | GO:0004177 | aminopeptidase activity(GO:0004177) |
| 0.0 | 0.2 | GO:0004579 | dolichyl-diphosphooligosaccharide-protein glycotransferase activity(GO:0004579) |
| 0.0 | 0.3 | GO:0050811 | GABA receptor binding(GO:0050811) |
| 0.0 | 1.1 | GO:0005518 | collagen binding(GO:0005518) |
| 0.0 | 0.3 | GO:0008143 | poly(A) binding(GO:0008143) |
| 0.0 | 0.4 | GO:0051183 | vitamin transporter activity(GO:0051183) |
| 0.0 | 0.2 | GO:0043023 | ribosomal large subunit binding(GO:0043023) |
| 0.0 | 0.2 | GO:0050308 | sugar-phosphatase activity(GO:0050308) |
| 0.0 | 0.2 | GO:0008601 | protein phosphatase type 2A regulator activity(GO:0008601) |
| 0.0 | 0.3 | GO:0004198 | calcium-dependent cysteine-type endopeptidase activity(GO:0004198) |
| 0.0 | 0.5 | GO:0001540 | beta-amyloid binding(GO:0001540) |
| 0.0 | 0.2 | GO:0050253 | prenylcysteine methylesterase activity(GO:0010296) 1-oxa-2-oxocycloheptane lactonase activity(GO:0018731) sulfolactone hydrolase activity(GO:0018732) butyrolactone hydrolase activity(GO:0018734) endosulfan lactone lactonase activity(GO:0034892) L-ascorbate 6-phosphate lactonase activity(GO:0035460) Ser-tRNA(Thr) hydrolase activity(GO:0043905) Ala-tRNA(Pro) hydrolase activity(GO:0043906) Cys-tRNA(Pro) hydrolase activity(GO:0043907) Ser(Gly)-tRNA(Ala) hydrolase activity(GO:0043908) all-trans-retinyl-palmitate hydrolase, all-trans-retinol forming activity(GO:0047376) retinyl-palmitate esterase activity(GO:0050253) mannosyl-oligosaccharide 1,6-alpha-mannosidase activity(GO:0052767) mannosyl-oligosaccharide 1,3-alpha-mannosidase activity(GO:0052768) methyl indole-3-acetate esterase activity(GO:0080030) methyl salicylate esterase activity(GO:0080031) methyl jasmonate esterase activity(GO:0080032) |
| 0.0 | 0.4 | GO:0030515 | snoRNA binding(GO:0030515) |
| 0.0 | 1.2 | GO:0016300 | tRNA (uracil) methyltransferase activity(GO:0016300) |
| 0.0 | 0.1 | GO:0031821 | G-protein coupled serotonin receptor binding(GO:0031821) |
| 0.0 | 0.1 | GO:0005225 | volume-sensitive anion channel activity(GO:0005225) |
| 0.0 | 0.0 | GO:0004699 | calcium-independent protein kinase C activity(GO:0004699) |
| 0.0 | 0.7 | GO:0020037 | heme binding(GO:0020037) |
| 0.0 | 0.2 | GO:0030676 | Rac guanyl-nucleotide exchange factor activity(GO:0030676) |