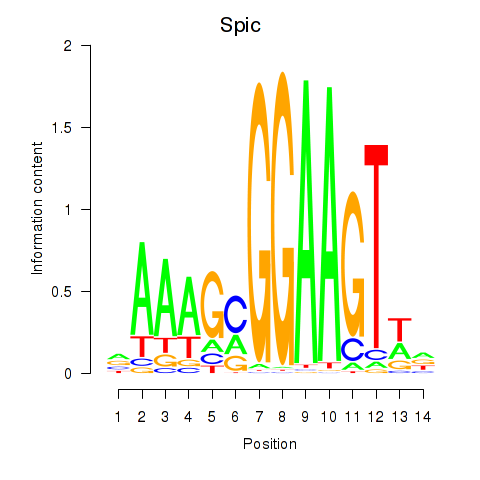
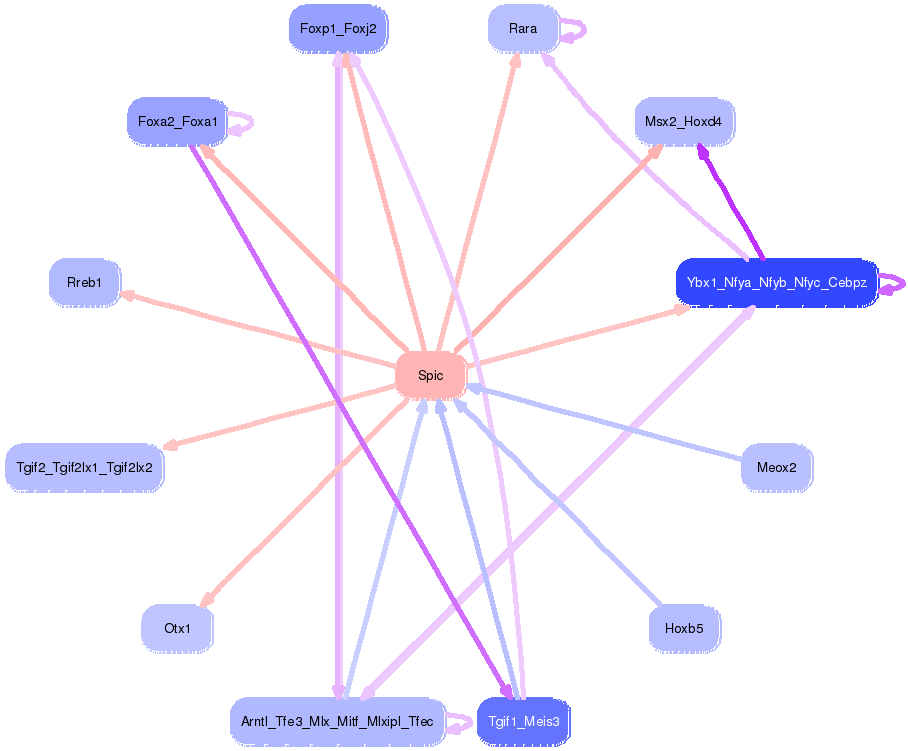
Motif ID: Spic
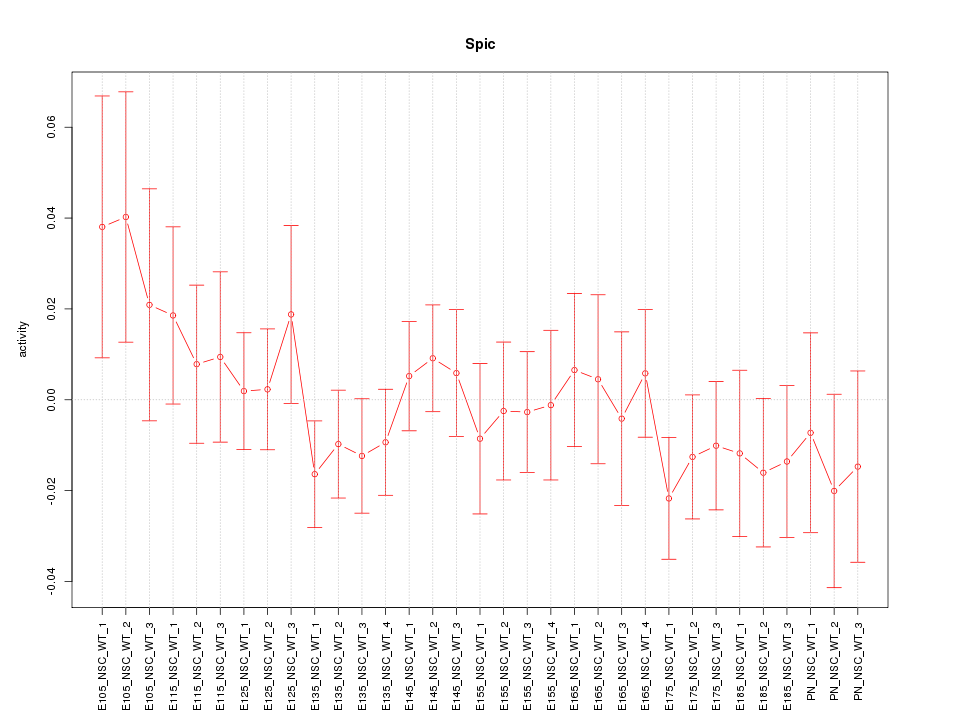
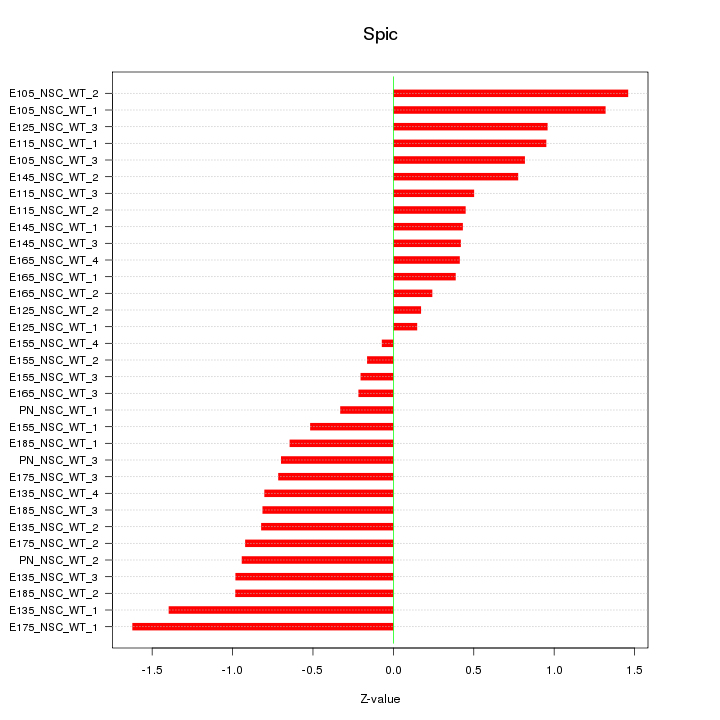
Z-value: 0.786
Transcription factors associated with Spic:
| Gene Symbol | Entrez ID | Gene Name |
|---|---|---|
| Spic | ENSMUSG00000004359.10 | Spic |
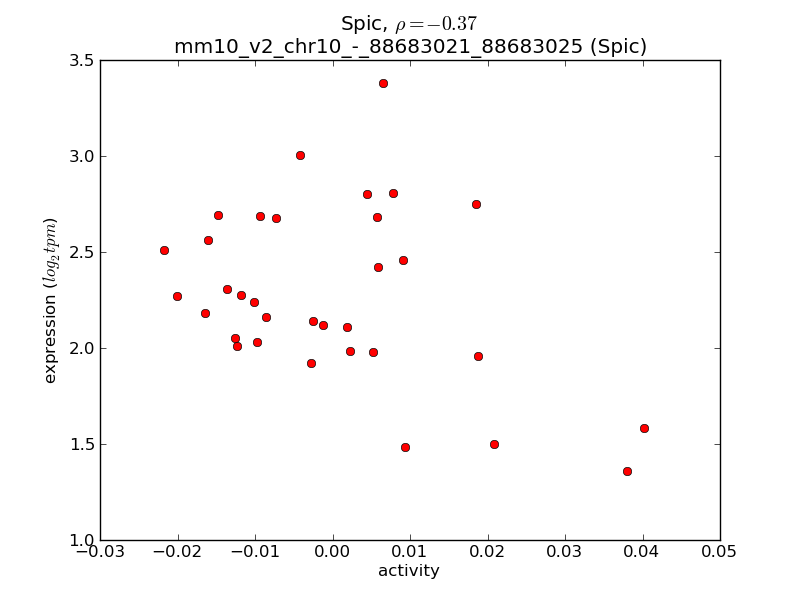
Activity-expression correlation:
| Gene Symbol | Promoter | Pearson corr. coef. | P-value | Plot |
|---|---|---|---|---|
| Spic | mm10_v2_chr10_-_88683021_88683025 | -0.37 | 3.6e-02 | Click! |

Top targets:
Gene overrepresentation in biological_process category:
| Log-likelihood per target | Total log-likelihood | Term | Description |
|---|---|---|---|
| 1.4 | 6.8 | GO:0015671 | oxygen transport(GO:0015671) |
| 0.9 | 2.8 | GO:0070315 | G1 to G0 transition involved in cell differentiation(GO:0070315) |
| 0.8 | 4.1 | GO:1901164 | negative regulation of trophoblast cell migration(GO:1901164) |
| 0.7 | 2.0 | GO:0048818 | embryonic nail plate morphogenesis(GO:0035880) positive regulation of hair follicle maturation(GO:0048818) positive regulation of catagen(GO:0051795) frontal suture morphogenesis(GO:0060364) |
| 0.7 | 3.9 | GO:0032796 | uropod organization(GO:0032796) |
| 0.6 | 2.4 | GO:0002309 | T cell proliferation involved in immune response(GO:0002309) |
| 0.6 | 2.2 | GO:0002337 | B-1a B cell differentiation(GO:0002337) |
| 0.5 | 1.4 | GO:0045014 | detection of carbohydrate stimulus(GO:0009730) detection of hexose stimulus(GO:0009732) detection of monosaccharide stimulus(GO:0034287) carbon catabolite repression of transcription(GO:0045013) negative regulation of transcription by glucose(GO:0045014) detection of glucose(GO:0051594) |
| 0.5 | 1.4 | GO:0001803 | type III hypersensitivity(GO:0001802) regulation of type III hypersensitivity(GO:0001803) positive regulation of type III hypersensitivity(GO:0001805) |
| 0.4 | 1.2 | GO:0070172 | positive regulation of tooth mineralization(GO:0070172) |
| 0.4 | 5.0 | GO:0006268 | DNA unwinding involved in DNA replication(GO:0006268) |
| 0.4 | 3.3 | GO:0051639 | actin filament network formation(GO:0051639) |
| 0.3 | 1.0 | GO:1904569 | regulation of selenocysteine incorporation(GO:1904569) |
| 0.3 | 1.0 | GO:1903054 | lysosomal membrane organization(GO:0097212) negative regulation of extracellular matrix organization(GO:1903054) positive regulation of protein folding(GO:1903334) |
| 0.3 | 0.7 | GO:0032701 | negative regulation of interleukin-18 production(GO:0032701) |
| 0.3 | 1.3 | GO:0050904 | diapedesis(GO:0050904) |
| 0.3 | 1.0 | GO:0000087 | mitotic M phase(GO:0000087) |
| 0.3 | 1.2 | GO:1900426 | positive regulation of defense response to bacterium(GO:1900426) |
| 0.3 | 0.8 | GO:0071921 | establishment of sister chromatid cohesion(GO:0034085) cohesin loading(GO:0071921) regulation of cohesin loading(GO:0071922) |
| 0.3 | 0.6 | GO:0021506 | anterior neuropore closure(GO:0021506) neuropore closure(GO:0021995) |
| 0.3 | 0.8 | GO:0070889 | platelet alpha granule organization(GO:0070889) |
| 0.3 | 1.3 | GO:0032237 | activation of store-operated calcium channel activity(GO:0032237) |
| 0.3 | 1.9 | GO:0045656 | negative regulation of monocyte differentiation(GO:0045656) |
| 0.3 | 0.8 | GO:0045085 | negative regulation of interleukin-2 biosynthetic process(GO:0045085) |
| 0.2 | 0.7 | GO:0031052 | programmed DNA elimination(GO:0031049) chromosome breakage(GO:0031052) |
| 0.2 | 0.7 | GO:0060010 | Sertoli cell fate commitment(GO:0060010) |
| 0.2 | 1.2 | GO:0015867 | ATP transport(GO:0015867) |
| 0.2 | 0.7 | GO:0035633 | maintenance of blood-brain barrier(GO:0035633) |
| 0.2 | 1.6 | GO:2000491 | positive regulation of hepatic stellate cell activation(GO:2000491) |
| 0.2 | 0.7 | GO:0002538 | arachidonic acid metabolite production involved in inflammatory response(GO:0002538) |
| 0.2 | 0.6 | GO:0070944 | neutrophil mediated killing of bacterium(GO:0070944) |
| 0.2 | 0.6 | GO:0045472 | response to ether(GO:0045472) |
| 0.2 | 0.6 | GO:0072356 | chromosome passenger complex localization to kinetochore(GO:0072356) |
| 0.2 | 0.8 | GO:0072697 | protein localization to cell cortex(GO:0072697) |
| 0.2 | 1.1 | GO:0051126 | negative regulation of actin nucleation(GO:0051126) |
| 0.2 | 0.9 | GO:2000157 | regulation of protein K48-linked deubiquitination(GO:1903093) negative regulation of protein K48-linked deubiquitination(GO:1903094) negative regulation of ubiquitin-specific protease activity(GO:2000157) |
| 0.2 | 1.9 | GO:1990173 | protein localization to nuclear body(GO:1903405) protein localization to Cajal body(GO:1904867) regulation of protein localization to Cajal body(GO:1904869) positive regulation of protein localization to Cajal body(GO:1904871) protein localization to nucleoplasm(GO:1990173) |
| 0.2 | 0.9 | GO:0001842 | neural fold formation(GO:0001842) |
| 0.2 | 1.9 | GO:0045899 | positive regulation of RNA polymerase II transcriptional preinitiation complex assembly(GO:0045899) |
| 0.2 | 0.5 | GO:0006420 | arginyl-tRNA aminoacylation(GO:0006420) |
| 0.2 | 0.8 | GO:1905098 | negative regulation of guanyl-nucleotide exchange factor activity(GO:1905098) |
| 0.2 | 0.8 | GO:2000483 | detection of bacterium(GO:0016045) detection of other organism(GO:0098543) negative regulation of interleukin-8 secretion(GO:2000483) |
| 0.2 | 0.5 | GO:0035928 | rRNA import into mitochondrion(GO:0035928) |
| 0.2 | 1.0 | GO:0090400 | stress-induced premature senescence(GO:0090400) |
| 0.2 | 1.3 | GO:0032625 | interleukin-21 production(GO:0032625) interleukin-21 secretion(GO:0072619) |
| 0.1 | 1.0 | GO:0032790 | ribosome disassembly(GO:0032790) |
| 0.1 | 2.2 | GO:0035873 | lactate transport(GO:0015727) lactate transmembrane transport(GO:0035873) plasma membrane lactate transport(GO:0035879) |
| 0.1 | 0.5 | GO:0006788 | heme oxidation(GO:0006788) |
| 0.1 | 0.7 | GO:0002710 | negative regulation of T cell mediated immunity(GO:0002710) |
| 0.1 | 0.4 | GO:0002883 | regulation of type I hypersensitivity(GO:0001810) negative regulation of acute inflammatory response to antigenic stimulus(GO:0002865) regulation of hypersensitivity(GO:0002883) type I hypersensitivity(GO:0016068) |
| 0.1 | 0.4 | GO:0002314 | germinal center B cell differentiation(GO:0002314) |
| 0.1 | 0.9 | GO:0007000 | nucleolus organization(GO:0007000) |
| 0.1 | 0.8 | GO:0000447 | endonucleolytic cleavage in ITS1 to separate SSU-rRNA from 5.8S rRNA and LSU-rRNA from tricistronic rRNA transcript (SSU-rRNA, 5.8S rRNA, LSU-rRNA)(GO:0000447) |
| 0.1 | 0.6 | GO:0006072 | glycerol-3-phosphate metabolic process(GO:0006072) |
| 0.1 | 0.5 | GO:0017183 | peptidyl-diphthamide metabolic process(GO:0017182) peptidyl-diphthamide biosynthetic process from peptidyl-histidine(GO:0017183) |
| 0.1 | 0.8 | GO:0006361 | transcription initiation from RNA polymerase I promoter(GO:0006361) |
| 0.1 | 0.4 | GO:1903599 | aggrephagy(GO:0035973) positive regulation of mitophagy(GO:1903599) |
| 0.1 | 1.4 | GO:0000463 | maturation of LSU-rRNA from tricistronic rRNA transcript (SSU-rRNA, 5.8S rRNA, LSU-rRNA)(GO:0000463) |
| 0.1 | 0.6 | GO:0051013 | microtubule severing(GO:0051013) |
| 0.1 | 0.3 | GO:0030321 | transepithelial chloride transport(GO:0030321) |
| 0.1 | 0.3 | GO:0051030 | snRNA transport(GO:0051030) |
| 0.1 | 0.4 | GO:0002862 | negative regulation of inflammatory response to antigenic stimulus(GO:0002862) |
| 0.1 | 0.4 | GO:0034975 | protein folding in endoplasmic reticulum(GO:0034975) |
| 0.1 | 0.9 | GO:0090037 | positive regulation of protein kinase C signaling(GO:0090037) |
| 0.1 | 0.5 | GO:0000056 | ribosomal small subunit export from nucleus(GO:0000056) |
| 0.1 | 0.7 | GO:0048852 | diencephalon morphogenesis(GO:0048852) |
| 0.1 | 0.5 | GO:0007406 | negative regulation of neuroblast proliferation(GO:0007406) |
| 0.1 | 0.4 | GO:0038032 | termination of G-protein coupled receptor signaling pathway(GO:0038032) |
| 0.1 | 0.3 | GO:0006269 | DNA replication, synthesis of RNA primer(GO:0006269) |
| 0.1 | 1.2 | GO:0030238 | male sex determination(GO:0030238) |
| 0.1 | 0.3 | GO:0033092 | positive regulation of immature T cell proliferation in thymus(GO:0033092) positive regulation of interleukin-6 biosynthetic process(GO:0045410) |
| 0.1 | 0.3 | GO:0036228 | protein targeting to nuclear inner membrane(GO:0036228) |
| 0.1 | 0.6 | GO:0031145 | anaphase-promoting complex-dependent catabolic process(GO:0031145) |
| 0.1 | 2.0 | GO:0006270 | DNA replication initiation(GO:0006270) |
| 0.1 | 0.3 | GO:2000623 | regulation of nuclear-transcribed mRNA catabolic process, nonsense-mediated decay(GO:2000622) negative regulation of nuclear-transcribed mRNA catabolic process, nonsense-mediated decay(GO:2000623) |
| 0.1 | 0.6 | GO:1900262 | regulation of DNA-directed DNA polymerase activity(GO:1900262) positive regulation of DNA-directed DNA polymerase activity(GO:1900264) |
| 0.1 | 0.2 | GO:1904154 | positive regulation of retrograde protein transport, ER to cytosol(GO:1904154) |
| 0.1 | 0.6 | GO:0033601 | positive regulation of mammary gland epithelial cell proliferation(GO:0033601) regulation of wound healing, spreading of epidermal cells(GO:1903689) positive regulation of lamellipodium morphogenesis(GO:2000394) |
| 0.1 | 1.1 | GO:0010388 | cullin deneddylation(GO:0010388) |
| 0.1 | 0.2 | GO:0031086 | nuclear-transcribed mRNA catabolic process, deadenylation-independent decay(GO:0031086) deadenylation-independent decapping of nuclear-transcribed mRNA(GO:0031087) |
| 0.1 | 0.2 | GO:1903774 | positive regulation of viral budding via host ESCRT complex(GO:1903774) |
| 0.1 | 0.2 | GO:0006742 | NADP catabolic process(GO:0006742) pyridine nucleotide catabolic process(GO:0019364) |
| 0.1 | 0.3 | GO:0010920 | negative regulation of inositol phosphate biosynthetic process(GO:0010920) |
| 0.1 | 0.5 | GO:0031119 | tRNA pseudouridine synthesis(GO:0031119) |
| 0.1 | 0.6 | GO:2000601 | positive regulation of Arp2/3 complex-mediated actin nucleation(GO:2000601) |
| 0.1 | 1.0 | GO:0006388 | tRNA splicing, via endonucleolytic cleavage and ligation(GO:0006388) |
| 0.1 | 1.0 | GO:0030213 | hyaluronan biosynthetic process(GO:0030213) |
| 0.1 | 2.3 | GO:0001706 | endoderm formation(GO:0001706) |
| 0.1 | 0.6 | GO:0071569 | protein ufmylation(GO:0071569) |
| 0.1 | 0.4 | GO:0045040 | protein import into mitochondrial outer membrane(GO:0045040) |
| 0.1 | 0.3 | GO:1901069 | guanosine-containing compound catabolic process(GO:1901069) |
| 0.1 | 0.4 | GO:0000103 | sulfate assimilation(GO:0000103) |
| 0.1 | 0.6 | GO:0002098 | tRNA wobble uridine modification(GO:0002098) |
| 0.1 | 0.5 | GO:0030854 | positive regulation of granulocyte differentiation(GO:0030854) |
| 0.1 | 0.3 | GO:1901096 | regulation of autophagosome maturation(GO:1901096) |
| 0.1 | 0.3 | GO:1902410 | mitotic cytokinetic process(GO:1902410) |
| 0.1 | 0.3 | GO:0000963 | mitochondrial RNA processing(GO:0000963) |
| 0.1 | 0.7 | GO:0045954 | positive regulation of natural killer cell mediated cytotoxicity(GO:0045954) |
| 0.0 | 0.2 | GO:0018242 | protein O-linked glycosylation via serine(GO:0018242) |
| 0.0 | 0.1 | GO:0051771 | negative regulation of nitric-oxide synthase biosynthetic process(GO:0051771) |
| 0.0 | 0.6 | GO:0090502 | RNA phosphodiester bond hydrolysis, endonucleolytic(GO:0090502) |
| 0.0 | 1.0 | GO:0031115 | negative regulation of microtubule polymerization(GO:0031115) |
| 0.0 | 0.6 | GO:0001522 | pseudouridine synthesis(GO:0001522) |
| 0.0 | 0.6 | GO:0033119 | negative regulation of RNA splicing(GO:0033119) |
| 0.0 | 0.5 | GO:0015816 | glycine transport(GO:0015816) |
| 0.0 | 3.3 | GO:0006888 | ER to Golgi vesicle-mediated transport(GO:0006888) |
| 0.0 | 0.1 | GO:0046368 | GDP-L-fucose metabolic process(GO:0046368) |
| 0.0 | 0.7 | GO:1902745 | positive regulation of lamellipodium organization(GO:1902745) |
| 0.0 | 0.7 | GO:0045116 | protein neddylation(GO:0045116) |
| 0.0 | 1.5 | GO:0043550 | regulation of lipid kinase activity(GO:0043550) |
| 0.0 | 0.4 | GO:0016446 | somatic hypermutation of immunoglobulin genes(GO:0016446) |
| 0.0 | 0.5 | GO:0038092 | nodal signaling pathway(GO:0038092) |
| 0.0 | 0.2 | GO:0008616 | queuosine biosynthetic process(GO:0008616) queuosine metabolic process(GO:0046116) |
| 0.0 | 0.2 | GO:0071699 | olfactory placode formation(GO:0030910) olfactory placode development(GO:0071698) olfactory placode morphogenesis(GO:0071699) |
| 0.0 | 1.9 | GO:0032543 | mitochondrial translation(GO:0032543) |
| 0.0 | 0.4 | GO:1901741 | positive regulation of myoblast fusion(GO:1901741) |
| 0.0 | 0.5 | GO:0033866 | coenzyme A biosynthetic process(GO:0015937) nucleoside bisphosphate biosynthetic process(GO:0033866) ribonucleoside bisphosphate biosynthetic process(GO:0034030) purine nucleoside bisphosphate biosynthetic process(GO:0034033) |
| 0.0 | 0.3 | GO:0009396 | folic acid-containing compound biosynthetic process(GO:0009396) |
| 0.0 | 0.2 | GO:0001731 | formation of translation preinitiation complex(GO:0001731) |
| 0.0 | 0.5 | GO:0006958 | complement activation, classical pathway(GO:0006958) |
| 0.0 | 1.4 | GO:0042255 | ribosome assembly(GO:0042255) |
| 0.0 | 0.5 | GO:0000470 | maturation of LSU-rRNA(GO:0000470) |
| 0.0 | 0.6 | GO:0000462 | maturation of SSU-rRNA from tricistronic rRNA transcript (SSU-rRNA, 5.8S rRNA, LSU-rRNA)(GO:0000462) |
| 0.0 | 0.5 | GO:0043968 | histone H2A acetylation(GO:0043968) |
| 0.0 | 0.1 | GO:0046469 | platelet activating factor biosynthetic process(GO:0006663) platelet activating factor metabolic process(GO:0046469) |
| 0.0 | 0.5 | GO:0016226 | iron-sulfur cluster assembly(GO:0016226) metallo-sulfur cluster assembly(GO:0031163) |
| 0.0 | 0.5 | GO:0006491 | N-glycan processing(GO:0006491) |
| 0.0 | 0.4 | GO:0051457 | maintenance of protein location in nucleus(GO:0051457) |
| 0.0 | 0.1 | GO:1903378 | positive regulation of oxidative stress-induced neuron intrinsic apoptotic signaling pathway(GO:1903378) |
| 0.0 | 0.8 | GO:0043029 | T cell homeostasis(GO:0043029) |
| 0.0 | 6.2 | GO:0000375 | RNA splicing, via transesterification reactions(GO:0000375) |
| 0.0 | 0.9 | GO:0043039 | tRNA aminoacylation for protein translation(GO:0006418) tRNA aminoacylation(GO:0043039) |
| 0.0 | 0.3 | GO:0038063 | collagen-activated tyrosine kinase receptor signaling pathway(GO:0038063) |
| 0.0 | 0.1 | GO:0046501 | protoporphyrinogen IX metabolic process(GO:0046501) |
| 0.0 | 0.7 | GO:0045840 | positive regulation of mitotic nuclear division(GO:0045840) |
| 0.0 | 0.1 | GO:0006517 | mannose metabolic process(GO:0006013) protein deglycosylation(GO:0006517) |
| 0.0 | 1.2 | GO:0070527 | platelet aggregation(GO:0070527) |
| 0.0 | 0.6 | GO:0034508 | centromere complex assembly(GO:0034508) |
| 0.0 | 0.3 | GO:0045722 | positive regulation of gluconeogenesis(GO:0045722) |
| 0.0 | 0.5 | GO:0006221 | pyrimidine nucleotide biosynthetic process(GO:0006221) |
| 0.0 | 0.3 | GO:0060837 | blood vessel endothelial cell differentiation(GO:0060837) |
| 0.0 | 0.3 | GO:0046855 | phosphorylated carbohydrate dephosphorylation(GO:0046838) inositol phosphate dephosphorylation(GO:0046855) |
| 0.0 | 0.3 | GO:0019835 | cytolysis(GO:0019835) |
| 0.0 | 0.9 | GO:0048008 | platelet-derived growth factor receptor signaling pathway(GO:0048008) |
| 0.0 | 0.1 | GO:0032471 | negative regulation of endoplasmic reticulum calcium ion concentration(GO:0032471) |
| 0.0 | 0.2 | GO:0034244 | negative regulation of transcription elongation from RNA polymerase II promoter(GO:0034244) |
| 0.0 | 0.5 | GO:0030201 | heparan sulfate proteoglycan metabolic process(GO:0030201) |
| 0.0 | 0.2 | GO:0035871 | protein K11-linked deubiquitination(GO:0035871) |
| 0.0 | 0.4 | GO:1903146 | regulation of mitophagy(GO:1903146) |
| 0.0 | 0.2 | GO:0030316 | osteoclast differentiation(GO:0030316) |
| 0.0 | 0.7 | GO:0002181 | cytoplasmic translation(GO:0002181) |
| 0.0 | 0.1 | GO:0006020 | inositol metabolic process(GO:0006020) |
| 0.0 | 0.3 | GO:0016486 | peptide hormone processing(GO:0016486) |
| 0.0 | 0.8 | GO:0032526 | response to retinoic acid(GO:0032526) |
| 0.0 | 0.2 | GO:0050832 | defense response to fungus(GO:0050832) |
| 0.0 | 5.0 | GO:0006412 | translation(GO:0006412) |
| 0.0 | 1.0 | GO:0007601 | visual perception(GO:0007601) |
| 0.0 | 1.2 | GO:0006626 | protein targeting to mitochondrion(GO:0006626) |
| 0.0 | 0.2 | GO:0018345 | protein palmitoylation(GO:0018345) |
Gene overrepresentation in cellular_component category:
| Log-likelihood per target | Total log-likelihood | Term | Description |
|---|---|---|---|
| 0.9 | 6.8 | GO:0005833 | hemoglobin complex(GO:0005833) |
| 0.8 | 3.3 | GO:0032127 | dense core granule membrane(GO:0032127) |
| 0.4 | 3.8 | GO:0030008 | TRAPP complex(GO:0030008) |
| 0.4 | 5.4 | GO:0042555 | MCM complex(GO:0042555) |
| 0.3 | 1.0 | GO:0043202 | lysosomal lumen(GO:0043202) |
| 0.3 | 0.9 | GO:0071001 | U4/U6 snRNP(GO:0071001) |
| 0.3 | 1.1 | GO:0030670 | phagocytic vesicle membrane(GO:0030670) |
| 0.3 | 1.3 | GO:0030485 | smooth muscle contractile fiber(GO:0030485) |
| 0.2 | 0.9 | GO:0043020 | NADPH oxidase complex(GO:0043020) |
| 0.2 | 0.9 | GO:0097651 | phosphatidylinositol 3-kinase complex, class I(GO:0097651) |
| 0.2 | 0.8 | GO:0097450 | astrocyte end-foot(GO:0097450) |
| 0.2 | 1.9 | GO:0031595 | nuclear proteasome complex(GO:0031595) |
| 0.2 | 1.9 | GO:0005832 | chaperonin-containing T-complex(GO:0005832) |
| 0.2 | 1.4 | GO:0017101 | aminoacyl-tRNA synthetase multienzyme complex(GO:0017101) |
| 0.2 | 0.6 | GO:0031209 | SCAR complex(GO:0031209) |
| 0.2 | 3.9 | GO:0001891 | phagocytic cup(GO:0001891) |
| 0.1 | 0.6 | GO:0032021 | NELF complex(GO:0032021) |
| 0.1 | 0.3 | GO:0032993 | replication fork(GO:0005657) replisome(GO:0030894) protein-DNA complex(GO:0032993) |
| 0.1 | 0.6 | GO:0009331 | glycerol-3-phosphate dehydrogenase complex(GO:0009331) |
| 0.1 | 0.4 | GO:0034274 | Atg12-Atg5-Atg16 complex(GO:0034274) |
| 0.1 | 5.4 | GO:0022627 | cytosolic small ribosomal subunit(GO:0022627) |
| 0.1 | 1.8 | GO:0005736 | DNA-directed RNA polymerase I complex(GO:0005736) |
| 0.1 | 0.7 | GO:0035032 | phosphatidylinositol 3-kinase complex, class III(GO:0035032) |
| 0.1 | 0.6 | GO:0005663 | DNA replication factor C complex(GO:0005663) |
| 0.1 | 0.6 | GO:1990726 | Lsm1-7-Pat1 complex(GO:1990726) |
| 0.1 | 0.6 | GO:0000800 | lateral element(GO:0000800) |
| 0.1 | 0.7 | GO:0036195 | muscle cell projection(GO:0036194) muscle cell projection membrane(GO:0036195) |
| 0.1 | 0.8 | GO:0008278 | cohesin complex(GO:0008278) |
| 0.1 | 0.6 | GO:0033588 | Elongator holoenzyme complex(GO:0033588) |
| 0.1 | 0.5 | GO:0016602 | CCAAT-binding factor complex(GO:0016602) |
| 0.1 | 1.0 | GO:0072669 | tRNA-splicing ligase complex(GO:0072669) |
| 0.1 | 1.1 | GO:0031588 | nucleotide-activated protein kinase complex(GO:0031588) |
| 0.1 | 0.7 | GO:0019773 | proteasome core complex, alpha-subunit complex(GO:0019773) |
| 0.1 | 0.5 | GO:0072357 | PTW/PP1 phosphatase complex(GO:0072357) |
| 0.1 | 1.0 | GO:0032156 | septin cytoskeleton(GO:0032156) |
| 0.1 | 4.5 | GO:0022625 | cytosolic large ribosomal subunit(GO:0022625) |
| 0.1 | 0.3 | GO:0005587 | collagen type IV trimer(GO:0005587) network-forming collagen trimer(GO:0098642) collagen network(GO:0098645) basement membrane collagen trimer(GO:0098651) |
| 0.1 | 0.9 | GO:0034098 | VCP-NPL4-UFD1 AAA ATPase complex(GO:0034098) |
| 0.1 | 0.3 | GO:0048237 | rough endoplasmic reticulum lumen(GO:0048237) |
| 0.1 | 0.6 | GO:1990023 | mitotic spindle midzone(GO:1990023) |
| 0.1 | 0.4 | GO:0005818 | aster(GO:0005818) |
| 0.1 | 0.5 | GO:0034709 | methylosome(GO:0034709) |
| 0.0 | 0.1 | GO:0005965 | protein farnesyltransferase complex(GO:0005965) |
| 0.0 | 4.5 | GO:0071013 | catalytic step 2 spliceosome(GO:0071013) |
| 0.0 | 2.0 | GO:0045335 | phagocytic vesicle(GO:0045335) |
| 0.0 | 0.1 | GO:0001651 | dense fibrillar component(GO:0001651) |
| 0.0 | 0.7 | GO:0001650 | fibrillar center(GO:0001650) |
| 0.0 | 1.2 | GO:0030687 | preribosome, large subunit precursor(GO:0030687) |
| 0.0 | 0.4 | GO:0005839 | proteasome core complex(GO:0005839) |
| 0.0 | 0.3 | GO:0044613 | nuclear pore central transport channel(GO:0044613) |
| 0.0 | 1.1 | GO:0000314 | organellar small ribosomal subunit(GO:0000314) mitochondrial small ribosomal subunit(GO:0005763) |
| 0.0 | 1.2 | GO:0000315 | organellar large ribosomal subunit(GO:0000315) mitochondrial large ribosomal subunit(GO:0005762) |
| 0.0 | 0.4 | GO:0034663 | endoplasmic reticulum chaperone complex(GO:0034663) |
| 0.0 | 2.5 | GO:0072562 | blood microparticle(GO:0072562) |
| 0.0 | 0.2 | GO:0000813 | ESCRT I complex(GO:0000813) |
| 0.0 | 1.1 | GO:0008180 | COP9 signalosome(GO:0008180) |
| 0.0 | 0.5 | GO:0043189 | NuA4 histone acetyltransferase complex(GO:0035267) H4/H2A histone acetyltransferase complex(GO:0043189) H4 histone acetyltransferase complex(GO:1902562) |
| 0.0 | 0.6 | GO:0005680 | anaphase-promoting complex(GO:0005680) |
| 0.0 | 2.0 | GO:0030315 | T-tubule(GO:0030315) |
| 0.0 | 1.0 | GO:0000307 | cyclin-dependent protein kinase holoenzyme complex(GO:0000307) |
| 0.0 | 0.8 | GO:0016592 | mediator complex(GO:0016592) |
| 0.0 | 0.3 | GO:0097539 | ciliary transition fiber(GO:0097539) |
| 0.0 | 0.7 | GO:0097610 | cleavage furrow(GO:0032154) cell surface furrow(GO:0097610) |
| 0.0 | 0.6 | GO:0032040 | small-subunit processome(GO:0032040) |
| 0.0 | 0.2 | GO:0017119 | Golgi transport complex(GO:0017119) |
| 0.0 | 0.1 | GO:0005742 | mitochondrial outer membrane translocase complex(GO:0005742) |
| 0.0 | 0.4 | GO:0097440 | apical dendrite(GO:0097440) |
| 0.0 | 0.4 | GO:0001772 | immunological synapse(GO:0001772) |
| 0.0 | 1.0 | GO:0005758 | mitochondrial intermembrane space(GO:0005758) |
| 0.0 | 0.9 | GO:0005840 | ribosome(GO:0005840) |
| 0.0 | 0.1 | GO:0005662 | DNA replication factor A complex(GO:0005662) |
| 0.0 | 0.4 | GO:0000502 | proteasome complex(GO:0000502) |
| 0.0 | 0.7 | GO:0001750 | photoreceptor outer segment(GO:0001750) |
| 0.0 | 0.1 | GO:0097136 | Bcl-2 family protein complex(GO:0097136) |
Gene overrepresentation in molecular_function category:
| Log-likelihood per target | Total log-likelihood | Term | Description |
|---|---|---|---|
| 1.4 | 6.8 | GO:0005344 | oxygen transporter activity(GO:0005344) |
| 0.6 | 4.1 | GO:0005094 | Rho GDP-dissociation inhibitor activity(GO:0005094) |
| 0.4 | 1.3 | GO:0034952 | 3-octaprenyl-4-hydroxybenzoate carboxy-lyase activity(GO:0008694) 2-hydroxy-3-carboxy-6-oxo-7-methylocta-2,4-dienoate decarboxylase activity(GO:0018791) bis(4-chlorophenyl)acetate decarboxylase activity(GO:0018792) 3,5-dibromo-4-hydroxybenzoate decarboxylase activity(GO:0018793) 2-hydroxyisobutyrate decarboxylase activity(GO:0018794) 2-hydroxy-2-methyl-1,3-dicarbonate decarboxylase activity(GO:0018795) 2-hydroxyisophthalate decarboxylase activity(GO:0034524) dimethylmalonate decarboxylase activity(GO:0034782) 2,4,4-trimethyl-3-oxopentanoate decarboxylase activity(GO:0034853) 4,4-dimethyl-3-oxopentanoate decarboxylase activity(GO:0034854) 2,3,6-trihydroxyisonicotinate decarboxylase activity(GO:0034879) phenanthrene-4,5-dicarboxylate decarboxylase activity(GO:0034923) pyrrole-2-carboxylate decarboxylase activity(GO:0034941) terephthalate decarboxylase activity(GO:0034947) malonate semialdehyde decarboxylase activity(GO:0034952) 5-amino-4-imidazole carboxylate lyase activity(GO:0043727) 2-keto-4-methylthiobutyrate aminotransferase activity(GO:0043728) 2-oxo-4-hydroxy-4-carboxy-5-ureidoimidazoline decarboxylase activity(GO:0051997) |
| 0.4 | 3.9 | GO:0032036 | myosin heavy chain binding(GO:0032036) |
| 0.4 | 0.4 | GO:0030487 | inositol-4,5-bisphosphate 5-phosphatase activity(GO:0030487) |
| 0.4 | 1.8 | GO:0019864 | IgG binding(GO:0019864) |
| 0.3 | 2.8 | GO:0031432 | titin binding(GO:0031432) |
| 0.3 | 1.0 | GO:0005118 | sevenless binding(GO:0005118) |
| 0.3 | 1.0 | GO:0031686 | A1 adenosine receptor binding(GO:0031686) |
| 0.3 | 1.2 | GO:0005347 | ATP transmembrane transporter activity(GO:0005347) |
| 0.3 | 1.1 | GO:0016175 | superoxide-generating NADPH oxidase activity(GO:0016175) |
| 0.3 | 1.9 | GO:0036402 | proteasome-activating ATPase activity(GO:0036402) |
| 0.3 | 1.3 | GO:0070051 | fibrinogen binding(GO:0070051) |
| 0.3 | 0.8 | GO:0042289 | MHC class II protein binding(GO:0042289) |
| 0.2 | 0.6 | GO:0010484 | H3 histone acetyltransferase activity(GO:0010484) |
| 0.2 | 0.6 | GO:0004368 | glycerol-3-phosphate dehydrogenase activity(GO:0004368) |
| 0.2 | 2.8 | GO:0070180 | large ribosomal subunit rRNA binding(GO:0070180) |
| 0.2 | 1.0 | GO:0030621 | U4 snRNA binding(GO:0030621) |
| 0.2 | 1.0 | GO:0032767 | copper-dependent protein binding(GO:0032767) |
| 0.2 | 3.3 | GO:0017166 | vinculin binding(GO:0017166) |
| 0.2 | 0.6 | GO:0004566 | beta-glucuronidase activity(GO:0004566) |
| 0.2 | 0.5 | GO:0004814 | arginine-tRNA ligase activity(GO:0004814) arginine binding(GO:0034618) |
| 0.2 | 0.6 | GO:0098519 | nucleotide phosphatase activity, acting on free nucleotides(GO:0098519) |
| 0.2 | 0.5 | GO:0004140 | dephospho-CoA kinase activity(GO:0004140) |
| 0.1 | 0.9 | GO:0036435 | K48-linked polyubiquitin binding(GO:0036435) |
| 0.1 | 1.0 | GO:0035368 | selenocysteine insertion sequence binding(GO:0035368) |
| 0.1 | 0.8 | GO:0001179 | RNA polymerase I transcription factor binding(GO:0001179) |
| 0.1 | 2.2 | GO:0015129 | lactate transmembrane transporter activity(GO:0015129) |
| 0.1 | 0.5 | GO:0004392 | heme oxygenase (decyclizing) activity(GO:0004392) |
| 0.1 | 1.6 | GO:0035014 | phosphatidylinositol 3-kinase regulator activity(GO:0035014) |
| 0.1 | 0.4 | GO:0035673 | oligopeptide transmembrane transporter activity(GO:0035673) |
| 0.1 | 0.6 | GO:0008454 | alpha-1,3-mannosylglycoprotein 4-beta-N-acetylglucosaminyltransferase activity(GO:0008454) |
| 0.1 | 5.0 | GO:0017112 | Rab guanyl-nucleotide exchange factor activity(GO:0017112) |
| 0.1 | 0.9 | GO:0005021 | vascular endothelial growth factor-activated receptor activity(GO:0005021) |
| 0.1 | 0.4 | GO:0019776 | Atg8 ligase activity(GO:0019776) |
| 0.1 | 0.5 | GO:0045131 | pre-mRNA branch point binding(GO:0045131) |
| 0.1 | 1.1 | GO:0004679 | AMP-activated protein kinase activity(GO:0004679) |
| 0.1 | 1.1 | GO:0071933 | Arp2/3 complex binding(GO:0071933) |
| 0.1 | 0.7 | GO:1901567 | icosanoid binding(GO:0050542) arachidonic acid binding(GO:0050544) fatty acid derivative binding(GO:1901567) |
| 0.1 | 1.9 | GO:0004435 | phosphatidylinositol phospholipase C activity(GO:0004435) |
| 0.1 | 1.1 | GO:0015299 | solute:proton antiporter activity(GO:0015299) |
| 0.1 | 1.1 | GO:0034951 | pivalyl-CoA mutase activity(GO:0034784) o-hydroxylaminobenzoate mutase activity(GO:0034951) lupeol synthase activity(GO:0042299) beta-amyrin synthase activity(GO:0042300) baruol synthase activity(GO:0080011) |
| 0.1 | 0.6 | GO:0004645 | phosphorylase activity(GO:0004645) |
| 0.1 | 1.0 | GO:0009931 | calcium-dependent protein serine/threonine kinase activity(GO:0009931) |
| 0.1 | 3.3 | GO:0017017 | MAP kinase tyrosine/serine/threonine phosphatase activity(GO:0017017) |
| 0.1 | 1.6 | GO:0008349 | MAP kinase kinase kinase kinase activity(GO:0008349) |
| 0.1 | 0.3 | GO:0042731 | PH domain binding(GO:0042731) |
| 0.1 | 0.6 | GO:0000150 | recombinase activity(GO:0000150) |
| 0.1 | 3.9 | GO:0004003 | ATP-dependent DNA helicase activity(GO:0004003) |
| 0.1 | 0.4 | GO:0061676 | importin-alpha family protein binding(GO:0061676) |
| 0.1 | 0.7 | GO:0030676 | Rac guanyl-nucleotide exchange factor activity(GO:0030676) |
| 0.1 | 0.9 | GO:0005522 | profilin binding(GO:0005522) |
| 0.1 | 0.9 | GO:0001054 | RNA polymerase I activity(GO:0001054) |
| 0.1 | 1.0 | GO:0044183 | protein binding involved in protein folding(GO:0044183) |
| 0.1 | 0.6 | GO:0043142 | single-stranded DNA-dependent ATPase activity(GO:0043142) |
| 0.1 | 1.0 | GO:0045125 | bioactive lipid receptor activity(GO:0045125) |
| 0.1 | 1.1 | GO:0031681 | G-protein beta-subunit binding(GO:0031681) |
| 0.1 | 0.8 | GO:0031386 | protein tag(GO:0031386) |
| 0.1 | 1.0 | GO:0003678 | DNA helicase activity(GO:0003678) |
| 0.1 | 0.5 | GO:0008097 | 5S rRNA binding(GO:0008097) |
| 0.1 | 0.6 | GO:0008568 | microtubule-severing ATPase activity(GO:0008568) |
| 0.1 | 0.6 | GO:0003680 | AT DNA binding(GO:0003680) |
| 0.1 | 0.4 | GO:0070191 | methionine-R-sulfoxide reductase activity(GO:0070191) |
| 0.1 | 0.4 | GO:0016671 | oxidoreductase activity, acting on a sulfur group of donors, disulfide as acceptor(GO:0016671) |
| 0.1 | 0.6 | GO:0004526 | ribonuclease P activity(GO:0004526) |
| 0.0 | 0.5 | GO:0015187 | glycine transmembrane transporter activity(GO:0015187) |
| 0.0 | 1.1 | GO:0004298 | threonine-type endopeptidase activity(GO:0004298) threonine-type peptidase activity(GO:0070003) |
| 0.0 | 2.8 | GO:0019843 | rRNA binding(GO:0019843) |
| 0.0 | 0.1 | GO:0004660 | protein farnesyltransferase activity(GO:0004660) |
| 0.0 | 0.2 | GO:0045028 | G-protein coupled nucleotide receptor activity(GO:0001608) G-protein coupled purinergic nucleotide receptor activity(GO:0045028) |
| 0.0 | 0.5 | GO:0097371 | MDM2/MDM4 family protein binding(GO:0097371) |
| 0.0 | 0.3 | GO:0052630 | CTP:2,3-di-O-geranylgeranyl-sn-glycero-1-phosphate cytidyltransferase activity(GO:0043338) phospholactate guanylyltransferase activity(GO:0043814) ATP:coenzyme F420 adenylyltransferase activity(GO:0043910) UDP-N-acetylgalactosamine diphosphorylase activity(GO:0052630) |
| 0.0 | 0.4 | GO:0034711 | inhibin binding(GO:0034711) |
| 0.0 | 0.8 | GO:0005044 | scavenger receptor activity(GO:0005044) |
| 0.0 | 1.0 | GO:0003746 | translation elongation factor activity(GO:0003746) |
| 0.0 | 0.5 | GO:0008484 | sulfuric ester hydrolase activity(GO:0008484) |
| 0.0 | 6.9 | GO:0003735 | structural constituent of ribosome(GO:0003735) |
| 0.0 | 0.8 | GO:0005104 | fibroblast growth factor receptor binding(GO:0005104) |
| 0.0 | 0.5 | GO:0048407 | platelet-derived growth factor binding(GO:0048407) |
| 0.0 | 0.1 | GO:0047192 | 1-alkylglycerophosphocholine O-acetyltransferase activity(GO:0047192) |
| 0.0 | 0.1 | GO:0001160 | transcription termination site sequence-specific DNA binding(GO:0001147) transcription termination site DNA binding(GO:0001160) |
| 0.0 | 1.4 | GO:0001205 | transcriptional activator activity, RNA polymerase II distal enhancer sequence-specific binding(GO:0001205) |
| 0.0 | 1.6 | GO:0004712 | protein serine/threonine/tyrosine kinase activity(GO:0004712) |
| 0.0 | 1.2 | GO:0005109 | frizzled binding(GO:0005109) |
| 0.0 | 0.2 | GO:0046790 | virion binding(GO:0046790) |
| 0.0 | 0.6 | GO:0016891 | endoribonuclease activity, producing 5'-phosphomonoesters(GO:0016891) |
| 0.0 | 0.5 | GO:0043539 | protein serine/threonine kinase activator activity(GO:0043539) |
| 0.0 | 0.1 | GO:0004694 | eukaryotic translation initiation factor 2alpha kinase activity(GO:0004694) |
| 0.0 | 0.3 | GO:0005487 | nucleocytoplasmic transporter activity(GO:0005487) |
| 0.0 | 0.1 | GO:0051434 | BH3 domain binding(GO:0051434) |
| 0.0 | 0.7 | GO:0008138 | protein tyrosine/serine/threonine phosphatase activity(GO:0008138) |
| 0.0 | 0.8 | GO:0051539 | 4 iron, 4 sulfur cluster binding(GO:0051539) |
| 0.0 | 0.5 | GO:0008327 | methyl-CpG binding(GO:0008327) |
| 0.0 | 1.9 | GO:0005125 | cytokine activity(GO:0005125) |
| 0.0 | 0.9 | GO:0016876 | aminoacyl-tRNA ligase activity(GO:0004812) ligase activity, forming carbon-oxygen bonds(GO:0016875) ligase activity, forming aminoacyl-tRNA and related compounds(GO:0016876) |
| 0.0 | 0.5 | GO:0001671 | ATPase activator activity(GO:0001671) |
| 0.0 | 0.3 | GO:0008143 | poly(A) binding(GO:0008143) |
| 0.0 | 0.9 | GO:0097472 | cyclin-dependent protein serine/threonine kinase activity(GO:0004693) cyclin-dependent protein kinase activity(GO:0097472) |
| 0.0 | 0.8 | GO:0004864 | protein phosphatase inhibitor activity(GO:0004864) |
| 0.0 | 0.3 | GO:0005542 | folic acid binding(GO:0005542) |
| 0.0 | 1.3 | GO:0003705 | transcription factor activity, RNA polymerase II distal enhancer sequence-specific binding(GO:0003705) |
| 0.0 | 1.1 | GO:0003743 | translation initiation factor activity(GO:0003743) |
| 0.0 | 0.3 | GO:0043325 | phosphatidylinositol-3,4-bisphosphate binding(GO:0043325) |
| 0.0 | 0.4 | GO:0001965 | G-protein alpha-subunit binding(GO:0001965) |
| 0.0 | 0.7 | GO:0020037 | heme binding(GO:0020037) |
| 0.0 | 0.1 | GO:0052872 | 3-(3-hydroxyphenyl)propionate hydroxylase activity(GO:0008688) 4-chlorobenzaldehyde oxidase activity(GO:0018471) 3,5-xylenol methylhydroxylase activity(GO:0018630) phenylacetate hydroxylase activity(GO:0018631) 4-nitrophenol 4-monooxygenase activity(GO:0018632) dimethyl sulfide monooxygenase activity(GO:0018633) alpha-pinene monooxygenase [NADH] activity(GO:0018634) phenanthrene 9,10-monooxygenase activity(GO:0018636) 1-hydroxy-2-naphthoate hydroxylase activity(GO:0018637) toluene 4-monooxygenase activity(GO:0018638) xylene monooxygenase activity(GO:0018639) dibenzothiophene monooxygenase activity(GO:0018640) 6-hydroxy-3-methyl-2-oxo-1,2-dihydroquinoline 6-monooxygenase activity(GO:0018641) chlorophenol 4-monooxygenase activity(GO:0018642) carbon disulfide oxygenase activity(GO:0018643) toluene 2-monooxygenase activity(GO:0018644) 1-hydroxy-2-oxolimonene 1,2-monooxygenase activity(GO:0018646) phenanthrene 1,2-monooxygenase activity(GO:0018647) tetrahydrofuran hydroxylase activity(GO:0018649) styrene monooxygenase activity(GO:0018650) toluene-4-sulfonate monooxygenase activity(GO:0018651) toluene-sulfonate methyl-monooxygenase activity(GO:0018652) 3-methyl-2-oxo-1,2-dihydroquinoline 6-monooxygenase activity(GO:0018653) 2-hydroxy-phenylacetate hydroxylase activity(GO:0018654) 2-oxo-delta3-4,5,5-trimethylcyclopentenylacetyl-CoA 1,2-monooxygenase activity(GO:0018655) phenanthrene 3,4-monooxygenase activity(GO:0018656) toluene 3-monooxygenase activity(GO:0018657) 4-hydroxyphenylacetate,NADH:oxygen oxidoreductase (3-hydroxylating) activity(GO:0018660) limonene monooxygenase activity(GO:0019113) 2-methylnaphthalene hydroxylase activity(GO:0034526) 1-methylnaphthalene hydroxylase activity(GO:0034534) bisphenol A hydroxylase A activity(GO:0034560) salicylate 5-hydroxylase activity(GO:0034785) isobutylamine N-hydroxylase activity(GO:0034791) branched-chain dodecylbenzene sulfonate monooxygenase activity(GO:0034802) 3-HSA hydroxylase activity(GO:0034819) 4-hydroxypyridine-3-hydroxylase activity(GO:0034894) 2-octaprenyl-3-methyl-6-methoxy-1,4-benzoquinol hydroxylase activity(GO:0043719) 6-hydroxynicotinate 3-monooxygenase activity(GO:0043731) tocotrienol omega-hydroxylase activity(GO:0052872) thalianol hydroxylase activity(GO:0080014) |
| 0.0 | 0.3 | GO:0005035 | tumor necrosis factor-activated receptor activity(GO:0005031) death receptor activity(GO:0005035) |
| 0.0 | 0.5 | GO:0004715 | non-membrane spanning protein tyrosine kinase activity(GO:0004715) |
| 0.0 | 0.3 | GO:0003841 | 1-acylglycerol-3-phosphate O-acyltransferase activity(GO:0003841) |
| 0.0 | 0.8 | GO:0004714 | transmembrane receptor protein tyrosine kinase activity(GO:0004714) |
| 0.0 | 0.7 | GO:0035591 | signaling adaptor activity(GO:0035591) |
| 0.0 | 0.8 | GO:0003730 | mRNA 3'-UTR binding(GO:0003730) |
| 0.0 | 1.3 | GO:1901981 | phosphatidylinositol phosphate binding(GO:1901981) |
| 0.0 | 0.4 | GO:0048365 | Rac GTPase binding(GO:0048365) |