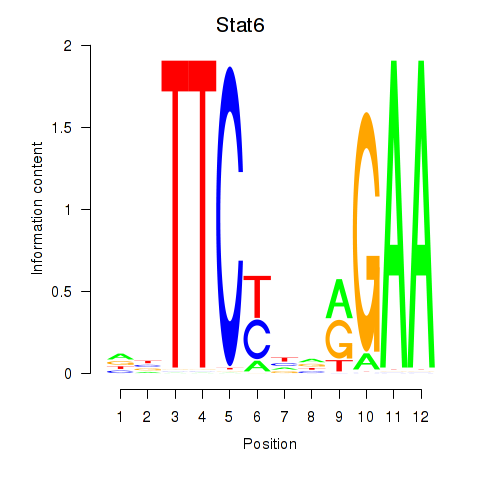
Motif ID: Stat6
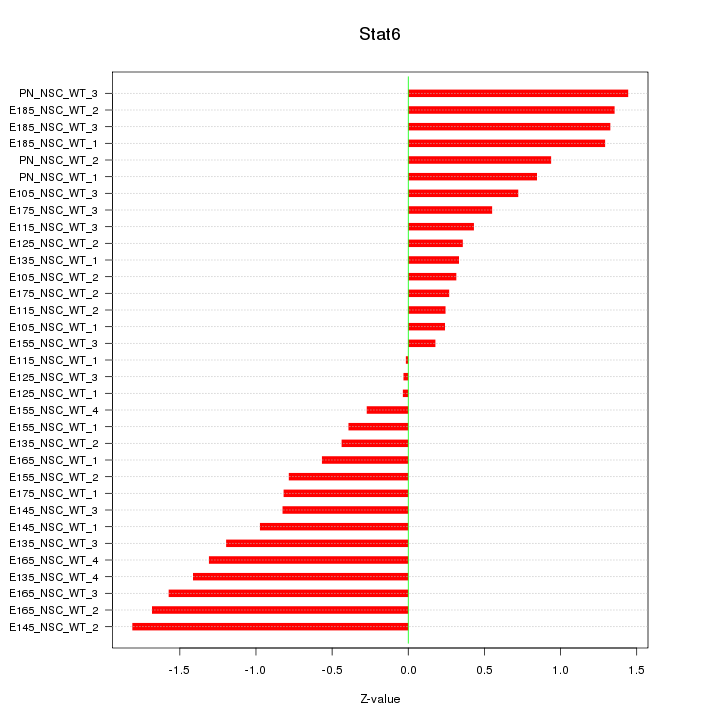
Z-value: 0.920
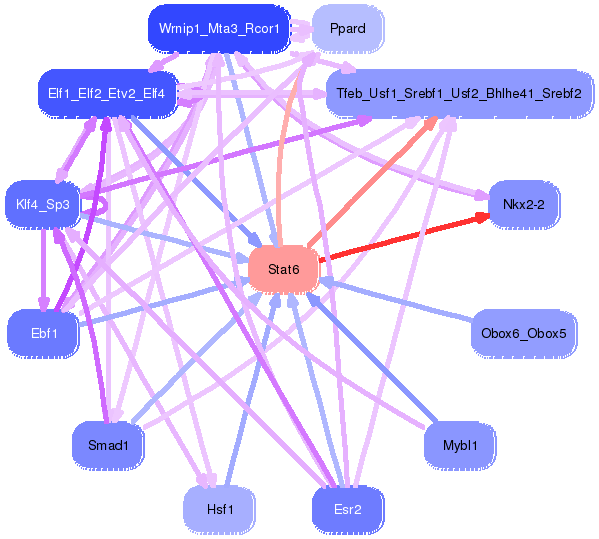
Transcription factors associated with Stat6:
| Gene Symbol | Entrez ID | Gene Name |
|---|---|---|
| Stat6 | ENSMUSG00000002147.12 | Stat6 |
Activity-expression correlation:
| Gene Symbol | Promoter | Pearson corr. coef. | P-value | Plot |
|---|---|---|---|---|
| Stat6 | mm10_v2_chr10_+_127642975_127643034 | 0.49 | 3.8e-03 | Click! |

Top targets:
Gene overrepresentation in biological_process category:
| Log-likelihood per target | Total log-likelihood | Term | Description |
|---|---|---|---|
| 1.3 | 6.3 | GO:0070295 | renal water absorption(GO:0070295) |
| 1.2 | 3.6 | GO:0021529 | spinal cord oligodendrocyte cell differentiation(GO:0021529) spinal cord oligodendrocyte cell fate specification(GO:0021530) |
| 0.7 | 2.2 | GO:1902524 | negative regulation of interferon-alpha production(GO:0032687) interferon-alpha biosynthetic process(GO:0045349) regulation of interferon-alpha biosynthetic process(GO:0045354) negative regulation of interferon-beta biosynthetic process(GO:0045358) positive regulation of protein K48-linked ubiquitination(GO:1902524) |
| 0.6 | 1.7 | GO:0086017 | renin secretion into blood stream(GO:0002001) cell communication by chemical coupling(GO:0010643) Purkinje myocyte action potential(GO:0086017) regulation of renin secretion into blood stream(GO:1900133) |
| 0.5 | 2.4 | GO:0036151 | phosphatidylcholine acyl-chain remodeling(GO:0036151) |
| 0.4 | 1.6 | GO:0001550 | ovarian cumulus expansion(GO:0001550) fused antrum stage(GO:0048165) |
| 0.4 | 1.6 | GO:0018242 | protein O-linked glycosylation via serine(GO:0018242) |
| 0.4 | 2.6 | GO:1900747 | negative regulation of vascular endothelial growth factor signaling pathway(GO:1900747) |
| 0.4 | 2.1 | GO:0032713 | negative regulation of interleukin-4 production(GO:0032713) |
| 0.3 | 1.6 | GO:2000298 | regulation of Rho-dependent protein serine/threonine kinase activity(GO:2000298) |
| 0.3 | 0.9 | GO:0045659 | regulation of neutrophil differentiation(GO:0045658) negative regulation of neutrophil differentiation(GO:0045659) |
| 0.3 | 5.3 | GO:0048642 | negative regulation of skeletal muscle tissue development(GO:0048642) |
| 0.3 | 2.8 | GO:0030388 | fructose 1,6-bisphosphate metabolic process(GO:0030388) |
| 0.3 | 1.6 | GO:0098700 | aminergic neurotransmitter loading into synaptic vesicle(GO:0015842) neurotransmitter loading into synaptic vesicle(GO:0098700) |
| 0.3 | 2.6 | GO:2001214 | positive regulation of vasculogenesis(GO:2001214) |
| 0.2 | 6.6 | GO:0045662 | negative regulation of myoblast differentiation(GO:0045662) |
| 0.2 | 0.7 | GO:0006106 | fumarate metabolic process(GO:0006106) |
| 0.2 | 0.8 | GO:0051708 | intracellular transport of viral protein in host cell(GO:0019060) symbiont intracellular protein transport in host(GO:0030581) cytosol to ER transport(GO:0046967) intracellular protein transport in other organism involved in symbiotic interaction(GO:0051708) |
| 0.2 | 1.5 | GO:0003062 | regulation of heart rate by chemical signal(GO:0003062) |
| 0.2 | 9.5 | GO:0071300 | cellular response to retinoic acid(GO:0071300) |
| 0.2 | 0.2 | GO:0070315 | G1 to G0 transition involved in cell differentiation(GO:0070315) |
| 0.2 | 2.4 | GO:0043011 | myeloid dendritic cell differentiation(GO:0043011) |
| 0.2 | 1.3 | GO:0016081 | synaptic vesicle docking(GO:0016081) |
| 0.2 | 0.2 | GO:0071220 | response to bacterial lipoprotein(GO:0032493) response to bacterial lipopeptide(GO:0070339) cellular response to bacterial lipoprotein(GO:0071220) cellular response to bacterial lipopeptide(GO:0071221) response to diacyl bacterial lipopeptide(GO:0071724) cellular response to diacyl bacterial lipopeptide(GO:0071726) |
| 0.1 | 0.7 | GO:0035331 | negative regulation of hippo signaling(GO:0035331) |
| 0.1 | 0.5 | GO:2000383 | regulation of ectoderm development(GO:2000383) negative regulation of ectoderm development(GO:2000384) |
| 0.1 | 0.5 | GO:0006526 | arginine biosynthetic process(GO:0006526) |
| 0.1 | 0.7 | GO:0006384 | transcription initiation from RNA polymerase III promoter(GO:0006384) |
| 0.1 | 0.4 | GO:0002591 | positive regulation of antigen processing and presentation of peptide antigen via MHC class I(GO:0002591) |
| 0.1 | 0.3 | GO:0060423 | limb joint morphogenesis(GO:0036022) embryonic skeletal limb joint morphogenesis(GO:0036023) negative regulation of mitotic cell cycle, embryonic(GO:0045976) foregut regionalization(GO:0060423) lung field specification(GO:0060424) lung induction(GO:0060492) positive regulation of epithelial cell proliferation involved in prostate gland development(GO:0060769) regulation of branching involved in lung morphogenesis(GO:0061046) positive regulation of branching involved in lung morphogenesis(GO:0061047) canonical Wnt signaling pathway involved in positive regulation of cardiac outflow tract cell proliferation(GO:0061324) regulation of cell proliferation involved in outflow tract morphogenesis(GO:1901963) regulation of histone demethylase activity (H3-K4 specific)(GO:1904173) |
| 0.1 | 0.2 | GO:0045963 | negative regulation of catecholamine metabolic process(GO:0045914) negative regulation of dopamine metabolic process(GO:0045963) |
| 0.1 | 1.2 | GO:0048280 | vesicle fusion with Golgi apparatus(GO:0048280) |
| 0.1 | 1.7 | GO:0051127 | positive regulation of actin nucleation(GO:0051127) |
| 0.1 | 2.2 | GO:1903077 | negative regulation of protein localization to plasma membrane(GO:1903077) negative regulation of protein localization to cell periphery(GO:1904376) |
| 0.1 | 1.9 | GO:0001921 | positive regulation of receptor recycling(GO:0001921) |
| 0.1 | 0.7 | GO:0090385 | phagosome-lysosome fusion(GO:0090385) |
| 0.1 | 0.7 | GO:0000290 | deadenylation-dependent decapping of nuclear-transcribed mRNA(GO:0000290) |
| 0.1 | 0.3 | GO:1901165 | positive regulation of trophoblast cell migration(GO:1901165) |
| 0.1 | 2.5 | GO:0001937 | negative regulation of endothelial cell proliferation(GO:0001937) |
| 0.1 | 1.1 | GO:0019835 | cytolysis(GO:0019835) |
| 0.1 | 0.6 | GO:0090435 | protein localization to nuclear envelope(GO:0090435) |
| 0.1 | 0.2 | GO:0052428 | modulation of molecular function in other organism(GO:0044359) negative regulation of molecular function in other organism(GO:0044362) negative regulation of molecular function in other organism involved in symbiotic interaction(GO:0052204) modulation of molecular function in other organism involved in symbiotic interaction(GO:0052205) negative regulation by host of symbiont molecular function(GO:0052405) modification by host of symbiont molecular function(GO:0052428) |
| 0.1 | 3.2 | GO:0050830 | defense response to Gram-positive bacterium(GO:0050830) |
| 0.0 | 0.1 | GO:0001803 | antibody-dependent cellular cytotoxicity(GO:0001788) type III hypersensitivity(GO:0001802) regulation of type III hypersensitivity(GO:0001803) positive regulation of type III hypersensitivity(GO:0001805) |
| 0.0 | 0.2 | GO:2000427 | positive regulation of apoptotic cell clearance(GO:2000427) |
| 0.0 | 0.3 | GO:1903352 | ornithine transport(GO:0015822) L-ornithine transmembrane transport(GO:1903352) |
| 0.0 | 0.2 | GO:0009235 | cobalamin metabolic process(GO:0009235) |
| 0.0 | 1.1 | GO:0032008 | positive regulation of TOR signaling(GO:0032008) |
| 0.0 | 1.0 | GO:0045722 | positive regulation of gluconeogenesis(GO:0045722) |
| 0.0 | 1.5 | GO:0007032 | endosome organization(GO:0007032) |
| 0.0 | 1.4 | GO:0043029 | T cell homeostasis(GO:0043029) |
| 0.0 | 1.0 | GO:0006730 | one-carbon metabolic process(GO:0006730) |
| 0.0 | 3.1 | GO:0048814 | regulation of dendrite morphogenesis(GO:0048814) |
| 0.0 | 0.2 | GO:0032020 | ISG15-protein conjugation(GO:0032020) |
| 0.0 | 1.5 | GO:0043627 | response to estrogen(GO:0043627) |
| 0.0 | 0.5 | GO:0010172 | embryonic body morphogenesis(GO:0010172) |
| 0.0 | 0.5 | GO:0018345 | protein palmitoylation(GO:0018345) |
| 0.0 | 0.7 | GO:0051489 | regulation of filopodium assembly(GO:0051489) |
| 0.0 | 0.3 | GO:0070584 | mitochondrion morphogenesis(GO:0070584) |
| 0.0 | 0.4 | GO:0000027 | ribosomal large subunit assembly(GO:0000027) |
| 0.0 | 0.2 | GO:0021891 | olfactory bulb interneuron development(GO:0021891) |
| 0.0 | 0.0 | GO:0070682 | proteasome regulatory particle assembly(GO:0070682) |
Gene overrepresentation in cellular_component category:
| Log-likelihood per target | Total log-likelihood | Term | Description |
|---|---|---|---|
| 0.9 | 3.4 | GO:0031092 | platelet alpha granule membrane(GO:0031092) |
| 0.4 | 1.6 | GO:0070022 | transforming growth factor beta receptor homodimeric complex(GO:0070022) |
| 0.2 | 1.1 | GO:1990131 | EGO complex(GO:0034448) Gtr1-Gtr2 GTPase complex(GO:1990131) |
| 0.2 | 2.8 | GO:0035686 | sperm fibrous sheath(GO:0035686) |
| 0.1 | 2.6 | GO:0098644 | complex of collagen trimers(GO:0098644) |
| 0.1 | 1.7 | GO:0005922 | connexon complex(GO:0005922) |
| 0.1 | 0.8 | GO:0042825 | TAP complex(GO:0042825) |
| 0.1 | 4.7 | GO:0005834 | heterotrimeric G-protein complex(GO:0005834) |
| 0.1 | 6.3 | GO:0009925 | basal plasma membrane(GO:0009925) |
| 0.1 | 2.4 | GO:0097038 | perinuclear endoplasmic reticulum(GO:0097038) |
| 0.1 | 0.2 | GO:0044299 | C-fiber(GO:0044299) |
| 0.1 | 1.3 | GO:0044300 | cerebellar mossy fiber(GO:0044300) |
| 0.1 | 0.5 | GO:0045298 | tubulin complex(GO:0045298) |
| 0.0 | 0.4 | GO:0046581 | intercellular canaliculus(GO:0046581) |
| 0.0 | 0.7 | GO:0045239 | tricarboxylic acid cycle enzyme complex(GO:0045239) |
| 0.0 | 0.3 | GO:0034750 | Scrib-APC-beta-catenin complex(GO:0034750) |
| 0.0 | 0.7 | GO:0005666 | DNA-directed RNA polymerase III complex(GO:0005666) |
| 0.0 | 2.2 | GO:0031225 | anchored component of membrane(GO:0031225) |
| 0.0 | 1.9 | GO:0031985 | Golgi cisterna(GO:0031985) |
| 0.0 | 0.4 | GO:0031932 | TORC2 complex(GO:0031932) |
| 0.0 | 0.2 | GO:0046696 | lipopolysaccharide receptor complex(GO:0046696) |
| 0.0 | 0.8 | GO:0000314 | organellar small ribosomal subunit(GO:0000314) mitochondrial small ribosomal subunit(GO:0005763) |
| 0.0 | 0.3 | GO:0042645 | nucleoid(GO:0009295) mitochondrial nucleoid(GO:0042645) |
| 0.0 | 0.1 | GO:0044613 | nuclear pore central transport channel(GO:0044613) Flemming body(GO:0090543) |
| 0.0 | 0.8 | GO:0016459 | myosin complex(GO:0016459) |
| 0.0 | 0.7 | GO:0005788 | endoplasmic reticulum lumen(GO:0005788) |
| 0.0 | 0.6 | GO:0000922 | spindle pole(GO:0000922) |
| 0.0 | 1.4 | GO:0000776 | kinetochore(GO:0000776) |
| 0.0 | 6.4 | GO:0005813 | centrosome(GO:0005813) |
Gene overrepresentation in molecular_function category:
| Log-likelihood per target | Total log-likelihood | Term | Description |
|---|---|---|---|
| 0.9 | 6.3 | GO:0015288 | porin activity(GO:0015288) |
| 0.6 | 2.4 | GO:0030156 | benzodiazepine receptor binding(GO:0030156) |
| 0.5 | 4.7 | GO:0042301 | phosphate ion binding(GO:0042301) |
| 0.5 | 2.8 | GO:0004332 | fructose-bisphosphate aldolase activity(GO:0004332) |
| 0.4 | 1.6 | GO:0036468 | aromatic-L-amino-acid decarboxylase activity(GO:0004058) L-dopa decarboxylase activity(GO:0036468) |
| 0.3 | 1.7 | GO:0071253 | connexin binding(GO:0071253) |
| 0.3 | 2.2 | GO:0030550 | acetylcholine receptor inhibitor activity(GO:0030550) |
| 0.2 | 0.7 | GO:0000340 | RNA 7-methylguanosine cap binding(GO:0000340) |
| 0.2 | 0.8 | GO:0023029 | peptide antigen-transporting ATPase activity(GO:0015433) MHC class Ib protein binding(GO:0023029) tapasin binding(GO:0046980) |
| 0.2 | 1.6 | GO:0005025 | transforming growth factor beta receptor activity, type I(GO:0005025) |
| 0.2 | 0.7 | GO:0004954 | icosanoid receptor activity(GO:0004953) prostanoid receptor activity(GO:0004954) prostaglandin receptor activity(GO:0004955) |
| 0.2 | 1.6 | GO:0035615 | clathrin adaptor activity(GO:0035615) endocytic adaptor activity(GO:0098748) |
| 0.1 | 2.6 | GO:0015026 | coreceptor activity(GO:0015026) |
| 0.1 | 2.4 | GO:0005035 | tumor necrosis factor-activated receptor activity(GO:0005031) death receptor activity(GO:0005035) |
| 0.1 | 0.5 | GO:0016812 | hydrolase activity, acting on carbon-nitrogen (but not peptide) bonds, in cyclic amides(GO:0016812) |
| 0.1 | 4.6 | GO:0005504 | fatty acid binding(GO:0005504) |
| 0.1 | 6.0 | GO:0050840 | extracellular matrix binding(GO:0050840) |
| 0.1 | 4.6 | GO:0030332 | cyclin binding(GO:0030332) |
| 0.1 | 3.2 | GO:0043027 | cysteine-type endopeptidase inhibitor activity involved in apoptotic process(GO:0043027) |
| 0.1 | 1.0 | GO:0004089 | carbonate dehydratase activity(GO:0004089) |
| 0.1 | 1.1 | GO:0010314 | phosphatidylinositol-5-phosphate binding(GO:0010314) |
| 0.1 | 1.4 | GO:0031702 | angiotensin receptor binding(GO:0031701) type 1 angiotensin receptor binding(GO:0031702) |
| 0.1 | 1.6 | GO:0004653 | polypeptide N-acetylgalactosaminyltransferase activity(GO:0004653) |
| 0.1 | 3.4 | GO:0001205 | transcriptional activator activity, RNA polymerase II distal enhancer sequence-specific binding(GO:0001205) |
| 0.1 | 0.4 | GO:0008559 | xenobiotic-transporting ATPase activity(GO:0008559) |
| 0.1 | 0.3 | GO:0001849 | complement component C1q binding(GO:0001849) |
| 0.1 | 0.2 | GO:0016206 | catechol O-methyltransferase activity(GO:0016206) |
| 0.1 | 0.8 | GO:0055106 | ubiquitin-protein transferase regulator activity(GO:0055106) |
| 0.1 | 0.3 | GO:0043426 | MRF binding(GO:0043426) |
| 0.0 | 0.1 | GO:0019770 | IgG receptor activity(GO:0019770) |
| 0.0 | 0.2 | GO:0031727 | CCR2 chemokine receptor binding(GO:0031727) |
| 0.0 | 2.5 | GO:0030971 | receptor tyrosine kinase binding(GO:0030971) |
| 0.0 | 0.1 | GO:0048045 | 4-hydroxybenzoate octaprenyltransferase activity(GO:0008412) protoheme IX farnesyltransferase activity(GO:0008495) (S)-2,3-di-O-geranylgeranylglyceryl phosphate synthase activity(GO:0043888) cadaverine aminopropyltransferase activity(GO:0043918) agmatine aminopropyltransferase activity(GO:0043919) 1,4-dihydroxy-2-naphthoate octaprenyltransferase activity(GO:0046428) trans-pentaprenyltranstransferase activity(GO:0048045) ATP dimethylallyltransferase activity(GO:0052622) ADP dimethylallyltransferase activity(GO:0052623) |
| 0.0 | 0.3 | GO:1990188 | euchromatin binding(GO:1990188) |
| 0.0 | 0.2 | GO:0070891 | lipoteichoic acid binding(GO:0070891) |
| 0.0 | 0.3 | GO:0015189 | L-ornithine transmembrane transporter activity(GO:0000064) arginine transmembrane transporter activity(GO:0015181) L-lysine transmembrane transporter activity(GO:0015189) |
| 0.0 | 0.7 | GO:0001056 | RNA polymerase III activity(GO:0001056) |
| 0.0 | 0.2 | GO:0031419 | cobalamin binding(GO:0031419) |
| 0.0 | 0.1 | GO:0051425 | PTB domain binding(GO:0051425) |
| 0.0 | 1.1 | GO:0004697 | protein kinase C activity(GO:0004697) |
| 0.0 | 0.2 | GO:0042296 | ISG15 transferase activity(GO:0042296) |
| 0.0 | 0.7 | GO:0017160 | Ral GTPase binding(GO:0017160) |
| 0.0 | 1.5 | GO:0001105 | RNA polymerase II transcription coactivator activity(GO:0001105) |
| 0.0 | 0.4 | GO:0070180 | large ribosomal subunit rRNA binding(GO:0070180) |
| 0.0 | 1.0 | GO:0004864 | protein phosphatase inhibitor activity(GO:0004864) |
| 0.0 | 0.5 | GO:0019706 | protein-cysteine S-palmitoyltransferase activity(GO:0019706) |
| 0.0 | 3.4 | GO:0051015 | actin filament binding(GO:0051015) |
| 0.0 | 0.6 | GO:0001671 | ATPase activator activity(GO:0001671) |
| 0.0 | 0.1 | GO:0004307 | ethanolaminephosphotransferase activity(GO:0004307) |
| 0.0 | 0.3 | GO:0003841 | 1-acylglycerol-3-phosphate O-acyltransferase activity(GO:0003841) lysophosphatidic acid acyltransferase activity(GO:0042171) |
| 0.0 | 0.1 | GO:0000146 | microfilament motor activity(GO:0000146) |
| 0.0 | 1.2 | GO:0019905 | syntaxin binding(GO:0019905) |
| 0.0 | 0.9 | GO:0004252 | serine-type endopeptidase activity(GO:0004252) |
| 0.0 | 0.7 | GO:0046527 | glucosyltransferase activity(GO:0046527) |
| 0.0 | 0.7 | GO:0016836 | hydro-lyase activity(GO:0016836) |
| 0.0 | 0.3 | GO:0003887 | DNA-directed DNA polymerase activity(GO:0003887) |