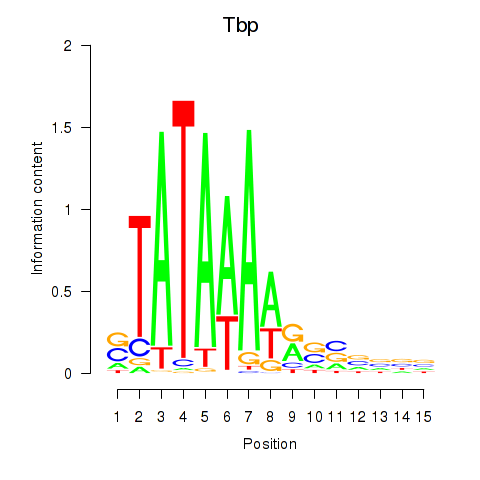
Motif ID: Tbp
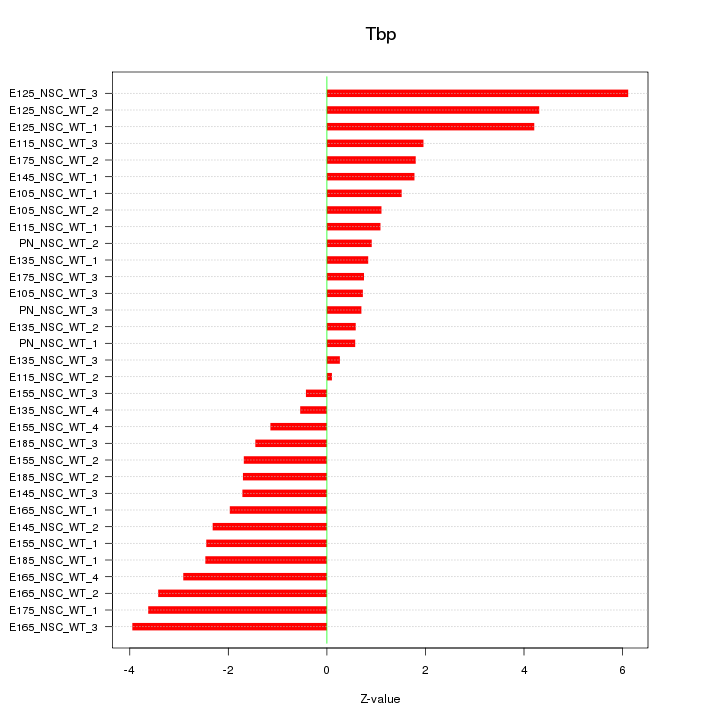
Z-value: 2.305
Transcription factors associated with Tbp:
| Gene Symbol | Entrez ID | Gene Name |
|---|---|---|
| Tbp | ENSMUSG00000014767.10 | Tbp |
Activity-expression correlation:
| Gene Symbol | Promoter | Pearson corr. coef. | P-value | Plot |
|---|---|---|---|---|
| Tbp | mm10_v2_chr17_+_15499888_15499960 | -0.57 | 5.3e-04 | Click! |


Top targets:
Gene overrepresentation in biological_process category:
| Log-likelihood per target | Total log-likelihood | Term | Description |
|---|---|---|---|
| 5.8 | 28.8 | GO:0015671 | oxygen transport(GO:0015671) |
| 2.3 | 9.1 | GO:0035606 | peptidyl-cysteine S-trans-nitrosylation(GO:0035606) |
| 1.9 | 9.5 | GO:0035262 | gonad morphogenesis(GO:0035262) |
| 1.8 | 7.3 | GO:0042414 | epinephrine metabolic process(GO:0042414) |
| 1.6 | 6.5 | GO:0006407 | rRNA export from nucleus(GO:0006407) |
| 1.6 | 4.7 | GO:0070093 | negative regulation of glucagon secretion(GO:0070093) |
| 1.4 | 18.7 | GO:0042573 | retinoic acid metabolic process(GO:0042573) positive regulation of collateral sprouting(GO:0048672) |
| 1.3 | 5.2 | GO:0042360 | vitamin E metabolic process(GO:0042360) |
| 1.2 | 3.7 | GO:0006597 | spermine biosynthetic process(GO:0006597) |
| 1.2 | 3.6 | GO:0035519 | protein K29-linked ubiquitination(GO:0035519) |
| 1.1 | 7.8 | GO:0036072 | intramembranous ossification(GO:0001957) direct ossification(GO:0036072) |
| 1.1 | 3.2 | GO:0003278 | apoptotic process involved in heart morphogenesis(GO:0003278) |
| 1.1 | 3.2 | GO:2000852 | regulation of corticosterone secretion(GO:2000852) |
| 0.9 | 5.7 | GO:0042535 | positive regulation of tumor necrosis factor biosynthetic process(GO:0042535) |
| 0.9 | 2.7 | GO:0019401 | alditol biosynthetic process(GO:0019401) |
| 0.9 | 27.2 | GO:0034723 | DNA replication-dependent nucleosome assembly(GO:0006335) DNA replication-dependent nucleosome organization(GO:0034723) |
| 0.8 | 2.5 | GO:0045472 | response to ether(GO:0045472) |
| 0.8 | 4.8 | GO:0042590 | antigen processing and presentation of exogenous peptide antigen via MHC class I(GO:0042590) |
| 0.8 | 6.1 | GO:0002536 | respiratory burst involved in inflammatory response(GO:0002536) |
| 0.7 | 3.0 | GO:0032227 | negative regulation of synaptic transmission, dopaminergic(GO:0032227) |
| 0.7 | 2.2 | GO:1900020 | ovarian follicle rupture(GO:0001543) angiotensin mediated vasoconstriction involved in regulation of systemic arterial blood pressure(GO:0001998) regulation of blood vessel size by renin-angiotensin(GO:0002034) renal control of peripheral vascular resistance involved in regulation of systemic arterial blood pressure(GO:0003072) establishment of blood-nerve barrier(GO:0008065) regulation of activation of Janus kinase activity(GO:0010533) regulation of activation of JAK2 kinase activity(GO:0010534) regulation of amino acid import(GO:0010958) regulation of L-arginine import(GO:0010963) response to muscle activity involved in regulation of muscle adaptation(GO:0014873) regulation of protein kinase C activity(GO:1900019) positive regulation of protein kinase C activity(GO:1900020) regulation of membrane hyperpolarization(GO:1902630) |
| 0.7 | 4.2 | GO:2000210 | positive regulation of anoikis(GO:2000210) |
| 0.6 | 1.9 | GO:0090285 | negative regulation of protein glycosylation in Golgi(GO:0090285) |
| 0.6 | 3.8 | GO:0043137 | DNA replication, removal of RNA primer(GO:0043137) |
| 0.6 | 1.2 | GO:0010273 | detoxification of copper ion(GO:0010273) stress response to copper ion(GO:1990169) |
| 0.6 | 1.8 | GO:0010899 | regulation of phosphatidylcholine catabolic process(GO:0010899) |
| 0.6 | 4.1 | GO:0016584 | nucleosome positioning(GO:0016584) |
| 0.6 | 10.4 | GO:0019430 | removal of superoxide radicals(GO:0019430) |
| 0.6 | 1.7 | GO:0036091 | positive regulation of transcription from RNA polymerase II promoter in response to oxidative stress(GO:0036091) |
| 0.5 | 2.7 | GO:1900147 | Schwann cell migration(GO:0036135) regulation of Schwann cell migration(GO:1900147) |
| 0.5 | 1.6 | GO:0048818 | positive regulation of hair follicle maturation(GO:0048818) positive regulation of catagen(GO:0051795) |
| 0.5 | 3.8 | GO:0001887 | selenium compound metabolic process(GO:0001887) |
| 0.5 | 5.3 | GO:0010992 | ubiquitin homeostasis(GO:0010992) |
| 0.5 | 3.4 | GO:0000320 | re-entry into mitotic cell cycle(GO:0000320) |
| 0.5 | 2.9 | GO:0030644 | cellular chloride ion homeostasis(GO:0030644) |
| 0.5 | 2.4 | GO:0033087 | negative regulation of immature T cell proliferation(GO:0033087) |
| 0.5 | 1.4 | GO:0050929 | corticospinal neuron axon guidance through spinal cord(GO:0021972) positive regulation of negative chemotaxis(GO:0050924) induction of negative chemotaxis(GO:0050929) negative regulation of mononuclear cell migration(GO:0071676) negative regulation of retinal ganglion cell axon guidance(GO:0090260) |
| 0.5 | 1.4 | GO:2000508 | regulation of dendritic cell chemotaxis(GO:2000508) positive regulation of dendritic cell chemotaxis(GO:2000510) |
| 0.5 | 6.4 | GO:0001731 | formation of translation preinitiation complex(GO:0001731) |
| 0.5 | 1.8 | GO:2000271 | positive regulation of fibroblast apoptotic process(GO:2000271) |
| 0.4 | 1.8 | GO:1902268 | negative regulation of polyamine transmembrane transport(GO:1902268) |
| 0.4 | 1.3 | GO:0002430 | complement receptor mediated signaling pathway(GO:0002430) |
| 0.4 | 3.4 | GO:0046688 | response to copper ion(GO:0046688) |
| 0.4 | 2.5 | GO:0000050 | urea cycle(GO:0000050) urea metabolic process(GO:0019627) |
| 0.4 | 1.2 | GO:0006556 | S-adenosylmethionine biosynthetic process(GO:0006556) |
| 0.4 | 2.7 | GO:0016560 | protein import into peroxisome matrix, docking(GO:0016560) |
| 0.4 | 1.1 | GO:0060558 | regulation of calcidiol 1-monooxygenase activity(GO:0060558) |
| 0.4 | 2.1 | GO:0071638 | cellular triglyceride homeostasis(GO:0035356) negative regulation of monocyte chemotactic protein-1 production(GO:0071638) |
| 0.4 | 1.1 | GO:0006436 | tryptophanyl-tRNA aminoacylation(GO:0006436) |
| 0.3 | 5.4 | GO:0035873 | lactate transport(GO:0015727) lactate transmembrane transport(GO:0035873) plasma membrane lactate transport(GO:0035879) |
| 0.3 | 0.7 | GO:2000402 | negative regulation of lymphocyte migration(GO:2000402) |
| 0.3 | 2.3 | GO:0002002 | regulation of angiotensin levels in blood(GO:0002002) |
| 0.3 | 2.2 | GO:1902416 | positive regulation of mRNA binding(GO:1902416) positive regulation of RNA binding(GO:1905216) |
| 0.3 | 0.9 | GO:1902310 | positive regulation of peptidyl-serine dephosphorylation(GO:1902310) |
| 0.3 | 3.4 | GO:0007175 | negative regulation of epidermal growth factor-activated receptor activity(GO:0007175) |
| 0.3 | 3.7 | GO:0002227 | innate immune response in mucosa(GO:0002227) |
| 0.3 | 5.5 | GO:0000920 | cell separation after cytokinesis(GO:0000920) |
| 0.3 | 0.9 | GO:0060392 | negative regulation of SMAD protein import into nucleus(GO:0060392) endothelial cell-cell adhesion(GO:0071603) |
| 0.3 | 19.9 | GO:0006334 | nucleosome assembly(GO:0006334) |
| 0.3 | 1.6 | GO:1901029 | negative regulation of mitochondrial outer membrane permeabilization involved in apoptotic signaling pathway(GO:1901029) |
| 0.3 | 0.8 | GO:0044650 | virion attachment to host cell(GO:0019062) adhesion of symbiont to host cell(GO:0044650) |
| 0.3 | 1.6 | GO:0045842 | positive regulation of mitotic metaphase/anaphase transition(GO:0045842) positive regulation of metaphase/anaphase transition of cell cycle(GO:1902101) |
| 0.3 | 4.0 | GO:0050765 | negative regulation of phagocytosis(GO:0050765) |
| 0.2 | 1.5 | GO:0043415 | positive regulation of skeletal muscle tissue regeneration(GO:0043415) |
| 0.2 | 1.0 | GO:0045876 | positive regulation of sister chromatid cohesion(GO:0045876) |
| 0.2 | 1.3 | GO:0042572 | retinol metabolic process(GO:0042572) |
| 0.2 | 0.8 | GO:1903237 | negative regulation of leukocyte tethering or rolling(GO:1903237) |
| 0.2 | 0.6 | GO:1904139 | microglial cell migration(GO:1904124) regulation of microglial cell migration(GO:1904139) |
| 0.2 | 0.6 | GO:0015793 | glycerol transport(GO:0015793) |
| 0.2 | 2.9 | GO:0051451 | myoblast migration(GO:0051451) |
| 0.2 | 4.8 | GO:0071353 | cellular response to interleukin-4(GO:0071353) |
| 0.2 | 2.0 | GO:0014807 | regulation of somitogenesis(GO:0014807) |
| 0.2 | 0.5 | GO:1903225 | regulation of endodermal cell fate specification(GO:0042663) negative regulation of endodermal cell differentiation(GO:1903225) |
| 0.2 | 1.4 | GO:0036506 | maintenance of unfolded protein(GO:0036506) protein insertion into ER membrane(GO:0045048) tail-anchored membrane protein insertion into ER membrane(GO:0071816) maintenance of unfolded protein involved in ERAD pathway(GO:1904378) |
| 0.2 | 4.2 | GO:0071398 | cellular response to fatty acid(GO:0071398) |
| 0.2 | 1.7 | GO:0050901 | leukocyte tethering or rolling(GO:0050901) |
| 0.2 | 3.3 | GO:0051044 | positive regulation of membrane protein ectodomain proteolysis(GO:0051044) |
| 0.2 | 0.3 | GO:0030240 | skeletal muscle thin filament assembly(GO:0030240) |
| 0.2 | 0.3 | GO:0019676 | ammonia assimilation cycle(GO:0019676) |
| 0.1 | 1.7 | GO:0038063 | collagen-activated tyrosine kinase receptor signaling pathway(GO:0038063) |
| 0.1 | 0.4 | GO:1901896 | positive regulation of calcium-transporting ATPase activity(GO:1901896) |
| 0.1 | 1.1 | GO:0070234 | positive regulation of T cell apoptotic process(GO:0070234) |
| 0.1 | 2.1 | GO:0034389 | lipid particle organization(GO:0034389) |
| 0.1 | 1.6 | GO:0071803 | positive regulation of podosome assembly(GO:0071803) |
| 0.1 | 0.9 | GO:0033353 | S-adenosylmethionine cycle(GO:0033353) |
| 0.1 | 1.0 | GO:0060837 | blood vessel endothelial cell differentiation(GO:0060837) |
| 0.1 | 1.1 | GO:0042095 | interferon-gamma biosynthetic process(GO:0042095) |
| 0.1 | 0.4 | GO:0031509 | telomeric heterochromatin assembly(GO:0031509) negative regulation of chromosome condensation(GO:1902340) |
| 0.1 | 1.1 | GO:0007076 | mitotic chromosome condensation(GO:0007076) |
| 0.1 | 4.1 | GO:0033119 | negative regulation of RNA splicing(GO:0033119) |
| 0.1 | 2.4 | GO:0040034 | regulation of development, heterochronic(GO:0040034) |
| 0.1 | 0.4 | GO:0030277 | maintenance of gastrointestinal epithelium(GO:0030277) |
| 0.1 | 0.8 | GO:0000712 | resolution of meiotic recombination intermediates(GO:0000712) |
| 0.1 | 0.5 | GO:0007000 | nucleolus organization(GO:0007000) |
| 0.1 | 2.3 | GO:0000027 | ribosomal large subunit assembly(GO:0000027) |
| 0.1 | 2.1 | GO:0035518 | histone H2A monoubiquitination(GO:0035518) |
| 0.1 | 4.7 | GO:0030512 | negative regulation of transforming growth factor beta receptor signaling pathway(GO:0030512) negative regulation of cellular response to transforming growth factor beta stimulus(GO:1903845) |
| 0.1 | 0.3 | GO:1903026 | negative regulation of RNA polymerase II regulatory region sequence-specific DNA binding(GO:1903026) |
| 0.1 | 1.1 | GO:0021542 | dentate gyrus development(GO:0021542) |
| 0.1 | 0.5 | GO:0051984 | positive regulation of chromosome segregation(GO:0051984) |
| 0.1 | 2.7 | GO:0000387 | spliceosomal snRNP assembly(GO:0000387) |
| 0.1 | 1.9 | GO:0071364 | cellular response to epidermal growth factor stimulus(GO:0071364) negative regulation of reactive oxygen species biosynthetic process(GO:1903427) |
| 0.1 | 4.0 | GO:0022904 | respiratory electron transport chain(GO:0022904) |
| 0.1 | 2.1 | GO:0095500 | acetylcholine receptor signaling pathway(GO:0095500) postsynaptic signal transduction(GO:0098926) signal transduction involved in cellular response to ammonium ion(GO:1903831) response to acetylcholine(GO:1905144) cellular response to acetylcholine(GO:1905145) |
| 0.1 | 0.3 | GO:0070213 | protein auto-ADP-ribosylation(GO:0070213) |
| 0.1 | 1.0 | GO:1902624 | positive regulation of granulocyte chemotaxis(GO:0071624) positive regulation of neutrophil chemotaxis(GO:0090023) positive regulation of neutrophil migration(GO:1902624) |
| 0.1 | 1.0 | GO:0051764 | actin crosslink formation(GO:0051764) |
| 0.1 | 1.9 | GO:0034629 | cellular protein complex localization(GO:0034629) |
| 0.1 | 0.1 | GO:0014012 | peripheral nervous system axon regeneration(GO:0014012) |
| 0.1 | 1.3 | GO:0097286 | iron ion import(GO:0097286) |
| 0.1 | 4.2 | GO:0002088 | lens development in camera-type eye(GO:0002088) |
| 0.1 | 5.0 | GO:0008584 | male gonad development(GO:0008584) development of primary male sexual characteristics(GO:0046546) |
| 0.1 | 0.6 | GO:0035970 | peptidyl-threonine dephosphorylation(GO:0035970) |
| 0.0 | 0.8 | GO:0031987 | locomotion involved in locomotory behavior(GO:0031987) |
| 0.0 | 1.2 | GO:0015985 | energy coupled proton transport, down electrochemical gradient(GO:0015985) ATP synthesis coupled proton transport(GO:0015986) |
| 0.0 | 0.5 | GO:0010719 | negative regulation of epithelial to mesenchymal transition(GO:0010719) |
| 0.0 | 2.5 | GO:0031338 | regulation of vesicle fusion(GO:0031338) |
| 0.0 | 0.3 | GO:2000643 | negative regulation of myelination(GO:0031642) negative regulation of excitatory postsynaptic potential(GO:0090394) positive regulation of early endosome to late endosome transport(GO:2000643) negative regulation of receptor catabolic process(GO:2000645) |
| 0.0 | 3.1 | GO:0051225 | spindle assembly(GO:0051225) |
| 0.0 | 2.1 | GO:0061515 | myeloid cell development(GO:0061515) |
| 0.0 | 1.6 | GO:0072661 | protein targeting to plasma membrane(GO:0072661) |
| 0.0 | 1.4 | GO:0006418 | tRNA aminoacylation for protein translation(GO:0006418) |
| 0.0 | 1.6 | GO:0030500 | regulation of bone mineralization(GO:0030500) |
| 0.0 | 1.1 | GO:0032410 | negative regulation of transporter activity(GO:0032410) |
| 0.0 | 0.1 | GO:0015803 | branched-chain amino acid transport(GO:0015803) leucine transport(GO:0015820) |
| 0.0 | 0.8 | GO:0007608 | sensory perception of smell(GO:0007608) |
| 0.0 | 1.5 | GO:0010923 | negative regulation of phosphatase activity(GO:0010923) |
| 0.0 | 1.5 | GO:0008286 | insulin receptor signaling pathway(GO:0008286) |
| 0.0 | 0.6 | GO:0045471 | response to ethanol(GO:0045471) |
| 0.0 | 1.9 | GO:0008033 | tRNA processing(GO:0008033) |
| 0.0 | 0.8 | GO:0043627 | response to estrogen(GO:0043627) |
| 0.0 | 4.8 | GO:0007067 | mitotic nuclear division(GO:0007067) |
| 0.0 | 2.0 | GO:0051480 | regulation of cytosolic calcium ion concentration(GO:0051480) |
| 0.0 | 0.1 | GO:0001867 | complement activation, lectin pathway(GO:0001867) |
| 0.0 | 0.3 | GO:0043171 | peptide catabolic process(GO:0043171) |
| 0.0 | 2.1 | GO:0042254 | ribosome biogenesis(GO:0042254) |
Gene overrepresentation in cellular_component category:
| Log-likelihood per target | Total log-likelihood | Term | Description |
|---|---|---|---|
| 3.6 | 29.1 | GO:0005833 | hemoglobin complex(GO:0005833) |
| 2.6 | 7.8 | GO:0005584 | collagen type I trimer(GO:0005584) |
| 1.9 | 5.7 | GO:0097512 | cardiac myofibril(GO:0097512) |
| 1.2 | 8.7 | GO:0097452 | GAIT complex(GO:0097452) |
| 0.8 | 2.5 | GO:0036488 | CHOP-C/EBP complex(GO:0036488) |
| 0.7 | 2.7 | GO:0045098 | type III intermediate filament(GO:0045098) |
| 0.7 | 52.6 | GO:0000786 | nucleosome(GO:0000786) |
| 0.7 | 2.7 | GO:0017071 | intracellular cyclic nucleotide activated cation channel complex(GO:0017071) |
| 0.6 | 3.8 | GO:0032299 | ribonuclease H2 complex(GO:0032299) |
| 0.6 | 2.8 | GO:0001652 | granular component(GO:0001652) |
| 0.6 | 1.7 | GO:1990037 | Lewy body core(GO:1990037) |
| 0.5 | 2.7 | GO:0034715 | U7 snRNP(GO:0005683) pICln-Sm protein complex(GO:0034715) |
| 0.5 | 2.1 | GO:0097454 | Schwann cell microvillus(GO:0097454) |
| 0.4 | 11.7 | GO:0005782 | peroxisomal matrix(GO:0005782) microbody lumen(GO:0031907) |
| 0.4 | 1.2 | GO:0048269 | methionine adenosyltransferase complex(GO:0048269) |
| 0.4 | 2.3 | GO:0071817 | MMXD complex(GO:0071817) |
| 0.4 | 17.9 | GO:0022627 | cytosolic small ribosomal subunit(GO:0022627) |
| 0.4 | 1.5 | GO:0016012 | sarcoglycan complex(GO:0016012) |
| 0.4 | 4.8 | GO:0042612 | MHC class I protein complex(GO:0042612) |
| 0.3 | 1.7 | GO:0005587 | collagen type IV trimer(GO:0005587) network-forming collagen trimer(GO:0098642) collagen network(GO:0098645) basement membrane collagen trimer(GO:0098651) |
| 0.3 | 2.4 | GO:0098554 | cytoplasmic side of endoplasmic reticulum membrane(GO:0098554) |
| 0.3 | 2.1 | GO:0031467 | Cul7-RING ubiquitin ligase complex(GO:0031467) |
| 0.3 | 7.3 | GO:0042470 | melanosome(GO:0042470) pigment granule(GO:0048770) |
| 0.3 | 1.9 | GO:0005827 | polar microtubule(GO:0005827) |
| 0.3 | 2.9 | GO:0031091 | platelet alpha granule(GO:0031091) |
| 0.2 | 1.0 | GO:0032021 | NELF complex(GO:0032021) |
| 0.2 | 2.4 | GO:0045298 | tubulin complex(GO:0045298) |
| 0.2 | 5.2 | GO:0005680 | anaphase-promoting complex(GO:0005680) |
| 0.2 | 0.6 | GO:0031074 | nucleocytoplasmic shuttling complex(GO:0031074) |
| 0.2 | 1.4 | GO:0071818 | BAT3 complex(GO:0071818) ER membrane insertion complex(GO:0072379) |
| 0.2 | 0.6 | GO:0071821 | FANCM-MHF complex(GO:0071821) |
| 0.2 | 1.4 | GO:0017101 | aminoacyl-tRNA synthetase multienzyme complex(GO:0017101) |
| 0.2 | 1.4 | GO:0042824 | MHC class I peptide loading complex(GO:0042824) |
| 0.2 | 1.1 | GO:0033256 | I-kappaB/NF-kappaB complex(GO:0033256) |
| 0.1 | 0.8 | GO:0005853 | eukaryotic translation elongation factor 1 complex(GO:0005853) |
| 0.1 | 0.4 | GO:0036128 | CatSper complex(GO:0036128) |
| 0.1 | 1.9 | GO:0031045 | dense core granule(GO:0031045) |
| 0.1 | 1.0 | GO:0042382 | paraspeckles(GO:0042382) |
| 0.1 | 3.2 | GO:0005921 | gap junction(GO:0005921) |
| 0.1 | 1.8 | GO:0034362 | low-density lipoprotein particle(GO:0034362) |
| 0.1 | 2.2 | GO:0045120 | pronucleus(GO:0045120) |
| 0.1 | 7.1 | GO:0022625 | cytosolic large ribosomal subunit(GO:0022625) |
| 0.1 | 1.2 | GO:0000276 | mitochondrial proton-transporting ATP synthase complex, coupling factor F(o)(GO:0000276) |
| 0.1 | 2.1 | GO:0010369 | chromocenter(GO:0010369) |
| 0.1 | 4.6 | GO:0005882 | intermediate filament(GO:0005882) |
| 0.1 | 1.6 | GO:0002080 | acrosomal membrane(GO:0002080) |
| 0.1 | 4.0 | GO:0030964 | mitochondrial respiratory chain complex I(GO:0005747) NADH dehydrogenase complex(GO:0030964) respiratory chain complex I(GO:0045271) |
| 0.1 | 5.5 | GO:0005871 | kinesin complex(GO:0005871) |
| 0.1 | 1.3 | GO:0005640 | nuclear outer membrane(GO:0005640) |
| 0.1 | 0.9 | GO:0000164 | protein phosphatase type 1 complex(GO:0000164) |
| 0.1 | 1.6 | GO:0002102 | podosome(GO:0002102) |
| 0.1 | 3.5 | GO:0019005 | SCF ubiquitin ligase complex(GO:0019005) |
| 0.1 | 5.6 | GO:0005578 | proteinaceous extracellular matrix(GO:0005578) |
| 0.1 | 12.4 | GO:0043209 | myelin sheath(GO:0043209) |
| 0.0 | 0.5 | GO:0042405 | nuclear inclusion body(GO:0042405) |
| 0.0 | 4.0 | GO:0001725 | stress fiber(GO:0001725) contractile actin filament bundle(GO:0097517) |
| 0.0 | 1.1 | GO:0005689 | U12-type spliceosomal complex(GO:0005689) |
| 0.0 | 2.2 | GO:0072562 | blood microparticle(GO:0072562) |
| 0.0 | 2.1 | GO:0010494 | cytoplasmic stress granule(GO:0010494) |
| 0.0 | 9.1 | GO:0031965 | nuclear membrane(GO:0031965) |
| 0.0 | 5.1 | GO:0000776 | kinetochore(GO:0000776) |
| 0.0 | 1.1 | GO:0005876 | spindle microtubule(GO:0005876) |
| 0.0 | 1.9 | GO:0030173 | integral component of Golgi membrane(GO:0030173) |
| 0.0 | 2.1 | GO:0005581 | collagen trimer(GO:0005581) |
| 0.0 | 1.0 | GO:0016592 | mediator complex(GO:0016592) |
| 0.0 | 0.8 | GO:0001772 | immunological synapse(GO:0001772) |
| 0.0 | 0.3 | GO:0000242 | pericentriolar material(GO:0000242) |
| 0.0 | 3.3 | GO:0005802 | trans-Golgi network(GO:0005802) |
| 0.0 | 1.3 | GO:0030863 | cortical cytoskeleton(GO:0030863) |
| 0.0 | 0.6 | GO:0009925 | basal plasma membrane(GO:0009925) |
| 0.0 | 0.3 | GO:0043034 | costamere(GO:0043034) |
| 0.0 | 1.5 | GO:0016323 | basolateral plasma membrane(GO:0016323) |
Gene overrepresentation in molecular_function category:
| Log-likelihood per target | Total log-likelihood | Term | Description |
|---|---|---|---|
| 7.3 | 29.1 | GO:0031721 | hemoglobin alpha binding(GO:0031721) |
| 3.1 | 18.7 | GO:0019841 | retinol binding(GO:0019841) |
| 2.9 | 8.7 | GO:0035605 | peptidyl-cysteine S-nitrosylase activity(GO:0035605) |
| 1.2 | 14.6 | GO:0008379 | thioredoxin peroxidase activity(GO:0008379) |
| 1.2 | 7.3 | GO:0035240 | dopamine binding(GO:0035240) |
| 1.1 | 3.4 | GO:0004720 | protein-lysine 6-oxidase activity(GO:0004720) |
| 1.1 | 3.2 | GO:0031779 | melanocortin receptor binding(GO:0031779) type 3 melanocortin receptor binding(GO:0031781) type 4 melanocortin receptor binding(GO:0031782) |
| 0.9 | 3.7 | GO:0019808 | polyamine binding(GO:0019808) |
| 0.7 | 2.9 | GO:0004111 | creatine kinase activity(GO:0004111) |
| 0.7 | 2.7 | GO:1990254 | keratin filament binding(GO:1990254) |
| 0.6 | 1.9 | GO:0071633 | dihydroceramidase activity(GO:0071633) |
| 0.5 | 1.6 | GO:0004966 | galanin receptor activity(GO:0004966) |
| 0.5 | 2.7 | GO:0005052 | peroxisome matrix targeting signal-1 binding(GO:0005052) |
| 0.5 | 2.1 | GO:0016018 | cyclosporin A binding(GO:0016018) |
| 0.5 | 7.8 | GO:0048407 | platelet-derived growth factor binding(GO:0048407) |
| 0.5 | 3.8 | GO:0004523 | RNA-DNA hybrid ribonuclease activity(GO:0004523) |
| 0.5 | 1.9 | GO:0004784 | superoxide dismutase activity(GO:0004784) oxidoreductase activity, acting on superoxide radicals as acceptor(GO:0016721) |
| 0.4 | 1.8 | GO:0008073 | ornithine decarboxylase inhibitor activity(GO:0008073) |
| 0.4 | 3.1 | GO:0005087 | Ran guanyl-nucleotide exchange factor activity(GO:0005087) |
| 0.4 | 1.3 | GO:0001847 | opsonin receptor activity(GO:0001847) anaphylatoxin receptor activity(GO:0004942) |
| 0.4 | 3.5 | GO:0008430 | selenium binding(GO:0008430) |
| 0.4 | 1.8 | GO:0030229 | very-low-density lipoprotein particle receptor activity(GO:0030229) |
| 0.4 | 1.1 | GO:0004830 | tryptophan-tRNA ligase activity(GO:0004830) |
| 0.3 | 1.7 | GO:0033691 | sialic acid binding(GO:0033691) |
| 0.3 | 3.4 | GO:0043023 | ribosomal large subunit binding(GO:0043023) |
| 0.3 | 4.8 | GO:0030881 | beta-2-microglobulin binding(GO:0030881) |
| 0.3 | 5.4 | GO:0015129 | lactate transmembrane transporter activity(GO:0015129) |
| 0.3 | 1.5 | GO:1990825 | sequence-specific mRNA binding(GO:1990825) |
| 0.3 | 2.3 | GO:0008097 | 5S rRNA binding(GO:0008097) |
| 0.3 | 2.2 | GO:0005212 | structural constituent of eye lens(GO:0005212) |
| 0.3 | 2.1 | GO:0030550 | acetylcholine receptor inhibitor activity(GO:0030550) |
| 0.3 | 1.3 | GO:0016724 | ferroxidase activity(GO:0004322) oxidoreductase activity, oxidizing metal ions, oxygen as acceptor(GO:0016724) |
| 0.3 | 2.5 | GO:0001013 | RNA polymerase I regulatory region DNA binding(GO:0001013) |
| 0.2 | 2.4 | GO:0035925 | mRNA 3'-UTR AU-rich region binding(GO:0035925) |
| 0.2 | 0.9 | GO:0008157 | protein phosphatase 1 binding(GO:0008157) |
| 0.2 | 0.7 | GO:0004069 | L-aspartate:2-oxoglutarate aminotransferase activity(GO:0004069) |
| 0.2 | 3.3 | GO:0019855 | calcium channel inhibitor activity(GO:0019855) |
| 0.2 | 2.2 | GO:1990715 | mRNA CDS binding(GO:1990715) |
| 0.2 | 4.1 | GO:0005520 | insulin-like growth factor binding(GO:0005520) |
| 0.2 | 6.4 | GO:0017134 | fibroblast growth factor binding(GO:0017134) |
| 0.2 | 0.8 | GO:0031735 | CCR10 chemokine receptor binding(GO:0031735) |
| 0.2 | 1.4 | GO:0043237 | laminin-1 binding(GO:0043237) |
| 0.2 | 2.2 | GO:0048018 | receptor agonist activity(GO:0048018) |
| 0.2 | 3.7 | GO:0097602 | cullin family protein binding(GO:0097602) |
| 0.2 | 2.5 | GO:0070180 | large ribosomal subunit rRNA binding(GO:0070180) |
| 0.2 | 0.7 | GO:0031727 | CCR2 chemokine receptor binding(GO:0031727) |
| 0.2 | 34.5 | GO:0042393 | histone binding(GO:0042393) |
| 0.1 | 4.2 | GO:0005201 | extracellular matrix structural constituent(GO:0005201) |
| 0.1 | 2.9 | GO:0017049 | GTP-Rho binding(GO:0017049) |
| 0.1 | 5.7 | GO:0030291 | protein serine/threonine kinase inhibitor activity(GO:0030291) |
| 0.1 | 0.8 | GO:0004984 | olfactory receptor activity(GO:0004984) |
| 0.1 | 0.8 | GO:0008597 | calcium-dependent protein serine/threonine phosphatase regulator activity(GO:0008597) |
| 0.1 | 0.9 | GO:0004013 | adenosylhomocysteinase activity(GO:0004013) trialkylsulfonium hydrolase activity(GO:0016802) |
| 0.1 | 4.0 | GO:0050136 | NADH dehydrogenase (ubiquinone) activity(GO:0008137) NADH dehydrogenase (quinone) activity(GO:0050136) |
| 0.1 | 1.7 | GO:0043522 | leucine zipper domain binding(GO:0043522) |
| 0.1 | 1.4 | GO:0016151 | nickel cation binding(GO:0016151) |
| 0.1 | 4.6 | GO:0005504 | fatty acid binding(GO:0005504) |
| 0.1 | 0.6 | GO:0004724 | magnesium-dependent protein serine/threonine phosphatase activity(GO:0004724) |
| 0.1 | 1.6 | GO:0005537 | mannose binding(GO:0005537) |
| 0.1 | 2.1 | GO:0008266 | poly(U) RNA binding(GO:0008266) |
| 0.1 | 0.5 | GO:0000403 | Y-form DNA binding(GO:0000403) |
| 0.1 | 0.3 | GO:0016880 | acid-ammonia (or amide) ligase activity(GO:0016880) |
| 0.1 | 0.3 | GO:0016174 | NAD(P)H oxidase activity(GO:0016174) |
| 0.1 | 2.7 | GO:0003746 | translation elongation factor activity(GO:0003746) |
| 0.1 | 0.6 | GO:0045028 | G-protein coupled nucleotide receptor activity(GO:0001608) G-protein coupled adenosine receptor activity(GO:0001609) G-protein coupled purinergic nucleotide receptor activity(GO:0045028) |
| 0.1 | 0.6 | GO:0015168 | glycerol transmembrane transporter activity(GO:0015168) glycerol channel activity(GO:0015254) |
| 0.1 | 5.5 | GO:0003777 | microtubule motor activity(GO:0003777) |
| 0.1 | 3.6 | GO:0061631 | ubiquitin conjugating enzyme activity(GO:0061631) |
| 0.1 | 2.0 | GO:0003785 | actin monomer binding(GO:0003785) |
| 0.1 | 16.6 | GO:0003735 | structural constituent of ribosome(GO:0003735) |
| 0.1 | 2.7 | GO:0016504 | peptidase activator activity(GO:0016504) |
| 0.1 | 1.1 | GO:0071855 | neuropeptide receptor binding(GO:0071855) |
| 0.1 | 1.5 | GO:0017025 | TBP-class protein binding(GO:0017025) |
| 0.1 | 1.3 | GO:0004032 | alditol:NADP+ 1-oxidoreductase activity(GO:0004032) |
| 0.0 | 1.4 | GO:0050681 | androgen receptor binding(GO:0050681) |
| 0.0 | 1.0 | GO:0070064 | proline-rich region binding(GO:0070064) |
| 0.0 | 2.2 | GO:0030544 | Hsp70 protein binding(GO:0030544) |
| 0.0 | 0.5 | GO:0070097 | delta-catenin binding(GO:0070097) |
| 0.0 | 1.1 | GO:0042805 | actinin binding(GO:0042805) |
| 0.0 | 0.8 | GO:0004181 | metallocarboxypeptidase activity(GO:0004181) |
| 0.0 | 2.5 | GO:0098811 | transcriptional activator activity, RNA polymerase II transcription factor binding(GO:0001190) transcriptional repressor activity, RNA polymerase II activating transcription factor binding(GO:0098811) |
| 0.0 | 0.2 | GO:0061505 | DNA topoisomerase type II (ATP-hydrolyzing) activity(GO:0003918) DNA topoisomerase II activity(GO:0061505) |
| 0.0 | 1.2 | GO:0005507 | copper ion binding(GO:0005507) |
| 0.0 | 2.7 | GO:0004252 | serine-type endopeptidase activity(GO:0004252) |
| 0.0 | 2.5 | GO:0003725 | double-stranded RNA binding(GO:0003725) |
| 0.0 | 0.3 | GO:0030375 | thyroid hormone receptor coactivator activity(GO:0030375) |
| 0.0 | 2.2 | GO:0097110 | scaffold protein binding(GO:0097110) |
| 0.0 | 9.4 | GO:0001077 | transcriptional activator activity, RNA polymerase II core promoter proximal region sequence-specific binding(GO:0001077) |
| 0.0 | 0.3 | GO:0070628 | proteasome binding(GO:0070628) |
| 0.0 | 2.8 | GO:0002020 | protease binding(GO:0002020) |
| 0.0 | 1.4 | GO:0016876 | aminoacyl-tRNA ligase activity(GO:0004812) ligase activity, forming carbon-oxygen bonds(GO:0016875) ligase activity, forming aminoacyl-tRNA and related compounds(GO:0016876) |
| 0.0 | 0.4 | GO:0051861 | glycolipid binding(GO:0051861) |
| 0.0 | 1.4 | GO:0048029 | monosaccharide binding(GO:0048029) |
| 0.0 | 0.2 | GO:0019869 | chloride channel inhibitor activity(GO:0019869) |
| 0.0 | 0.4 | GO:0004198 | calcium-dependent cysteine-type endopeptidase activity(GO:0004198) |
| 0.0 | 0.6 | GO:0003887 | DNA-directed DNA polymerase activity(GO:0003887) |
| 0.0 | 1.5 | GO:0001158 | enhancer sequence-specific DNA binding(GO:0001158) |
| 0.0 | 1.4 | GO:0051087 | chaperone binding(GO:0051087) |
| 0.0 | 1.6 | GO:0005506 | iron ion binding(GO:0005506) |
| 0.0 | 0.1 | GO:0008486 | diphosphoinositol-polyphosphate diphosphatase activity(GO:0008486) |
| 0.0 | 1.2 | GO:0016765 | transferase activity, transferring alkyl or aryl (other than methyl) groups(GO:0016765) |
| 0.0 | 3.2 | GO:0004930 | G-protein coupled receptor activity(GO:0004930) |
| 0.0 | 0.3 | GO:0004438 | phosphatidylinositol-3-phosphatase activity(GO:0004438) |
| 0.0 | 0.7 | GO:0001104 | RNA polymerase II transcription cofactor activity(GO:0001104) |
| 0.0 | 0.3 | GO:0003950 | NAD+ ADP-ribosyltransferase activity(GO:0003950) |
| 0.0 | 0.3 | GO:0070006 | metalloaminopeptidase activity(GO:0070006) |
| 0.0 | 0.6 | GO:0003690 | double-stranded DNA binding(GO:0003690) |
| 0.0 | 2.1 | GO:0001227 | transcriptional repressor activity, RNA polymerase II transcription regulatory region sequence-specific binding(GO:0001227) |
| 0.0 | 1.1 | GO:0008201 | heparin binding(GO:0008201) |
| 0.0 | 1.6 | GO:0003714 | transcription corepressor activity(GO:0003714) |