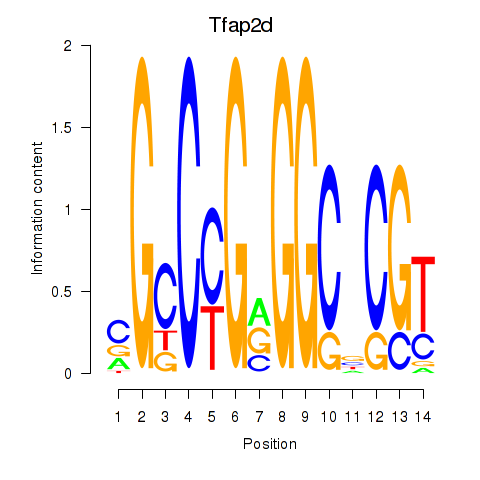
Motif ID: Tfap2d
Z-value: 1.162
Transcription factors associated with Tfap2d:
| Gene Symbol | Entrez ID | Gene Name |
|---|---|---|
| Tfap2d | ENSMUSG00000042596.7 | Tfap2d |
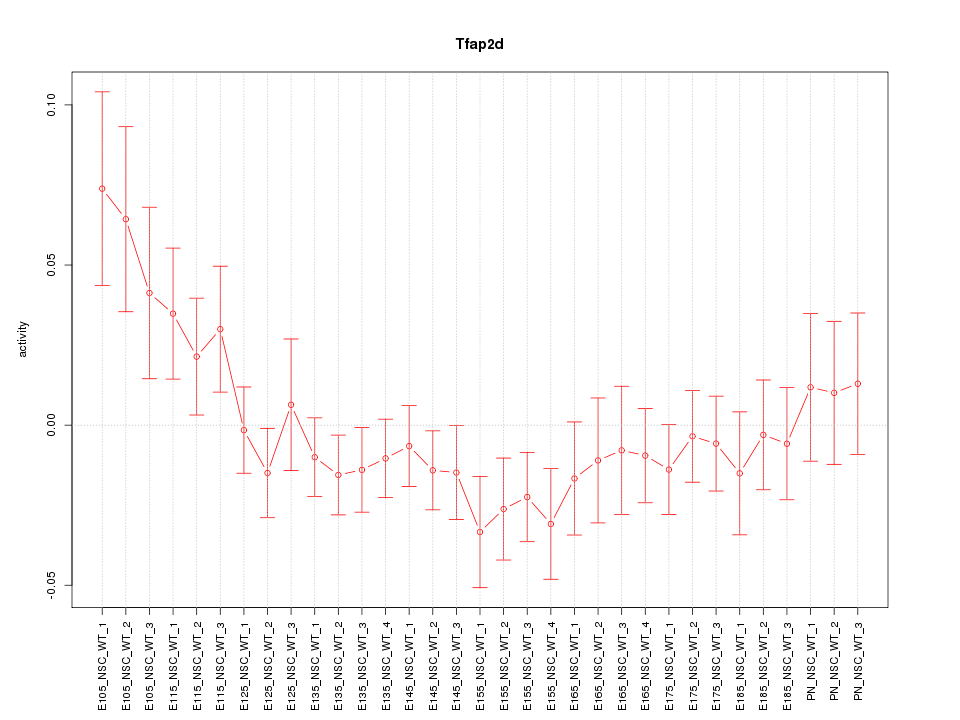
Activity-expression correlation:
| Gene Symbol | Promoter | Pearson corr. coef. | P-value | Plot |
|---|---|---|---|---|
| Tfap2d | mm10_v2_chr1_+_19103022_19103043 | -0.86 | 1.1e-10 | Click! |


Top targets:
Gene overrepresentation in biological_process category:
| Log-likelihood per target | Total log-likelihood | Term | Description |
|---|---|---|---|
| 2.3 | 9.2 | GO:0097168 | condensed mesenchymal cell proliferation(GO:0072137) mesenchymal stem cell proliferation(GO:0097168) |
| 1.7 | 6.8 | GO:0097374 | sensory neuron axon guidance(GO:0097374) |
| 1.6 | 4.7 | GO:0010989 | negative regulation of low-density lipoprotein particle clearance(GO:0010989) |
| 1.5 | 4.5 | GO:0001866 | NK T cell proliferation(GO:0001866) |
| 1.4 | 6.8 | GO:0006447 | regulation of translational initiation by iron(GO:0006447) positive regulation of translational initiation by iron(GO:0045994) |
| 1.2 | 3.6 | GO:0086017 | response to inactivity(GO:0014854) response to muscle inactivity(GO:0014870) response to muscle inactivity involved in regulation of muscle adaptation(GO:0014877) response to denervation involved in regulation of muscle adaptation(GO:0014894) Purkinje myocyte action potential(GO:0086017) membrane depolarization during SA node cell action potential(GO:0086046) |
| 1.2 | 3.5 | GO:0007354 | zygotic determination of anterior/posterior axis, embryo(GO:0007354) |
| 1.1 | 3.3 | GO:1902498 | regulation of protein autoubiquitination(GO:1902498) |
| 1.0 | 1.0 | GO:0071374 | cellular response to parathyroid hormone stimulus(GO:0071374) |
| 0.9 | 3.7 | GO:0018242 | protein O-linked glycosylation via serine(GO:0018242) |
| 0.9 | 3.6 | GO:0035795 | negative regulation of mitochondrial membrane permeability(GO:0035795) |
| 0.9 | 2.6 | GO:0007521 | muscle cell fate determination(GO:0007521) mammary placode formation(GO:0060596) |
| 0.8 | 2.5 | GO:0033615 | mitochondrial proton-transporting ATP synthase complex assembly(GO:0033615) |
| 0.8 | 2.5 | GO:0006083 | acetate metabolic process(GO:0006083) |
| 0.8 | 7.8 | GO:0006020 | inositol metabolic process(GO:0006020) |
| 0.8 | 2.3 | GO:1900041 | negative regulation of interleukin-2 secretion(GO:1900041) |
| 0.7 | 2.8 | GO:0014012 | peripheral nervous system axon regeneration(GO:0014012) |
| 0.7 | 4.6 | GO:0018158 | protein oxidation(GO:0018158) |
| 0.6 | 3.8 | GO:0060040 | retinal bipolar neuron differentiation(GO:0060040) |
| 0.6 | 2.6 | GO:1900145 | regulation of nodal signaling pathway involved in determination of left/right asymmetry(GO:1900145) regulation of nodal signaling pathway involved in determination of lateral mesoderm left/right asymmetry(GO:1900175) positive regulation of nodal signaling pathway involved in determination of lateral mesoderm left/right asymmetry(GO:1900224) |
| 0.6 | 2.5 | GO:1904425 | negative regulation of GTP binding(GO:1904425) |
| 0.6 | 1.9 | GO:0045659 | regulation of neutrophil differentiation(GO:0045658) negative regulation of neutrophil differentiation(GO:0045659) |
| 0.6 | 2.5 | GO:2001045 | negative regulation of integrin-mediated signaling pathway(GO:2001045) |
| 0.6 | 3.0 | GO:2001168 | regulation of histone H2B ubiquitination(GO:2001166) positive regulation of histone H2B ubiquitination(GO:2001168) |
| 0.6 | 1.8 | GO:0006059 | hexitol metabolic process(GO:0006059) |
| 0.6 | 2.3 | GO:0060715 | syncytiotrophoblast cell differentiation involved in labyrinthine layer development(GO:0060715) |
| 0.6 | 1.7 | GO:0003096 | renal sodium ion transport(GO:0003096) |
| 0.5 | 1.0 | GO:1902263 | apoptotic process involved in embryonic digit morphogenesis(GO:1902263) |
| 0.4 | 5.3 | GO:0044458 | motile cilium assembly(GO:0044458) |
| 0.4 | 2.6 | GO:0048934 | peripheral nervous system neuron differentiation(GO:0048934) peripheral nervous system neuron development(GO:0048935) |
| 0.4 | 1.7 | GO:0051643 | endoplasmic reticulum localization(GO:0051643) |
| 0.4 | 1.3 | GO:0044339 | canonical Wnt signaling pathway involved in osteoblast differentiation(GO:0044339) |
| 0.4 | 1.3 | GO:0007341 | penetration of zona pellucida(GO:0007341) |
| 0.4 | 1.2 | GO:0030167 | proteoglycan catabolic process(GO:0030167) |
| 0.4 | 5.2 | GO:0006268 | DNA unwinding involved in DNA replication(GO:0006268) |
| 0.4 | 2.0 | GO:0070345 | negative regulation of fat cell proliferation(GO:0070345) |
| 0.4 | 3.5 | GO:0019240 | citrulline biosynthetic process(GO:0019240) |
| 0.4 | 2.3 | GO:0060024 | rhythmic synaptic transmission(GO:0060024) |
| 0.4 | 1.9 | GO:0002072 | optic cup morphogenesis involved in camera-type eye development(GO:0002072) |
| 0.4 | 1.9 | GO:1903553 | positive regulation of extracellular exosome assembly(GO:1903553) |
| 0.3 | 9.2 | GO:0035115 | embryonic forelimb morphogenesis(GO:0035115) |
| 0.3 | 1.0 | GO:0021577 | hindbrain structural organization(GO:0021577) cerebellum structural organization(GO:0021589) |
| 0.3 | 1.6 | GO:0044829 | positive regulation by host of viral genome replication(GO:0044829) |
| 0.3 | 3.4 | GO:0001973 | adenosine receptor signaling pathway(GO:0001973) |
| 0.3 | 1.5 | GO:1990086 | lens fiber cell apoptotic process(GO:1990086) |
| 0.3 | 1.2 | GO:0046469 | platelet activating factor biosynthetic process(GO:0006663) platelet activating factor metabolic process(GO:0046469) |
| 0.3 | 0.9 | GO:1900158 | negative regulation of bone mineralization involved in bone maturation(GO:1900158) |
| 0.3 | 3.1 | GO:0014807 | regulation of somitogenesis(GO:0014807) |
| 0.3 | 1.1 | GO:1901165 | positive regulation of trophoblast cell migration(GO:1901165) |
| 0.3 | 2.5 | GO:0060836 | lymphatic endothelial cell differentiation(GO:0060836) |
| 0.3 | 2.2 | GO:0044027 | hypermethylation of CpG island(GO:0044027) |
| 0.3 | 0.8 | GO:0048211 | Golgi vesicle docking(GO:0048211) |
| 0.2 | 4.7 | GO:0035873 | lactate transport(GO:0015727) lactate transmembrane transport(GO:0035873) plasma membrane lactate transport(GO:0035879) |
| 0.2 | 0.9 | GO:0060709 | glycogen cell differentiation involved in embryonic placenta development(GO:0060709) |
| 0.2 | 1.8 | GO:1904668 | positive regulation of ubiquitin protein ligase activity(GO:1904668) |
| 0.2 | 0.9 | GO:0046726 | positive regulation by virus of viral protein levels in host cell(GO:0046726) |
| 0.2 | 2.0 | GO:0051574 | positive regulation of histone H3-K9 methylation(GO:0051574) |
| 0.2 | 0.6 | GO:0046959 | habituation(GO:0046959) |
| 0.2 | 6.8 | GO:0050873 | brown fat cell differentiation(GO:0050873) |
| 0.2 | 1.8 | GO:0060710 | chorio-allantoic fusion(GO:0060710) |
| 0.2 | 6.8 | GO:0045746 | negative regulation of Notch signaling pathway(GO:0045746) |
| 0.2 | 2.3 | GO:0048096 | chromatin-mediated maintenance of transcription(GO:0048096) |
| 0.2 | 0.8 | GO:0042276 | error-prone translesion synthesis(GO:0042276) |
| 0.2 | 0.6 | GO:0045617 | negative regulation of keratinocyte differentiation(GO:0045617) |
| 0.2 | 0.9 | GO:0061052 | negative regulation of cell growth involved in cardiac muscle cell development(GO:0061052) |
| 0.2 | 1.3 | GO:0090267 | positive regulation of mitotic cell cycle spindle assembly checkpoint(GO:0090267) |
| 0.2 | 1.4 | GO:0048262 | determination of dorsal/ventral asymmetry(GO:0048262) determination of dorsal identity(GO:0048263) |
| 0.2 | 0.9 | GO:0006167 | AMP biosynthetic process(GO:0006167) |
| 0.2 | 1.4 | GO:0045003 | DNA recombinase assembly(GO:0000730) double-strand break repair via synthesis-dependent strand annealing(GO:0045003) |
| 0.2 | 0.5 | GO:0021691 | cerebellar Purkinje cell layer maturation(GO:0021691) |
| 0.2 | 0.6 | GO:0031509 | telomeric heterochromatin assembly(GO:0031509) negative regulation of chromosome condensation(GO:1902340) |
| 0.2 | 5.3 | GO:0034629 | cellular protein complex localization(GO:0034629) |
| 0.2 | 0.8 | GO:0060075 | regulation of resting membrane potential(GO:0060075) |
| 0.2 | 0.5 | GO:1904251 | regulation of bile acid metabolic process(GO:1904251) |
| 0.2 | 2.8 | GO:2000193 | positive regulation of fatty acid transport(GO:2000193) |
| 0.2 | 0.9 | GO:0019695 | choline metabolic process(GO:0019695) |
| 0.1 | 0.7 | GO:0070100 | negative regulation of chemokine-mediated signaling pathway(GO:0070100) |
| 0.1 | 0.8 | GO:0021631 | optic nerve morphogenesis(GO:0021631) |
| 0.1 | 3.1 | GO:0033235 | positive regulation of protein sumoylation(GO:0033235) |
| 0.1 | 1.1 | GO:1903204 | negative regulation of oxidative stress-induced neuron death(GO:1903204) |
| 0.1 | 0.9 | GO:0035902 | response to immobilization stress(GO:0035902) |
| 0.1 | 1.8 | GO:0006817 | phosphate ion transport(GO:0006817) |
| 0.1 | 0.9 | GO:0061732 | mitochondrial acetyl-CoA biosynthetic process from pyruvate(GO:0061732) |
| 0.1 | 1.0 | GO:0036506 | maintenance of unfolded protein(GO:0036506) protein insertion into ER membrane(GO:0045048) tail-anchored membrane protein insertion into ER membrane(GO:0071816) maintenance of unfolded protein involved in ERAD pathway(GO:1904378) |
| 0.1 | 1.1 | GO:1990403 | embryonic brain development(GO:1990403) |
| 0.1 | 1.0 | GO:0048386 | positive regulation of retinoic acid receptor signaling pathway(GO:0048386) |
| 0.1 | 0.9 | GO:0034351 | regulation of glial cell apoptotic process(GO:0034350) negative regulation of glial cell apoptotic process(GO:0034351) |
| 0.1 | 0.4 | GO:1900110 | single stranded viral RNA replication via double stranded DNA intermediate(GO:0039692) regulation of histone H3-K9 dimethylation(GO:1900109) negative regulation of histone H3-K9 dimethylation(GO:1900110) |
| 0.1 | 2.5 | GO:0006346 | methylation-dependent chromatin silencing(GO:0006346) |
| 0.1 | 0.4 | GO:0045039 | protein import into mitochondrial inner membrane(GO:0045039) |
| 0.1 | 0.6 | GO:0021891 | olfactory bulb interneuron development(GO:0021891) |
| 0.1 | 1.7 | GO:0006999 | nuclear pore organization(GO:0006999) |
| 0.1 | 0.8 | GO:0034427 | nuclear-transcribed mRNA catabolic process, exonucleolytic, 3'-5'(GO:0034427) |
| 0.1 | 3.6 | GO:0021591 | ventricular system development(GO:0021591) |
| 0.1 | 0.4 | GO:0035616 | histone H2B conserved C-terminal lysine deubiquitination(GO:0035616) |
| 0.1 | 1.4 | GO:0046855 | phosphorylated carbohydrate dephosphorylation(GO:0046838) inositol phosphate dephosphorylation(GO:0046855) |
| 0.1 | 0.7 | GO:0010748 | regulation of plasma membrane long-chain fatty acid transport(GO:0010746) negative regulation of plasma membrane long-chain fatty acid transport(GO:0010748) |
| 0.1 | 3.2 | GO:0030901 | midbrain development(GO:0030901) |
| 0.1 | 1.3 | GO:0048387 | negative regulation of retinoic acid receptor signaling pathway(GO:0048387) |
| 0.1 | 2.9 | GO:0002474 | antigen processing and presentation of peptide antigen via MHC class I(GO:0002474) |
| 0.1 | 1.5 | GO:0051044 | positive regulation of membrane protein ectodomain proteolysis(GO:0051044) |
| 0.1 | 0.4 | GO:2000623 | regulation of nuclear-transcribed mRNA catabolic process, nonsense-mediated decay(GO:2000622) negative regulation of nuclear-transcribed mRNA catabolic process, nonsense-mediated decay(GO:2000623) |
| 0.1 | 1.2 | GO:0042249 | establishment of planar polarity of embryonic epithelium(GO:0042249) |
| 0.1 | 2.1 | GO:0034723 | DNA replication-dependent nucleosome assembly(GO:0006335) DNA replication-independent nucleosome assembly(GO:0006336) DNA replication-dependent nucleosome organization(GO:0034723) DNA replication-independent nucleosome organization(GO:0034724) |
| 0.1 | 0.3 | GO:1902261 | positive regulation of delayed rectifier potassium channel activity(GO:1902261) positive regulation of voltage-gated potassium channel activity(GO:1903818) |
| 0.1 | 0.4 | GO:0042711 | maternal behavior(GO:0042711) |
| 0.1 | 1.8 | GO:0046677 | response to antibiotic(GO:0046677) |
| 0.1 | 0.2 | GO:0089700 | protein kinase D signaling(GO:0089700) |
| 0.1 | 0.3 | GO:2000630 | positive regulation of miRNA metabolic process(GO:2000630) |
| 0.1 | 1.5 | GO:0043171 | peptide catabolic process(GO:0043171) |
| 0.1 | 1.4 | GO:0034198 | cellular response to amino acid starvation(GO:0034198) |
| 0.1 | 1.4 | GO:0043403 | skeletal muscle tissue regeneration(GO:0043403) |
| 0.1 | 0.8 | GO:1900745 | positive regulation of p38MAPK cascade(GO:1900745) |
| 0.1 | 0.3 | GO:0090188 | negative regulation of pancreatic juice secretion(GO:0090188) |
| 0.1 | 0.2 | GO:0000189 | MAPK import into nucleus(GO:0000189) |
| 0.0 | 2.2 | GO:2000134 | negative regulation of G1/S transition of mitotic cell cycle(GO:2000134) |
| 0.0 | 1.2 | GO:0035335 | peptidyl-tyrosine dephosphorylation(GO:0035335) |
| 0.0 | 0.3 | GO:0060903 | positive regulation of meiosis I(GO:0060903) |
| 0.0 | 1.4 | GO:2000300 | regulation of synaptic vesicle exocytosis(GO:2000300) |
| 0.0 | 1.8 | GO:0060325 | face morphogenesis(GO:0060325) |
| 0.0 | 4.0 | GO:0050885 | neuromuscular process controlling balance(GO:0050885) |
| 0.0 | 0.4 | GO:0016082 | synaptic vesicle priming(GO:0016082) |
| 0.0 | 0.4 | GO:0006105 | succinate metabolic process(GO:0006105) |
| 0.0 | 1.1 | GO:0033539 | fatty acid beta-oxidation using acyl-CoA dehydrogenase(GO:0033539) |
| 0.0 | 1.1 | GO:0010719 | negative regulation of epithelial to mesenchymal transition(GO:0010719) |
| 0.0 | 0.2 | GO:0019509 | L-methionine biosynthetic process from methylthioadenosine(GO:0019509) |
| 0.0 | 0.7 | GO:0046498 | S-adenosylhomocysteine metabolic process(GO:0046498) |
| 0.0 | 0.3 | GO:0090084 | negative regulation of inclusion body assembly(GO:0090084) |
| 0.0 | 0.8 | GO:0001967 | suckling behavior(GO:0001967) |
| 0.0 | 1.8 | GO:0046513 | ceramide biosynthetic process(GO:0046513) |
| 0.0 | 0.5 | GO:0016180 | snRNA processing(GO:0016180) |
| 0.0 | 1.0 | GO:0060351 | cartilage development involved in endochondral bone morphogenesis(GO:0060351) |
| 0.0 | 0.9 | GO:0018345 | protein palmitoylation(GO:0018345) |
| 0.0 | 0.1 | GO:0018076 | N-terminal peptidyl-lysine acetylation(GO:0018076) |
| 0.0 | 2.2 | GO:0010923 | negative regulation of phosphatase activity(GO:0010923) |
| 0.0 | 2.0 | GO:0061515 | myeloid cell development(GO:0061515) |
| 0.0 | 0.5 | GO:0010569 | regulation of double-strand break repair via homologous recombination(GO:0010569) |
| 0.0 | 0.9 | GO:0016601 | Rac protein signal transduction(GO:0016601) |
| 0.0 | 0.6 | GO:0009299 | mRNA transcription(GO:0009299) |
| 0.0 | 1.5 | GO:0006513 | protein monoubiquitination(GO:0006513) |
| 0.0 | 1.2 | GO:0006446 | regulation of translational initiation(GO:0006446) |
| 0.0 | 0.8 | GO:0007062 | sister chromatid cohesion(GO:0007062) |
| 0.0 | 0.5 | GO:0072337 | modified amino acid transport(GO:0072337) |
| 0.0 | 1.4 | GO:0006664 | glycolipid metabolic process(GO:0006664) liposaccharide metabolic process(GO:1903509) |
| 0.0 | 0.5 | GO:0007492 | endoderm development(GO:0007492) |
| 0.0 | 1.9 | GO:0051028 | mRNA transport(GO:0051028) |
| 0.0 | 0.2 | GO:0070207 | protein homotrimerization(GO:0070207) |
| 0.0 | 0.0 | GO:0060971 | embryonic heart tube left/right pattern formation(GO:0060971) |
| 0.0 | 0.3 | GO:0097284 | hepatocyte apoptotic process(GO:0097284) |
| 0.0 | 0.3 | GO:0032801 | receptor catabolic process(GO:0032801) |
| 0.0 | 1.1 | GO:0008584 | male gonad development(GO:0008584) development of primary male sexual characteristics(GO:0046546) |
| 0.0 | 0.3 | GO:0043984 | histone H4-K16 acetylation(GO:0043984) |
| 0.0 | 0.2 | GO:0048642 | negative regulation of skeletal muscle tissue development(GO:0048642) |
| 0.0 | 0.4 | GO:0015909 | long-chain fatty acid transport(GO:0015909) |
| 0.0 | 1.2 | GO:0048675 | axon extension(GO:0048675) |
| 0.0 | 1.7 | GO:0048864 | stem cell development(GO:0048864) |
| 0.0 | 0.2 | GO:0051654 | establishment of mitochondrion localization(GO:0051654) |
| 0.0 | 0.1 | GO:0030322 | stabilization of membrane potential(GO:0030322) |
Gene overrepresentation in cellular_component category:
| Log-likelihood per target | Total log-likelihood | Term | Description |
|---|---|---|---|
| 1.5 | 4.5 | GO:1990667 | PCSK9-AnxA2 complex(GO:1990667) |
| 0.8 | 2.5 | GO:0005595 | collagen type XII trimer(GO:0005595) anchoring collagen complex(GO:0030934) |
| 0.8 | 5.3 | GO:0005827 | polar microtubule(GO:0005827) |
| 0.4 | 6.1 | GO:0042555 | MCM complex(GO:0042555) |
| 0.4 | 3.0 | GO:0008024 | cyclin/CDK positive transcription elongation factor complex(GO:0008024) |
| 0.3 | 1.5 | GO:0005853 | eukaryotic translation elongation factor 1 complex(GO:0005853) |
| 0.2 | 1.7 | GO:0001940 | male pronucleus(GO:0001940) |
| 0.2 | 2.9 | GO:0042612 | MHC class I protein complex(GO:0042612) |
| 0.2 | 3.6 | GO:0034706 | voltage-gated sodium channel complex(GO:0001518) sodium channel complex(GO:0034706) |
| 0.2 | 1.7 | GO:0016281 | eukaryotic translation initiation factor 4F complex(GO:0016281) |
| 0.2 | 5.8 | GO:0016581 | NuRD complex(GO:0016581) CHD-type complex(GO:0090545) |
| 0.2 | 0.6 | GO:0044614 | nuclear pore cytoplasmic filaments(GO:0044614) |
| 0.2 | 2.1 | GO:0045298 | tubulin complex(GO:0045298) |
| 0.2 | 1.4 | GO:0031465 | Cul4B-RING E3 ubiquitin ligase complex(GO:0031465) |
| 0.2 | 1.4 | GO:0033061 | DNA recombinase mediator complex(GO:0033061) |
| 0.2 | 2.0 | GO:0005915 | zonula adherens(GO:0005915) |
| 0.2 | 2.3 | GO:0046930 | pore complex(GO:0046930) |
| 0.2 | 3.2 | GO:0016514 | SWI/SNF complex(GO:0016514) |
| 0.1 | 1.0 | GO:0097136 | Bcl-2 family protein complex(GO:0097136) |
| 0.1 | 1.0 | GO:0071818 | BAT3 complex(GO:0071818) ER membrane insertion complex(GO:0072379) |
| 0.1 | 0.6 | GO:0001740 | Barr body(GO:0001740) |
| 0.1 | 1.3 | GO:0000138 | Golgi trans cisterna(GO:0000138) external encapsulating structure(GO:0030312) |
| 0.1 | 0.9 | GO:0045254 | pyruvate dehydrogenase complex(GO:0045254) |
| 0.1 | 0.4 | GO:0070939 | Dsl1p complex(GO:0070939) |
| 0.1 | 0.3 | GO:0036488 | CHOP-C/EBP complex(GO:0036488) |
| 0.1 | 2.2 | GO:0001741 | XY body(GO:0001741) |
| 0.1 | 2.0 | GO:0035098 | ESC/E(Z) complex(GO:0035098) |
| 0.1 | 1.4 | GO:0045120 | pronucleus(GO:0045120) |
| 0.1 | 0.5 | GO:0030289 | protein phosphatase 4 complex(GO:0030289) |
| 0.1 | 5.2 | GO:0005844 | polysome(GO:0005844) |
| 0.1 | 4.8 | GO:0016459 | myosin complex(GO:0016459) |
| 0.1 | 1.0 | GO:0034663 | endoplasmic reticulum chaperone complex(GO:0034663) |
| 0.1 | 0.6 | GO:0070971 | endoplasmic reticulum exit site(GO:0070971) |
| 0.1 | 3.2 | GO:0016591 | DNA-directed RNA polymerase II, holoenzyme(GO:0016591) |
| 0.1 | 5.2 | GO:0036126 | sperm flagellum(GO:0036126) |
| 0.1 | 1.0 | GO:0097470 | ribbon synapse(GO:0097470) |
| 0.1 | 0.9 | GO:0043220 | Schmidt-Lanterman incisure(GO:0043220) |
| 0.1 | 2.3 | GO:0005891 | voltage-gated calcium channel complex(GO:0005891) |
| 0.1 | 0.8 | GO:0005671 | Ada2/Gcn5/Ada3 transcription activator complex(GO:0005671) |
| 0.1 | 6.9 | GO:0090575 | RNA polymerase II transcription factor complex(GO:0090575) |
| 0.1 | 0.3 | GO:0072487 | MSL complex(GO:0072487) |
| 0.0 | 0.5 | GO:0016589 | NURF complex(GO:0016589) |
| 0.0 | 3.2 | GO:0005923 | bicellular tight junction(GO:0005923) |
| 0.0 | 0.5 | GO:0043240 | Fanconi anaemia nuclear complex(GO:0043240) |
| 0.0 | 0.2 | GO:0000836 | ER ubiquitin ligase complex(GO:0000835) Hrd1p ubiquitin ligase complex(GO:0000836) |
| 0.0 | 2.0 | GO:0010494 | cytoplasmic stress granule(GO:0010494) |
| 0.0 | 3.5 | GO:0016605 | PML body(GO:0016605) |
| 0.0 | 0.6 | GO:0090544 | BAF-type complex(GO:0090544) |
| 0.0 | 1.6 | GO:0030027 | lamellipodium(GO:0030027) |
| 0.0 | 1.5 | GO:0005788 | endoplasmic reticulum lumen(GO:0005788) |
| 0.0 | 0.7 | GO:0071339 | MLL1/2 complex(GO:0044665) MLL1 complex(GO:0071339) |
| 0.0 | 0.9 | GO:0035145 | exon-exon junction complex(GO:0035145) |
| 0.0 | 4.3 | GO:0005741 | mitochondrial outer membrane(GO:0005741) |
| 0.0 | 4.6 | GO:0016604 | nuclear body(GO:0016604) |
| 0.0 | 1.6 | GO:0072562 | blood microparticle(GO:0072562) |
| 0.0 | 1.3 | GO:0000118 | histone deacetylase complex(GO:0000118) |
| 0.0 | 0.2 | GO:0031428 | box C/D snoRNP complex(GO:0031428) |
| 0.0 | 5.3 | GO:0005667 | transcription factor complex(GO:0005667) |
| 0.0 | 4.2 | GO:0005681 | spliceosomal complex(GO:0005681) |
| 0.0 | 1.1 | GO:0005811 | lipid particle(GO:0005811) |
| 0.0 | 6.6 | GO:0031012 | extracellular matrix(GO:0031012) |
| 0.0 | 0.8 | GO:0000932 | cytoplasmic mRNA processing body(GO:0000932) |
| 0.0 | 0.2 | GO:0031143 | pseudopodium(GO:0031143) |
| 0.0 | 0.7 | GO:0005795 | Golgi stack(GO:0005795) |
| 0.0 | 1.1 | GO:0005643 | nuclear pore(GO:0005643) |
| 0.0 | 3.9 | GO:0005925 | focal adhesion(GO:0005925) |
| 0.0 | 0.7 | GO:0031526 | brush border membrane(GO:0031526) |
| 0.0 | 0.4 | GO:0017053 | transcriptional repressor complex(GO:0017053) |
| 0.0 | 0.1 | GO:0002080 | acrosomal membrane(GO:0002080) |
| 0.0 | 2.3 | GO:0016324 | apical plasma membrane(GO:0016324) |
Gene overrepresentation in molecular_function category:
| Log-likelihood per target | Total log-likelihood | Term | Description |
|---|---|---|---|
| 1.5 | 4.5 | GO:0034190 | very-low-density lipoprotein particle binding(GO:0034189) apolipoprotein receptor binding(GO:0034190) |
| 1.1 | 6.8 | GO:0070644 | vitamin D response element binding(GO:0070644) |
| 1.1 | 5.6 | GO:0032027 | myosin light chain binding(GO:0032027) |
| 0.9 | 6.5 | GO:0008440 | inositol-1,4,5-trisphosphate 3-kinase activity(GO:0008440) |
| 0.7 | 3.6 | GO:0008865 | fructokinase activity(GO:0008865) mannokinase activity(GO:0019158) |
| 0.7 | 2.0 | GO:0047192 | 1-alkylglycerophosphocholine O-acetyltransferase activity(GO:0047192) |
| 0.6 | 1.8 | GO:0042284 | sphingolipid delta-4 desaturase activity(GO:0042284) |
| 0.6 | 3.5 | GO:0016813 | hydrolase activity, acting on carbon-nitrogen (but not peptide) bonds, in linear amidines(GO:0016813) |
| 0.6 | 1.8 | GO:0004335 | galactokinase activity(GO:0004335) galactose binding(GO:0005534) |
| 0.5 | 3.6 | GO:0086006 | voltage-gated sodium channel activity involved in cardiac muscle cell action potential(GO:0086006) |
| 0.4 | 3.0 | GO:0097322 | 7SK snRNA binding(GO:0097322) |
| 0.4 | 1.2 | GO:0070052 | collagen V binding(GO:0070052) |
| 0.4 | 3.5 | GO:0048406 | nerve growth factor binding(GO:0048406) |
| 0.4 | 3.5 | GO:0001047 | core promoter binding(GO:0001047) |
| 0.4 | 1.4 | GO:0042731 | PH domain binding(GO:0042731) |
| 0.3 | 4.7 | GO:0015129 | lactate transmembrane transporter activity(GO:0015129) |
| 0.3 | 6.5 | GO:0008266 | poly(U) RNA binding(GO:0008266) |
| 0.3 | 2.5 | GO:0008420 | CTD phosphatase activity(GO:0008420) |
| 0.3 | 2.2 | GO:0051718 | DNA (cytosine-5-)-methyltransferase activity(GO:0003886) DNA (cytosine-5-)-methyltransferase activity, acting on CpG substrates(GO:0051718) |
| 0.3 | 1.1 | GO:0016971 | flavin-linked sulfhydryl oxidase activity(GO:0016971) |
| 0.3 | 1.3 | GO:0003945 | N-acetyllactosamine synthase activity(GO:0003945) |
| 0.3 | 2.0 | GO:0019869 | chloride channel inhibitor activity(GO:0019869) |
| 0.2 | 0.7 | GO:0031686 | A1 adenosine receptor binding(GO:0031686) |
| 0.2 | 0.9 | GO:0004104 | choline kinase activity(GO:0004103) cholinesterase activity(GO:0004104) choline binding(GO:0033265) |
| 0.2 | 6.8 | GO:0005112 | Notch binding(GO:0005112) |
| 0.2 | 7.0 | GO:0017147 | Wnt-protein binding(GO:0017147) |
| 0.2 | 3.7 | GO:0004653 | polypeptide N-acetylgalactosaminyltransferase activity(GO:0004653) |
| 0.2 | 1.9 | GO:0034711 | inhibin binding(GO:0034711) |
| 0.2 | 2.9 | GO:0030881 | beta-2-microglobulin binding(GO:0030881) |
| 0.2 | 2.3 | GO:0031386 | protein tag(GO:0031386) |
| 0.2 | 0.5 | GO:0030362 | protein phosphatase type 4 regulator activity(GO:0030362) |
| 0.2 | 0.8 | GO:0005005 | transmembrane-ephrin receptor activity(GO:0005005) |
| 0.2 | 1.0 | GO:0004691 | cAMP-dependent protein kinase activity(GO:0004691) |
| 0.1 | 4.7 | GO:0005109 | frizzled binding(GO:0005109) |
| 0.1 | 2.5 | GO:0017166 | vinculin binding(GO:0017166) |
| 0.1 | 1.7 | GO:0008190 | eukaryotic initiation factor 4E binding(GO:0008190) |
| 0.1 | 0.9 | GO:0034604 | pyruvate dehydrogenase activity(GO:0004738) pyruvate dehydrogenase [NAD(P)+] activity(GO:0034603) pyruvate dehydrogenase (NAD+) activity(GO:0034604) |
| 0.1 | 1.7 | GO:1990226 | histone methyltransferase binding(GO:1990226) |
| 0.1 | 1.4 | GO:1990715 | mRNA CDS binding(GO:1990715) |
| 0.1 | 0.5 | GO:0015220 | choline transmembrane transporter activity(GO:0015220) |
| 0.1 | 0.7 | GO:0004719 | protein-L-isoaspartate (D-aspartate) O-methyltransferase activity(GO:0004719) |
| 0.1 | 0.8 | GO:0052630 | CTP:2,3-di-O-geranylgeranyl-sn-glycero-1-phosphate cytidyltransferase activity(GO:0043338) phospholactate guanylyltransferase activity(GO:0043814) ATP:coenzyme F420 adenylyltransferase activity(GO:0043910) UDP-N-acetylgalactosamine diphosphorylase activity(GO:0052630) |
| 0.1 | 0.6 | GO:2001070 | starch binding(GO:2001070) |
| 0.1 | 1.9 | GO:0055106 | ubiquitin-protein transferase regulator activity(GO:0055106) |
| 0.1 | 1.8 | GO:0070182 | DNA polymerase binding(GO:0070182) |
| 0.1 | 2.5 | GO:0004029 | aldehyde dehydrogenase (NAD) activity(GO:0004029) |
| 0.1 | 1.3 | GO:0044323 | retinoic acid-responsive element binding(GO:0044323) |
| 0.1 | 1.5 | GO:0019855 | calcium channel inhibitor activity(GO:0019855) |
| 0.1 | 3.5 | GO:0031492 | nucleosomal DNA binding(GO:0031492) |
| 0.1 | 2.8 | GO:0001968 | fibronectin binding(GO:0001968) |
| 0.1 | 5.2 | GO:0004003 | ATP-dependent DNA helicase activity(GO:0004003) |
| 0.1 | 0.6 | GO:0001972 | retinoic acid binding(GO:0001972) |
| 0.1 | 3.3 | GO:0001103 | RNA polymerase II repressing transcription factor binding(GO:0001103) |
| 0.1 | 8.1 | GO:0033613 | activating transcription factor binding(GO:0033613) |
| 0.1 | 0.7 | GO:0048495 | Roundabout binding(GO:0048495) |
| 0.1 | 1.6 | GO:0070006 | metalloaminopeptidase activity(GO:0070006) |
| 0.1 | 0.5 | GO:0008821 | crossover junction endodeoxyribonuclease activity(GO:0008821) |
| 0.1 | 1.7 | GO:0017056 | structural constituent of nuclear pore(GO:0017056) |
| 0.1 | 22.9 | GO:0001077 | transcriptional activator activity, RNA polymerase II core promoter proximal region sequence-specific binding(GO:0001077) |
| 0.1 | 0.9 | GO:0022841 | potassium ion leak channel activity(GO:0022841) |
| 0.1 | 0.4 | GO:0004095 | carnitine O-palmitoyltransferase activity(GO:0004095) |
| 0.1 | 0.9 | GO:0016500 | protein-hormone receptor activity(GO:0016500) |
| 0.1 | 2.6 | GO:0017017 | MAP kinase tyrosine/serine/threonine phosphatase activity(GO:0017017) |
| 0.1 | 1.9 | GO:0031491 | nucleosome binding(GO:0031491) |
| 0.1 | 4.6 | GO:0005179 | hormone activity(GO:0005179) |
| 0.1 | 1.9 | GO:0017025 | TBP-class protein binding(GO:0017025) |
| 0.1 | 2.3 | GO:0005245 | voltage-gated calcium channel activity(GO:0005245) |
| 0.1 | 0.9 | GO:0031005 | filamin binding(GO:0031005) |
| 0.1 | 1.8 | GO:0005160 | transforming growth factor beta receptor binding(GO:0005160) |
| 0.1 | 1.1 | GO:0052890 | oxidoreductase activity, acting on the CH-CH group of donors, with a flavin as acceptor(GO:0052890) |
| 0.1 | 0.8 | GO:0043008 | ATP-dependent protein binding(GO:0043008) |
| 0.1 | 0.9 | GO:0030235 | nitric-oxide synthase regulator activity(GO:0030235) |
| 0.1 | 1.8 | GO:0017091 | AU-rich element binding(GO:0017091) |
| 0.1 | 1.1 | GO:0050431 | transforming growth factor beta binding(GO:0050431) |
| 0.0 | 0.2 | GO:1904288 | BAT3 complex binding(GO:1904288) |
| 0.0 | 0.2 | GO:0034056 | estrogen response element binding(GO:0034056) |
| 0.0 | 1.0 | GO:0051787 | misfolded protein binding(GO:0051787) |
| 0.0 | 1.6 | GO:0008748 | N-ethylmaleimide reductase activity(GO:0008748) reduced coenzyme F420 dehydrogenase activity(GO:0043738) sulfur oxygenase reductase activity(GO:0043826) malolactic enzyme activity(GO:0043883) epoxyqueuosine reductase activity(GO:0052693) |
| 0.0 | 0.4 | GO:0034943 | acyl-CoA ligase activity(GO:0003996) 3-oxo-2-(2'-pentenyl)cyclopentane-1-octanoic acid CoA ligase activity(GO:0010435) 3-isopropenyl-6-oxoheptanoyl-CoA synthetase activity(GO:0018854) 2-oxo-delta3-4,5,5-trimethylcyclopentenylacetyl-CoA synthetase activity(GO:0018855) benzoyl acetate-CoA ligase activity(GO:0018856) 2,4-dichlorobenzoate-CoA ligase activity(GO:0018857) pivalate-CoA ligase activity(GO:0034783) cyclopropanecarboxylate-CoA ligase activity(GO:0034793) adipate-CoA ligase activity(GO:0034796) citronellyl-CoA ligase activity(GO:0034823) mentha-1,3-dione-CoA ligase activity(GO:0034841) thiophene-2-carboxylate-CoA ligase activity(GO:0034842) 2,4,4-trimethylpentanoate-CoA ligase activity(GO:0034865) cis-2-methyl-5-isopropylhexa-2,5-dienoate-CoA ligase activity(GO:0034942) trans-2-methyl-5-isopropylhexa-2,5-dienoate-CoA ligase activity(GO:0034943) branched-chain acyl-CoA synthetase (ADP-forming) activity(GO:0043759) aryl-CoA synthetase (ADP-forming) activity(GO:0043762) 3-hydroxypropionyl-CoA synthetase activity(GO:0043955) perillic acid:CoA ligase (ADP-forming) activity(GO:0052685) perillic acid:CoA ligase (AMP-forming) activity(GO:0052686) (3R)-3-isopropenyl-6-oxoheptanoate:CoA ligase (ADP-forming) activity(GO:0052687) (3R)-3-isopropenyl-6-oxoheptanoate:CoA ligase (AMP-forming) activity(GO:0052688) pristanate-CoA ligase activity(GO:0070251) malonyl-CoA synthetase activity(GO:0090409) |
| 0.0 | 1.7 | GO:0003899 | DNA-directed RNA polymerase activity(GO:0003899) |
| 0.0 | 0.6 | GO:0030898 | actin-dependent ATPase activity(GO:0030898) |
| 0.0 | 1.4 | GO:0032452 | histone demethylase activity(GO:0032452) |
| 0.0 | 1.8 | GO:0061631 | ubiquitin conjugating enzyme activity(GO:0061631) |
| 0.0 | 2.1 | GO:0004722 | protein serine/threonine phosphatase activity(GO:0004722) |
| 0.0 | 0.6 | GO:0070577 | lysine-acetylated histone binding(GO:0070577) |
| 0.0 | 0.2 | GO:0008494 | translation activator activity(GO:0008494) |
| 0.0 | 0.9 | GO:0000217 | DNA secondary structure binding(GO:0000217) |
| 0.0 | 2.3 | GO:0003697 | single-stranded DNA binding(GO:0003697) |
| 0.0 | 0.6 | GO:0004312 | fatty acid synthase activity(GO:0004312) |
| 0.0 | 1.8 | GO:0044824 | integrase activity(GO:0008907) T/G mismatch-specific endonuclease activity(GO:0043765) retroviral integrase activity(GO:0044823) retroviral 3' processing activity(GO:0044824) |
| 0.0 | 0.9 | GO:0019706 | protein-cysteine S-palmitoyltransferase activity(GO:0019706) |
| 0.0 | 1.4 | GO:0003684 | damaged DNA binding(GO:0003684) |
| 0.0 | 2.1 | GO:0003725 | double-stranded RNA binding(GO:0003725) |
| 0.0 | 1.2 | GO:0070063 | RNA polymerase binding(GO:0070063) |
| 0.0 | 0.2 | GO:0034511 | U3 snoRNA binding(GO:0034511) |
| 0.0 | 3.5 | GO:0003774 | motor activity(GO:0003774) |
| 0.0 | 1.0 | GO:0042974 | retinoic acid receptor binding(GO:0042974) |
| 0.0 | 0.7 | GO:0071889 | 14-3-3 protein binding(GO:0071889) |
| 0.0 | 19.4 | GO:0043565 | sequence-specific DNA binding(GO:0043565) |
| 0.0 | 1.2 | GO:0004120 | calmodulin-dependent cyclic-nucleotide phosphodiesterase activity(GO:0004117) cGMP-stimulated cyclic-nucleotide phosphodiesterase activity(GO:0004118) cGMP-inhibited cyclic-nucleotide phosphodiesterase activity(GO:0004119) photoreceptor cyclic-nucleotide phosphodiesterase activity(GO:0004120) 7,8-dihydro-D-neopterin 2',3'-cyclic phosphate phosphodiesterase activity(GO:0044688) inositol phosphosphingolipid phospholipase activity(GO:0052712) inositol phosphorylceramide phospholipase activity(GO:0052713) mannosyl-inositol phosphorylceramide phospholipase activity(GO:0052714) mannosyl-diinositol phosphorylceramide phospholipase activity(GO:0052715) |
| 0.0 | 1.8 | GO:0051087 | chaperone binding(GO:0051087) |
| 0.0 | 2.0 | GO:0032947 | protein complex scaffold(GO:0032947) |
| 0.0 | 0.6 | GO:0036002 | pre-mRNA binding(GO:0036002) |
| 0.0 | 1.0 | GO:0046527 | glucosyltransferase activity(GO:0046527) |
| 0.0 | 1.9 | GO:0001948 | glycoprotein binding(GO:0001948) |
| 0.0 | 0.8 | GO:0004402 | histone acetyltransferase activity(GO:0004402) |
| 0.0 | 1.9 | GO:0042393 | histone binding(GO:0042393) |
| 0.0 | 2.3 | GO:1901681 | sulfur compound binding(GO:1901681) |
| 0.0 | 0.8 | GO:0020037 | heme binding(GO:0020037) |
| 0.0 | 0.4 | GO:0050136 | NADH dehydrogenase (ubiquinone) activity(GO:0008137) NADH dehydrogenase (quinone) activity(GO:0050136) |
| 0.0 | 0.9 | GO:0005125 | cytokine activity(GO:0005125) |
| 0.0 | 0.2 | GO:0070064 | proline-rich region binding(GO:0070064) |