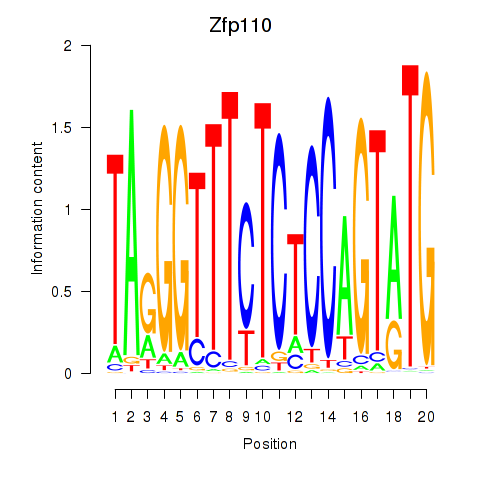
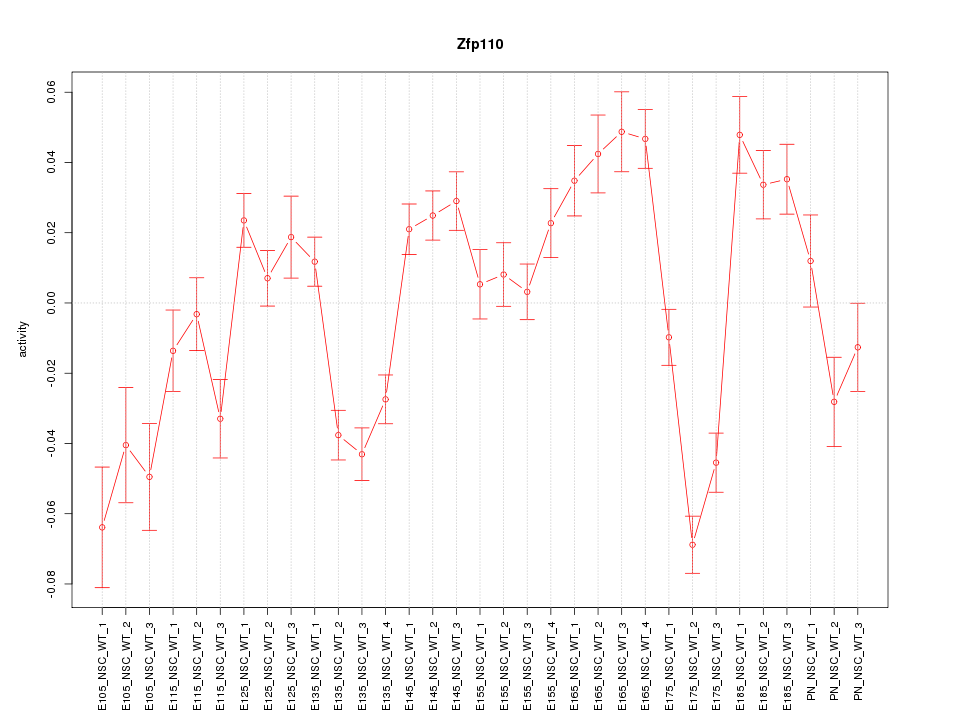
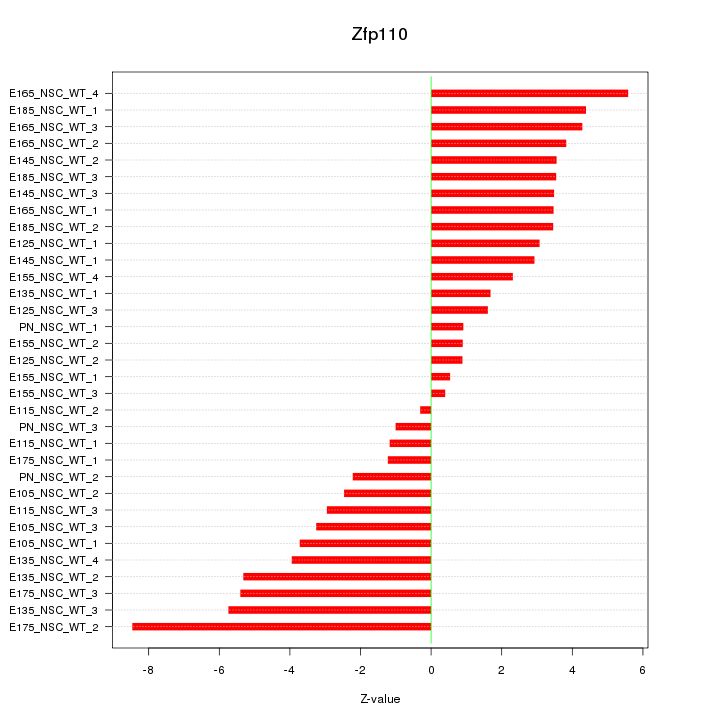
Motif ID: Zfp110
Z-value: 3.491
Transcription factors associated with Zfp110:
| Gene Symbol | Entrez ID | Gene Name |
|---|---|---|
| Zfp110 | ENSMUSG00000058638.7 | Zfp110 |
Activity-expression correlation:
| Gene Symbol | Promoter | Pearson corr. coef. | P-value | Plot |
|---|---|---|---|---|
| Zfp110 | mm10_v2_chr7_+_12834743_12834811 | 0.10 | 5.9e-01 | Click! |

Top targets:
Gene overrepresentation in biological_process category:
| Log-likelihood per target | Total log-likelihood | Term | Description |
|---|---|---|---|
| 1.0 | 4.8 | GO:0002457 | T cell antigen processing and presentation(GO:0002457) |
| 0.6 | 2.3 | GO:0035521 | monoubiquitinated histone deubiquitination(GO:0035521) monoubiquitinated histone H2A deubiquitination(GO:0035522) |
| 0.4 | 1.3 | GO:0006553 | lysine metabolic process(GO:0006553) |
| 0.3 | 1.0 | GO:0006669 | sphinganine-1-phosphate biosynthetic process(GO:0006669) |
| 0.3 | 3.9 | GO:0045161 | neuronal ion channel clustering(GO:0045161) |
| 0.2 | 2.7 | GO:0034497 | protein localization to pre-autophagosomal structure(GO:0034497) |
| 0.2 | 1.8 | GO:0090166 | Golgi disassembly(GO:0090166) |
| 0.2 | 1.9 | GO:0010650 | positive regulation of cell communication by electrical coupling(GO:0010650) positive regulation of membrane depolarization during cardiac muscle cell action potential(GO:1900827) |
| 0.2 | 1.5 | GO:0006273 | lagging strand elongation(GO:0006273) |
| 0.1 | 0.5 | GO:0034587 | piRNA metabolic process(GO:0034587) |
| 0.1 | 1.8 | GO:0001964 | startle response(GO:0001964) |
| 0.1 | 5.6 | GO:0050885 | neuromuscular process controlling balance(GO:0050885) |
| 0.0 | 36.9 | GO:0000122 | negative regulation of transcription from RNA polymerase II promoter(GO:0000122) |
| 0.0 | 0.2 | GO:1902902 | negative regulation of autophagosome assembly(GO:1902902) |
| 0.0 | 2.2 | GO:0007160 | cell-matrix adhesion(GO:0007160) |
Gene overrepresentation in cellular_component category:
| Log-likelihood per target | Total log-likelihood | Term | Description |
|---|---|---|---|
| 1.1 | 5.6 | GO:0030314 | junctional membrane complex(GO:0030314) |
| 0.5 | 1.5 | GO:0005658 | alpha DNA polymerase:primase complex(GO:0005658) |
| 0.2 | 3.9 | GO:0044224 | juxtaparanode region of axon(GO:0044224) |
| 0.2 | 2.7 | GO:0034045 | pre-autophagosomal structure membrane(GO:0034045) |
| 0.1 | 1.9 | GO:0014731 | spectrin-associated cytoskeleton(GO:0014731) |
| 0.0 | 1.8 | GO:0031201 | SNARE complex(GO:0031201) |
| 0.0 | 1.1 | GO:0031463 | Cul3-RING ubiquitin ligase complex(GO:0031463) |
| 0.0 | 196.5 | GO:0005575 | cellular_component(GO:0005575) |
Gene overrepresentation in molecular_function category:
| Log-likelihood per target | Total log-likelihood | Term | Description |
|---|---|---|---|
| 0.7 | 4.8 | GO:0032453 | histone demethylase activity (H3-K4 specific)(GO:0032453) |
| 0.3 | 1.3 | GO:0008808 | cardiolipin synthase activity(GO:0008808) phosphatidyltransferase activity(GO:0030572) |
| 0.2 | 1.0 | GO:0017050 | sphinganine kinase activity(GO:0008481) D-erythro-sphingosine kinase activity(GO:0017050) |
| 0.2 | 2.3 | GO:0016920 | pyroglutamyl-peptidase activity(GO:0016920) |
| 0.2 | 1.5 | GO:0003896 | DNA primase activity(GO:0003896) |
| 0.2 | 3.9 | GO:0004385 | guanylate kinase activity(GO:0004385) |
| 0.1 | 2.7 | GO:0080025 | phosphatidylinositol-3,5-bisphosphate binding(GO:0080025) |
| 0.1 | 1.9 | GO:0008093 | cytoskeletal adaptor activity(GO:0008093) |
| 0.0 | 1.8 | GO:0005484 | SNAP receptor activity(GO:0005484) |
| 0.0 | 16.7 | GO:0003700 | nucleic acid binding transcription factor activity(GO:0001071) transcription factor activity, sequence-specific DNA binding(GO:0003700) |