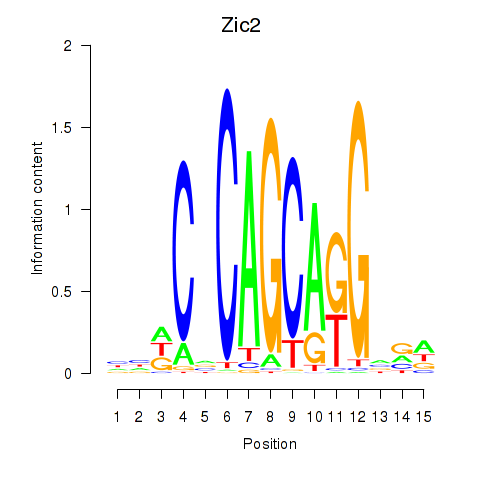
Motif ID: Zic2
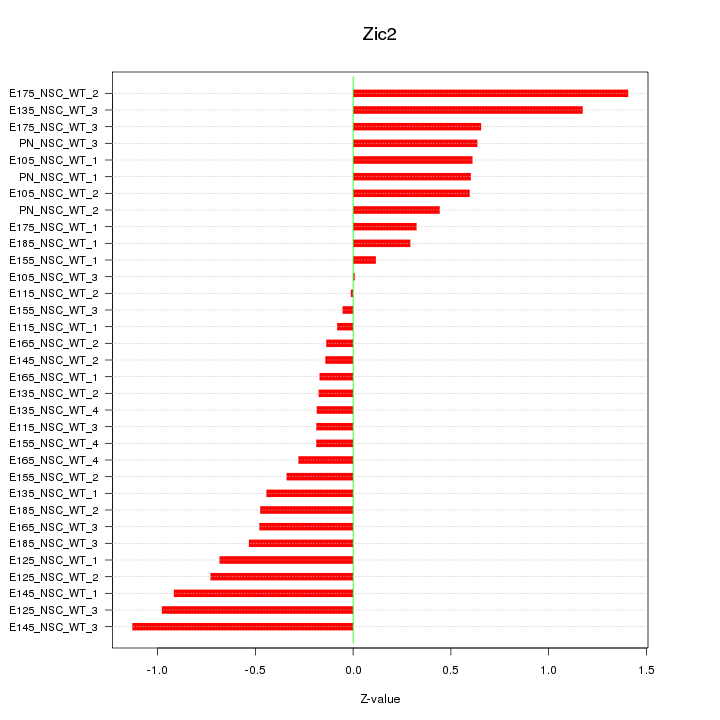
Z-value: 0.580
Transcription factors associated with Zic2:
| Gene Symbol | Entrez ID | Gene Name |
|---|---|---|
| Zic2 | ENSMUSG00000061524.8 | Zic2 |
Activity-expression correlation:
| Gene Symbol | Promoter | Pearson corr. coef. | P-value | Plot |
|---|---|---|---|---|
| Zic2 | mm10_v2_chr14_+_122475397_122475435 | 0.34 | 5.5e-02 | Click! |

Top targets:
Gene overrepresentation in biological_process category:
| Log-likelihood per target | Total log-likelihood | Term | Description |
|---|---|---|---|
| 2.3 | 7.0 | GO:2001139 | negative regulation of postsynaptic membrane organization(GO:1901627) negative regulation of dendritic spine maintenance(GO:1902951) negative regulation of phospholipid efflux(GO:1902999) regulation of lipid transport across blood brain barrier(GO:1903000) negative regulation of lipid transport across blood brain barrier(GO:1903001) positive regulation of lipid transport across blood brain barrier(GO:1903002) negative regulation of phospholipid transport(GO:2001139) |
| 0.4 | 1.2 | GO:0032474 | otolith morphogenesis(GO:0032474) |
| 0.4 | 1.2 | GO:0006601 | creatine biosynthetic process(GO:0006601) |
| 0.3 | 1.0 | GO:0032488 | Cdc42 protein signal transduction(GO:0032488) |
| 0.3 | 1.0 | GO:0021759 | globus pallidus development(GO:0021759) |
| 0.3 | 1.5 | GO:0051045 | negative regulation of membrane protein ectodomain proteolysis(GO:0051045) |
| 0.3 | 0.9 | GO:0048496 | maintenance of organ identity(GO:0048496) |
| 0.3 | 0.8 | GO:0002184 | cytoplasmic translational termination(GO:0002184) |
| 0.3 | 1.4 | GO:0047484 | regulation of response to osmotic stress(GO:0047484) |
| 0.3 | 1.1 | GO:0043490 | malate-aspartate shuttle(GO:0043490) |
| 0.2 | 0.7 | GO:0061743 | motor learning(GO:0061743) |
| 0.2 | 1.0 | GO:2000255 | negative regulation of male germ cell proliferation(GO:2000255) |
| 0.2 | 0.6 | GO:0006931 | substrate-dependent cell migration, cell attachment to substrate(GO:0006931) |
| 0.2 | 0.6 | GO:0051031 | tRNA transport(GO:0051031) |
| 0.2 | 0.8 | GO:0031581 | hemidesmosome assembly(GO:0031581) |
| 0.2 | 0.6 | GO:0010248 | B cell negative selection(GO:0002352) establishment or maintenance of transmembrane electrochemical gradient(GO:0010248) |
| 0.2 | 0.5 | GO:0035928 | RNA import into mitochondrion(GO:0035927) rRNA import into mitochondrion(GO:0035928) |
| 0.2 | 0.5 | GO:2000564 | regulation of MyD88-dependent toll-like receptor signaling pathway(GO:0034124) CD8-positive, alpha-beta T cell proliferation(GO:0035740) negative regulation of regulatory T cell differentiation(GO:0045590) regulation of CD8-positive, alpha-beta T cell proliferation(GO:2000564) |
| 0.2 | 0.5 | GO:0032696 | negative regulation of interleukin-13 production(GO:0032696) trachea submucosa development(GO:0061152) trachea gland development(GO:0061153) odontoblast differentiation(GO:0071895) |
| 0.2 | 0.4 | GO:0035434 | copper ion transmembrane transport(GO:0035434) |
| 0.2 | 0.5 | GO:0002554 | serotonin secretion by platelet(GO:0002554) interleukin-3 production(GO:0032632) beta selection(GO:0043366) |
| 0.2 | 0.7 | GO:0014012 | peripheral nervous system axon regeneration(GO:0014012) |
| 0.2 | 0.5 | GO:0003032 | detection of oxygen(GO:0003032) |
| 0.2 | 0.8 | GO:2000507 | positive regulation of energy homeostasis(GO:2000507) |
| 0.2 | 0.5 | GO:1902037 | positive regulation of transcription from RNA polymerase II promoter in response to oxidative stress(GO:0036091) negative regulation of hematopoietic stem cell differentiation(GO:1902037) |
| 0.2 | 1.4 | GO:0045719 | negative regulation of glycogen biosynthetic process(GO:0045719) negative regulation of glycogen metabolic process(GO:0070874) |
| 0.2 | 0.6 | GO:0030576 | Cajal body organization(GO:0030576) |
| 0.1 | 0.4 | GO:0010814 | substance P catabolic process(GO:0010814) calcitonin catabolic process(GO:0010816) endothelin maturation(GO:0034959) |
| 0.1 | 0.9 | GO:1903352 | ornithine transport(GO:0015822) L-ornithine transmembrane transport(GO:1903352) |
| 0.1 | 0.4 | GO:0036118 | hyaluranon cable assembly(GO:0036118) regulation of hyaluranon cable assembly(GO:1900104) positive regulation of hyaluranon cable assembly(GO:1900106) |
| 0.1 | 1.4 | GO:0061032 | visceral serous pericardium development(GO:0061032) |
| 0.1 | 1.3 | GO:0048681 | negative regulation of axon regeneration(GO:0048681) |
| 0.1 | 0.7 | GO:0070236 | negative regulation of activation-induced cell death of T cells(GO:0070236) |
| 0.1 | 0.5 | GO:2001015 | negative regulation of skeletal muscle cell differentiation(GO:2001015) |
| 0.1 | 0.8 | GO:0044829 | positive regulation by host of viral genome replication(GO:0044829) |
| 0.1 | 2.2 | GO:0032060 | bleb assembly(GO:0032060) |
| 0.1 | 0.6 | GO:0007386 | compartment pattern specification(GO:0007386) |
| 0.1 | 0.3 | GO:0046900 | tetrahydrofolylpolyglutamate metabolic process(GO:0046900) |
| 0.1 | 0.7 | GO:0048934 | peripheral nervous system neuron differentiation(GO:0048934) peripheral nervous system neuron development(GO:0048935) |
| 0.1 | 1.1 | GO:0043568 | positive regulation of insulin-like growth factor receptor signaling pathway(GO:0043568) |
| 0.1 | 0.3 | GO:0010838 | positive regulation of keratinocyte proliferation(GO:0010838) |
| 0.1 | 1.0 | GO:0051639 | actin filament network formation(GO:0051639) |
| 0.1 | 0.3 | GO:1904706 | negative regulation of vascular smooth muscle cell proliferation(GO:1904706) positive regulation of vascular smooth muscle cell differentiation(GO:1905065) |
| 0.1 | 0.3 | GO:1902358 | sulfate transmembrane transport(GO:1902358) |
| 0.1 | 0.3 | GO:0010898 | positive regulation of triglyceride catabolic process(GO:0010898) |
| 0.1 | 1.0 | GO:0019800 | peptide cross-linking via chondroitin 4-sulfate glycosaminoglycan(GO:0019800) |
| 0.1 | 0.5 | GO:0021764 | amygdala development(GO:0021764) |
| 0.1 | 0.3 | GO:0006533 | aspartate catabolic process(GO:0006533) D-amino acid catabolic process(GO:0019478) |
| 0.1 | 0.6 | GO:0006123 | mitochondrial electron transport, cytochrome c to oxygen(GO:0006123) |
| 0.1 | 0.7 | GO:0010273 | detoxification of copper ion(GO:0010273) cellular response to zinc ion(GO:0071294) stress response to copper ion(GO:1990169) |
| 0.1 | 0.4 | GO:1904694 | negative regulation of vascular smooth muscle contraction(GO:1904694) |
| 0.1 | 0.3 | GO:0003056 | regulation of vascular smooth muscle contraction(GO:0003056) |
| 0.1 | 0.4 | GO:0007039 | protein catabolic process in the vacuole(GO:0007039) |
| 0.1 | 0.5 | GO:2000298 | regulation of Rho-dependent protein serine/threonine kinase activity(GO:2000298) |
| 0.1 | 0.3 | GO:0035574 | histone H4-K20 demethylation(GO:0035574) |
| 0.1 | 0.3 | GO:0046959 | habituation(GO:0046959) |
| 0.1 | 1.4 | GO:0042178 | xenobiotic catabolic process(GO:0042178) |
| 0.1 | 0.4 | GO:1903463 | mitotic cell cycle phase(GO:0098763) regulation of mitotic cell cycle DNA replication(GO:1903463) |
| 0.1 | 0.3 | GO:2000224 | testosterone biosynthetic process(GO:0061370) regulation of testosterone biosynthetic process(GO:2000224) |
| 0.1 | 1.7 | GO:0090005 | negative regulation of establishment of protein localization to plasma membrane(GO:0090005) |
| 0.1 | 0.3 | GO:0042271 | susceptibility to natural killer cell mediated cytotoxicity(GO:0042271) |
| 0.1 | 0.7 | GO:0033314 | mitotic DNA replication checkpoint(GO:0033314) |
| 0.1 | 0.3 | GO:0097278 | complement-dependent cytotoxicity(GO:0097278) |
| 0.1 | 0.2 | GO:2000504 | positive regulation of blood vessel remodeling(GO:2000504) |
| 0.1 | 0.6 | GO:1902416 | positive regulation of mRNA binding(GO:1902416) positive regulation of RNA binding(GO:1905216) |
| 0.1 | 0.3 | GO:0030222 | eosinophil differentiation(GO:0030222) |
| 0.1 | 0.6 | GO:0000050 | urea cycle(GO:0000050) urea metabolic process(GO:0019627) |
| 0.1 | 0.4 | GO:0019695 | choline metabolic process(GO:0019695) |
| 0.1 | 0.6 | GO:0038028 | insulin receptor signaling pathway via phosphatidylinositol 3-kinase(GO:0038028) |
| 0.1 | 0.5 | GO:0007016 | cytoskeletal anchoring at plasma membrane(GO:0007016) |
| 0.1 | 0.2 | GO:0009405 | pathogenesis(GO:0009405) |
| 0.1 | 0.6 | GO:0051574 | positive regulation of histone H3-K9 methylation(GO:0051574) |
| 0.1 | 0.5 | GO:1990086 | lens fiber cell apoptotic process(GO:1990086) |
| 0.1 | 0.1 | GO:0002901 | mature B cell apoptotic process(GO:0002901) regulation of mature B cell apoptotic process(GO:0002905) negative regulation of mature B cell apoptotic process(GO:0002906) |
| 0.1 | 0.2 | GO:0006657 | CDP-choline pathway(GO:0006657) |
| 0.1 | 0.5 | GO:1902166 | negative regulation of intrinsic apoptotic signaling pathway in response to DNA damage by p53 class mediator(GO:1902166) |
| 0.1 | 0.1 | GO:0015819 | lysine transport(GO:0015819) |
| 0.1 | 1.2 | GO:0005980 | polysaccharide catabolic process(GO:0000272) glycogen catabolic process(GO:0005980) glucan catabolic process(GO:0009251) cellular polysaccharide catabolic process(GO:0044247) |
| 0.1 | 0.6 | GO:0060539 | diaphragm development(GO:0060539) |
| 0.1 | 0.8 | GO:0036065 | fucosylation(GO:0036065) |
| 0.1 | 0.4 | GO:0006013 | mannose metabolic process(GO:0006013) |
| 0.1 | 0.6 | GO:0009650 | UV protection(GO:0009650) |
| 0.1 | 0.3 | GO:1903887 | motile primary cilium assembly(GO:1903887) protein localization to ciliary transition zone(GO:1904491) |
| 0.1 | 0.9 | GO:0070207 | protein homotrimerization(GO:0070207) |
| 0.1 | 0.4 | GO:0051775 | response to redox state(GO:0051775) |
| 0.1 | 0.5 | GO:0018095 | protein polyglutamylation(GO:0018095) |
| 0.1 | 0.2 | GO:0032430 | positive regulation of phospholipase A2 activity(GO:0032430) |
| 0.1 | 0.3 | GO:0000712 | resolution of meiotic recombination intermediates(GO:0000712) |
| 0.1 | 0.2 | GO:0018298 | protein-chromophore linkage(GO:0018298) |
| 0.0 | 0.2 | GO:0070305 | response to cGMP(GO:0070305) cellular response to cGMP(GO:0071321) |
| 0.0 | 0.2 | GO:0019355 | nicotinamide nucleotide biosynthetic process from aspartate(GO:0019355) 'de novo' NAD biosynthetic process(GO:0034627) 'de novo' NAD biosynthetic process from aspartate(GO:0034628) |
| 0.0 | 0.1 | GO:0002014 | vasoconstriction of artery involved in ischemic response to lowering of systemic arterial blood pressure(GO:0002014) |
| 0.0 | 0.3 | GO:0042126 | nitrate metabolic process(GO:0042126) |
| 0.0 | 0.3 | GO:0030382 | sperm mitochondrion organization(GO:0030382) |
| 0.0 | 0.4 | GO:1903077 | negative regulation of protein localization to plasma membrane(GO:1903077) negative regulation of protein localization to cell periphery(GO:1904376) |
| 0.0 | 1.2 | GO:0007214 | gamma-aminobutyric acid signaling pathway(GO:0007214) |
| 0.0 | 0.3 | GO:0050861 | positive regulation of B cell receptor signaling pathway(GO:0050861) |
| 0.0 | 0.3 | GO:0046826 | negative regulation of protein export from nucleus(GO:0046826) |
| 0.0 | 0.2 | GO:0010756 | positive regulation of plasminogen activation(GO:0010756) |
| 0.0 | 0.2 | GO:0007066 | female meiosis sister chromatid cohesion(GO:0007066) |
| 0.0 | 0.3 | GO:0014816 | skeletal muscle satellite cell differentiation(GO:0014816) |
| 0.0 | 0.3 | GO:0003062 | regulation of heart rate by chemical signal(GO:0003062) |
| 0.0 | 0.1 | GO:0002322 | B cell proliferation involved in immune response(GO:0002322) |
| 0.0 | 0.2 | GO:0090110 | cargo loading into COPII-coated vesicle(GO:0090110) regulation of cargo loading into COPII-coated vesicle(GO:1901301) |
| 0.0 | 0.2 | GO:0007197 | adenylate cyclase-inhibiting G-protein coupled acetylcholine receptor signaling pathway(GO:0007197) phospholipase C-activating G-protein coupled acetylcholine receptor signaling pathway(GO:0007207) |
| 0.0 | 0.2 | GO:0010747 | positive regulation of plasma membrane long-chain fatty acid transport(GO:0010747) |
| 0.0 | 0.2 | GO:0006867 | asparagine transport(GO:0006867) glutamine transport(GO:0006868) |
| 0.0 | 0.1 | GO:0045085 | negative regulation of interleukin-2 biosynthetic process(GO:0045085) |
| 0.0 | 0.2 | GO:1902261 | positive regulation of delayed rectifier potassium channel activity(GO:1902261) positive regulation of voltage-gated potassium channel activity(GO:1903818) |
| 0.0 | 1.1 | GO:0046677 | response to antibiotic(GO:0046677) |
| 0.0 | 0.4 | GO:0007202 | activation of phospholipase C activity(GO:0007202) |
| 0.0 | 0.2 | GO:0032483 | regulation of Rab protein signal transduction(GO:0032483) |
| 0.0 | 0.5 | GO:0006268 | DNA unwinding involved in DNA replication(GO:0006268) |
| 0.0 | 0.2 | GO:0032534 | regulation of microvillus assembly(GO:0032534) |
| 0.0 | 0.3 | GO:0015074 | DNA integration(GO:0015074) |
| 0.0 | 0.6 | GO:0019369 | arachidonic acid metabolic process(GO:0019369) |
| 0.0 | 0.3 | GO:0006729 | tetrahydrobiopterin biosynthetic process(GO:0006729) tetrahydrobiopterin metabolic process(GO:0046146) |
| 0.0 | 0.2 | GO:0035188 | blastocyst hatching(GO:0001835) hatching(GO:0035188) organism emergence from protective structure(GO:0071684) |
| 0.0 | 0.2 | GO:0032026 | response to magnesium ion(GO:0032026) |
| 0.0 | 0.1 | GO:0006432 | phenylalanyl-tRNA aminoacylation(GO:0006432) |
| 0.0 | 0.4 | GO:0035814 | negative regulation of renal sodium excretion(GO:0035814) |
| 0.0 | 0.5 | GO:0006516 | glycoprotein catabolic process(GO:0006516) |
| 0.0 | 0.1 | GO:0001661 | conditioned taste aversion(GO:0001661) |
| 0.0 | 0.1 | GO:0006987 | activation of signaling protein activity involved in unfolded protein response(GO:0006987) |
| 0.0 | 0.1 | GO:0043456 | regulation of pentose-phosphate shunt(GO:0043456) |
| 0.0 | 0.6 | GO:0021521 | ventral spinal cord interneuron specification(GO:0021521) cell fate specification involved in pattern specification(GO:0060573) |
| 0.0 | 0.1 | GO:0006478 | peptidyl-tyrosine sulfation(GO:0006478) |
| 0.0 | 0.1 | GO:0038128 | ERBB2 signaling pathway(GO:0038128) |
| 0.0 | 0.1 | GO:0006049 | UDP-N-acetylglucosamine catabolic process(GO:0006049) |
| 0.0 | 0.3 | GO:0006654 | phosphatidic acid biosynthetic process(GO:0006654) phosphatidic acid metabolic process(GO:0046473) |
| 0.0 | 0.5 | GO:0046185 | aldehyde catabolic process(GO:0046185) |
| 0.0 | 0.5 | GO:0001574 | ganglioside biosynthetic process(GO:0001574) |
| 0.0 | 0.3 | GO:0042711 | maternal behavior(GO:0042711) |
| 0.0 | 0.4 | GO:0045943 | positive regulation of transcription from RNA polymerase I promoter(GO:0045943) |
| 0.0 | 0.1 | GO:0046501 | protoporphyrinogen IX metabolic process(GO:0046501) |
| 0.0 | 0.6 | GO:0006607 | NLS-bearing protein import into nucleus(GO:0006607) |
| 0.0 | 0.2 | GO:0009404 | toxin metabolic process(GO:0009404) |
| 0.0 | 0.2 | GO:0061052 | negative regulation of cell growth involved in cardiac muscle cell development(GO:0061052) |
| 0.0 | 0.1 | GO:0040031 | snRNA modification(GO:0040031) |
| 0.0 | 0.4 | GO:0032933 | response to sterol depletion(GO:0006991) SREBP signaling pathway(GO:0032933) cellular response to sterol depletion(GO:0071501) |
| 0.0 | 0.5 | GO:2000398 | regulation of T cell differentiation in thymus(GO:0033081) regulation of thymocyte aggregation(GO:2000398) |
| 0.0 | 0.3 | GO:0042048 | olfactory behavior(GO:0042048) |
| 0.0 | 0.1 | GO:0010700 | negative regulation of norepinephrine secretion(GO:0010700) microglial cell migration(GO:1904124) regulation of microglial cell migration(GO:1904139) |
| 0.0 | 0.2 | GO:0034315 | regulation of Arp2/3 complex-mediated actin nucleation(GO:0034315) |
| 0.0 | 0.3 | GO:2000353 | positive regulation of endothelial cell apoptotic process(GO:2000353) |
| 0.0 | 0.2 | GO:0046464 | neutral lipid catabolic process(GO:0046461) acylglycerol catabolic process(GO:0046464) |
| 0.0 | 0.6 | GO:2000249 | regulation of actin cytoskeleton reorganization(GO:2000249) |
| 0.0 | 0.5 | GO:0030201 | heparan sulfate proteoglycan metabolic process(GO:0030201) |
| 0.0 | 0.5 | GO:0046827 | positive regulation of protein export from nucleus(GO:0046827) |
| 0.0 | 0.2 | GO:1901621 | regulation of smoothened signaling pathway involved in dorsal/ventral neural tube patterning(GO:1901620) negative regulation of smoothened signaling pathway involved in dorsal/ventral neural tube patterning(GO:1901621) |
| 0.0 | 0.1 | GO:0015862 | uridine transport(GO:0015862) |
| 0.0 | 0.1 | GO:0021747 | cochlear nucleus development(GO:0021747) |
| 0.0 | 0.1 | GO:0051189 | Mo-molybdopterin cofactor biosynthetic process(GO:0006777) Mo-molybdopterin cofactor metabolic process(GO:0019720) molybdopterin cofactor biosynthetic process(GO:0032324) molybdopterin cofactor metabolic process(GO:0043545) prosthetic group metabolic process(GO:0051189) |
| 0.0 | 0.3 | GO:2000001 | regulation of DNA damage checkpoint(GO:2000001) |
| 0.0 | 1.1 | GO:0001658 | branching involved in ureteric bud morphogenesis(GO:0001658) |
| 0.0 | 0.1 | GO:0051771 | negative regulation of nitric-oxide synthase biosynthetic process(GO:0051771) |
| 0.0 | 0.5 | GO:0002063 | chondrocyte development(GO:0002063) |
| 0.0 | 0.9 | GO:0002066 | columnar/cuboidal epithelial cell development(GO:0002066) |
| 0.0 | 0.2 | GO:0045324 | late endosome to vacuole transport(GO:0045324) |
| 0.0 | 0.1 | GO:0070829 | heterochromatin maintenance(GO:0070829) |
| 0.0 | 0.1 | GO:1900262 | regulation of DNA-directed DNA polymerase activity(GO:1900262) positive regulation of DNA-directed DNA polymerase activity(GO:1900264) |
| 0.0 | 0.1 | GO:0060754 | positive regulation of mast cell chemotaxis(GO:0060754) regulation of vascular wound healing(GO:0061043) |
| 0.0 | 0.7 | GO:0016601 | Rac protein signal transduction(GO:0016601) |
| 0.0 | 0.2 | GO:0035024 | negative regulation of Rho protein signal transduction(GO:0035024) |
| 0.0 | 0.1 | GO:0048096 | chromatin-mediated maintenance of transcription(GO:0048096) |
| 0.0 | 0.1 | GO:0048251 | elastic fiber assembly(GO:0048251) |
| 0.0 | 0.3 | GO:0000188 | inactivation of MAPK activity(GO:0000188) |
| 0.0 | 0.1 | GO:0002934 | desmosome organization(GO:0002934) |
| 0.0 | 0.0 | GO:0002606 | dendritic cell antigen processing and presentation(GO:0002468) regulation of dendritic cell antigen processing and presentation(GO:0002604) positive regulation of dendritic cell antigen processing and presentation(GO:0002606) |
| 0.0 | 0.3 | GO:1902043 | positive regulation of extrinsic apoptotic signaling pathway via death domain receptors(GO:1902043) |
| 0.0 | 0.1 | GO:0007213 | G-protein coupled acetylcholine receptor signaling pathway(GO:0007213) |
| 0.0 | 0.8 | GO:0051489 | regulation of filopodium assembly(GO:0051489) |
| 0.0 | 0.1 | GO:0031937 | positive regulation of chromatin silencing(GO:0031937) |
| 0.0 | 0.0 | GO:0019482 | beta-alanine metabolic process(GO:0019482) |
| 0.0 | 0.1 | GO:0071394 | cellular response to testosterone stimulus(GO:0071394) |
| 0.0 | 0.1 | GO:0042590 | antigen processing and presentation of exogenous peptide antigen via MHC class I(GO:0042590) |
| 0.0 | 0.0 | GO:0048239 | negative regulation of DNA recombination at telomere(GO:0048239) regulation of DNA recombination at telomere(GO:0072695) |
| 0.0 | 0.2 | GO:0009083 | branched-chain amino acid catabolic process(GO:0009083) |
| 0.0 | 0.0 | GO:0052428 | modulation of molecular function in other organism(GO:0044359) negative regulation of molecular function in other organism(GO:0044362) negative regulation of molecular function in other organism involved in symbiotic interaction(GO:0052204) modulation of molecular function in other organism involved in symbiotic interaction(GO:0052205) negative regulation by host of symbiont molecular function(GO:0052405) modification by host of symbiont molecular function(GO:0052428) |
| 0.0 | 0.3 | GO:0006879 | cellular iron ion homeostasis(GO:0006879) |
| 0.0 | 0.1 | GO:0048280 | vesicle fusion with Golgi apparatus(GO:0048280) |
| 0.0 | 0.1 | GO:0036506 | maintenance of unfolded protein(GO:0036506) maintenance of unfolded protein involved in ERAD pathway(GO:1904378) |
| 0.0 | 0.1 | GO:0043951 | negative regulation of cAMP-mediated signaling(GO:0043951) |
| 0.0 | 0.1 | GO:0060479 | lung cell differentiation(GO:0060479) lung epithelial cell differentiation(GO:0060487) |
| 0.0 | 0.1 | GO:0034472 | snRNA 3'-end processing(GO:0034472) |
| 0.0 | 0.1 | GO:1903624 | regulation of apoptotic DNA fragmentation(GO:1902510) regulation of DNA catabolic process(GO:1903624) |
| 0.0 | 0.8 | GO:0010923 | negative regulation of phosphatase activity(GO:0010923) |
| 0.0 | 0.1 | GO:0035751 | regulation of lysosomal lumen pH(GO:0035751) |
| 0.0 | 0.2 | GO:0072600 | establishment of protein localization to Golgi(GO:0072600) |
Gene overrepresentation in cellular_component category:
| Log-likelihood per target | Total log-likelihood | Term | Description |
|---|---|---|---|
| 2.3 | 7.0 | GO:0034363 | intermediate-density lipoprotein particle(GO:0034363) |
| 0.3 | 0.9 | GO:0097543 | ciliary inversin compartment(GO:0097543) |
| 0.3 | 0.8 | GO:0018444 | translation release factor complex(GO:0018444) |
| 0.2 | 1.0 | GO:0032127 | dense core granule membrane(GO:0032127) |
| 0.2 | 0.6 | GO:0036488 | CHOP-C/EBP complex(GO:0036488) |
| 0.2 | 0.6 | GO:0071953 | fibrinogen complex(GO:0005577) elastic fiber(GO:0071953) |
| 0.2 | 0.3 | GO:0016234 | inclusion body(GO:0016234) |
| 0.2 | 0.7 | GO:0043259 | laminin-10 complex(GO:0043259) |
| 0.2 | 0.5 | GO:0072534 | perineuronal net(GO:0072534) |
| 0.2 | 0.6 | GO:0019815 | B cell receptor complex(GO:0019815) |
| 0.1 | 0.7 | GO:0044301 | climbing fiber(GO:0044301) |
| 0.1 | 0.4 | GO:0031983 | vesicle lumen(GO:0031983) |
| 0.1 | 0.5 | GO:0070022 | transforming growth factor beta receptor homodimeric complex(GO:0070022) |
| 0.1 | 0.3 | GO:0071821 | FANCM-MHF complex(GO:0071821) |
| 0.1 | 0.4 | GO:0033093 | Weibel-Palade body(GO:0033093) |
| 0.1 | 0.3 | GO:0097227 | sperm annulus(GO:0097227) |
| 0.1 | 0.6 | GO:0005751 | mitochondrial respiratory chain complex IV(GO:0005751) |
| 0.1 | 1.0 | GO:0005791 | rough endoplasmic reticulum(GO:0005791) |
| 0.1 | 1.2 | GO:0043205 | fibril(GO:0043205) |
| 0.1 | 1.2 | GO:1902710 | GABA receptor complex(GO:1902710) GABA-A receptor complex(GO:1902711) |
| 0.1 | 0.5 | GO:1990907 | beta-catenin-TCF complex(GO:1990907) |
| 0.1 | 0.6 | GO:0070531 | BRCA1-A complex(GO:0070531) |
| 0.1 | 0.5 | GO:0005916 | fascia adherens(GO:0005916) |
| 0.1 | 0.7 | GO:0046930 | pore complex(GO:0046930) |
| 0.1 | 0.2 | GO:0097233 | lamellar body membrane(GO:0097232) alveolar lamellar body membrane(GO:0097233) |
| 0.1 | 0.2 | GO:0032311 | angiogenin-PRI complex(GO:0032311) |
| 0.0 | 0.1 | GO:0071008 | U2-type post-mRNA release spliceosomal complex(GO:0071008) |
| 0.0 | 0.1 | GO:1990597 | AIP1-IRE1 complex(GO:1990597) |
| 0.0 | 1.0 | GO:0043218 | compact myelin(GO:0043218) |
| 0.0 | 0.9 | GO:0005581 | collagen trimer(GO:0005581) |
| 0.0 | 0.3 | GO:0097524 | sperm plasma membrane(GO:0097524) |
| 0.0 | 0.2 | GO:0036056 | filtration diaphragm(GO:0036056) slit diaphragm(GO:0036057) |
| 0.0 | 0.2 | GO:0001652 | granular component(GO:0001652) |
| 0.0 | 0.2 | GO:0033063 | Rad51B-Rad51C-Rad51D-XRCC2 complex(GO:0033063) |
| 0.0 | 0.2 | GO:0035032 | phosphatidylinositol 3-kinase complex, class III(GO:0035032) |
| 0.0 | 3.2 | GO:0005604 | basement membrane(GO:0005604) |
| 0.0 | 0.3 | GO:0044327 | dendritic spine membrane(GO:0032591) dendritic spine head(GO:0044327) |
| 0.0 | 0.5 | GO:0042555 | MCM complex(GO:0042555) |
| 0.0 | 0.2 | GO:0031265 | CD95 death-inducing signaling complex(GO:0031265) |
| 0.0 | 0.1 | GO:0036156 | inner dynein arm(GO:0036156) |
| 0.0 | 0.1 | GO:0016461 | unconventional myosin complex(GO:0016461) |
| 0.0 | 0.6 | GO:0035098 | ESC/E(Z) complex(GO:0035098) |
| 0.0 | 0.6 | GO:0045120 | pronucleus(GO:0045120) |
| 0.0 | 0.3 | GO:0005662 | DNA replication factor A complex(GO:0005662) |
| 0.0 | 0.3 | GO:0032279 | asymmetric synapse(GO:0032279) |
| 0.0 | 0.2 | GO:0030120 | vesicle coat(GO:0030120) |
| 0.0 | 1.5 | GO:0005758 | mitochondrial intermembrane space(GO:0005758) |
| 0.0 | 0.2 | GO:0032937 | SREBP-SCAP-Insig complex(GO:0032937) |
| 0.0 | 0.1 | GO:0046696 | lipopolysaccharide receptor complex(GO:0046696) |
| 0.0 | 0.2 | GO:0000439 | core TFIIH complex(GO:0000439) |
| 0.0 | 0.2 | GO:0042587 | glycogen granule(GO:0042587) |
| 0.0 | 1.7 | GO:0005643 | nuclear pore(GO:0005643) |
| 0.0 | 0.3 | GO:0036038 | MKS complex(GO:0036038) |
| 0.0 | 3.4 | GO:0005578 | proteinaceous extracellular matrix(GO:0005578) |
| 0.0 | 0.1 | GO:0005965 | protein farnesyltransferase complex(GO:0005965) |
| 0.0 | 0.2 | GO:0030665 | clathrin-coated vesicle membrane(GO:0030665) |
| 0.0 | 0.1 | GO:0031390 | Ctf18 RFC-like complex(GO:0031390) |
| 0.0 | 1.3 | GO:0072562 | blood microparticle(GO:0072562) |
| 0.0 | 0.1 | GO:0044298 | neuronal cell body membrane(GO:0032809) cell body membrane(GO:0044298) |
| 0.0 | 0.6 | GO:0016459 | myosin complex(GO:0016459) |
| 0.0 | 0.6 | GO:0015030 | Cajal body(GO:0015030) |
| 0.0 | 0.2 | GO:0030140 | trans-Golgi network transport vesicle(GO:0030140) |
| 0.0 | 0.2 | GO:0000506 | glycosylphosphatidylinositol-N-acetylglucosaminyltransferase (GPI-GnT) complex(GO:0000506) |
| 0.0 | 0.1 | GO:0032021 | NELF complex(GO:0032021) |
| 0.0 | 0.4 | GO:0048786 | presynaptic active zone(GO:0048786) |
| 0.0 | 3.2 | GO:0016324 | apical plasma membrane(GO:0016324) |
| 0.0 | 0.1 | GO:0000235 | astral microtubule(GO:0000235) |
| 0.0 | 0.1 | GO:0042825 | TAP complex(GO:0042825) |
| 0.0 | 1.7 | GO:0005884 | actin filament(GO:0005884) |
| 0.0 | 0.3 | GO:0031307 | integral component of mitochondrial outer membrane(GO:0031307) |
| 0.0 | 0.1 | GO:0034750 | Scrib-APC-beta-catenin complex(GO:0034750) |
| 0.0 | 0.2 | GO:0032590 | dendrite membrane(GO:0032590) |
| 0.0 | 3.3 | GO:0000139 | Golgi membrane(GO:0000139) |
Gene overrepresentation in molecular_function category:
| Log-likelihood per target | Total log-likelihood | Term | Description |
|---|---|---|---|
| 2.3 | 7.0 | GO:0046911 | hydroxyapatite binding(GO:0046848) metal chelating activity(GO:0046911) phosphatidylcholine-sterol O-acyltransferase activator activity(GO:0060228) |
| 0.5 | 1.5 | GO:0030368 | interleukin-17 receptor activity(GO:0030368) |
| 0.4 | 1.3 | GO:0030158 | protein xylosyltransferase activity(GO:0030158) |
| 0.2 | 1.0 | GO:0004667 | prostaglandin-D synthase activity(GO:0004667) |
| 0.2 | 1.1 | GO:0005314 | high-affinity glutamate transmembrane transporter activity(GO:0005314) |
| 0.2 | 0.6 | GO:0033829 | O-fucosylpeptide 3-beta-N-acetylglucosaminyltransferase activity(GO:0033829) |
| 0.2 | 0.6 | GO:0070140 | isopeptidase activity(GO:0070122) ubiquitin-like protein-specific isopeptidase activity(GO:0070138) SUMO-specific isopeptidase activity(GO:0070140) |
| 0.2 | 1.2 | GO:0000064 | L-ornithine transmembrane transporter activity(GO:0000064) |
| 0.2 | 0.5 | GO:0005534 | galactose binding(GO:0005534) |
| 0.2 | 0.8 | GO:2001070 | starch binding(GO:2001070) |
| 0.2 | 0.6 | GO:0016631 | enoyl-[acyl-carrier-protein] reductase activity(GO:0016631) 2,3-dihydroxy-2,3-dihydro-phenylpropionate dehydrogenase activity(GO:0018498) cis-2,3-dihydrodiol DDT dehydrogenase activity(GO:0018499) trans-9R,10R-dihydrodiolphenanthrene dehydrogenase activity(GO:0018500) cis-chlorobenzene dihydrodiol dehydrogenase activity(GO:0018501) 2,5-dichloro-2,5-cyclohexadiene-1,4-diol dehydrogenase activity(GO:0018502) trans-1,2-dihydrodiolphenanthrene dehydrogenase activity(GO:0018503) 3,4-dihydroxy-3,4-dihydrofluorene dehydrogenase activity(GO:0034790) benzo(a)pyrene-trans-11,12-dihydrodiol dehydrogenase activity(GO:0034805) benzo(a)pyrene-cis-4,5-dihydrodiol dehydrogenase activity(GO:0034809) citronellyl-CoA dehydrogenase activity(GO:0034824) menthone dehydrogenase activity(GO:0034838) phthalate 3,4-cis-dihydrodiol dehydrogenase activity(GO:0034912) cinnamate reductase activity(GO:0043786) NADPH-dependent curcumin reductase activity(GO:0052849) NADPH-dependent dihydrocurcumin reductase activity(GO:0052850) |
| 0.2 | 0.8 | GO:0043208 | glycosphingolipid binding(GO:0043208) |
| 0.1 | 0.4 | GO:0050501 | hyaluronan synthase activity(GO:0050501) |
| 0.1 | 0.9 | GO:0030284 | estrogen receptor activity(GO:0030284) |
| 0.1 | 0.6 | GO:0008184 | glycogen phosphorylase activity(GO:0008184) |
| 0.1 | 0.7 | GO:0005030 | neurotrophin receptor activity(GO:0005030) |
| 0.1 | 1.7 | GO:0005522 | profilin binding(GO:0005522) |
| 0.1 | 0.6 | GO:0008392 | arachidonic acid monooxygenase activity(GO:0008391) arachidonic acid epoxygenase activity(GO:0008392) |
| 0.1 | 1.3 | GO:0008517 | folic acid transporter activity(GO:0008517) water channel activity(GO:0015250) |
| 0.1 | 0.1 | GO:0015189 | arginine transmembrane transporter activity(GO:0015181) L-lysine transmembrane transporter activity(GO:0015189) |
| 0.1 | 1.5 | GO:0008191 | metalloendopeptidase inhibitor activity(GO:0008191) |
| 0.1 | 0.6 | GO:0070051 | fibrinogen binding(GO:0070051) |
| 0.1 | 0.6 | GO:0004768 | stearoyl-CoA 9-desaturase activity(GO:0004768) |
| 0.1 | 0.5 | GO:0032422 | purine-rich negative regulatory element binding(GO:0032422) |
| 0.1 | 0.5 | GO:0004792 | thiosulfate sulfurtransferase activity(GO:0004792) |
| 0.1 | 0.4 | GO:0004096 | aminoacylase activity(GO:0004046) catalase activity(GO:0004096) |
| 0.1 | 0.3 | GO:0004686 | elongation factor-2 kinase activity(GO:0004686) |
| 0.1 | 0.5 | GO:0004030 | aldehyde dehydrogenase [NAD(P)+] activity(GO:0004030) |
| 0.1 | 0.3 | GO:0043758 | acetate-CoA ligase (ADP-forming) activity(GO:0043758) |
| 0.1 | 0.8 | GO:0003747 | translation release factor activity(GO:0003747) translation termination factor activity(GO:0008079) |
| 0.1 | 0.4 | GO:0004104 | cholinesterase activity(GO:0004104) choline binding(GO:0033265) |
| 0.1 | 1.1 | GO:0005225 | volume-sensitive anion channel activity(GO:0005225) |
| 0.1 | 0.3 | GO:0035575 | histone demethylase activity (H4-K20 specific)(GO:0035575) |
| 0.1 | 0.5 | GO:0050786 | RAGE receptor binding(GO:0050786) |
| 0.1 | 1.4 | GO:0017166 | vinculin binding(GO:0017166) |
| 0.1 | 1.0 | GO:0001161 | intronic transcription regulatory region sequence-specific DNA binding(GO:0001161) |
| 0.1 | 0.3 | GO:0003884 | D-amino-acid oxidase activity(GO:0003884) aspartate oxidase activity(GO:0015922) |
| 0.1 | 0.5 | GO:0005049 | nuclear export signal receptor activity(GO:0005049) |
| 0.1 | 0.4 | GO:0016907 | G-protein coupled acetylcholine receptor activity(GO:0016907) |
| 0.1 | 0.2 | GO:0010385 | double-stranded methylated DNA binding(GO:0010385) |
| 0.1 | 0.6 | GO:0005007 | fibroblast growth factor-activated receptor activity(GO:0005007) |
| 0.1 | 1.6 | GO:0044653 | trehalase activity(GO:0015927) dextrin alpha-glucosidase activity(GO:0044653) starch alpha-glucosidase activity(GO:0044654) beta-glucanase activity(GO:0052736) beta-6-sulfate-N-acetylglucosaminidase activity(GO:0052769) glucan endo-1,4-beta-glucosidase activity(GO:0052859) |
| 0.1 | 0.3 | GO:0004692 | cGMP-dependent protein kinase activity(GO:0004692) |
| 0.1 | 0.5 | GO:0004716 | receptor signaling protein tyrosine kinase activity(GO:0004716) |
| 0.1 | 1.2 | GO:0050811 | GABA-A receptor activity(GO:0004890) GABA receptor binding(GO:0050811) |
| 0.1 | 0.4 | GO:0000182 | rDNA binding(GO:0000182) |
| 0.1 | 0.4 | GO:0010997 | anaphase-promoting complex binding(GO:0010997) |
| 0.1 | 0.2 | GO:0043546 | molybdopterin cofactor binding(GO:0043546) |
| 0.1 | 0.8 | GO:0004185 | serine-type carboxypeptidase activity(GO:0004185) |
| 0.1 | 0.2 | GO:0052658 | inositol-1,4,5-trisphosphate 5-phosphatase activity(GO:0052658) |
| 0.1 | 1.4 | GO:0001784 | phosphotyrosine binding(GO:0001784) |
| 0.1 | 1.1 | GO:0070402 | NADPH binding(GO:0070402) |
| 0.1 | 0.5 | GO:0035615 | clathrin adaptor activity(GO:0035615) endocytic adaptor activity(GO:0098748) |
| 0.1 | 0.4 | GO:0001665 | alpha-N-acetylgalactosaminide alpha-2,6-sialyltransferase activity(GO:0001665) |
| 0.1 | 0.6 | GO:1990715 | mRNA CDS binding(GO:1990715) |
| 0.1 | 0.3 | GO:0045503 | dynein light chain binding(GO:0045503) |
| 0.1 | 0.3 | GO:0004983 | neuropeptide Y receptor activity(GO:0004983) |
| 0.1 | 0.2 | GO:0009881 | photoreceptor activity(GO:0009881) |
| 0.1 | 0.1 | GO:0043183 | vascular endothelial growth factor receptor 1 binding(GO:0043183) |
| 0.1 | 0.2 | GO:0032450 | alpha-1,4-glucosidase activity(GO:0004558) oligo-1,6-glucosidase activity(GO:0004574) maltose alpha-glucosidase activity(GO:0032450) |
| 0.0 | 0.2 | GO:0005222 | intracellular cAMP activated cation channel activity(GO:0005222) |
| 0.0 | 0.1 | GO:0031752 | D5 dopamine receptor binding(GO:0031752) |
| 0.0 | 0.4 | GO:0032564 | dATP binding(GO:0032564) |
| 0.0 | 0.2 | GO:0004515 | nicotinamide-nucleotide adenylyltransferase activity(GO:0000309) nicotinate-nucleotide adenylyltransferase activity(GO:0004515) |
| 0.0 | 0.2 | GO:0035877 | death effector domain binding(GO:0035877) caspase binding(GO:0089720) |
| 0.0 | 1.2 | GO:0016769 | transferase activity, transferring nitrogenous groups(GO:0016769) |
| 0.0 | 0.9 | GO:0003841 | 1-acylglycerol-3-phosphate O-acyltransferase activity(GO:0003841) |
| 0.0 | 0.6 | GO:0051400 | BH domain binding(GO:0051400) |
| 0.0 | 0.9 | GO:0043747 | protein-N-terminal asparagine amidohydrolase activity(GO:0008418) UDP-3-O-[3-hydroxymyristoyl] N-acetylglucosamine deacetylase activity(GO:0008759) iprodione amidohydrolase activity(GO:0018748) (3,5-dichlorophenylurea)acetate amidohydrolase activity(GO:0018749) 4'-(2-hydroxyisopropyl)phenylurea amidohydrolase activity(GO:0034571) didemethylisoproturon amidohydrolase activity(GO:0034573) N-isopropylacetanilide amidohydrolase activity(GO:0034576) N-cyclohexylformamide amidohydrolase activity(GO:0034781) isonicotinic acid hydrazide hydrolase activity(GO:0034876) cis-aconitamide amidase activity(GO:0034882) gamma-N-formylaminovinylacetate hydrolase activity(GO:0034885) N2-acetyl-L-lysine deacetylase activity(GO:0043747) O-succinylbenzoate synthase activity(GO:0043748) indoleacetamide hydrolase activity(GO:0043864) N-acetylcitrulline deacetylase activity(GO:0043909) N-acetylgalactosamine-6-phosphate deacetylase activity(GO:0047419) diacetylchitobiose deacetylase activity(GO:0052773) chitooligosaccharide deacetylase activity(GO:0052790) |
| 0.0 | 0.5 | GO:0005537 | mannose binding(GO:0005537) |
| 0.0 | 0.6 | GO:0001013 | RNA polymerase I regulatory region DNA binding(GO:0001013) |
| 0.0 | 0.2 | GO:0004105 | choline-phosphate cytidylyltransferase activity(GO:0004105) |
| 0.0 | 0.5 | GO:0008484 | sulfuric ester hydrolase activity(GO:0008484) |
| 0.0 | 0.1 | GO:0016708 | nitric oxide dioxygenase activity(GO:0008941) oxidoreductase activity, acting on paired donors, with incorporation or reduction of molecular oxygen, NAD(P)H as one donor, and incorporation of two atoms of oxygen into one donor(GO:0016708) [methionine synthase] reductase activity(GO:0030586) iron-cytochrome-c reductase activity(GO:0047726) |
| 0.0 | 0.7 | GO:0043539 | protein serine/threonine kinase activator activity(GO:0043539) |
| 0.0 | 0.2 | GO:0015186 | L-asparagine transmembrane transporter activity(GO:0015182) L-glutamine transmembrane transporter activity(GO:0015186) |
| 0.0 | 0.3 | GO:0008301 | DNA binding, bending(GO:0008301) |
| 0.0 | 0.2 | GO:0004427 | inorganic diphosphatase activity(GO:0004427) |
| 0.0 | 0.1 | GO:0046538 | bisphosphoglycerate mutase activity(GO:0004082) bisphosphoglycerate 2-phosphatase activity(GO:0004083) phosphoglycerate mutase activity(GO:0004619) 2,3-bisphosphoglycerate-dependent phosphoglycerate mutase activity(GO:0046538) |
| 0.0 | 0.2 | GO:0034916 | 4-methyloctanoyl-CoA dehydrogenase activity(GO:0034580) naphthyl-2-methyl-succinyl-CoA dehydrogenase activity(GO:0034845) 2-methylhexanoyl-CoA dehydrogenase activity(GO:0034916) propionyl-CoA dehydrogenase activity(GO:0043820) thiol-driven fumarate reductase activity(GO:0043830) coenzyme F420-dependent 2,4,6-trinitrophenol reductase activity(GO:0052758) coenzyme F420-dependent 2,4,6-trinitrophenol hydride reductase activity(GO:0052759) coenzyme F420-dependent 2,4-dinitrophenol reductase activity(GO:0052760) |
| 0.0 | 0.1 | GO:0008476 | protein-tyrosine sulfotransferase activity(GO:0008476) |
| 0.0 | 0.1 | GO:0004645 | phosphorylase activity(GO:0004645) |
| 0.0 | 0.7 | GO:0001968 | fibronectin binding(GO:0001968) |
| 0.0 | 0.2 | GO:0008821 | crossover junction endodeoxyribonuclease activity(GO:0008821) |
| 0.0 | 0.7 | GO:0016676 | cytochrome-c oxidase activity(GO:0004129) heme-copper terminal oxidase activity(GO:0015002) oxidoreductase activity, acting on a heme group of donors(GO:0016675) oxidoreductase activity, acting on a heme group of donors, oxygen as acceptor(GO:0016676) |
| 0.0 | 0.1 | GO:0003827 | alpha-1,3-mannosylglycoprotein 2-beta-N-acetylglucosaminyltransferase activity(GO:0003827) |
| 0.0 | 1.0 | GO:0050840 | extracellular matrix binding(GO:0050840) |
| 0.0 | 0.3 | GO:0008271 | secondary active sulfate transmembrane transporter activity(GO:0008271) |
| 0.0 | 0.4 | GO:0005375 | copper ion transmembrane transporter activity(GO:0005375) |
| 0.0 | 0.5 | GO:0005540 | hyaluronic acid binding(GO:0005540) |
| 0.0 | 0.5 | GO:0004653 | polypeptide N-acetylgalactosaminyltransferase activity(GO:0004653) |
| 0.0 | 0.1 | GO:0004826 | phenylalanine-tRNA ligase activity(GO:0004826) |
| 0.0 | 1.4 | GO:0035251 | UDP-glucosyltransferase activity(GO:0035251) |
| 0.0 | 0.2 | GO:0004691 | cAMP-dependent protein kinase activity(GO:0004691) |
| 0.0 | 0.1 | GO:0035727 | lysophosphatidic acid binding(GO:0035727) lysophosphatidic acid receptor activity(GO:0070915) |
| 0.0 | 0.3 | GO:0097371 | MDM2/MDM4 family protein binding(GO:0097371) |
| 0.0 | 0.0 | GO:0042171 | lysophosphatidic acid acyltransferase activity(GO:0042171) |
| 0.0 | 0.1 | GO:0004489 | methylenetetrahydrofolate reductase (NAD(P)H) activity(GO:0004489) |
| 0.0 | 0.6 | GO:0008536 | Ran GTPase binding(GO:0008536) |
| 0.0 | 0.1 | GO:0016778 | diphosphotransferase activity(GO:0016778) |
| 0.0 | 0.6 | GO:0008139 | nuclear localization sequence binding(GO:0008139) |
| 0.0 | 0.1 | GO:0016174 | NAD(P)H oxidase activity(GO:0016174) |
| 0.0 | 0.1 | GO:0070905 | serine binding(GO:0070905) |
| 0.0 | 0.8 | GO:0005507 | copper ion binding(GO:0005507) |
| 0.0 | 0.2 | GO:0035184 | histone threonine kinase activity(GO:0035184) |
| 0.0 | 0.1 | GO:0015288 | porin activity(GO:0015288) |
| 0.0 | 0.4 | GO:0050431 | transforming growth factor beta binding(GO:0050431) |
| 0.0 | 0.4 | GO:0070006 | metalloaminopeptidase activity(GO:0070006) |
| 0.0 | 1.1 | GO:0020037 | heme binding(GO:0020037) |
| 0.0 | 0.6 | GO:0070063 | RNA polymerase binding(GO:0070063) |
| 0.0 | 0.1 | GO:0004663 | Rab geranylgeranyltransferase activity(GO:0004663) |
| 0.0 | 0.3 | GO:0000983 | transcription factor activity, RNA polymerase II core promoter sequence-specific(GO:0000983) |
| 0.0 | 0.1 | GO:0003836 | beta-galactoside (CMP) alpha-2,3-sialyltransferase activity(GO:0003836) |
| 0.0 | 0.1 | GO:1904288 | BAT3 complex binding(GO:1904288) |
| 0.0 | 0.2 | GO:0008758 | thiamine-pyrophosphatase activity(GO:0004787) UDP-2,3-diacylglucosamine hydrolase activity(GO:0008758) dATP pyrophosphohydrolase activity(GO:0008828) dihydroneopterin monophosphate phosphatase activity(GO:0019176) dihydroneopterin triphosphate pyrophosphohydrolase activity(GO:0019177) dTTP diphosphatase activity(GO:0036218) phosphocholine hydrolase activity(GO:0044606) |
| 0.0 | 0.2 | GO:0008420 | CTD phosphatase activity(GO:0008420) |
| 0.0 | 0.2 | GO:0047372 | acylglycerol lipase activity(GO:0047372) |
| 0.0 | 0.1 | GO:0005212 | structural constituent of eye lens(GO:0005212) |
| 0.0 | 0.1 | GO:0000702 | oxidized base lesion DNA N-glycosylase activity(GO:0000702) |
| 0.0 | 0.5 | GO:0032452 | histone demethylase activity(GO:0032452) |
| 0.0 | 0.2 | GO:0102391 | decanoate--CoA ligase activity(GO:0102391) |
| 0.0 | 0.4 | GO:0030371 | translation repressor activity(GO:0030371) |
| 0.0 | 0.6 | GO:0004864 | protein phosphatase inhibitor activity(GO:0004864) |
| 0.0 | 0.2 | GO:0016208 | AMP binding(GO:0016208) |
| 0.0 | 0.7 | GO:0005518 | collagen binding(GO:0005518) |
| 0.0 | 0.1 | GO:0033142 | progesterone receptor binding(GO:0033142) |
| 0.0 | 0.1 | GO:0046978 | TAP1 binding(GO:0046978) TAP2 binding(GO:0046979) |
| 0.0 | 0.1 | GO:0003689 | DNA clamp loader activity(GO:0003689) protein-DNA loading ATPase activity(GO:0033170) |
| 0.0 | 0.2 | GO:0005078 | MAP-kinase scaffold activity(GO:0005078) |
| 0.0 | 1.1 | GO:0003697 | single-stranded DNA binding(GO:0003697) |
| 0.0 | 0.9 | GO:0004222 | metalloendopeptidase activity(GO:0004222) |
| 0.0 | 0.1 | GO:0043426 | MRF binding(GO:0043426) |
| 0.0 | 0.2 | GO:0034946 | 2-oxoglutaryl-CoA thioesterase activity(GO:0034843) 2,4,4-trimethyl-3-oxopentanoyl-CoA thioesterase activity(GO:0034869) 3-isopropylbut-3-enoyl-CoA thioesterase activity(GO:0034946) glutaryl-CoA hydrolase activity(GO:0044466) |
| 0.0 | 1.6 | GO:0051015 | actin filament binding(GO:0051015) |