Project
PRJEB1986: zebrafish developmental stages transcriptome
Navigation
Downloads
Results for hbp1
Z-value: 0.45
Motif logo

Transcription factors associated with hbp1
| Gene Symbol | Gene ID | Gene Info |
|---|---|---|
|
hbp1
|
ENSDARG00000028517 | HMG-box transcription factor 1 |
Activity-expression correlation:
| Gene | Promoter | Pearson corr. coef. | P-value | Plot |
|---|---|---|---|---|
| hbp1 | dr11_v1_chr25_-_3469576_3469576 | 0.41 | 7.8e-02 | Click! |
Activity profile of hbp1 motif
Sorted Z-values of hbp1 motif
| Promoter | Log-likelihood | Transcript | Gene | Gene Info |
|---|---|---|---|---|
| chr18_+_13792490 | 2.59 |
ENSDART00000136754
|
cdh13
|
cadherin 13, H-cadherin (heart) |
| chr24_-_6898302 | 1.99 |
ENSDART00000158646
|
dpp6a
|
dipeptidyl-peptidase 6a |
| chr15_+_45643787 | 1.60 |
ENSDART00000055995
ENSDART00000157750 |
sagb
|
S-antigen; retina and pineal gland (arrestin) b |
| chr12_-_11457625 | 1.47 |
ENSDART00000012318
|
htra1b
|
HtrA serine peptidase 1b |
| chr23_+_10352921 | 1.21 |
ENSDART00000081193
|
KRT18 (1 of many)
|
si:ch211-133j6.3 |
| chr1_-_59252973 | 1.13 |
ENSDART00000167061
|
si:ch1073-286c18.5
|
si:ch1073-286c18.5 |
| chr1_-_14258409 | 1.00 |
ENSDART00000079359
|
pde5aa
|
phosphodiesterase 5A, cGMP-specific, a |
| chr7_-_66868543 | 0.94 |
ENSDART00000149680
|
ampd3a
|
adenosine monophosphate deaminase 3a |
| chr14_+_6159162 | 0.93 |
ENSDART00000128638
|
bscl2l
|
Bernardinelli-Seip congenital lipodystrophy 2, like |
| chr25_+_7229046 | 0.92 |
ENSDART00000149965
ENSDART00000041820 |
lingo1a
|
leucine rich repeat and Ig domain containing 1a |
| chr11_-_7355995 | 0.84 |
ENSDART00000156595
|
si:dkey-197i20.6
|
si:dkey-197i20.6 |
| chr22_+_35068046 | 0.78 |
ENSDART00000161660
ENSDART00000169573 |
si:ch73-173h19.3
|
si:ch73-173h19.3 |
| chr14_-_2196267 | 0.76 |
ENSDART00000161674
ENSDART00000125674 |
pcdh2ab8
pcdh2ab9
|
protocadherin 2 alpha b 8 protocadherin 2 alpha b 9 |
| chr3_+_35298078 | 0.72 |
ENSDART00000110126
|
cacng3b
|
calcium channel, voltage-dependent, gamma subunit 3b |
| chr14_-_46238186 | 0.71 |
ENSDART00000173245
|
si:ch211-113d11.6
|
si:ch211-113d11.6 |
| chr8_+_48613040 | 0.69 |
ENSDART00000121432
|
nppa
|
natriuretic peptide A |
| chr14_+_6159356 | 0.68 |
ENSDART00000157730
|
bscl2l
|
Bernardinelli-Seip congenital lipodystrophy 2, like |
| chr14_-_2199573 | 0.68 |
ENSDART00000124485
|
pcdh2ab8
|
protocadherin 2 alpha b 8 |
| chr21_+_45626136 | 0.66 |
ENSDART00000158742
|
irf1b
|
interferon regulatory factor 1b |
| chr22_-_26865181 | 0.64 |
ENSDART00000138311
|
hmox2a
|
heme oxygenase 2a |
| chr13_+_45709380 | 0.63 |
ENSDART00000192862
|
si:ch211-62a1.3
|
si:ch211-62a1.3 |
| chr13_-_22843562 | 0.61 |
ENSDART00000142738
|
pbld
|
phenazine biosynthesis like protein domain containing |
| chr22_-_25033105 | 0.59 |
ENSDART00000124220
|
nptxrb
|
neuronal pentraxin receptor b |
| chr6_-_40722200 | 0.58 |
ENSDART00000035101
|
kbtbd12
|
kelch repeat and BTB (POZ) domain containing 12 |
| chr17_-_26537928 | 0.57 |
ENSDART00000155692
ENSDART00000122366 |
ccser2a
|
coiled-coil serine-rich protein 2a |
| chr17_+_15297398 | 0.55 |
ENSDART00000156574
|
si:ch211-270g19.5
|
si:ch211-270g19.5 |
| chr18_+_45573251 | 0.54 |
ENSDART00000191309
|
kifc3
|
kinesin family member C3 |
| chr25_-_35182347 | 0.54 |
ENSDART00000115210
|
ano9a
|
anoctamin 9a |
| chr23_-_24343363 | 0.54 |
ENSDART00000166392
|
fam131c
|
family with sequence similarity 131, member C |
| chr6_-_24103666 | 0.50 |
ENSDART00000164915
|
scinla
|
scinderin like a |
| chr15_-_28107502 | 0.50 |
ENSDART00000152270
ENSDART00000167129 |
cryba1a
|
crystallin, beta A1a |
| chr20_+_1088658 | 0.50 |
ENSDART00000162991
|
BX537249.1
|
|
| chr6_+_23887314 | 0.50 |
ENSDART00000163188
|
znf648
|
zinc finger protein 648 |
| chr15_-_15357178 | 0.49 |
ENSDART00000106120
|
ywhag2
|
3-monooxygenase/tryptophan 5-monooxygenase activation protein, gamma polypeptide 2 |
| chr5_+_9434288 | 0.47 |
ENSDART00000162089
|
ugt2a7
|
UDP glucuronosyltransferase 2 family, polypeptide A7 |
| chr3_-_30609659 | 0.47 |
ENSDART00000182516
ENSDART00000187047 ENSDART00000110597 |
syt3
|
synaptotagmin III |
| chr19_-_27196090 | 0.45 |
ENSDART00000045616
|
gabbr1b
|
gamma-aminobutyric acid (GABA) B receptor, 1b |
| chr15_-_27972474 | 0.45 |
ENSDART00000162753
|
CR391930.1
|
|
| chr3_-_4303262 | 0.44 |
ENSDART00000112819
|
si:dkey-73p2.2
|
si:dkey-73p2.2 |
| chr1_+_10221568 | 0.42 |
ENSDART00000152424
|
npy2rl
|
neuropeptide Y receptor Y2, like |
| chr3_+_4346854 | 0.39 |
ENSDART00000004273
|
si:dkey-73p2.3
|
si:dkey-73p2.3 |
| chr3_-_36612877 | 0.39 |
ENSDART00000167164
|
si:dkeyp-72e1.7
|
si:dkeyp-72e1.7 |
| chr8_+_22582146 | 0.39 |
ENSDART00000157655
ENSDART00000189892 |
CT583651.2
|
|
| chr11_+_36243774 | 0.37 |
ENSDART00000023323
|
zgc:172270
|
zgc:172270 |
| chr19_-_32487469 | 0.37 |
ENSDART00000050130
|
gmpr
|
guanosine monophosphate reductase |
| chr25_-_31698550 | 0.36 |
ENSDART00000058400
|
lamb4
|
laminin, beta 4 |
| chr10_-_15405564 | 0.35 |
ENSDART00000020665
|
sgtb
|
small glutamine-rich tetratricopeptide repeat (TPR)-containing, beta |
| chr3_-_23407720 | 0.34 |
ENSDART00000155658
|
rapgefl1
|
Rap guanine nucleotide exchange factor (GEF)-like 1 |
| chr21_-_7035599 | 0.33 |
ENSDART00000139777
|
si:ch211-93g21.1
|
si:ch211-93g21.1 |
| chr16_-_52916248 | 0.33 |
ENSDART00000113931
|
zdhhc11
|
zinc finger, DHHC-type containing 11 |
| chr11_+_24877820 | 0.32 |
ENSDART00000006038
|
shisa4
|
shisa family member 4 |
| chr5_-_28149767 | 0.32 |
ENSDART00000051515
|
zgc:110329
|
zgc:110329 |
| chr7_+_27691647 | 0.32 |
ENSDART00000079091
|
cyp2r1
|
cytochrome P450, family 2, subfamily R, polypeptide 1 |
| chr13_+_18202703 | 0.31 |
ENSDART00000109642
|
tet1
|
tet methylcytosine dioxygenase 1 |
| chr17_+_21514777 | 0.30 |
ENSDART00000154633
|
chst15
|
carbohydrate (N-acetylgalactosamine 4-sulfate 6-O) sulfotransferase 15 |
| chr16_-_41439659 | 0.30 |
ENSDART00000191624
|
cpne4a
|
copine IVa |
| chr12_-_3453589 | 0.29 |
ENSDART00000175918
|
CABZ01063170.1
|
|
| chr20_-_44496245 | 0.29 |
ENSDART00000012229
|
fkbp1b
|
FK506 binding protein 1b |
| chr5_-_2721686 | 0.28 |
ENSDART00000169404
|
hspa5
|
heat shock protein 5 |
| chr16_+_46453176 | 0.27 |
ENSDART00000132793
|
rpz3
|
rapunzel 3 |
| chr23_+_2760573 | 0.27 |
ENSDART00000129719
|
top1
|
DNA topoisomerase I |
| chr16_-_51299061 | 0.27 |
ENSDART00000148677
|
serpinb1l4
|
serpin peptidase inhibitor, clade B (ovalbumin), member 1, like 4 |
| chr2_+_9061885 | 0.25 |
ENSDART00000028906
|
pigk
|
phosphatidylinositol glycan anchor biosynthesis, class K |
| chr24_+_4373033 | 0.22 |
ENSDART00000133360
|
ccny
|
cyclin Y |
| chr5_+_20437124 | 0.22 |
ENSDART00000159001
|
tmem119a
|
transmembrane protein 119a |
| chr22_+_7923713 | 0.22 |
ENSDART00000167210
|
CABZ01034691.1
|
|
| chr18_-_19103929 | 0.21 |
ENSDART00000188370
ENSDART00000177621 |
dennd4a
|
DENN/MADD domain containing 4A |
| chr1_-_47071979 | 0.21 |
ENSDART00000160817
|
itsn1
|
intersectin 1 (SH3 domain protein) |
| chr21_-_35325466 | 0.21 |
ENSDART00000134780
ENSDART00000145930 ENSDART00000076715 ENSDART00000065341 ENSDART00000162189 |
ublcp1
|
ubiquitin-like domain containing CTD phosphatase 1 |
| chr17_+_37253706 | 0.20 |
ENSDART00000076004
|
tmem62
|
transmembrane protein 62 |
| chr1_-_45341760 | 0.20 |
ENSDART00000149183
ENSDART00000148289 ENSDART00000110390 |
zgc:101679
|
zgc:101679 |
| chr3_+_11101585 | 0.19 |
ENSDART00000172103
|
sstr5
|
somatostatin receptor 5 |
| chr23_+_23182037 | 0.19 |
ENSDART00000137353
|
klhl17
|
kelch-like family member 17 |
| chr9_+_30577925 | 0.19 |
ENSDART00000139811
|
commd6
|
COMM domain containing 6 |
| chr3_-_23406964 | 0.19 |
ENSDART00000114723
|
rapgefl1
|
Rap guanine nucleotide exchange factor (GEF)-like 1 |
| chr1_-_33380011 | 0.19 |
ENSDART00000141347
ENSDART00000136383 |
cd99
|
CD99 molecule |
| chr11_+_30058139 | 0.18 |
ENSDART00000112254
|
nhsb
|
Nance-Horan syndrome b (congenital cataracts and dental anomalies) |
| chr1_+_6206950 | 0.18 |
ENSDART00000146473
|
retreg2
|
reticulophagy regulator family member 2 |
| chr12_+_2381213 | 0.17 |
ENSDART00000188007
|
LO018238.1
|
|
| chr15_+_31816835 | 0.17 |
ENSDART00000189658
ENSDART00000186634 ENSDART00000193032 ENSDART00000180401 |
frya
|
furry homolog a (Drosophila) |
| chr4_+_56379907 | 0.17 |
ENSDART00000169142
|
si:dkey-41c6.3
|
si:dkey-41c6.3 |
| chr17_-_26911852 | 0.16 |
ENSDART00000045842
|
rcan3
|
regulator of calcineurin 3 |
| chr4_-_72468168 | 0.16 |
ENSDART00000182995
ENSDART00000174067 |
CR788316.1
|
|
| chr20_-_46773258 | 0.16 |
ENSDART00000060653
|
si:ch211-57i17.5
|
si:ch211-57i17.5 |
| chr1_+_7414318 | 0.15 |
ENSDART00000127426
|
si:ch73-383l1.1
|
si:ch73-383l1.1 |
| chr21_-_22648007 | 0.15 |
ENSDART00000121788
|
gig2l
|
grass carp reovirus (GCRV)-induced gene 2l |
| chr22_-_7778895 | 0.14 |
ENSDART00000125489
|
si:ch73-44m9.3
|
si:ch73-44m9.3 |
| chr1_-_44901163 | 0.14 |
ENSDART00000145354
|
tcirg1a
|
T cell immune regulator 1, ATPase H+ transporting V0 subunit a3a |
| chr23_-_32092443 | 0.13 |
ENSDART00000133688
|
letmd1
|
LETM1 domain containing 1 |
| chr18_+_17611627 | 0.13 |
ENSDART00000046891
|
cetp
|
cholesteryl ester transfer protein, plasma |
| chr23_+_5490854 | 0.13 |
ENSDART00000175403
|
tulp1a
|
tubby like protein 1a |
| chr7_-_20836625 | 0.13 |
ENSDART00000192566
|
cldn15a
|
claudin 15a |
| chr10_-_34916208 | 0.13 |
ENSDART00000187371
|
ccna1
|
cyclin A1 |
| chr4_-_76027176 | 0.12 |
ENSDART00000165718
|
si:dkey-71l4.1
|
si:dkey-71l4.1 |
| chr15_-_19051152 | 0.12 |
ENSDART00000186453
|
arhgap32a
|
Rho GTPase activating protein 32a |
| chr15_+_1199407 | 0.12 |
ENSDART00000163827
|
mfsd1
|
major facilitator superfamily domain containing 1 |
| chr5_-_50600512 | 0.11 |
ENSDART00000190318
|
mctp1a
|
multiple C2 domains, transmembrane 1a |
| chr14_-_30945515 | 0.11 |
ENSDART00000161540
|
si:zfos-80g12.1
|
si:zfos-80g12.1 |
| chr12_+_5215795 | 0.11 |
ENSDART00000170270
|
SLC35G1
|
si:ch211-197g18.2 |
| chr12_-_48970299 | 0.11 |
ENSDART00000163734
|
rgrb
|
retinal G protein coupled receptor b |
| chr17_-_27419499 | 0.11 |
ENSDART00000186773
|
ythdf2
|
YTH N(6)-methyladenosine RNA binding protein 2 |
| chr15_+_32297441 | 0.10 |
ENSDART00000153657
|
trim3a
|
tripartite motif containing 3a |
| chr22_-_7778265 | 0.10 |
ENSDART00000097276
|
si:ch73-44m9.3
|
si:ch73-44m9.3 |
| chr14_+_918287 | 0.09 |
ENSDART00000167066
|
CU462913.1
|
|
| chr25_-_7650335 | 0.09 |
ENSDART00000089034
|
myo5ab
|
myosin VAb |
| chr20_-_27086143 | 0.09 |
ENSDART00000008590
|
itpk1a
|
inositol-tetrakisphosphate 1-kinase a |
| chr1_-_633356 | 0.09 |
ENSDART00000171019
|
appa
|
amyloid beta (A4) precursor protein a |
| chr16_+_7242610 | 0.09 |
ENSDART00000081477
|
sri
|
sorcin |
| chr23_-_11128601 | 0.09 |
ENSDART00000131232
|
cntn3a.2
|
contactin 3a, tandem duplicate 2 |
| chr13_+_14006118 | 0.09 |
ENSDART00000131875
ENSDART00000089528 |
atrn
|
attractin |
| chr5_+_20112032 | 0.08 |
ENSDART00000130554
|
isg15
|
ISG15 ubiquitin-like modifier |
| chr23_-_37291793 | 0.08 |
ENSDART00000083281
ENSDART00000187108 |
mul1b
|
mitochondrial E3 ubiquitin protein ligase 1b |
| chr21_-_2209012 | 0.08 |
ENSDART00000158345
|
zgc:162971
|
zgc:162971 |
| chr23_-_45111637 | 0.08 |
ENSDART00000179776
|
si:ch73-168d20.1
|
si:ch73-168d20.1 |
| chr18_+_50669456 | 0.07 |
ENSDART00000163005
|
si:dkey-151j17.4
|
si:dkey-151j17.4 |
| chr12_+_47698356 | 0.07 |
ENSDART00000112010
|
lzts2b
|
leucine zipper, putative tumor suppressor 2b |
| chr13_-_31389661 | 0.07 |
ENSDART00000134630
|
zdhhc16a
|
zinc finger, DHHC-type containing 16a |
| chr15_-_23793641 | 0.07 |
ENSDART00000122891
|
tmem97
|
transmembrane protein 97 |
| chr17_+_18810904 | 0.06 |
ENSDART00000130899
|
si:dkey-288a3.2
|
si:dkey-288a3.2 |
| chr23_+_27740592 | 0.05 |
ENSDART00000137875
|
dhh
|
desert hedgehog |
| chr12_+_38770654 | 0.05 |
ENSDART00000155367
|
kif19
|
kinesin family member 19 |
| chr4_-_73190246 | 0.04 |
ENSDART00000170842
|
LO018260.1
|
|
| chr4_-_75505048 | 0.04 |
ENSDART00000163665
|
si:dkey-71l4.5
|
si:dkey-71l4.5 |
| chr22_+_3238474 | 0.04 |
ENSDART00000157954
|
si:ch1073-178p5.3
|
si:ch1073-178p5.3 |
| chr6_+_29402997 | 0.04 |
ENSDART00000104298
|
ndufb5
|
NADH dehydrogenase (ubiquinone) 1 beta subcomplex 5 |
| chr4_-_76205022 | 0.04 |
ENSDART00000159687
ENSDART00000187593 |
si:ch211-106j21.5
|
si:ch211-106j21.5 |
| chr7_-_4461104 | 0.03 |
ENSDART00000023090
ENSDART00000140770 |
slc12a10.1
|
solute carrier family 12 (sodium/potassium/chloride transporters), member 10, tandem duplicate 1 |
| chr14_-_34512859 | 0.03 |
ENSDART00000140368
|
si:ch211-232m8.3
|
si:ch211-232m8.3 |
| chr4_-_68868229 | 0.03 |
ENSDART00000159219
|
si:dkey-264f17.5
|
si:dkey-264f17.5 |
| chr21_+_6034783 | 0.02 |
ENSDART00000169613
|
slc4a4b
|
solute carrier family 4 (sodium bicarbonate cotransporter), member 4b |
| chr4_+_77920666 | 0.02 |
ENSDART00000129523
|
ttll1
|
tubulin tyrosine ligase-like family, member 1 |
| chr5_+_12888816 | 0.02 |
ENSDART00000139632
|
gal3st1a
|
galactose-3-O-sulfotransferase 1a |
| chr23_-_31645760 | 0.01 |
ENSDART00000035031
|
sgk1
|
serum/glucocorticoid regulated kinase 1 |
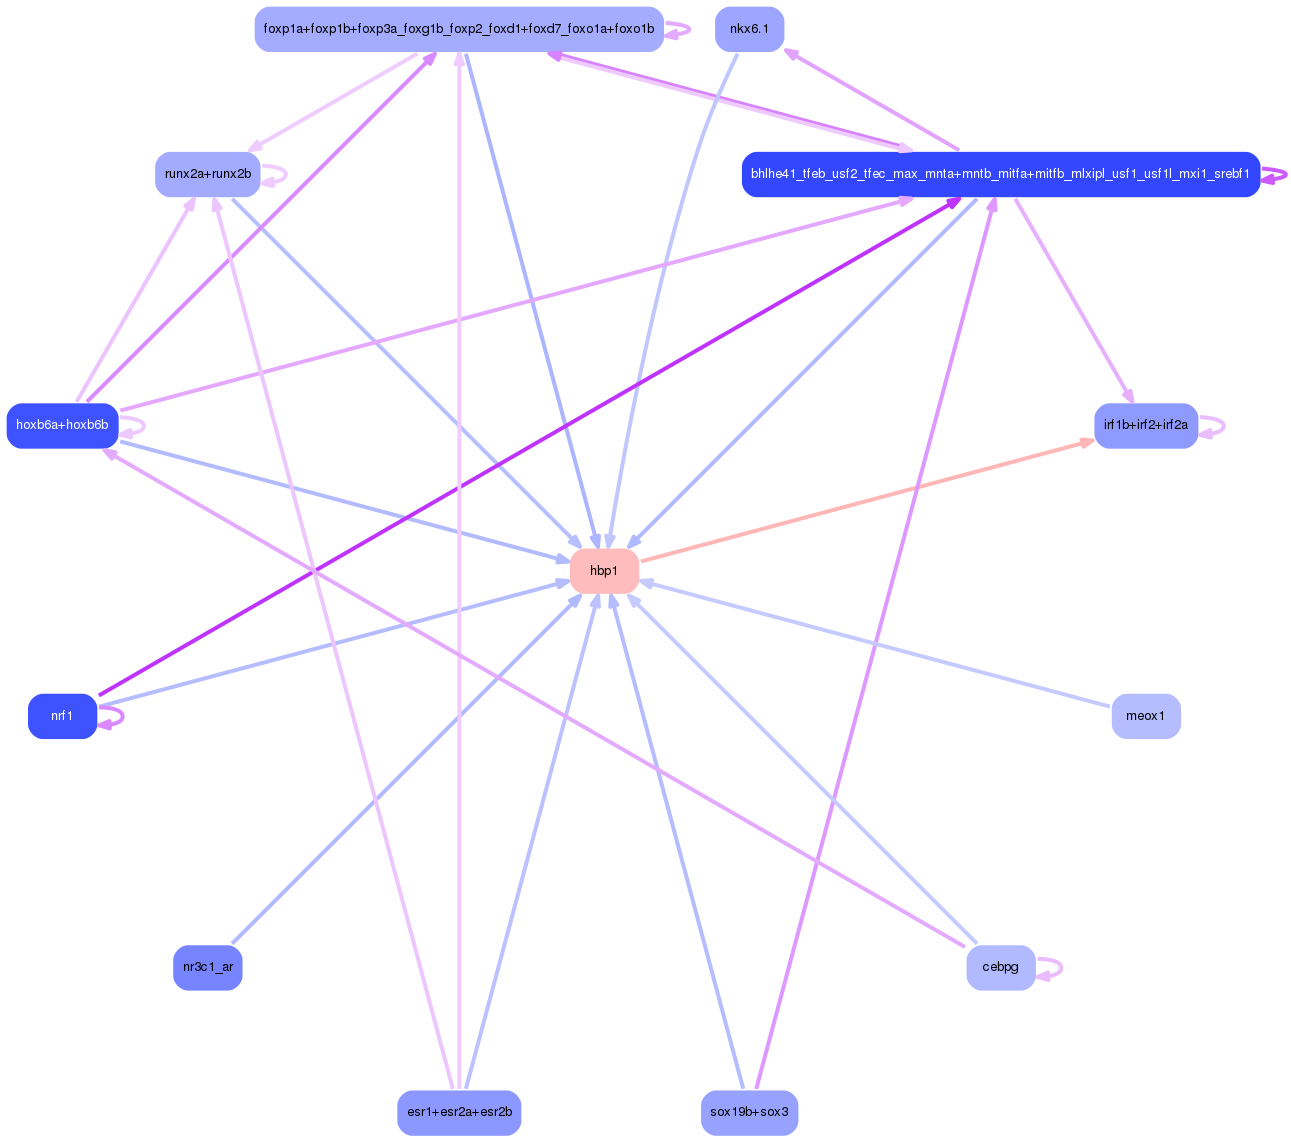
Network of associatons between targets according to the STRING database.

First level regulatory network of hbp1
Gene Ontology Analysis
Gene overrepresentation in biological process category:
| Log-likelihood per target | Total log-likelihood | Term | Description |
|---|---|---|---|
| 0.3 | 2.6 | GO:1902262 | apoptotic process involved in patterning of blood vessels(GO:1902262) |
| 0.2 | 0.7 | GO:1905072 | cardiac jelly development(GO:1905072) |
| 0.2 | 1.6 | GO:0034389 | lipid particle organization(GO:0034389) |
| 0.1 | 1.6 | GO:0002031 | G-protein coupled receptor internalization(GO:0002031) |
| 0.1 | 0.3 | GO:1903332 | regulation of protein folding(GO:1903332) positive regulation of protein folding(GO:1903334) regulation of chaperone-mediated protein folding(GO:1903644) positive regulation of chaperone-mediated protein folding(GO:1903646) |
| 0.1 | 0.4 | GO:0035095 | behavioral response to nicotine(GO:0035095) |
| 0.1 | 0.6 | GO:0006788 | heme oxidation(GO:0006788) |
| 0.1 | 0.2 | GO:0033690 | positive regulation of osteoblast proliferation(GO:0033690) |
| 0.1 | 0.9 | GO:0032264 | IMP salvage(GO:0032264) |
| 0.1 | 2.0 | GO:1901379 | regulation of potassium ion transmembrane transport(GO:1901379) |
| 0.1 | 0.3 | GO:0032656 | interleukin-13 production(GO:0032616) regulation of interleukin-13 production(GO:0032656) |
| 0.1 | 0.7 | GO:0050688 | regulation of defense response to virus(GO:0050688) |
| 0.1 | 0.5 | GO:0061588 | calcium activated phospholipid scrambling(GO:0061588) |
| 0.1 | 0.3 | GO:0070640 | vitamin D3 metabolic process(GO:0070640) cellular response to vitamin D(GO:0071305) |
| 0.0 | 0.2 | GO:1904031 | positive regulation of cyclin-dependent protein serine/threonine kinase activity(GO:0045737) positive regulation of cyclin-dependent protein kinase activity(GO:1904031) |
| 0.0 | 0.1 | GO:0034375 | high-density lipoprotein particle remodeling(GO:0034375) |
| 0.0 | 0.7 | GO:0098943 | neurotransmitter receptor transport, postsynaptic endosome to lysosome(GO:0098943) |
| 0.0 | 0.2 | GO:0016255 | attachment of GPI anchor to protein(GO:0016255) |
| 0.0 | 0.5 | GO:0043462 | regulation of ATPase activity(GO:0043462) |
| 0.0 | 0.1 | GO:1903537 | meiotic cell cycle process involved in oocyte maturation(GO:1903537) regulation of meiotic cell cycle process involved in oocyte maturation(GO:1903538) |
| 0.0 | 0.1 | GO:0032957 | inositol trisphosphate metabolic process(GO:0032957) |
| 0.0 | 0.9 | GO:0031103 | axon regeneration(GO:0031103) |
| 0.0 | 0.3 | GO:0042026 | protein refolding(GO:0042026) |
| 0.0 | 0.4 | GO:0006144 | purine nucleobase metabolic process(GO:0006144) |
| 0.0 | 0.1 | GO:1901031 | response to leucine(GO:0043201) cellular response to leucine(GO:0071233) regulation of response to reactive oxygen species(GO:1901031) |
| 0.0 | 0.1 | GO:2000391 | neutrophil extravasation(GO:0072672) regulation of neutrophil extravasation(GO:2000389) positive regulation of neutrophil extravasation(GO:2000391) |
| 0.0 | 0.3 | GO:0006265 | DNA topological change(GO:0006265) |
| 0.0 | 0.8 | GO:0007173 | epidermal growth factor receptor signaling pathway(GO:0007173) |
| 0.0 | 0.2 | GO:0032088 | negative regulation of NF-kappaB transcription factor activity(GO:0032088) |
| 0.0 | 0.2 | GO:0032483 | regulation of Rab protein signal transduction(GO:0032483) |
| 0.0 | 0.8 | GO:0071277 | cellular response to calcium ion(GO:0071277) |
| 0.0 | 0.4 | GO:0051014 | actin filament severing(GO:0051014) |
| 0.0 | 0.4 | GO:0070831 | basement membrane assembly(GO:0070831) |
| 0.0 | 0.1 | GO:0021877 | forebrain neuron fate commitment(GO:0021877) |
| 0.0 | 0.2 | GO:0071384 | cellular response to corticosteroid stimulus(GO:0071384) cellular response to glucocorticoid stimulus(GO:0071385) |
| 0.0 | 0.3 | GO:0019319 | hexose biosynthetic process(GO:0019319) monosaccharide biosynthetic process(GO:0046364) |
| 0.0 | 0.1 | GO:0007035 | vacuolar acidification(GO:0007035) pH reduction(GO:0045851) intracellular pH reduction(GO:0051452) |
Gene overrepresentation in cellular component category:
| Log-likelihood per target | Total log-likelihood | Term | Description |
|---|---|---|---|
| 0.1 | 0.4 | GO:1902560 | GMP reductase complex(GO:1902560) |
| 0.1 | 0.3 | GO:0072380 | TRC complex(GO:0072380) |
| 0.1 | 0.3 | GO:0034663 | endoplasmic reticulum chaperone complex(GO:0034663) |
| 0.1 | 1.6 | GO:0001917 | photoreceptor inner segment(GO:0001917) |
| 0.1 | 0.4 | GO:0038039 | G-protein coupled receptor dimeric complex(GO:0038037) G-protein coupled receptor heterodimeric complex(GO:0038039) G-protein coupled receptor complex(GO:0097648) |
| 0.0 | 2.6 | GO:0016342 | catenin complex(GO:0016342) |
| 0.0 | 0.2 | GO:0042765 | GPI-anchor transamidase complex(GO:0042765) |
| 0.0 | 2.0 | GO:0008076 | voltage-gated potassium channel complex(GO:0008076) potassium channel complex(GO:0034705) |
| 0.0 | 0.5 | GO:0033017 | sarcoplasmic reticulum membrane(GO:0033017) |
| 0.0 | 0.1 | GO:0001650 | fibrillar center(GO:0001650) |
| 0.0 | 0.7 | GO:0032281 | AMPA glutamate receptor complex(GO:0032281) |
| 0.0 | 0.4 | GO:0005605 | basal lamina(GO:0005605) laminin complex(GO:0043256) |
| 0.0 | 0.1 | GO:0061700 | GATOR2 complex(GO:0061700) |
| 0.0 | 0.1 | GO:0000220 | vacuolar proton-transporting V-type ATPase, V0 domain(GO:0000220) |
Gene overrepresentation in molecular function category:
| Log-likelihood per target | Total log-likelihood | Term | Description |
|---|---|---|---|
| 0.3 | 0.8 | GO:0005006 | epidermal growth factor-activated receptor activity(GO:0005006) |
| 0.1 | 0.4 | GO:0003920 | GMP reductase activity(GO:0003920) oxidoreductase activity, acting on NAD(P)H, nitrogenous group as acceptor(GO:0016657) |
| 0.1 | 2.0 | GO:0008239 | dipeptidyl-peptidase activity(GO:0008239) |
| 0.1 | 0.5 | GO:0042030 | ATPase inhibitor activity(GO:0042030) |
| 0.1 | 0.6 | GO:0004392 | heme oxygenase (decyclizing) activity(GO:0004392) |
| 0.1 | 0.9 | GO:0003876 | AMP deaminase activity(GO:0003876) adenosine-phosphate deaminase activity(GO:0047623) |
| 0.1 | 1.0 | GO:0047555 | 3',5'-cyclic-GMP phosphodiesterase activity(GO:0047555) |
| 0.1 | 0.4 | GO:0004965 | G-protein coupled GABA receptor activity(GO:0004965) |
| 0.1 | 1.5 | GO:0005520 | insulin-like growth factor binding(GO:0005520) |
| 0.0 | 0.2 | GO:0051059 | NF-kappaB binding(GO:0051059) |
| 0.0 | 1.1 | GO:0005154 | epidermal growth factor receptor binding(GO:0005154) |
| 0.0 | 0.3 | GO:0070579 | methylcytosine dioxygenase activity(GO:0070579) |
| 0.0 | 0.1 | GO:0047325 | inositol tetrakisphosphate 1-kinase activity(GO:0047325) inositol-1,3,4-trisphosphate 6-kinase activity(GO:0052725) inositol-1,3,4-trisphosphate 5-kinase activity(GO:0052726) |
| 0.0 | 0.2 | GO:0008597 | calcium-dependent protein serine/threonine phosphatase regulator activity(GO:0008597) |
| 0.0 | 2.6 | GO:0045296 | cadherin binding(GO:0045296) |
| 0.0 | 0.4 | GO:0004983 | neuropeptide Y receptor activity(GO:0004983) |
| 0.0 | 0.3 | GO:0003917 | DNA topoisomerase type I activity(GO:0003917) |
| 0.0 | 0.3 | GO:0044183 | protein binding involved in protein folding(GO:0044183) |
| 0.0 | 0.1 | GO:1990247 | N6-methyladenosine-containing RNA binding(GO:1990247) |
| 0.0 | 0.5 | GO:0008569 | ATP-dependent microtubule motor activity, minus-end-directed(GO:0008569) |
| 0.0 | 0.1 | GO:0070728 | leucine binding(GO:0070728) |
| 0.0 | 1.5 | GO:0005201 | extracellular matrix structural constituent(GO:0005201) |
| 0.0 | 0.1 | GO:0051117 | ATPase binding(GO:0051117) |
Gene overrepresentation in curated gene sets: canonical pathways category:
| Log-likelihood per target | Total log-likelihood | Term | Description |
|---|---|---|---|
| 0.0 | 0.5 | PID ECADHERIN STABILIZATION PATHWAY | Stabilization and expansion of the E-cadherin adherens junction |
| 0.0 | 0.7 | PID AP1 PATHWAY | AP-1 transcription factor network |
Gene overrepresentation in curated gene sets: REACTOME pathways category:
| Log-likelihood per target | Total log-likelihood | Term | Description |
|---|---|---|---|
| 0.1 | 2.6 | REACTOME ADHERENS JUNCTIONS INTERACTIONS | Genes involved in Adherens junctions interactions |
| 0.0 | 0.4 | REACTOME PURINE SALVAGE | Genes involved in Purine salvage |
| 0.0 | 0.7 | REACTOME YAP1 AND WWTR1 TAZ STIMULATED GENE EXPRESSION | Genes involved in YAP1- and WWTR1 (TAZ)-stimulated gene expression |
| 0.0 | 0.3 | REACTOME ACTIVATION OF CHAPERONE GENES BY ATF6 ALPHA | Genes involved in Activation of Chaperone Genes by ATF6-alpha |
| 0.0 | 0.3 | REACTOME CHONDROITIN SULFATE BIOSYNTHESIS | Genes involved in Chondroitin sulfate biosynthesis |
| 0.0 | 0.3 | REACTOME CYTOCHROME P450 ARRANGED BY SUBSTRATE TYPE | Genes involved in Cytochrome P450 - arranged by substrate type |
| 0.0 | 0.5 | REACTOME ASSOCIATION OF TRIC CCT WITH TARGET PROTEINS DURING BIOSYNTHESIS | Genes involved in Association of TriC/CCT with target proteins during biosynthesis |
| 0.0 | 0.1 | REACTOME HDL MEDIATED LIPID TRANSPORT | Genes involved in HDL-mediated lipid transport |