Project
PRJEB1986: zebrafish developmental stages transcriptome
Navigation
Downloads
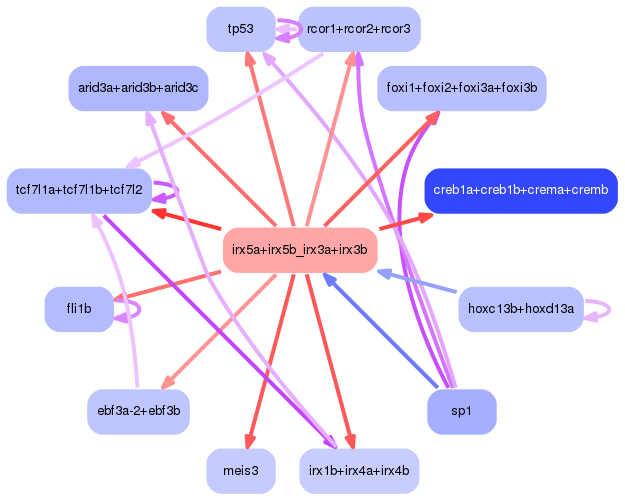
Results for irx5a+irx5b_irx3a+irx3b
Z-value: 1.94
Motif logo


Transcription factors associated with irx5a+irx5b_irx3a+irx3b
| Gene Symbol | Gene ID | Gene Info |
|---|---|---|
|
irx5a
|
ENSDARG00000034043 | iroquois homeobox 5a |
|
irx5b
|
ENSDARG00000074070 | iroquois homeobox 5b |
|
irx3b
|
ENSDARG00000031138 | iroquois homeobox 3b |
|
irx3a
|
ENSDARG00000101076 | iroquois homeobox 3a |
Activity-expression correlation:
| Gene | Promoter | Pearson corr. coef. | P-value | Plot |
|---|---|---|---|---|
| irx3a | dr11_v1_chr7_+_36041509_36041509 | 0.70 | 8.7e-04 | Click! |
| irx5b | dr11_v1_chr25_+_36152215_36152215 | 0.61 | 5.5e-03 | Click! |
| irx5a | dr11_v1_chr7_-_35710263_35710263 | 0.52 | 2.2e-02 | Click! |
| irx3b | dr11_v1_chr25_-_36492779_36492779 | 0.25 | 3.1e-01 | Click! |
Activity profile of irx5a+irx5b_irx3a+irx3b motif
Sorted Z-values of irx5a+irx5b_irx3a+irx3b motif
| Promoter | Log-likelihood | Transcript | Gene | Gene Info |
|---|---|---|---|---|
| chr12_-_9538578 | 4.59 |
ENSDART00000066445
|
nudt13
|
nudix (nucleoside diphosphate linked moiety X)-type motif 13 |
| chr14_-_10617127 | 4.48 |
ENSDART00000154299
|
si:dkey-92i17.2
|
si:dkey-92i17.2 |
| chr9_-_52598343 | 4.47 |
ENSDART00000167922
|
xrcc5
|
X-ray repair complementing defective repair in Chinese hamster cells 5 |
| chr8_+_46641314 | 4.28 |
ENSDART00000113803
|
her3
|
hairy-related 3 |
| chr13_-_86847 | 4.02 |
ENSDART00000158062
|
pole2
|
polymerase (DNA directed), epsilon 2 |
| chr17_+_51746830 | 3.77 |
ENSDART00000184230
|
odc1
|
ornithine decarboxylase 1 |
| chr13_+_43247936 | 3.72 |
ENSDART00000126850
ENSDART00000165331 |
smoc2
|
SPARC related modular calcium binding 2 |
| chr8_-_20914829 | 3.64 |
ENSDART00000025356
|
haus5
|
HAUS augmin-like complex, subunit 5 |
| chr13_+_36585399 | 3.55 |
ENSDART00000030211
|
gmfb
|
glia maturation factor, beta |
| chr10_-_42237304 | 3.49 |
ENSDART00000140341
|
tcf7l1a
|
transcription factor 7 like 1a |
| chr1_+_53919110 | 3.44 |
ENSDART00000020680
|
nup133
|
nucleoporin 133 |
| chr10_-_22912255 | 3.39 |
ENSDART00000131992
|
si:ch1073-143l10.2
|
si:ch1073-143l10.2 |
| chr16_+_40576679 | 3.34 |
ENSDART00000169412
ENSDART00000193464 |
ccne2
|
cyclin E2 |
| chr15_-_23522653 | 3.31 |
ENSDART00000144685
|
hmbsb
|
hydroxymethylbilane synthase, b |
| chr8_-_4760723 | 3.29 |
ENSDART00000064201
|
cdc45
|
CDC45 cell division cycle 45 homolog (S. cerevisiae) |
| chr10_+_8629275 | 3.23 |
ENSDART00000129643
|
aplnrb
|
apelin receptor b |
| chr15_+_19324697 | 3.22 |
ENSDART00000022015
|
vps26b
|
VPS26 retromer complex component B |
| chr1_-_45215343 | 3.21 |
ENSDART00000014727
|
ddx39aa
|
DEAD (Asp-Glu-Ala-Asp) box polypeptide 39Aa |
| chr16_+_6021908 | 3.14 |
ENSDART00000163786
|
BX511115.1
|
|
| chr9_-_21976670 | 3.13 |
ENSDART00000104322
|
uchl3
|
ubiquitin carboxyl-terminal esterase L3 (ubiquitin thiolesterase) |
| chr4_-_7869731 | 3.06 |
ENSDART00000067339
|
mcm10
|
minichromosome maintenance 10 replication initiation factor |
| chr8_+_28259347 | 3.04 |
ENSDART00000110857
|
fam212b
|
family with sequence similarity 212, member B |
| chr17_+_43013171 | 2.99 |
ENSDART00000055541
|
gskip
|
gsk3b interacting protein |
| chr11_+_11267829 | 2.97 |
ENSDART00000026814
ENSDART00000173346 ENSDART00000151926 |
ptp4a1
|
protein tyrosine phosphatase type IVA, member 1 |
| chr24_+_31361407 | 2.96 |
ENSDART00000162668
|
cremb
|
cAMP responsive element modulator b |
| chr6_+_33076839 | 2.91 |
ENSDART00000073755
ENSDART00000122242 |
pomgnt1
|
protein O-linked mannose N-acetylglucosaminyltransferase 1 (beta 1,2-) |
| chr4_-_20313810 | 2.90 |
ENSDART00000136350
|
dcp1b
|
decapping mRNA 1B |
| chr20_+_24448007 | 2.88 |
ENSDART00000139866
|
si:dkey-273g18.1
|
si:dkey-273g18.1 |
| chr23_+_45027263 | 2.85 |
ENSDART00000058364
|
hmgb2b
|
high mobility group box 2b |
| chr25_-_8201983 | 2.82 |
ENSDART00000006579
|
saal1
|
serum amyloid A-like 1 |
| chr18_+_22109379 | 2.81 |
ENSDART00000147230
|
zgc:158868
|
zgc:158868 |
| chr24_+_39641991 | 2.81 |
ENSDART00000142182
|
luc7l
|
LUC7-like (S. cerevisiae) |
| chr17_-_20167206 | 2.81 |
ENSDART00000104874
ENSDART00000191995 |
p4ha1b
|
prolyl 4-hydroxylase, alpha polypeptide I b |
| chr9_+_426392 | 2.80 |
ENSDART00000172515
|
bzw1b
|
basic leucine zipper and W2 domains 1b |
| chr17_+_24809221 | 2.78 |
ENSDART00000082251
ENSDART00000147871 ENSDART00000130871 |
spdya
|
speedy/RINGO cell cycle regulator family member A |
| chr19_-_28130658 | 2.64 |
ENSDART00000079114
|
irx1b
|
iroquois homeobox 1b |
| chr16_-_44709832 | 2.63 |
ENSDART00000156784
|
si:ch211-151m7.6
|
si:ch211-151m7.6 |
| chr14_+_40852497 | 2.62 |
ENSDART00000128588
ENSDART00000166065 |
taf7
|
TAF7 RNA polymerase II, TATA box binding protein (TBP)-associated factor |
| chr15_-_6863317 | 2.60 |
ENSDART00000155128
ENSDART00000018945 |
meis3
|
myeloid ecotropic viral integration site 3 |
| chr20_-_25644131 | 2.54 |
ENSDART00000138997
|
si:dkeyp-117h8.4
|
si:dkeyp-117h8.4 |
| chr13_+_13578552 | 2.47 |
ENSDART00000101673
|
foxi2
|
forkhead box I2 |
| chr1_-_33380340 | 2.43 |
ENSDART00000181515
|
cd99
|
CD99 molecule |
| chr12_+_36891483 | 2.43 |
ENSDART00000048927
|
cox10
|
COX10 heme A:farnesyltransferase cytochrome c oxidase assembly factor |
| chr18_-_31105391 | 2.42 |
ENSDART00000039495
|
pdcd5
|
programmed cell death 5 |
| chr15_+_2857556 | 2.41 |
ENSDART00000157758
|
mre11a
|
MRE11 homolog A, double strand break repair nuclease |
| chr10_+_38512270 | 2.39 |
ENSDART00000109752
|
serpinh1a
|
serpin peptidase inhibitor, clade H (heat shock protein 47), member 1a |
| chr17_-_14705039 | 2.38 |
ENSDART00000154281
ENSDART00000123550 |
ptp4a2a
|
protein tyrosine phosphatase type IVA, member 2a |
| chr23_+_42396934 | 2.38 |
ENSDART00000169821
|
cyp2aa8
|
cytochrome P450, family 2, subfamily AA, polypeptide 8 |
| chr6_-_34838397 | 2.38 |
ENSDART00000060169
ENSDART00000169605 |
mier1a
|
mesoderm induction early response 1a, transcriptional regulator |
| chr2_-_32668668 | 2.34 |
ENSDART00000190450
|
puf60a
|
poly-U binding splicing factor a |
| chr16_-_42186093 | 2.30 |
ENSDART00000076030
|
fbl
|
fibrillarin |
| chr9_+_21358941 | 2.28 |
ENSDART00000147619
ENSDART00000059402 |
eef1akmt1
|
EEF1A lysine methyltransferase 1 |
| chr7_-_18877109 | 2.28 |
ENSDART00000113593
|
mllt3
|
MLLT3, super elongation complex subunit |
| chr1_-_55116453 | 2.27 |
ENSDART00000142348
|
sertad2a
|
SERTA domain containing 2a |
| chr18_-_38244871 | 2.27 |
ENSDART00000076399
|
nat10
|
N-acetyltransferase 10 |
| chr2_-_2813259 | 2.27 |
ENSDART00000032540
|
usp14
|
ubiquitin specific peptidase 14 (tRNA-guanine transglycosylase) |
| chr7_+_52712807 | 2.26 |
ENSDART00000174095
ENSDART00000174377 ENSDART00000174061 ENSDART00000174094 ENSDART00000110906 ENSDART00000174071 ENSDART00000174238 |
znf280d
|
zinc finger protein 280D |
| chr19_+_3653976 | 2.25 |
ENSDART00000125673
|
nedd9
|
neural precursor cell expressed, developmentally down-regulated 9 |
| chr12_-_28799642 | 2.24 |
ENSDART00000066303
|
mrpl10
|
mitochondrial ribosomal protein L10 |
| chr22_+_10781894 | 2.23 |
ENSDART00000081183
|
enc3
|
ectodermal-neural cortex 3 |
| chr15_-_31516558 | 2.23 |
ENSDART00000156427
ENSDART00000156072 ENSDART00000156047 |
hmgb1b
|
high mobility group box 1b |
| chr4_+_9028819 | 2.21 |
ENSDART00000102893
|
aldh1l2
|
aldehyde dehydrogenase 1 family, member L2 |
| chr5_+_69733096 | 2.21 |
ENSDART00000169013
|
arl6ip4
|
ADP-ribosylation factor-like 6 interacting protein 4 |
| chr4_+_9177997 | 2.19 |
ENSDART00000057254
ENSDART00000154614 |
nfyba
|
nuclear transcription factor Y, beta a |
| chr18_-_38245062 | 2.18 |
ENSDART00000189092
|
nat10
|
N-acetyltransferase 10 |
| chr20_-_25626693 | 2.18 |
ENSDART00000132247
|
paics
|
phosphoribosylaminoimidazole carboxylase, phosphoribosylaminoimidazole succinocarboxamide synthetase |
| chr12_+_17154655 | 2.16 |
ENSDART00000028003
|
ankrd22
|
ankyrin repeat domain 22 |
| chr14_-_26392146 | 2.15 |
ENSDART00000037999
|
b4galt7
|
xylosylprotein beta 1,4-galactosyltransferase, polypeptide 7 (galactosyltransferase I) |
| chr5_+_62988916 | 2.15 |
ENSDART00000123243
|
TIMM22
|
translocase of inner mitochondrial membrane 22 |
| chr25_-_29072162 | 2.12 |
ENSDART00000169269
|
arid3b
|
AT rich interactive domain 3B (BRIGHT-like) |
| chr12_-_17698669 | 2.11 |
ENSDART00000191384
|
pvalb9
|
parvalbumin 9 |
| chr16_+_42018367 | 2.07 |
ENSDART00000058613
|
fli1b
|
Fli-1 proto-oncogene, ETS transcription factor b |
| chr2_-_22492289 | 2.05 |
ENSDART00000168022
|
gtf2b
|
general transcription factor IIB |
| chr17_-_28705264 | 2.04 |
ENSDART00000076409
ENSDART00000189874 |
ap4s1
|
adaptor-related protein complex 4, sigma 1 subunit |
| chr14_-_36397768 | 2.04 |
ENSDART00000185199
ENSDART00000052562 |
spata4
|
spermatogenesis associated 4 |
| chr14_+_45471642 | 2.03 |
ENSDART00000126979
ENSDART00000172952 ENSDART00000173284 |
ubxn1
|
UBX domain protein 1 |
| chr12_+_16087077 | 1.98 |
ENSDART00000141898
|
znf281b
|
zinc finger protein 281b |
| chr24_-_25098719 | 1.98 |
ENSDART00000193651
|
phldb2b
|
pleckstrin homology-like domain, family B, member 2b |
| chr19_-_11237125 | 1.98 |
ENSDART00000163921
|
ssr2
|
signal sequence receptor, beta |
| chr24_-_17067284 | 1.97 |
ENSDART00000111237
|
armc3
|
armadillo repeat containing 3 |
| chr22_+_1947494 | 1.96 |
ENSDART00000159121
|
si:dkey-15h8.15
|
si:dkey-15h8.15 |
| chr3_+_21200763 | 1.96 |
ENSDART00000067841
|
zgc:112038
|
zgc:112038 |
| chr5_-_58996324 | 1.94 |
ENSDART00000033923
|
mis12
|
MIS12 kinetochore complex component |
| chr5_+_24087035 | 1.94 |
ENSDART00000183644
|
tp53
|
tumor protein p53 |
| chr20_+_3277620 | 1.94 |
ENSDART00000067397
ENSDART00000135194 |
ndufaf7
|
NADH dehydrogenase (ubiquinone) complex I, assembly factor 7 |
| chr15_-_35126332 | 1.94 |
ENSDART00000007636
|
zgc:55413
|
zgc:55413 |
| chr16_+_3067134 | 1.93 |
ENSDART00000012048
|
cyb5r4
|
cytochrome b5 reductase 4 |
| chr3_+_19336286 | 1.92 |
ENSDART00000111528
|
kri1
|
KRI1 homolog |
| chr2_+_35612621 | 1.91 |
ENSDART00000143082
|
si:dkey-4i23.5
|
si:dkey-4i23.5 |
| chr13_+_24671481 | 1.91 |
ENSDART00000001678
|
adam8a
|
ADAM metallopeptidase domain 8a |
| chr7_+_56577906 | 1.90 |
ENSDART00000184023
|
hp
|
haptoglobin |
| chr3_+_41917499 | 1.90 |
ENSDART00000028673
|
lfng
|
LFNG O-fucosylpeptide 3-beta-N-acetylglucosaminyltransferase |
| chr12_-_38547376 | 1.90 |
ENSDART00000167646
|
si:dkey-1f1.3
|
si:dkey-1f1.3 |
| chr23_+_19701587 | 1.90 |
ENSDART00000104425
|
dnase1l1
|
deoxyribonuclease I-like 1 |
| chr24_-_15263142 | 1.89 |
ENSDART00000183176
ENSDART00000006930 |
rttn
|
rotatin |
| chr9_-_14108896 | 1.88 |
ENSDART00000135209
|
prkag3b
|
protein kinase, AMP-activated, gamma 3b non-catalytic subunit |
| chr17_-_14876758 | 1.88 |
ENSDART00000155857
|
nid2a
|
nidogen 2a (osteonidogen) |
| chr19_-_31007417 | 1.88 |
ENSDART00000048144
|
rbbp4
|
retinoblastoma binding protein 4 |
| chr15_-_31419805 | 1.83 |
ENSDART00000060111
|
or111-11
|
odorant receptor, family D, subfamily 111, member 11 |
| chr7_+_56577522 | 1.79 |
ENSDART00000149130
ENSDART00000149624 |
hp
|
haptoglobin |
| chr23_+_29885019 | 1.79 |
ENSDART00000167059
|
aurkaip1
|
aurora kinase A interacting protein 1 |
| chr12_+_33817327 | 1.79 |
ENSDART00000111486
|
mrpl43
|
mitochondrial ribosomal protein L43 |
| chr3_+_25999477 | 1.79 |
ENSDART00000024316
|
mcm5
|
minichromosome maintenance complex component 5 |
| chr21_+_43882274 | 1.78 |
ENSDART00000075672
|
sra1
|
steroid receptor RNA activator 1 |
| chr6_+_30113750 | 1.78 |
ENSDART00000022586
|
lrrc40
|
leucine rich repeat containing 40 |
| chr3_-_18792492 | 1.77 |
ENSDART00000134208
ENSDART00000034373 |
hagh
|
hydroxyacylglutathione hydrolase |
| chr5_+_34578479 | 1.77 |
ENSDART00000016314
|
gfm2
|
G elongation factor, mitochondrial 2 |
| chr14_-_31087830 | 1.75 |
ENSDART00000002250
|
hs6st2
|
heparan sulfate 6-O-sulfotransferase 2 |
| chr12_-_33789006 | 1.75 |
ENSDART00000034550
|
llgl2
|
lethal giant larvae homolog 2 (Drosophila) |
| chr1_+_54638126 | 1.73 |
ENSDART00000143997
|
si:ch211-202h22.8
|
si:ch211-202h22.8 |
| chr13_-_28265919 | 1.72 |
ENSDART00000057565
|
sdhaf4
|
succinate dehydrogenase complex assembly factor 4 |
| chr15_+_29116063 | 1.71 |
ENSDART00000016112
ENSDART00000153609 ENSDART00000155630 |
capns1b
|
calpain, small subunit 1 b |
| chr18_+_17786548 | 1.71 |
ENSDART00000189493
ENSDART00000146133 |
ZNF423
|
si:ch211-216l23.1 |
| chr6_+_23010242 | 1.70 |
ENSDART00000113116
|
polg2
|
polymerase (DNA directed), gamma 2, accessory subunit |
| chr24_+_16140423 | 1.68 |
ENSDART00000105955
|
TIMM21
|
si:dkey-118j18.1 |
| chr7_-_48667056 | 1.67 |
ENSDART00000006378
|
cdkn1ca
|
cyclin-dependent kinase inhibitor 1Ca |
| chr1_+_38362412 | 1.67 |
ENSDART00000075086
|
cep44
|
centrosomal protein 44 |
| chr9_-_303658 | 1.66 |
ENSDART00000160338
|
si:ch211-166e11.5
|
si:ch211-166e11.5 |
| chr7_+_48806420 | 1.66 |
ENSDART00000083431
|
cpt1aa
|
carnitine palmitoyltransferase 1Aa (liver) |
| chr6_-_20952187 | 1.63 |
ENSDART00000074327
|
igfbp2a
|
insulin-like growth factor binding protein 2a |
| chr10_-_45002196 | 1.63 |
ENSDART00000170767
|
ved
|
ventrally expressed dharma/bozozok antagonist |
| chr14_+_16287968 | 1.62 |
ENSDART00000106593
|
prpf19
|
pre-mRNA processing factor 19 |
| chr17_-_5352924 | 1.62 |
ENSDART00000167275
|
supt3h
|
SPT3 homolog, SAGA and STAGA complex component |
| chr20_+_54299419 | 1.61 |
ENSDART00000056089
ENSDART00000193107 |
si:zfos-1505d6.3
|
si:zfos-1505d6.3 |
| chr18_-_44847855 | 1.61 |
ENSDART00000086823
|
srpr
|
signal recognition particle receptor (docking protein) |
| chr22_-_26353916 | 1.60 |
ENSDART00000077958
|
capn2b
|
calpain 2, (m/II) large subunit b |
| chr4_+_42604252 | 1.60 |
ENSDART00000184850
|
CR925768.1
|
|
| chr14_+_7697694 | 1.60 |
ENSDART00000028623
ENSDART00000162363 |
brd8
|
bromodomain containing 8 |
| chr22_+_2431585 | 1.59 |
ENSDART00000167758
|
zgc:171435
|
zgc:171435 |
| chr4_+_17524330 | 1.58 |
ENSDART00000172169
ENSDART00000021610 |
recql
|
RecQ helicase-like |
| chr24_-_26981848 | 1.55 |
ENSDART00000183198
|
stag1b
|
stromal antigen 1b |
| chr19_-_3876877 | 1.53 |
ENSDART00000163711
|
thrap3b
|
thyroid hormone receptor associated protein 3b |
| chr24_+_13635108 | 1.50 |
ENSDART00000183008
|
trpa1b
|
transient receptor potential cation channel, subfamily A, member 1b |
| chr2_+_36608387 | 1.50 |
ENSDART00000159541
|
pak2a
|
p21 protein (Cdc42/Rac)-activated kinase 2a |
| chr23_+_46157638 | 1.50 |
ENSDART00000076048
|
btr32
|
bloodthirsty-related gene family, member 32 |
| chr3_+_18050667 | 1.49 |
ENSDART00000035531
|
mettl26
|
methyltransferase like 26 |
| chr6_-_2154137 | 1.49 |
ENSDART00000162656
|
tgm5l
|
transglutaminase 5, like |
| chr9_-_41040492 | 1.49 |
ENSDART00000163164
|
adat3
|
adenosine deaminase, tRNA-specific 3 |
| chr3_-_32541033 | 1.49 |
ENSDART00000151476
ENSDART00000055324 |
rcn3
|
reticulocalbin 3, EF-hand calcium binding domain |
| chr8_+_23784471 | 1.48 |
ENSDART00000189457
|
si:ch211-163l21.8
|
si:ch211-163l21.8 |
| chr14_-_46113321 | 1.48 |
ENSDART00000169040
ENSDART00000161475 ENSDART00000124925 |
si:ch211-235e9.8
|
si:ch211-235e9.8 |
| chr7_+_25015151 | 1.47 |
ENSDART00000149966
ENSDART00000175583 |
b3gat3
|
beta-1,3-glucuronyltransferase 3 (glucuronosyltransferase I) |
| chr19_-_8534985 | 1.46 |
ENSDART00000191064
|
dpm3
|
dolichyl-phosphate mannosyltransferase polypeptide 3 |
| chr6_-_28961660 | 1.44 |
ENSDART00000147285
|
tomm70a
|
translocase of outer mitochondrial membrane 70 homolog A (S. cerevisiae) |
| chr7_+_70338270 | 1.44 |
ENSDART00000065234
|
gba3
|
glucosidase, beta, acid 3 (gene/pseudogene) |
| chr8_+_49081196 | 1.44 |
ENSDART00000141580
|
ddx51
|
DEAD (Asp-Glu-Ala-Asp) box polypeptide 51 |
| chr4_+_62341346 | 1.44 |
ENSDART00000160601
|
znf1079
|
zinc finger protein 1079 |
| chr2_-_29923403 | 1.43 |
ENSDART00000144672
|
paxip1
|
PAX interacting (with transcription-activation domain) protein 1 |
| chr3_+_43774369 | 1.43 |
ENSDART00000157964
|
zc3h7a
|
zinc finger CCCH-type containing 7A |
| chr4_+_20486041 | 1.43 |
ENSDART00000017572
|
ints13
|
integrator complex subunit 13 |
| chr1_+_47091468 | 1.42 |
ENSDART00000036783
|
cryzl1
|
crystallin, zeta (quinone reductase)-like 1 |
| chr2_+_33326522 | 1.41 |
ENSDART00000056655
|
klf17
|
Kruppel-like factor 17 |
| chr14_-_1355544 | 1.41 |
ENSDART00000060417
|
cetn4
|
centrin 4 |
| chr23_+_32029304 | 1.40 |
ENSDART00000185217
|
tpx2
|
TPX2, microtubule-associated, homolog (Xenopus laevis) |
| chr7_-_60831082 | 1.39 |
ENSDART00000073654
ENSDART00000136999 |
pcxb
|
pyruvate carboxylase b |
| chr22_-_7006974 | 1.39 |
ENSDART00000133143
|
gpd1b
|
glycerol-3-phosphate dehydrogenase 1b |
| chr4_-_13931293 | 1.39 |
ENSDART00000067172
|
zcrb1
|
zinc finger CCHC-type and RNA binding motif 1 |
| chr3_-_32596394 | 1.39 |
ENSDART00000103239
|
tspan4b
|
tetraspanin 4b |
| chr6_+_50393047 | 1.39 |
ENSDART00000055502
ENSDART00000055511 |
ergic3
|
ERGIC and golgi 3 |
| chr3_-_50136424 | 1.38 |
ENSDART00000188843
|
btr02
|
bloodthirsty-related gene family, member 2 |
| chr5_+_53482597 | 1.38 |
ENSDART00000180333
|
BX323994.1
|
|
| chr9_+_29985010 | 1.38 |
ENSDART00000020743
|
cmss1
|
cms1 ribosomal small subunit homolog (yeast) |
| chr4_-_12477224 | 1.38 |
ENSDART00000027756
ENSDART00000182706 ENSDART00000127150 |
arhgef39
|
Rho guanine nucleotide exchange factor (GEF) 39 |
| chr18_+_20034023 | 1.38 |
ENSDART00000139441
|
morf4l1
|
mortality factor 4 like 1 |
| chr4_-_59836867 | 1.38 |
ENSDART00000142868
|
CR846087.3
|
|
| chr3_-_12970418 | 1.37 |
ENSDART00000158747
|
pdgfab
|
platelet-derived growth factor alpha polypeptide b |
| chr23_+_35708730 | 1.37 |
ENSDART00000009277
|
tuba1a
|
tubulin, alpha 1a |
| chr24_-_36175365 | 1.37 |
ENSDART00000065338
|
pak1ip1
|
PAK1 interacting protein 1 |
| chr9_-_1484202 | 1.37 |
ENSDART00000181215
|
rbm45
|
RNA binding motif protein 45 |
| chr10_-_14545658 | 1.36 |
ENSDART00000057865
|
ier3ip1
|
immediate early response 3 interacting protein 1 |
| chr22_+_25672155 | 1.36 |
ENSDART00000087769
|
si:ch211-250e5.2
|
si:ch211-250e5.2 |
| chr23_-_19977214 | 1.36 |
ENSDART00000054659
|
ccnq
|
cyclin Q |
| chr1_-_31657854 | 1.34 |
ENSDART00000085309
|
dpcd
|
deleted in primary ciliary dyskinesia homolog (mouse) |
| chr17_+_32571584 | 1.33 |
ENSDART00000087565
|
eva1a
|
eva-1 homolog A (C. elegans) |
| chr4_-_9191220 | 1.33 |
ENSDART00000156919
|
hcfc2
|
host cell factor C2 |
| chr17_-_20228610 | 1.33 |
ENSDART00000125758
|
ebf3b
|
early B cell factor 3b |
| chr13_+_21676235 | 1.33 |
ENSDART00000137804
ENSDART00000134950 ENSDART00000129653 |
mtg1
|
mitochondrial ribosome-associated GTPase 1 |
| chr10_-_29827000 | 1.33 |
ENSDART00000131418
|
zpr1
|
ZPR1 zinc finger |
| chr2_+_24770435 | 1.32 |
ENSDART00000078854
|
mpv17l2
|
MPV17 mitochondrial membrane protein-like 2 |
| chr1_+_26110985 | 1.31 |
ENSDART00000054208
|
mtap
|
methylthioadenosine phosphorylase |
| chr5_-_28606916 | 1.31 |
ENSDART00000026107
ENSDART00000137717 |
tnc
|
tenascin C |
| chr10_+_13209580 | 1.31 |
ENSDART00000000887
ENSDART00000136932 |
rassf6
|
Ras association (RalGDS/AF-6) domain family 6 |
| chr25_-_34723937 | 1.31 |
ENSDART00000187286
ENSDART00000157021 |
nup160
|
nucleoporin 160 |
| chr18_-_40884087 | 1.31 |
ENSDART00000059194
|
snrpd2
|
small nuclear ribonucleoprotein D2 polypeptide |
| chr6_-_22369125 | 1.30 |
ENSDART00000083038
|
nprl2
|
NPR2 like, GATOR1 complex subunit |
| chr12_-_645972 | 1.30 |
ENSDART00000048632
|
sult2st1
|
sulfotransferase family 2, cytosolic sulfotransferase 1 |
| chr5_-_51747278 | 1.30 |
ENSDART00000192232
|
lhfpl2b
|
LHFPL tetraspan subfamily member 2b |
| chr17_-_29271359 | 1.30 |
ENSDART00000104219
|
rcor1
|
REST corepressor 1 |
| chr2_-_26467993 | 1.30 |
ENSDART00000134495
|
rabggtb
|
Rab geranylgeranyltransferase, beta subunit |
| chr1_+_11107688 | 1.30 |
ENSDART00000109858
|
knstrn
|
kinetochore-localized astrin/SPAG5 binding protein |
| chr15_-_5901514 | 1.29 |
ENSDART00000155252
|
si:ch73-281n10.2
|
si:ch73-281n10.2 |
| chr2_-_29996036 | 1.29 |
ENSDART00000020792
|
cnpy1
|
canopy1 |
| chr5_-_69538058 | 1.29 |
ENSDART00000097251
|
zgc:153044
|
zgc:153044 |
| chr14_-_45346558 | 1.28 |
ENSDART00000090844
|
zgc:153018
|
zgc:153018 |
| chr7_+_52154215 | 1.28 |
ENSDART00000098712
|
TMEM208
|
zgc:77041 |
| chr3_-_58650057 | 1.28 |
ENSDART00000057640
|
dhrs7ca
|
dehydrogenase/reductase (SDR family) member 7Ca |
| chr22_-_619711 | 1.28 |
ENSDART00000192778
|
srsf3b
|
serine/arginine-rich splicing factor 3b |
| chr18_+_17786710 | 1.28 |
ENSDART00000190203
ENSDART00000187095 ENSDART00000083296 |
ZNF423
|
si:ch211-216l23.1 |
| chr9_-_5337923 | 1.28 |
ENSDART00000017939
|
tnfsf13b
|
TNF superfamily member 13b |
| chr18_+_6866276 | 1.27 |
ENSDART00000187516
|
dnaja2l
|
DnaJ (Hsp40) homolog, subfamily A, member 2, like |
Network of associatons between targets according to the STRING database.

First level regulatory network of irx5a+irx5b_irx3a+irx3b
Gene Ontology Analysis
Gene overrepresentation in biological process category:
| Log-likelihood per target | Total log-likelihood | Term | Description |
|---|---|---|---|
| 0.9 | 4.5 | GO:0010332 | response to gamma radiation(GO:0010332) cellular response to gamma radiation(GO:0071480) |
| 0.9 | 3.5 | GO:0060829 | negative regulation of canonical Wnt signaling pathway involved in neural plate anterior/posterior pattern formation(GO:0060829) |
| 0.8 | 3.2 | GO:1903587 | regulation of blood vessel endothelial cell proliferation involved in sprouting angiogenesis(GO:1903587) positive regulation of blood vessel endothelial cell proliferation involved in sprouting angiogenesis(GO:1903589) |
| 0.7 | 0.7 | GO:0034471 | endonucleolytic cleavage to generate mature 5'-end of SSU-rRNA from (SSU-rRNA, 5.8S rRNA, LSU-rRNA)(GO:0000472) endonucleolytic cleavage in 5'-ETS of tricistronic rRNA transcript (SSU-rRNA, 5.8S rRNA, LSU-rRNA)(GO:0000480) rRNA 5'-end processing(GO:0000967) ncRNA 5'-end processing(GO:0034471) |
| 0.7 | 2.2 | GO:0009256 | 10-formyltetrahydrofolate metabolic process(GO:0009256) 10-formyltetrahydrofolate catabolic process(GO:0009258) folic acid-containing compound catabolic process(GO:0009397) pteridine-containing compound catabolic process(GO:0042560) |
| 0.7 | 3.4 | GO:0044034 | viral genome replication(GO:0019079) negative stranded viral RNA replication(GO:0039689) viral RNA genome replication(GO:0039694) RNA replication(GO:0039703) multi-organism biosynthetic process(GO:0044034) |
| 0.6 | 1.9 | GO:1901216 | regulation of transposition, RNA-mediated(GO:0010525) negative regulation of transposition, RNA-mediated(GO:0010526) transposition, RNA-mediated(GO:0032197) positive regulation of neuron apoptotic process(GO:0043525) positive regulation of neuron death(GO:1901216) |
| 0.6 | 1.9 | GO:0051044 | positive regulation of membrane protein ectodomain proteolysis(GO:0051044) |
| 0.6 | 1.8 | GO:0006089 | lactate metabolic process(GO:0006089) |
| 0.6 | 3.3 | GO:0018160 | peptidyl-pyrromethane cofactor linkage(GO:0018160) |
| 0.5 | 2.6 | GO:1901166 | neural crest cell migration involved in autonomic nervous system development(GO:1901166) |
| 0.5 | 2.0 | GO:0061668 | mitochondrial ribosome assembly(GO:0061668) |
| 0.5 | 3.4 | GO:0000972 | transcription-dependent tethering of RNA polymerase II gene DNA at nuclear periphery(GO:0000972) |
| 0.5 | 2.4 | GO:0008594 | photoreceptor cell morphogenesis(GO:0008594) negative regulation of epithelial to mesenchymal transition(GO:0010719) |
| 0.5 | 2.9 | GO:0031087 | nuclear-transcribed mRNA catabolic process, deadenylation-independent decay(GO:0031086) deadenylation-independent decapping of nuclear-transcribed mRNA(GO:0031087) |
| 0.5 | 1.4 | GO:0048785 | hatching gland development(GO:0048785) |
| 0.5 | 2.3 | GO:0034553 | respiratory chain complex II assembly(GO:0034552) mitochondrial respiratory chain complex II assembly(GO:0034553) mitochondrial respiratory chain complex II biogenesis(GO:0097032) |
| 0.5 | 2.3 | GO:0090527 | actin filament reorganization(GO:0090527) |
| 0.4 | 1.8 | GO:0032790 | ribosome disassembly(GO:0032790) |
| 0.4 | 2.2 | GO:0002693 | regulation of cellular extravasation(GO:0002691) positive regulation of cellular extravasation(GO:0002693) |
| 0.4 | 1.3 | GO:0045887 | regulation of synaptic growth at neuromuscular junction(GO:0008582) axon regeneration at neuromuscular junction(GO:0014814) positive regulation of synaptic growth at neuromuscular junction(GO:0045887) |
| 0.4 | 3.9 | GO:0042276 | error-prone translesion synthesis(GO:0042276) |
| 0.4 | 2.5 | GO:0000393 | spliceosomal conformational changes to generate catalytic conformation(GO:0000393) |
| 0.4 | 1.3 | GO:0050968 | chemosensory behavior(GO:0007635) detection of chemical stimulus involved in sensory perception of pain(GO:0050968) |
| 0.4 | 2.5 | GO:0010457 | centriole-centriole cohesion(GO:0010457) |
| 0.4 | 3.8 | GO:0033387 | putrescine biosynthetic process from ornithine(GO:0033387) |
| 0.4 | 2.9 | GO:0016266 | O-glycan processing(GO:0016266) |
| 0.4 | 1.1 | GO:0071918 | urea transmembrane transport(GO:0071918) |
| 0.4 | 3.3 | GO:0031126 | snoRNA 3'-end processing(GO:0031126) |
| 0.4 | 2.9 | GO:0021634 | optic nerve formation(GO:0021634) |
| 0.4 | 1.1 | GO:0061188 | regulation of chromatin silencing at rDNA(GO:0061187) negative regulation of chromatin silencing at rDNA(GO:0061188) |
| 0.4 | 4.7 | GO:0051123 | RNA polymerase II transcriptional preinitiation complex assembly(GO:0051123) |
| 0.4 | 3.2 | GO:0006348 | chromatin silencing at telomere(GO:0006348) |
| 0.4 | 1.1 | GO:0048205 | COPI-coated vesicle budding(GO:0035964) Golgi transport vesicle coating(GO:0048200) COPI coating of Golgi vesicle(GO:0048205) |
| 0.3 | 1.4 | GO:0046168 | NADH oxidation(GO:0006116) glycerol-3-phosphate catabolic process(GO:0046168) |
| 0.3 | 1.4 | GO:0043968 | histone H2A acetylation(GO:0043968) |
| 0.3 | 2.7 | GO:0006264 | mitochondrial DNA replication(GO:0006264) |
| 0.3 | 1.0 | GO:0015074 | DNA integration(GO:0015074) |
| 0.3 | 2.6 | GO:0042138 | meiotic DNA double-strand break formation(GO:0042138) |
| 0.3 | 1.9 | GO:0000447 | endonucleolytic cleavage in ITS1 to separate SSU-rRNA from 5.8S rRNA and LSU-rRNA from tricistronic rRNA transcript (SSU-rRNA, 5.8S rRNA, LSU-rRNA)(GO:0000447) |
| 0.3 | 1.3 | GO:0030890 | B cell homeostasis(GO:0001782) positive regulation of B cell proliferation(GO:0030890) |
| 0.3 | 1.9 | GO:0055016 | hypochord development(GO:0055016) |
| 0.3 | 1.2 | GO:0021730 | trigeminal sensory nucleus development(GO:0021730) |
| 0.3 | 1.2 | GO:0006269 | DNA replication, synthesis of RNA primer(GO:0006269) |
| 0.3 | 0.8 | GO:0090131 | mesenchyme migration(GO:0090131) |
| 0.3 | 1.1 | GO:0032208 | regulation of telomere maintenance via recombination(GO:0032207) negative regulation of telomere maintenance via recombination(GO:0032208) |
| 0.3 | 1.3 | GO:0019509 | L-methionine biosynthetic process from methylthioadenosine(GO:0019509) amino acid salvage(GO:0043102) L-methionine biosynthetic process(GO:0071265) L-methionine salvage(GO:0071267) |
| 0.3 | 1.3 | GO:0051988 | regulation of attachment of spindle microtubules to kinetochore(GO:0051988) |
| 0.3 | 0.8 | GO:0080120 | CAAX-box protein processing(GO:0071586) CAAX-box protein maturation(GO:0080120) |
| 0.3 | 1.3 | GO:0097355 | protein localization to heterochromatin(GO:0097355) |
| 0.3 | 1.8 | GO:0045050 | protein insertion into ER membrane by stop-transfer membrane-anchor sequence(GO:0045050) |
| 0.3 | 1.0 | GO:0019532 | oxalate transport(GO:0019532) |
| 0.3 | 1.3 | GO:0016094 | polyprenol biosynthetic process(GO:0016094) |
| 0.2 | 1.0 | GO:0051661 | maintenance of centrosome location(GO:0051661) |
| 0.2 | 1.7 | GO:1904030 | negative regulation of cyclin-dependent protein serine/threonine kinase activity(GO:0045736) negative regulation of cyclin-dependent protein kinase activity(GO:1904030) |
| 0.2 | 1.4 | GO:0021846 | cell proliferation in forebrain(GO:0021846) |
| 0.2 | 0.2 | GO:0009162 | deoxyribonucleoside monophosphate metabolic process(GO:0009162) |
| 0.2 | 0.9 | GO:0070291 | N-acylethanolamine metabolic process(GO:0070291) |
| 0.2 | 1.1 | GO:0031053 | primary miRNA processing(GO:0031053) |
| 0.2 | 2.3 | GO:0031998 | regulation of fatty acid beta-oxidation(GO:0031998) |
| 0.2 | 2.2 | GO:0006189 | 'de novo' IMP biosynthetic process(GO:0006189) |
| 0.2 | 0.6 | GO:0000379 | tRNA-type intron splice site recognition and cleavage(GO:0000379) |
| 0.2 | 1.9 | GO:0044090 | positive regulation of vacuole organization(GO:0044090) |
| 0.2 | 0.8 | GO:0046900 | tetrahydrofolylpolyglutamate metabolic process(GO:0046900) |
| 0.2 | 0.8 | GO:0090387 | phagosome maturation involved in apoptotic cell clearance(GO:0090386) phagolysosome assembly involved in apoptotic cell clearance(GO:0090387) |
| 0.2 | 0.8 | GO:0006121 | mitochondrial electron transport, succinate to ubiquinone(GO:0006121) |
| 0.2 | 1.8 | GO:0010452 | histone H3-K36 methylation(GO:0010452) |
| 0.2 | 3.2 | GO:0051382 | kinetochore assembly(GO:0051382) |
| 0.2 | 1.8 | GO:0015015 | heparan sulfate proteoglycan biosynthetic process, enzymatic modification(GO:0015015) |
| 0.2 | 0.8 | GO:0015919 | peroxisomal membrane transport(GO:0015919) protein import into peroxisome membrane(GO:0045046) |
| 0.2 | 1.0 | GO:0097510 | base-excision repair, AP site formation via deaminated base removal(GO:0097510) |
| 0.2 | 1.3 | GO:0003188 | heart valve formation(GO:0003188) atrioventricular valve formation(GO:0003190) |
| 0.2 | 0.8 | GO:0097037 | heme export(GO:0097037) |
| 0.2 | 1.7 | GO:0043984 | histone H4-K16 acetylation(GO:0043984) |
| 0.2 | 0.9 | GO:0000738 | DNA catabolic process, exonucleolytic(GO:0000738) |
| 0.2 | 1.3 | GO:0018344 | protein geranylgeranylation(GO:0018344) |
| 0.2 | 1.1 | GO:0033169 | histone H3-K9 demethylation(GO:0033169) |
| 0.2 | 1.4 | GO:0046477 | glycosylceramide catabolic process(GO:0046477) |
| 0.2 | 0.7 | GO:0006404 | RNA import into nucleus(GO:0006404) snRNA import into nucleus(GO:0061015) |
| 0.2 | 0.5 | GO:0042256 | mature ribosome assembly(GO:0042256) assembly of large subunit precursor of preribosome(GO:1902626) |
| 0.2 | 1.6 | GO:0006268 | DNA unwinding involved in DNA replication(GO:0006268) |
| 0.2 | 1.0 | GO:0006596 | polyamine biosynthetic process(GO:0006596) |
| 0.2 | 1.0 | GO:0044209 | AMP salvage(GO:0044209) |
| 0.2 | 5.2 | GO:0006270 | DNA replication initiation(GO:0006270) |
| 0.2 | 0.8 | GO:0002949 | tRNA threonylcarbamoyladenosine modification(GO:0002949) |
| 0.2 | 1.6 | GO:0040014 | regulation of multicellular organism growth(GO:0040014) |
| 0.2 | 1.6 | GO:0042661 | regulation of mesodermal cell fate specification(GO:0042661) |
| 0.2 | 0.5 | GO:0072344 | rescue of stalled ribosome(GO:0072344) |
| 0.2 | 1.1 | GO:0006398 | mRNA 3'-end processing by stem-loop binding and cleavage(GO:0006398) histone mRNA metabolic process(GO:0008334) |
| 0.2 | 0.8 | GO:0097039 | protein linear polyubiquitination(GO:0097039) |
| 0.2 | 1.4 | GO:0055015 | ventricular cardiac muscle cell development(GO:0055015) |
| 0.2 | 1.6 | GO:0001836 | release of cytochrome c from mitochondria(GO:0001836) |
| 0.2 | 0.5 | GO:1904478 | regulation of intestinal absorption(GO:1904478) regulation of intestinal lipid absorption(GO:1904729) |
| 0.2 | 1.3 | GO:0034427 | nuclear-transcribed mRNA catabolic process, exonucleolytic, 3'-5'(GO:0034427) |
| 0.2 | 1.4 | GO:0090224 | regulation of mitotic spindle organization(GO:0060236) regulation of spindle organization(GO:0090224) |
| 0.2 | 3.5 | GO:0034315 | regulation of Arp2/3 complex-mediated actin nucleation(GO:0034315) |
| 0.2 | 0.6 | GO:0042776 | mitochondrial ATP synthesis coupled proton transport(GO:0042776) |
| 0.2 | 4.4 | GO:0000154 | rRNA modification(GO:0000154) |
| 0.2 | 2.3 | GO:0048096 | chromatin-mediated maintenance of transcription(GO:0048096) |
| 0.2 | 1.4 | GO:0031954 | positive regulation of protein autophosphorylation(GO:0031954) |
| 0.2 | 0.9 | GO:0061511 | centriole elongation(GO:0061511) |
| 0.2 | 0.8 | GO:0010693 | regulation of alkaline phosphatase activity(GO:0010692) negative regulation of alkaline phosphatase activity(GO:0010693) |
| 0.1 | 1.2 | GO:0006477 | protein sulfation(GO:0006477) peptidyl-tyrosine sulfation(GO:0006478) |
| 0.1 | 3.1 | GO:0010257 | NADH dehydrogenase complex assembly(GO:0010257) mitochondrial respiratory chain complex I assembly(GO:0032981) mitochondrial respiratory chain complex I biogenesis(GO:0097031) |
| 0.1 | 2.8 | GO:0019471 | peptidyl-proline hydroxylation to 4-hydroxy-L-proline(GO:0018401) 4-hydroxyproline metabolic process(GO:0019471) |
| 0.1 | 0.4 | GO:0033615 | mitochondrial proton-transporting ATP synthase complex assembly(GO:0033615) |
| 0.1 | 1.0 | GO:0071294 | cellular response to zinc ion(GO:0071294) |
| 0.1 | 5.1 | GO:0006376 | mRNA splice site selection(GO:0006376) |
| 0.1 | 0.4 | GO:0006957 | complement activation, alternative pathway(GO:0006957) |
| 0.1 | 0.4 | GO:0060958 | cell proliferation involved in heart valve morphogenesis(GO:0003249) regulation of cell proliferation involved in heart valve morphogenesis(GO:0003250) endocardial cell development(GO:0060958) cell proliferation involved in heart valve development(GO:2000793) |
| 0.1 | 0.7 | GO:0072574 | hepatocyte proliferation(GO:0072574) epithelial cell proliferation involved in liver morphogenesis(GO:0072575) |
| 0.1 | 4.3 | GO:0071427 | mRNA export from nucleus(GO:0006406) mRNA-containing ribonucleoprotein complex export from nucleus(GO:0071427) |
| 0.1 | 1.1 | GO:0042554 | superoxide anion generation(GO:0042554) |
| 0.1 | 0.4 | GO:0006359 | regulation of transcription from RNA polymerase III promoter(GO:0006359) |
| 0.1 | 0.7 | GO:0007344 | karyogamy(GO:0000741) pronuclear fusion(GO:0007344) |
| 0.1 | 0.6 | GO:0033688 | regulation of osteoblast proliferation(GO:0033688) |
| 0.1 | 0.6 | GO:0060049 | regulation of protein glycosylation(GO:0060049) |
| 0.1 | 3.8 | GO:0000387 | spliceosomal snRNP assembly(GO:0000387) |
| 0.1 | 1.4 | GO:0035196 | production of miRNAs involved in gene silencing by miRNA(GO:0035196) |
| 0.1 | 1.6 | GO:0000245 | spliceosomal complex assembly(GO:0000245) |
| 0.1 | 1.6 | GO:0071156 | regulation of cell cycle arrest(GO:0071156) |
| 0.1 | 1.3 | GO:0032781 | positive regulation of ATPase activity(GO:0032781) |
| 0.1 | 1.2 | GO:0009263 | deoxyribonucleotide biosynthetic process(GO:0009263) |
| 0.1 | 0.6 | GO:0018027 | peptidyl-lysine dimethylation(GO:0018027) |
| 0.1 | 1.3 | GO:0006308 | DNA catabolic process(GO:0006308) |
| 0.1 | 0.4 | GO:0070131 | regulation of mitochondrial translation(GO:0070129) positive regulation of mitochondrial translation(GO:0070131) |
| 0.1 | 3.2 | GO:0032435 | negative regulation of proteasomal ubiquitin-dependent protein catabolic process(GO:0032435) negative regulation of proteasomal protein catabolic process(GO:1901799) negative regulation of proteolysis involved in cellular protein catabolic process(GO:1903051) negative regulation of cellular protein catabolic process(GO:1903363) |
| 0.1 | 1.4 | GO:0051642 | centrosome localization(GO:0051642) |
| 0.1 | 2.7 | GO:0006303 | double-strand break repair via nonhomologous end joining(GO:0006303) |
| 0.1 | 1.3 | GO:0030656 | regulation of isoprenoid metabolic process(GO:0019747) regulation of vitamin metabolic process(GO:0030656) regulation of retinoic acid biosynthetic process(GO:1900052) |
| 0.1 | 0.5 | GO:0043508 | negative regulation of JUN kinase activity(GO:0043508) |
| 0.1 | 0.9 | GO:0006878 | cellular copper ion homeostasis(GO:0006878) |
| 0.1 | 4.4 | GO:0000079 | regulation of cyclin-dependent protein serine/threonine kinase activity(GO:0000079) regulation of cyclin-dependent protein kinase activity(GO:1904029) |
| 0.1 | 1.3 | GO:2000406 | positive regulation of lymphocyte migration(GO:2000403) positive regulation of T cell migration(GO:2000406) |
| 0.1 | 0.6 | GO:0031055 | chromatin remodeling at centromere(GO:0031055) CENP-A containing nucleosome assembly(GO:0034080) CENP-A containing chromatin organization(GO:0061641) |
| 0.1 | 2.5 | GO:0033014 | porphyrin-containing compound biosynthetic process(GO:0006779) tetrapyrrole biosynthetic process(GO:0033014) |
| 0.1 | 2.2 | GO:0018149 | peptide cross-linking(GO:0018149) |
| 0.1 | 1.7 | GO:0015693 | magnesium ion transport(GO:0015693) |
| 0.1 | 0.7 | GO:0009312 | oligosaccharide biosynthetic process(GO:0009312) |
| 0.1 | 0.3 | GO:0035552 | oxidative single-stranded DNA demethylation(GO:0035552) |
| 0.1 | 0.4 | GO:0070084 | protein initiator methionine removal(GO:0070084) |
| 0.1 | 0.6 | GO:0043653 | mitochondrial fragmentation involved in apoptotic process(GO:0043653) |
| 0.1 | 0.5 | GO:0072677 | eosinophil chemotaxis(GO:0048245) eosinophil migration(GO:0072677) |
| 0.1 | 1.0 | GO:0018120 | peptidyl-arginine ADP-ribosylation(GO:0018120) |
| 0.1 | 1.0 | GO:0050892 | intestinal absorption(GO:0050892) |
| 0.1 | 1.3 | GO:0000460 | maturation of 5.8S rRNA(GO:0000460) |
| 0.1 | 0.9 | GO:0060575 | intestinal epithelial cell differentiation(GO:0060575) |
| 0.1 | 1.3 | GO:0051131 | chaperone-mediated protein complex assembly(GO:0051131) |
| 0.1 | 0.6 | GO:0000478 | endonucleolytic cleavage involved in rRNA processing(GO:0000478) endonucleolytic cleavage of tricistronic rRNA transcript (SSU-rRNA, 5.8S rRNA, LSU-rRNA)(GO:0000479) |
| 0.1 | 1.0 | GO:0048796 | swim bladder maturation(GO:0048796) swim bladder inflation(GO:0048798) |
| 0.1 | 2.4 | GO:0032543 | mitochondrial translation(GO:0032543) |
| 0.1 | 0.6 | GO:0003319 | cardioblast migration to the midline involved in heart rudiment formation(GO:0003319) |
| 0.1 | 0.8 | GO:0071850 | mitotic cell cycle arrest(GO:0071850) |
| 0.1 | 0.9 | GO:0006611 | protein export from nucleus(GO:0006611) |
| 0.1 | 0.5 | GO:0051045 | regulation of membrane protein ectodomain proteolysis(GO:0051043) negative regulation of membrane protein ectodomain proteolysis(GO:0051045) |
| 0.1 | 2.2 | GO:0071910 | determination of liver left/right asymmetry(GO:0071910) |
| 0.1 | 0.3 | GO:0030220 | platelet formation(GO:0030220) platelet morphogenesis(GO:0036344) |
| 0.1 | 0.6 | GO:0051013 | microtubule severing(GO:0051013) |
| 0.1 | 1.2 | GO:0045920 | negative regulation of exocytosis(GO:0045920) |
| 0.1 | 0.6 | GO:0046070 | dGTP catabolic process(GO:0006203) purine nucleoside triphosphate catabolic process(GO:0009146) purine deoxyribonucleoside triphosphate catabolic process(GO:0009217) dGTP metabolic process(GO:0046070) |
| 0.1 | 1.2 | GO:0008089 | anterograde axonal transport(GO:0008089) |
| 0.1 | 1.0 | GO:0036353 | histone H2A-K119 monoubiquitination(GO:0036353) |
| 0.1 | 0.8 | GO:0032392 | DNA geometric change(GO:0032392) DNA duplex unwinding(GO:0032508) |
| 0.1 | 0.3 | GO:0019240 | citrulline biosynthetic process(GO:0019240) |
| 0.1 | 0.4 | GO:0032447 | tRNA wobble position uridine thiolation(GO:0002143) protein urmylation(GO:0032447) |
| 0.1 | 0.9 | GO:0032481 | positive regulation of type I interferon production(GO:0032481) |
| 0.1 | 1.3 | GO:0006995 | cellular response to nitrogen starvation(GO:0006995) cellular response to nitrogen levels(GO:0043562) |
| 0.1 | 4.9 | GO:0051225 | spindle assembly(GO:0051225) |
| 0.1 | 0.3 | GO:0006011 | UDP-glucose metabolic process(GO:0006011) |
| 0.1 | 1.2 | GO:0098781 | ncRNA transcription(GO:0098781) |
| 0.1 | 0.4 | GO:0003232 | bulbus arteriosus development(GO:0003232) |
| 0.1 | 0.2 | GO:0070358 | actin polymerization-dependent cell motility(GO:0070358) |
| 0.1 | 0.3 | GO:0008591 | regulation of Wnt signaling pathway, calcium modulating pathway(GO:0008591) negative regulation of non-canonical Wnt signaling pathway(GO:2000051) |
| 0.1 | 1.3 | GO:0051923 | sulfation(GO:0051923) |
| 0.1 | 3.5 | GO:0030166 | proteoglycan biosynthetic process(GO:0030166) |
| 0.1 | 0.4 | GO:0017196 | N-terminal peptidyl-methionine acetylation(GO:0017196) |
| 0.1 | 0.7 | GO:0070979 | protein K11-linked ubiquitination(GO:0070979) |
| 0.1 | 1.3 | GO:1902622 | regulation of neutrophil migration(GO:1902622) |
| 0.1 | 0.6 | GO:0061157 | RNA destabilization(GO:0050779) mRNA destabilization(GO:0061157) |
| 0.1 | 1.9 | GO:0042149 | cellular response to glucose starvation(GO:0042149) |
| 0.1 | 0.6 | GO:0046037 | GMP biosynthetic process(GO:0006177) GMP metabolic process(GO:0046037) |
| 0.1 | 6.3 | GO:0050768 | negative regulation of neurogenesis(GO:0050768) |
| 0.1 | 1.0 | GO:0014066 | regulation of phosphatidylinositol 3-kinase signaling(GO:0014066) |
| 0.1 | 0.2 | GO:0046931 | pore complex assembly(GO:0046931) |
| 0.1 | 0.6 | GO:0031274 | pseudopodium organization(GO:0031268) pseudopodium assembly(GO:0031269) regulation of pseudopodium assembly(GO:0031272) positive regulation of pseudopodium assembly(GO:0031274) |
| 0.1 | 0.6 | GO:0043248 | proteasome assembly(GO:0043248) |
| 0.1 | 7.6 | GO:0016579 | protein deubiquitination(GO:0016579) |
| 0.1 | 1.4 | GO:0006094 | gluconeogenesis(GO:0006094) |
| 0.1 | 2.2 | GO:0030199 | collagen fibril organization(GO:0030199) |
| 0.1 | 0.6 | GO:0016199 | axon midline choice point recognition(GO:0016199) |
| 0.1 | 0.2 | GO:0030238 | female sex determination(GO:0030237) male sex determination(GO:0030238) |
| 0.1 | 0.2 | GO:0031584 | activation of phospholipase D activity(GO:0031584) |
| 0.1 | 0.3 | GO:0021529 | spinal cord oligodendrocyte cell differentiation(GO:0021529) |
| 0.1 | 0.5 | GO:0006450 | regulation of translational fidelity(GO:0006450) |
| 0.1 | 0.6 | GO:0060974 | cell migration involved in heart formation(GO:0060974) |
| 0.1 | 2.2 | GO:0061386 | closure of optic fissure(GO:0061386) |
| 0.1 | 1.8 | GO:0043966 | histone H3 acetylation(GO:0043966) |
| 0.1 | 0.5 | GO:0006658 | phosphatidylserine metabolic process(GO:0006658) |
| 0.0 | 1.5 | GO:0007062 | sister chromatid cohesion(GO:0007062) |
| 0.0 | 0.9 | GO:0001843 | neural tube closure(GO:0001843) |
| 0.0 | 0.5 | GO:0070782 | phosphatidylserine exposure on apoptotic cell surface(GO:0070782) |
| 0.0 | 0.2 | GO:0007252 | I-kappaB phosphorylation(GO:0007252) |
| 0.0 | 0.2 | GO:0030219 | megakaryocyte differentiation(GO:0030219) |
| 0.0 | 0.3 | GO:0000706 | meiotic DNA double-strand break processing(GO:0000706) |
| 0.0 | 0.1 | GO:0060254 | N-terminal protein palmitoylation(GO:0006500) negative regulation of lipoprotein metabolic process(GO:0050748) regulation of N-terminal protein palmitoylation(GO:0060254) negative regulation of N-terminal protein palmitoylation(GO:0060262) negative regulation of protein lipidation(GO:1903060) |
| 0.0 | 1.4 | GO:1903311 | regulation of mRNA processing(GO:0050684) regulation of mRNA metabolic process(GO:1903311) |
| 0.0 | 1.1 | GO:0042476 | odontogenesis(GO:0042476) |
| 0.0 | 0.6 | GO:0051121 | lipoxygenase pathway(GO:0019372) linoleic acid metabolic process(GO:0043651) hepoxilin metabolic process(GO:0051121) hepoxilin biosynthetic process(GO:0051122) |
| 0.0 | 1.0 | GO:0030388 | fructose 1,6-bisphosphate metabolic process(GO:0030388) |
| 0.0 | 0.4 | GO:0000463 | maturation of LSU-rRNA from tricistronic rRNA transcript (SSU-rRNA, 5.8S rRNA, LSU-rRNA)(GO:0000463) |
| 0.0 | 5.1 | GO:0006888 | ER to Golgi vesicle-mediated transport(GO:0006888) |
| 0.0 | 0.3 | GO:0030823 | regulation of cGMP metabolic process(GO:0030823) positive regulation of cGMP metabolic process(GO:0030825) regulation of cGMP biosynthetic process(GO:0030826) positive regulation of cGMP biosynthetic process(GO:0030828) regulation of guanylate cyclase activity(GO:0031282) positive regulation of guanylate cyclase activity(GO:0031284) |
| 0.0 | 0.9 | GO:0060088 | auditory receptor cell stereocilium organization(GO:0060088) |
| 0.0 | 0.1 | GO:0090141 | positive regulation of mitochondrial fission(GO:0090141) |
| 0.0 | 2.5 | GO:0042147 | retrograde transport, endosome to Golgi(GO:0042147) |
| 0.0 | 2.6 | GO:0016575 | histone deacetylation(GO:0016575) |
| 0.0 | 0.5 | GO:0014074 | response to purine-containing compound(GO:0014074) response to ATP(GO:0033198) response to organophosphorus(GO:0046683) |
| 0.0 | 0.7 | GO:0032418 | lysosome localization(GO:0032418) |
| 0.0 | 0.3 | GO:0006880 | intracellular sequestering of iron ion(GO:0006880) sequestering of iron ion(GO:0097577) |
| 0.0 | 1.1 | GO:0000184 | nuclear-transcribed mRNA catabolic process, nonsense-mediated decay(GO:0000184) |
| 0.0 | 8.0 | GO:0042254 | ribosome biogenesis(GO:0042254) |
| 0.0 | 0.3 | GO:0061635 | regulation of protein complex stability(GO:0061635) |
| 0.0 | 0.4 | GO:0042759 | long-chain fatty acid biosynthetic process(GO:0042759) |
| 0.0 | 0.9 | GO:0006515 | misfolded or incompletely synthesized protein catabolic process(GO:0006515) |
| 0.0 | 0.3 | GO:0032096 | negative regulation of response to food(GO:0032096) negative regulation of appetite(GO:0032099) |
| 0.0 | 0.2 | GO:0021888 | hypothalamus gonadotrophin-releasing hormone neuron differentiation(GO:0021886) hypothalamus gonadotrophin-releasing hormone neuron development(GO:0021888) |
| 0.0 | 0.3 | GO:0032185 | septin ring organization(GO:0031106) septin cytoskeleton organization(GO:0032185) |
| 0.0 | 0.3 | GO:0006566 | threonine metabolic process(GO:0006566) threonine catabolic process(GO:0006567) |
| 0.0 | 1.1 | GO:0048013 | ephrin receptor signaling pathway(GO:0048013) |
| 0.0 | 0.5 | GO:0035094 | response to nicotine(GO:0035094) |
| 0.0 | 1.3 | GO:0030488 | tRNA methylation(GO:0030488) |
| 0.0 | 0.5 | GO:0006646 | phosphatidylethanolamine biosynthetic process(GO:0006646) |
| 0.0 | 0.3 | GO:0090136 | epithelial cell-cell adhesion(GO:0090136) |
| 0.0 | 0.8 | GO:0051492 | regulation of stress fiber assembly(GO:0051492) |
| 0.0 | 0.4 | GO:0042989 | sequestering of actin monomers(GO:0042989) |
| 0.0 | 0.0 | GO:0002698 | negative regulation of immune effector process(GO:0002698) |
| 0.0 | 0.8 | GO:0046475 | glycerophospholipid catabolic process(GO:0046475) |
| 0.0 | 0.6 | GO:0002574 | thrombocyte differentiation(GO:0002574) |
| 0.0 | 1.0 | GO:0010499 | proteasomal ubiquitin-independent protein catabolic process(GO:0010499) |
| 0.0 | 2.7 | GO:0008033 | tRNA processing(GO:0008033) |
| 0.0 | 0.8 | GO:0006493 | protein O-linked glycosylation(GO:0006493) |
| 0.0 | 0.3 | GO:0097535 | lymphoid lineage cell migration(GO:0097534) lymphoid lineage cell migration into thymus(GO:0097535) |
| 0.0 | 0.3 | GO:0001765 | membrane raft assembly(GO:0001765) plasma membrane raft assembly(GO:0044854) plasma membrane raft organization(GO:0044857) caveola assembly(GO:0070836) |
| 0.0 | 1.2 | GO:0006626 | protein targeting to mitochondrion(GO:0006626) |
| 0.0 | 0.1 | GO:0042148 | strand invasion(GO:0042148) |
| 0.0 | 0.3 | GO:0006488 | dolichol-linked oligosaccharide biosynthetic process(GO:0006488) |
| 0.0 | 0.4 | GO:0006301 | postreplication repair(GO:0006301) |
| 0.0 | 0.4 | GO:0034314 | Arp2/3 complex-mediated actin nucleation(GO:0034314) |
| 0.0 | 3.5 | GO:0006338 | chromatin remodeling(GO:0006338) |
| 0.0 | 2.0 | GO:0090263 | positive regulation of canonical Wnt signaling pathway(GO:0090263) |
| 0.0 | 1.2 | GO:0002548 | monocyte chemotaxis(GO:0002548) |
| 0.0 | 1.4 | GO:0030335 | positive regulation of cell migration(GO:0030335) |
| 0.0 | 0.7 | GO:0014029 | neural crest formation(GO:0014029) |
| 0.0 | 0.4 | GO:0044872 | lipoprotein transport(GO:0042953) lipoprotein localization(GO:0044872) |
| 0.0 | 0.7 | GO:0070534 | protein K63-linked ubiquitination(GO:0070534) |
| 0.0 | 0.9 | GO:0070936 | protein K48-linked ubiquitination(GO:0070936) |
| 0.0 | 0.7 | GO:0006298 | mismatch repair(GO:0006298) |
| 0.0 | 1.3 | GO:0040036 | regulation of fibroblast growth factor receptor signaling pathway(GO:0040036) |
| 0.0 | 0.2 | GO:0070293 | renal absorption(GO:0070293) |
| 0.0 | 0.3 | GO:2000781 | positive regulation of double-strand break repair(GO:2000781) |
| 0.0 | 0.1 | GO:0019695 | choline metabolic process(GO:0019695) |
| 0.0 | 0.7 | GO:0019835 | cytolysis(GO:0019835) |
| 0.0 | 0.6 | GO:0009408 | response to heat(GO:0009408) |
| 0.0 | 0.5 | GO:0006208 | pyrimidine nucleobase catabolic process(GO:0006208) |
| 0.0 | 0.3 | GO:0007023 | post-chaperonin tubulin folding pathway(GO:0007023) |
| 0.0 | 1.5 | GO:0051607 | defense response to virus(GO:0051607) |
| 0.0 | 1.2 | GO:0006414 | translational elongation(GO:0006414) |
| 0.0 | 0.7 | GO:0006284 | base-excision repair(GO:0006284) |
| 0.0 | 0.8 | GO:0042632 | cholesterol homeostasis(GO:0042632) sterol homeostasis(GO:0055092) |
| 0.0 | 7.6 | GO:0008380 | RNA splicing(GO:0008380) |
| 0.0 | 0.4 | GO:0031163 | iron-sulfur cluster assembly(GO:0016226) metallo-sulfur cluster assembly(GO:0031163) |
| 0.0 | 0.3 | GO:0006123 | mitochondrial electron transport, cytochrome c to oxygen(GO:0006123) |
| 0.0 | 0.3 | GO:1904263 | positive regulation of TORC1 signaling(GO:1904263) |
| 0.0 | 0.4 | GO:1902017 | regulation of cilium assembly(GO:1902017) |
| 0.0 | 0.2 | GO:0045444 | fat cell differentiation(GO:0045444) |
| 0.0 | 1.0 | GO:0002224 | toll-like receptor signaling pathway(GO:0002224) |
| 0.0 | 1.8 | GO:0031929 | TOR signaling(GO:0031929) |
| 0.0 | 0.7 | GO:0030574 | collagen catabolic process(GO:0030574) multicellular organism catabolic process(GO:0044243) |
| 0.0 | 0.0 | GO:1901407 | regulation of phosphorylation of RNA polymerase II C-terminal domain(GO:1901407) |
| 0.0 | 1.0 | GO:0006606 | protein import into nucleus(GO:0006606) protein targeting to nucleus(GO:0044744) single-organism nuclear import(GO:1902593) |
| 0.0 | 0.5 | GO:0035308 | negative regulation of dephosphorylation(GO:0035305) negative regulation of protein dephosphorylation(GO:0035308) |
| 0.0 | 0.2 | GO:0031295 | lymphocyte costimulation(GO:0031294) T cell costimulation(GO:0031295) |
| 0.0 | 0.6 | GO:0009950 | dorsal/ventral axis specification(GO:0009950) |
| 0.0 | 0.5 | GO:0014866 | skeletal myofibril assembly(GO:0014866) |
| 0.0 | 0.4 | GO:0006744 | ubiquinone metabolic process(GO:0006743) ubiquinone biosynthetic process(GO:0006744) quinone biosynthetic process(GO:1901663) |
| 0.0 | 0.3 | GO:0030309 | poly-N-acetyllactosamine metabolic process(GO:0030309) poly-N-acetyllactosamine biosynthetic process(GO:0030311) |
| 0.0 | 0.2 | GO:0043046 | DNA methylation involved in gamete generation(GO:0043046) |
| 0.0 | 0.2 | GO:0006787 | porphyrin-containing compound catabolic process(GO:0006787) tetrapyrrole catabolic process(GO:0033015) heme catabolic process(GO:0042167) pigment catabolic process(GO:0046149) |
| 0.0 | 1.0 | GO:0007030 | Golgi organization(GO:0007030) |
| 0.0 | 0.1 | GO:0006703 | estrogen biosynthetic process(GO:0006703) estrogen metabolic process(GO:0008210) |
| 0.0 | 1.1 | GO:0006081 | cellular aldehyde metabolic process(GO:0006081) |
| 0.0 | 0.4 | GO:0060914 | heart formation(GO:0060914) |
| 0.0 | 0.2 | GO:0034504 | protein localization to nucleus(GO:0034504) |
| 0.0 | 0.1 | GO:0032732 | positive regulation of interleukin-1 production(GO:0032732) |
| 0.0 | 0.1 | GO:0070897 | DNA-templated transcriptional preinitiation complex assembly(GO:0070897) |
| 0.0 | 0.6 | GO:0002183 | cytoplasmic translational initiation(GO:0002183) |
| 0.0 | 0.3 | GO:1901888 | regulation of cell junction assembly(GO:1901888) |
| 0.0 | 2.4 | GO:0030902 | hindbrain development(GO:0030902) |
| 0.0 | 0.1 | GO:0010447 | response to acidic pH(GO:0010447) |
| 0.0 | 0.5 | GO:0006282 | regulation of DNA repair(GO:0006282) |
| 0.0 | 0.2 | GO:0060122 | inner ear receptor stereocilium organization(GO:0060122) |
| 0.0 | 0.5 | GO:0043123 | positive regulation of I-kappaB kinase/NF-kappaB signaling(GO:0043123) |
| 0.0 | 0.4 | GO:0001878 | response to yeast(GO:0001878) |
| 0.0 | 0.3 | GO:0045766 | positive regulation of angiogenesis(GO:0045766) |
| 0.0 | 1.0 | GO:0060828 | regulation of canonical Wnt signaling pathway(GO:0060828) |
| 0.0 | 0.5 | GO:0007131 | reciprocal meiotic recombination(GO:0007131) |
| 0.0 | 0.3 | GO:0097178 | ruffle assembly(GO:0097178) |
| 0.0 | 0.4 | GO:0006506 | GPI anchor metabolic process(GO:0006505) GPI anchor biosynthetic process(GO:0006506) |
| 0.0 | 3.4 | GO:0006470 | protein dephosphorylation(GO:0006470) |
| 0.0 | 0.3 | GO:0036297 | interstrand cross-link repair(GO:0036297) |
| 0.0 | 0.4 | GO:0001706 | endoderm formation(GO:0001706) |
| 0.0 | 0.9 | GO:0045930 | negative regulation of mitotic cell cycle(GO:0045930) |
| 0.0 | 0.6 | GO:0006956 | complement activation(GO:0006956) |
| 0.0 | 0.9 | GO:0006413 | translational initiation(GO:0006413) |
| 0.0 | 0.1 | GO:0019370 | leukotriene metabolic process(GO:0006691) leukotriene biosynthetic process(GO:0019370) |
| 0.0 | 0.3 | GO:0060972 | left/right pattern formation(GO:0060972) |
| 0.0 | 2.0 | GO:0006281 | DNA repair(GO:0006281) |
| 0.0 | 0.8 | GO:0031146 | SCF-dependent proteasomal ubiquitin-dependent protein catabolic process(GO:0031146) |
| 0.0 | 0.1 | GO:0007288 | sperm axoneme assembly(GO:0007288) |
| 0.0 | 1.0 | GO:0070507 | regulation of microtubule-based process(GO:0032886) regulation of microtubule cytoskeleton organization(GO:0070507) |
| 0.0 | 0.5 | GO:0042462 | eye photoreceptor cell development(GO:0042462) |
| 0.0 | 0.6 | GO:0060070 | canonical Wnt signaling pathway(GO:0060070) |
| 0.0 | 0.9 | GO:0003341 | cilium movement(GO:0003341) |
| 0.0 | 0.2 | GO:0070167 | regulation of bone mineralization(GO:0030500) phosphate ion transmembrane transport(GO:0035435) regulation of biomineral tissue development(GO:0070167) |
Gene overrepresentation in cellular component category:
| Log-likelihood per target | Total log-likelihood | Term | Description |
|---|---|---|---|
| 1.0 | 4.0 | GO:0008622 | epsilon DNA polymerase complex(GO:0008622) |
| 0.8 | 3.3 | GO:0097134 | cyclin E1-CDK2 complex(GO:0097134) |
| 0.6 | 1.9 | GO:0071065 | alpha9-beta1 integrin-vascular cell adhesion molecule-1 complex(GO:0071065) |
| 0.6 | 3.1 | GO:0031298 | replication fork protection complex(GO:0031298) |
| 0.5 | 1.5 | GO:0033185 | dolichol-phosphate-mannose synthase complex(GO:0033185) |
| 0.5 | 1.9 | GO:0000818 | nuclear MIS12/MIND complex(GO:0000818) |
| 0.5 | 3.3 | GO:0031261 | DNA replication preinitiation complex(GO:0031261) |
| 0.5 | 1.9 | GO:0033186 | CAF-1 complex(GO:0033186) |
| 0.4 | 0.9 | GO:0000941 | condensed nuclear chromosome inner kinetochore(GO:0000941) |
| 0.4 | 3.6 | GO:0070652 | HAUS complex(GO:0070652) |
| 0.4 | 2.4 | GO:0030870 | Mre11 complex(GO:0030870) |
| 0.4 | 2.3 | GO:0031428 | box C/D snoRNP complex(GO:0031428) |
| 0.4 | 1.1 | GO:0008275 | gamma-tubulin small complex(GO:0008275) |
| 0.4 | 1.1 | GO:0031233 | intrinsic component of external side of plasma membrane(GO:0031233) anchored component of external side of plasma membrane(GO:0031362) |
| 0.3 | 1.4 | GO:0005880 | nuclear microtubule(GO:0005880) |
| 0.3 | 1.3 | GO:0005968 | Rab-protein geranylgeranyltransferase complex(GO:0005968) |
| 0.3 | 1.3 | GO:1904423 | dehydrodolichyl diphosphate synthase complex(GO:1904423) |
| 0.3 | 3.4 | GO:0031080 | nuclear pore outer ring(GO:0031080) |
| 0.3 | 2.8 | GO:0000974 | Prp19 complex(GO:0000974) |
| 0.3 | 2.1 | GO:0034715 | pICln-Sm protein complex(GO:0034715) |
| 0.3 | 2.0 | GO:0030914 | STAGA complex(GO:0030914) |
| 0.3 | 2.4 | GO:0097550 | transcriptional preinitiation complex(GO:0097550) |
| 0.3 | 3.0 | GO:0030904 | retromer complex(GO:0030904) |
| 0.3 | 2.9 | GO:0016602 | CCAAT-binding factor complex(GO:0016602) |
| 0.3 | 1.0 | GO:0031429 | box H/ACA snoRNP complex(GO:0031429) box H/ACA RNP complex(GO:0072588) |
| 0.3 | 1.3 | GO:0055087 | Ski complex(GO:0055087) |
| 0.2 | 4.1 | GO:0005685 | U1 snRNP(GO:0005685) |
| 0.2 | 1.0 | GO:0000931 | gamma-tubulin large complex(GO:0000931) gamma-tubulin ring complex(GO:0008274) |
| 0.2 | 1.4 | GO:0009331 | glycerol-3-phosphate dehydrogenase complex(GO:0009331) |
| 0.2 | 1.2 | GO:1990204 | oxidoreductase complex(GO:1990204) |
| 0.2 | 2.2 | GO:0005665 | DNA-directed RNA polymerase II, core complex(GO:0005665) |
| 0.2 | 1.3 | GO:1990130 | Iml1 complex(GO:1990130) |
| 0.2 | 3.5 | GO:1990907 | beta-catenin-TCF complex(GO:1990907) |
| 0.2 | 0.8 | GO:0045283 | mitochondrial respiratory chain complex II, succinate dehydrogenase complex (ubiquinone)(GO:0005749) succinate dehydrogenase complex (ubiquinone)(GO:0045257) respiratory chain complex II(GO:0045273) succinate dehydrogenase complex(GO:0045281) fumarate reductase complex(GO:0045283) |
| 0.2 | 0.6 | GO:0000214 | tRNA-intron endonuclease complex(GO:0000214) |
| 0.2 | 1.8 | GO:0072546 | ER membrane protein complex(GO:0072546) |
| 0.2 | 1.2 | GO:0031931 | TORC1 complex(GO:0031931) |
| 0.1 | 4.5 | GO:0030686 | 90S preribosome(GO:0030686) |
| 0.1 | 2.6 | GO:0042555 | MCM complex(GO:0042555) |
| 0.1 | 2.6 | GO:0005669 | transcription factor TFIID complex(GO:0005669) |
| 0.1 | 0.8 | GO:1902636 | kinociliary basal body(GO:1902636) |
| 0.1 | 1.1 | GO:0043020 | NADPH oxidase complex(GO:0043020) |
| 0.1 | 1.0 | GO:0031616 | spindle pole centrosome(GO:0031616) |
| 0.1 | 1.3 | GO:0034451 | centriolar satellite(GO:0034451) |
| 0.1 | 0.8 | GO:0000408 | EKC/KEOPS complex(GO:0000408) |
| 0.1 | 1.4 | GO:0016580 | Sin3 complex(GO:0016580) |
| 0.1 | 2.1 | GO:0005689 | U12-type spliceosomal complex(GO:0005689) |
| 0.1 | 4.8 | GO:0000315 | organellar large ribosomal subunit(GO:0000315) mitochondrial large ribosomal subunit(GO:0005762) |
| 0.1 | 2.8 | GO:0033116 | endoplasmic reticulum-Golgi intermediate compartment membrane(GO:0033116) |
| 0.1 | 0.8 | GO:0033061 | DNA recombinase mediator complex(GO:0033061) |
| 0.1 | 1.2 | GO:0031588 | nucleotide-activated protein kinase complex(GO:0031588) |
| 0.1 | 0.5 | GO:0005879 | axonemal microtubule(GO:0005879) |
| 0.1 | 0.6 | GO:0071007 | U2-type catalytic step 2 spliceosome(GO:0071007) |
| 0.1 | 3.4 | GO:0000421 | autophagosome membrane(GO:0000421) |
| 0.1 | 0.9 | GO:0032300 | mismatch repair complex(GO:0032300) |
| 0.1 | 0.8 | GO:0071797 | LUBAC complex(GO:0071797) |
| 0.1 | 0.6 | GO:0005851 | eukaryotic translation initiation factor 2B complex(GO:0005851) |
| 0.1 | 6.2 | GO:0030173 | integral component of Golgi membrane(GO:0030173) intrinsic component of Golgi membrane(GO:0031228) |
| 0.1 | 0.7 | GO:0072487 | MSL complex(GO:0072487) |
| 0.1 | 2.0 | GO:0045180 | basal cortex(GO:0045180) |
| 0.1 | 0.4 | GO:0097224 | sperm connecting piece(GO:0097224) |
| 0.1 | 3.2 | GO:0000118 | histone deacetylase complex(GO:0000118) |
| 0.1 | 1.1 | GO:0070187 | telosome(GO:0070187) |
| 0.1 | 0.1 | GO:0000126 | transcription factor TFIIIB complex(GO:0000126) |
| 0.1 | 1.3 | GO:0071339 | MLL1/2 complex(GO:0044665) MLL1 complex(GO:0071339) |
| 0.1 | 1.0 | GO:0044545 | NSL complex(GO:0044545) |
| 0.1 | 1.4 | GO:0032039 | integrator complex(GO:0032039) |
| 0.1 | 18.5 | GO:0005730 | nucleolus(GO:0005730) |
| 0.1 | 3.6 | GO:0016592 | mediator complex(GO:0016592) |
| 0.1 | 0.3 | GO:0016593 | Cdc73/Paf1 complex(GO:0016593) |
| 0.1 | 1.5 | GO:0008278 | cohesin complex(GO:0008278) |
| 0.1 | 2.2 | GO:0017053 | transcriptional repressor complex(GO:0017053) |
| 0.1 | 0.7 | GO:0005832 | chaperonin-containing T-complex(GO:0005832) |
| 0.1 | 4.8 | GO:0005814 | centriole(GO:0005814) |
| 0.1 | 0.8 | GO:1990589 | ATF4-CREB1 transcription factor complex(GO:1990589) |
| 0.1 | 0.5 | GO:0035145 | exon-exon junction complex(GO:0035145) |
| 0.1 | 0.8 | GO:0035098 | ESC/E(Z) complex(GO:0035098) |
| 0.1 | 0.5 | GO:0001772 | immunological synapse(GO:0001772) |
| 0.1 | 0.2 | GO:0044218 | other organism(GO:0044215) other organism cell(GO:0044216) other organism part(GO:0044217) other organism cell membrane(GO:0044218) other organism membrane(GO:0044279) |
| 0.1 | 0.3 | GO:1990131 | EGO complex(GO:0034448) Gtr1-Gtr2 GTPase complex(GO:1990131) |
| 0.1 | 0.6 | GO:0008541 | proteasome regulatory particle, lid subcomplex(GO:0008541) |
| 0.1 | 0.6 | GO:0030122 | AP-2 adaptor complex(GO:0030122) |
| 0.1 | 0.3 | GO:0071439 | clathrin complex(GO:0071439) |
| 0.1 | 0.9 | GO:0005847 | mRNA cleavage and polyadenylation specificity factor complex(GO:0005847) |
| 0.1 | 0.2 | GO:0032133 | chromosome passenger complex(GO:0032133) |
| 0.1 | 2.4 | GO:0030864 | cortical actin cytoskeleton(GO:0030864) |
| 0.1 | 1.2 | GO:0030867 | rough endoplasmic reticulum membrane(GO:0030867) |
| 0.1 | 0.8 | GO:0005869 | dynactin complex(GO:0005869) |
| 0.0 | 2.8 | GO:0005788 | endoplasmic reticulum lumen(GO:0005788) |
| 0.0 | 0.3 | GO:0000801 | central element(GO:0000801) |
| 0.0 | 0.7 | GO:0005579 | membrane attack complex(GO:0005579) |
| 0.0 | 0.9 | GO:0031083 | BLOC-1 complex(GO:0031083) |
| 0.0 | 0.4 | GO:0031314 | extrinsic component of mitochondrial inner membrane(GO:0031314) |
| 0.0 | 1.1 | GO:0000313 | organellar ribosome(GO:0000313) mitochondrial ribosome(GO:0005761) |
| 0.0 | 0.6 | GO:0000153 | cytoplasmic ubiquitin ligase complex(GO:0000153) |
| 0.0 | 1.0 | GO:0035102 | PRC1 complex(GO:0035102) |
| 0.0 | 0.6 | GO:0097526 | spliceosomal tri-snRNP complex(GO:0097526) |
| 0.0 | 0.4 | GO:0031414 | N-terminal protein acetyltransferase complex(GO:0031414) |
| 0.0 | 2.2 | GO:0005643 | nuclear pore(GO:0005643) |
| 0.0 | 0.6 | GO:0005666 | DNA-directed RNA polymerase III complex(GO:0005666) |
| 0.0 | 1.6 | GO:0016514 | SWI/SNF complex(GO:0016514) |
| 0.0 | 2.0 | GO:0030134 | ER to Golgi transport vesicle(GO:0030134) |
| 0.0 | 0.4 | GO:0034362 | low-density lipoprotein particle(GO:0034362) |
| 0.0 | 0.2 | GO:0098574 | cytoplasmic side of lysosomal membrane(GO:0098574) |
| 0.0 | 0.2 | GO:0008385 | IkappaB kinase complex(GO:0008385) |
| 0.0 | 3.2 | GO:0000932 | cytoplasmic mRNA processing body(GO:0000932) |
| 0.0 | 0.5 | GO:0034751 | aryl hydrocarbon receptor complex(GO:0034751) |
| 0.0 | 0.3 | GO:0005791 | rough endoplasmic reticulum(GO:0005791) |
| 0.0 | 2.2 | GO:0031901 | early endosome membrane(GO:0031901) |
| 0.0 | 2.5 | GO:0000502 | proteasome complex(GO:0000502) |
| 0.0 | 0.3 | GO:0034708 | methyltransferase complex(GO:0034708) |
| 0.0 | 2.0 | GO:0032580 | Golgi cisterna membrane(GO:0032580) |
| 0.0 | 1.8 | GO:0031304 | intrinsic component of mitochondrial inner membrane(GO:0031304) |
| 0.0 | 1.7 | GO:0000922 | spindle pole(GO:0000922) |
| 0.0 | 2.1 | GO:0005930 | axoneme(GO:0005930) |
| 0.0 | 2.9 | GO:0005604 | basement membrane(GO:0005604) |
| 0.0 | 3.2 | GO:0098852 | lysosomal membrane(GO:0005765) lytic vacuole membrane(GO:0098852) |
| 0.0 | 0.4 | GO:0015030 | Cajal body(GO:0015030) |
| 0.0 | 0.5 | GO:0005876 | spindle microtubule(GO:0005876) |
| 0.0 | 0.3 | GO:0043240 | Fanconi anaemia nuclear complex(GO:0043240) |
| 0.0 | 1.0 | GO:0000307 | cyclin-dependent protein kinase holoenzyme complex(GO:0000307) |
| 0.0 | 1.1 | GO:0000777 | condensed chromosome kinetochore(GO:0000777) |
| 0.0 | 0.7 | GO:0005680 | anaphase-promoting complex(GO:0005680) |
| 0.0 | 26.3 | GO:0005739 | mitochondrion(GO:0005739) |
| 0.0 | 0.8 | GO:0031105 | septin ring(GO:0005940) septin complex(GO:0031105) septin cytoskeleton(GO:0032156) |
| 0.0 | 0.4 | GO:0005885 | Arp2/3 protein complex(GO:0005885) |
| 0.0 | 0.2 | GO:0070419 | nonhomologous end joining complex(GO:0070419) |
| 0.0 | 2.9 | GO:0016604 | nuclear body(GO:0016604) |
| 0.0 | 1.8 | GO:0005769 | early endosome(GO:0005769) |
| 0.0 | 0.6 | GO:0000775 | chromosome, centromeric region(GO:0000775) |
| 0.0 | 0.1 | GO:0072669 | tRNA-splicing ligase complex(GO:0072669) |
| 0.0 | 0.2 | GO:0033202 | Ino80 complex(GO:0031011) DNA helicase complex(GO:0033202) |
| 0.0 | 2.5 | GO:0005813 | centrosome(GO:0005813) |
| 0.0 | 0.4 | GO:0036064 | ciliary basal body(GO:0036064) |
| 0.0 | 2.2 | GO:0031461 | cullin-RING ubiquitin ligase complex(GO:0031461) |
| 0.0 | 0.2 | GO:0035267 | NuA4 histone acetyltransferase complex(GO:0035267) H4/H2A histone acetyltransferase complex(GO:0043189) H4 histone acetyltransferase complex(GO:1902562) |
| 0.0 | 1.1 | GO:0005802 | trans-Golgi network(GO:0005802) |
| 0.0 | 1.1 | GO:0030176 | integral component of endoplasmic reticulum membrane(GO:0030176) |
| 0.0 | 4.0 | GO:0005654 | nucleoplasm(GO:0005654) |
| 0.0 | 4.5 | GO:0005694 | chromosome(GO:0005694) |
| 0.0 | 0.1 | GO:0097225 | sperm midpiece(GO:0097225) |
Gene overrepresentation in molecular function category:
| Log-likelihood per target | Total log-likelihood | Term | Description |
|---|---|---|---|
| 0.8 | 2.4 | GO:0004311 | farnesyltranstransferase activity(GO:0004311) |
| 0.7 | 2.2 | GO:0016155 | formyltetrahydrofolate dehydrogenase activity(GO:0016155) |
| 0.6 | 3.2 | GO:0060182 | apelin receptor activity(GO:0060182) |
| 0.6 | 1.9 | GO:0035243 | protein-arginine omega-N symmetric methyltransferase activity(GO:0035243) |
| 0.6 | 3.3 | GO:0004418 | hydroxymethylbilane synthase activity(GO:0004418) |
| 0.5 | 2.2 | GO:0004639 | phosphoribosylaminoimidazolesuccinocarboxamide synthase activity(GO:0004639) |
| 0.5 | 1.6 | GO:0036310 | annealing helicase activity(GO:0036310) |
| 0.5 | 1.5 | GO:0052717 | tRNA-specific adenosine-34 deaminase activity(GO:0052717) |
| 0.5 | 1.9 | GO:0033829 | O-fucosylpeptide 3-beta-N-acetylglucosaminyltransferase activity(GO:0033829) |
| 0.5 | 1.4 | GO:0004736 | pyruvate carboxylase activity(GO:0004736) |
| 0.4 | 1.8 | GO:0043142 | single-stranded DNA-dependent ATP-dependent DNA helicase activity(GO:0017116) single-stranded DNA-dependent ATPase activity(GO:0043142) |
| 0.4 | 1.3 | GO:0002094 | polyprenyltransferase activity(GO:0002094) |
| 0.4 | 3.8 | GO:0004586 | ornithine decarboxylase activity(GO:0004586) |
| 0.4 | 1.2 | GO:0050135 | NAD(P)+ nucleosidase activity(GO:0050135) |
| 0.4 | 2.4 | GO:0000014 | single-stranded DNA endodeoxyribonuclease activity(GO:0000014) |
| 0.4 | 3.5 | GO:0071933 | Arp2/3 complex binding(GO:0071933) |
| 0.4 | 2.6 | GO:0004095 | carnitine O-palmitoyltransferase activity(GO:0004095) O-palmitoyltransferase activity(GO:0016416) |
| 0.4 | 1.5 | GO:0015018 | galactosylgalactosylxylosylprotein 3-beta-glucuronosyltransferase activity(GO:0015018) |
| 0.4 | 8.9 | GO:0003688 | DNA replication origin binding(GO:0003688) |
| 0.3 | 1.4 | GO:0004367 | glycerol-3-phosphate dehydrogenase [NAD+] activity(GO:0004367) |
| 0.3 | 2.1 | GO:0001047 | core promoter sequence-specific DNA binding(GO:0001046) core promoter binding(GO:0001047) |
| 0.3 | 1.4 | GO:0003979 | UDP-glucose 6-dehydrogenase activity(GO:0003979) |
| 0.3 | 1.3 | GO:0004663 | Rab geranylgeranyltransferase activity(GO:0004663) |
| 0.3 | 1.0 | GO:0043739 | G/U mismatch-specific uracil-DNA glycosylase activity(GO:0043739) |
| 0.3 | 0.9 | GO:0032027 | myosin light chain binding(GO:0032027) |
| 0.3 | 1.8 | GO:0017095 | heparan sulfate 6-O-sulfotransferase activity(GO:0017095) |
| 0.3 | 1.4 | GO:0004565 | beta-galactosidase activity(GO:0004565) |
| 0.3 | 2.0 | GO:0004128 | cytochrome-b5 reductase activity, acting on NAD(P)H(GO:0004128) |
| 0.3 | 5.1 | GO:0008301 | DNA binding, bending(GO:0008301) |
| 0.2 | 2.8 | GO:0004656 | procollagen-proline 4-dioxygenase activity(GO:0004656) |
| 0.2 | 2.3 | GO:0035198 | miRNA binding(GO:0035198) |
| 0.2 | 0.9 | GO:0050211 | procollagen galactosyltransferase activity(GO:0050211) |
| 0.2 | 0.9 | GO:0034511 | U3 snoRNA binding(GO:0034511) |
| 0.2 | 2.2 | GO:0035250 | UDP-galactosyltransferase activity(GO:0035250) |
| 0.2 | 1.7 | GO:0004861 | cyclin-dependent protein serine/threonine kinase inhibitor activity(GO:0004861) |
| 0.2 | 1.2 | GO:0004022 | alcohol dehydrogenase (NAD) activity(GO:0004022) |
| 0.2 | 1.8 | GO:0016725 | oxidoreductase activity, acting on CH or CH2 groups(GO:0016725) |
| 0.2 | 1.8 | GO:0032977 | membrane insertase activity(GO:0032977) |
| 0.2 | 1.8 | GO:0016176 | superoxide-generating NADPH oxidase activator activity(GO:0016176) |
| 0.2 | 0.6 | GO:0019777 | Atg12 transferase activity(GO:0019777) |
| 0.2 | 1.9 | GO:0004530 | deoxyribonuclease I activity(GO:0004530) |
| 0.2 | 1.1 | GO:0043023 | ribosomal large subunit binding(GO:0043023) |
| 0.2 | 0.6 | GO:0030623 | U5 snRNA binding(GO:0030623) |
| 0.2 | 0.6 | GO:0016165 | linoleate 13S-lipoxygenase activity(GO:0016165) |
| 0.2 | 0.7 | GO:0035575 | histone demethylase activity (H4-K20 specific)(GO:0035575) |
| 0.2 | 1.1 | GO:0098505 | G-rich strand telomeric DNA binding(GO:0098505) |
| 0.2 | 4.5 | GO:0042162 | telomeric DNA binding(GO:0042162) |
| 0.2 | 2.4 | GO:0002020 | protease binding(GO:0002020) |
| 0.2 | 4.8 | GO:0017056 | structural constituent of nuclear pore(GO:0017056) |
| 0.2 | 1.4 | GO:0005161 | platelet-derived growth factor receptor binding(GO:0005161) |
| 0.1 | 1.0 | GO:0004045 | aminoacyl-tRNA hydrolase activity(GO:0004045) |
| 0.1 | 0.7 | GO:0004001 | adenosine kinase activity(GO:0004001) |
| 0.1 | 1.2 | GO:0008476 | protein-tyrosine sulfotransferase activity(GO:0008476) |
| 0.1 | 2.4 | GO:0046975 | histone methyltransferase activity (H3-K36 specific)(GO:0046975) |
| 0.1 | 1.2 | GO:0004332 | fructose-bisphosphate aldolase activity(GO:0004332) |
| 0.1 | 0.7 | GO:0008309 | double-stranded DNA exodeoxyribonuclease activity(GO:0008309) double-stranded DNA 3'-5' exodeoxyribonuclease activity(GO:0008311) |
| 0.1 | 1.3 | GO:0004731 | purine-nucleoside phosphorylase activity(GO:0004731) |
| 0.1 | 0.4 | GO:0000035 | acyl binding(GO:0000035) |
| 0.1 | 2.4 | GO:0045159 | myosin II binding(GO:0045159) |
| 0.1 | 0.6 | GO:0016453 | C-acetyltransferase activity(GO:0016453) |
| 0.1 | 2.2 | GO:0043015 | gamma-tubulin binding(GO:0043015) |
| 0.1 | 0.7 | GO:0005542 | folic acid binding(GO:0005542) |
| 0.1 | 0.4 | GO:0061711 | N(6)-L-threonylcarbamoyladenine synthase(GO:0061711) |
| 0.1 | 2.6 | GO:0016251 | obsolete general RNA polymerase II transcription factor activity(GO:0016251) |
| 0.1 | 2.3 | GO:0008649 | rRNA methyltransferase activity(GO:0008649) |
| 0.1 | 0.7 | GO:0016888 | endodeoxyribonuclease activity, producing 5'-phosphomonoesters(GO:0016888) |
| 0.1 | 10.6 | GO:0003724 | RNA helicase activity(GO:0003724) |
| 0.1 | 1.3 | GO:0016783 | sulfurtransferase activity(GO:0016783) |
| 0.1 | 6.0 | GO:0000049 | tRNA binding(GO:0000049) |
| 0.1 | 0.9 | GO:0030983 | mismatched DNA binding(GO:0030983) |
| 0.1 | 0.6 | GO:0016892 | endoribonuclease activity, producing 3'-phosphomonoesters(GO:0016892) |
| 0.1 | 3.1 | GO:0051018 | protein kinase A binding(GO:0051018) |
| 0.1 | 1.5 | GO:0032454 | histone demethylase activity (H3-K9 specific)(GO:0032454) |
| 0.1 | 2.9 | GO:1990841 | promoter-specific chromatin binding(GO:1990841) |
| 0.1 | 0.6 | GO:0004362 | glutathione-disulfide reductase activity(GO:0004362) |
| 0.1 | 1.1 | GO:0005522 | profilin binding(GO:0005522) |
| 0.1 | 0.3 | GO:0004969 | histamine receptor activity(GO:0004969) |
| 0.1 | 2.2 | GO:0003810 | protein-glutamine gamma-glutamyltransferase activity(GO:0003810) |
| 0.1 | 1.2 | GO:0031994 | insulin-like growth factor I binding(GO:0031994) insulin-like growth factor II binding(GO:0031995) |
| 0.1 | 8.8 | GO:0008138 | protein tyrosine/serine/threonine phosphatase activity(GO:0008138) |
| 0.1 | 0.8 | GO:0035252 | UDP-xylosyltransferase activity(GO:0035252) |
| 0.1 | 2.4 | GO:0003887 | DNA-directed DNA polymerase activity(GO:0003887) |
| 0.1 | 2.8 | GO:0034062 | DNA-directed RNA polymerase activity(GO:0003899) RNA polymerase activity(GO:0034062) |
| 0.1 | 0.9 | GO:0004176 | ATP-dependent peptidase activity(GO:0004176) |
| 0.1 | 0.6 | GO:0061133 | endopeptidase activator activity(GO:0061133) |
| 0.1 | 1.1 | GO:0015204 | urea transmembrane transporter activity(GO:0015204) |
| 0.1 | 5.7 | GO:0016538 | cyclin-dependent protein serine/threonine kinase regulator activity(GO:0016538) |
| 0.1 | 2.2 | GO:0031492 | nucleosomal DNA binding(GO:0031492) |
| 0.1 | 3.9 | GO:0050840 | extracellular matrix binding(GO:0050840) |
| 0.1 | 0.6 | GO:1990247 | N6-methyladenosine-containing RNA binding(GO:1990247) |
| 0.1 | 0.5 | GO:0004307 | ethanolaminephosphotransferase activity(GO:0004307) |
| 0.1 | 1.0 | GO:0004028 | 3-chloroallyl aldehyde dehydrogenase activity(GO:0004028) |
| 0.1 | 0.6 | GO:0016793 | dGTPase activity(GO:0008832) triphosphoric monoester hydrolase activity(GO:0016793) |
| 0.1 | 0.3 | GO:0003999 | adenine phosphoribosyltransferase activity(GO:0003999) |
| 0.1 | 1.0 | GO:0003956 | NAD(P)+-protein-arginine ADP-ribosyltransferase activity(GO:0003956) |
| 0.1 | 0.8 | GO:0015232 | heme transporter activity(GO:0015232) |
| 0.1 | 1.7 | GO:0015095 | magnesium ion transmembrane transporter activity(GO:0015095) |
| 0.1 | 1.1 | GO:0004549 | tRNA-specific ribonuclease activity(GO:0004549) |
| 0.1 | 0.6 | GO:0016863 | intramolecular oxidoreductase activity, transposing C=C bonds(GO:0016863) |
| 0.1 | 0.9 | GO:0005049 | nuclear export signal receptor activity(GO:0005049) |
| 0.1 | 0.4 | GO:0008097 | 5S rRNA binding(GO:0008097) |
| 0.1 | 0.4 | GO:0004385 | guanylate kinase activity(GO:0004385) |
| 0.1 | 1.3 | GO:0048018 | receptor activator activity(GO:0030546) receptor agonist activity(GO:0048018) |
| 0.1 | 0.3 | GO:0050649 | testosterone 6-beta-hydroxylase activity(GO:0050649) |
| 0.1 | 4.1 | GO:0008013 | beta-catenin binding(GO:0008013) |
| 0.1 | 0.3 | GO:0001875 | lipopolysaccharide receptor activity(GO:0001875) |
| 0.1 | 1.3 | GO:0016018 | cyclosporin A binding(GO:0016018) |
| 0.1 | 1.3 | GO:0061578 | Lys63-specific deubiquitinase activity(GO:0061578) |
| 0.1 | 1.9 | GO:0047617 | acyl-CoA hydrolase activity(GO:0047617) |
| 0.1 | 0.8 | GO:0035925 | AU-rich element binding(GO:0017091) mRNA 3'-UTR AU-rich region binding(GO:0035925) |
| 0.1 | 0.5 | GO:0015616 | DNA translocase activity(GO:0015616) |
| 0.1 | 0.2 | GO:0000104 | succinate dehydrogenase activity(GO:0000104) |
| 0.1 | 1.2 | GO:0030515 | snoRNA binding(GO:0030515) |
| 0.1 | 2.6 | GO:0030374 | ligand-dependent nuclear receptor transcription coactivator activity(GO:0030374) |
| 0.1 | 0.8 | GO:0047498 | calcium-dependent phospholipase A2 activity(GO:0047498) |
| 0.1 | 1.0 | GO:0005537 | mannose binding(GO:0005537) |
| 0.1 | 0.7 | GO:0048039 | ubiquinone binding(GO:0048039) |
| 0.1 | 0.5 | GO:0045735 | nutrient reservoir activity(GO:0045735) |
| 0.1 | 1.0 | GO:0016884 | carbon-nitrogen ligase activity, with glutamine as amido-N-donor(GO:0016884) |
| 0.1 | 1.9 | GO:0016208 | AMP binding(GO:0016208) |
| 0.1 | 0.8 | GO:0000268 | peroxisome targeting sequence binding(GO:0000268) |
| 0.1 | 1.3 | GO:0008409 | 5'-3' exonuclease activity(GO:0008409) |
| 0.1 | 0.4 | GO:0034714 | type III transforming growth factor beta receptor binding(GO:0034714) |
| 0.1 | 3.3 | GO:0008094 | DNA-dependent ATPase activity(GO:0008094) |
| 0.1 | 0.7 | GO:0016423 | tRNA (guanine) methyltransferase activity(GO:0016423) |
| 0.1 | 0.3 | GO:0003983 | UTP:glucose-1-phosphate uridylyltransferase activity(GO:0003983) UTP-monosaccharide-1-phosphate uridylyltransferase activity(GO:0051748) |
| 0.1 | 0.7 | GO:0016840 | carbon-nitrogen lyase activity(GO:0016840) |
| 0.1 | 0.2 | GO:0000099 | sulfur amino acid transmembrane transporter activity(GO:0000099) |
| 0.1 | 1.3 | GO:0001671 | ATPase activator activity(GO:0001671) |
| 0.1 | 0.7 | GO:0004465 | lipoprotein lipase activity(GO:0004465) |
| 0.1 | 2.3 | GO:0031593 | polyubiquitin binding(GO:0031593) |
| 0.1 | 0.4 | GO:0001032 | polymerase III regulatory region sequence-specific DNA binding(GO:0000992) RNA polymerase III type 3 promoter sequence-specific DNA binding(GO:0001006) RNA polymerase III regulatory region DNA binding(GO:0001016) RNA polymerase III type 3 promoter DNA binding(GO:0001032) |
| 0.1 | 1.8 | GO:0016790 | thiolester hydrolase activity(GO:0016790) |
| 0.1 | 1.3 | GO:0005518 | collagen binding(GO:0005518) |
| 0.1 | 1.0 | GO:0009982 | pseudouridine synthase activity(GO:0009982) |
| 0.1 | 6.3 | GO:0101005 | thiol-dependent ubiquitin-specific protease activity(GO:0004843) thiol-dependent ubiquitinyl hydrolase activity(GO:0036459) ubiquitinyl hydrolase activity(GO:0101005) |
| 0.1 | 2.4 | GO:0030295 | kinase activator activity(GO:0019209) protein kinase activator activity(GO:0030295) |
| 0.1 | 1.1 | GO:0046875 | ephrin receptor binding(GO:0046875) |
| 0.1 | 0.5 | GO:0004865 | protein serine/threonine phosphatase inhibitor activity(GO:0004865) |
| 0.1 | 1.6 | GO:0004198 | calcium-dependent cysteine-type endopeptidase activity(GO:0004198) |
| 0.1 | 2.2 | GO:0019843 | rRNA binding(GO:0019843) |
| 0.1 | 1.0 | GO:0004298 | threonine-type endopeptidase activity(GO:0004298) threonine-type peptidase activity(GO:0070003) |
| 0.0 | 0.4 | GO:0008494 | translation activator activity(GO:0008494) |
| 0.0 | 2.2 | GO:0003697 | single-stranded DNA binding(GO:0003697) |
| 0.0 | 0.2 | GO:0030504 | inorganic diphosphate transmembrane transporter activity(GO:0030504) |
| 0.0 | 0.7 | GO:0008139 | nuclear localization sequence binding(GO:0008139) |
| 0.0 | 0.4 | GO:0070139 | ubiquitin-like protein-specific endopeptidase activity(GO:0070137) SUMO-specific endopeptidase activity(GO:0070139) |
| 0.0 | 0.5 | GO:0004931 | extracellular ATP-gated cation channel activity(GO:0004931) ATP-gated ion channel activity(GO:0035381) |
| 0.0 | 0.2 | GO:0016715 | oxidoreductase activity, acting on paired donors, with incorporation or reduction of molecular oxygen, reduced ascorbate as one donor, and incorporation of one atom of oxygen(GO:0016715) |
| 0.0 | 2.1 | GO:0042826 | histone deacetylase binding(GO:0042826) |
| 0.0 | 0.2 | GO:0070330 | aromatase activity(GO:0070330) |
| 0.0 | 0.5 | GO:0004157 | dihydropyrimidinase activity(GO:0004157) |
| 0.0 | 0.3 | GO:0042834 | peptidoglycan binding(GO:0042834) |
| 0.0 | 3.2 | GO:0008375 | acetylglucosaminyltransferase activity(GO:0008375) |
| 0.0 | 0.6 | GO:0008175 | tRNA methyltransferase activity(GO:0008175) |
| 0.0 | 0.3 | GO:0004517 | nitric-oxide synthase activity(GO:0004517) |
| 0.0 | 1.5 | GO:0019956 | chemokine binding(GO:0019956) C-C chemokine binding(GO:0019957) |
| 0.0 | 0.3 | GO:0016813 | hydrolase activity, acting on carbon-nitrogen (but not peptide) bonds, in linear amidines(GO:0016813) |
| 0.0 | 0.7 | GO:0019531 | oxalate transmembrane transporter activity(GO:0019531) |
| 0.0 | 0.5 | GO:0004521 | endoribonuclease activity(GO:0004521) |
| 0.0 | 0.2 | GO:0004719 | protein-L-isoaspartate (D-aspartate) O-methyltransferase activity(GO:0004719) |
| 0.0 | 6.0 | GO:0001228 | transcriptional activator activity, RNA polymerase II transcription regulatory region sequence-specific binding(GO:0001228) |
| 0.0 | 0.7 | GO:0097602 | cullin family protein binding(GO:0097602) |
| 0.0 | 8.0 | GO:0004252 | serine-type endopeptidase activity(GO:0004252) |
| 0.0 | 0.5 | GO:0043022 | ribosome binding(GO:0043022) |
| 0.0 | 3.3 | GO:0003713 | transcription coactivator activity(GO:0003713) |
| 0.0 | 0.4 | GO:0004596 | peptide alpha-N-acetyltransferase activity(GO:0004596) |
| 0.0 | 0.3 | GO:0072518 | Rho-dependent protein serine/threonine kinase activity(GO:0072518) |
| 0.0 | 1.8 | GO:0016278 | lysine N-methyltransferase activity(GO:0016278) protein-lysine N-methyltransferase activity(GO:0016279) |
| 0.0 | 0.1 | GO:0047035 | testosterone dehydrogenase (NAD+) activity(GO:0047035) |
| 0.0 | 0.6 | GO:0008242 | omega peptidase activity(GO:0008242) |
| 0.0 | 0.1 | GO:0003857 | 3-hydroxyacyl-CoA dehydrogenase activity(GO:0003857) |
| 0.0 | 2.2 | GO:0004722 | protein serine/threonine phosphatase activity(GO:0004722) |
| 0.0 | 0.9 | GO:0000175 | 3'-5'-exoribonuclease activity(GO:0000175) exoribonuclease activity(GO:0004532) exoribonuclease activity, producing 5'-phosphomonoesters(GO:0016896) |
| 0.0 | 0.4 | GO:0043027 | cysteine-type endopeptidase inhibitor activity involved in apoptotic process(GO:0043027) cysteine-type endopeptidase regulator activity involved in apoptotic process(GO:0043028) |
| 0.0 | 0.8 | GO:0015035 | protein disulfide oxidoreductase activity(GO:0015035) |
| 0.0 | 1.1 | GO:0005109 | frizzled binding(GO:0005109) |
| 0.0 | 1.2 | GO:0003746 | translation elongation factor activity(GO:0003746) |
| 0.0 | 1.2 | GO:0048020 | CCR chemokine receptor binding(GO:0048020) |
| 0.0 | 4.2 | GO:0003735 | structural constituent of ribosome(GO:0003735) |
| 0.0 | 1.9 | GO:0031625 | ubiquitin protein ligase binding(GO:0031625) |
| 0.0 | 0.3 | GO:0008199 | ferric iron binding(GO:0008199) |
| 0.0 | 0.8 | GO:0031683 | G-protein beta/gamma-subunit complex binding(GO:0031683) |
| 0.0 | 0.3 | GO:0046933 | proton-transporting ATP synthase activity, rotational mechanism(GO:0046933) |
| 0.0 | 0.1 | GO:0016886 | ligase activity, forming phosphoric ester bonds(GO:0016886) |
| 0.0 | 8.5 | GO:0003924 | GTPase activity(GO:0003924) |
| 0.0 | 0.2 | GO:0001968 | fibronectin binding(GO:0001968) |
| 0.0 | 1.2 | GO:0016765 | transferase activity, transferring alkyl or aryl (other than methyl) groups(GO:0016765) |
| 0.0 | 0.3 | GO:0070915 | lysophosphatidic acid receptor activity(GO:0070915) |
| 0.0 | 0.4 | GO:0009922 | fatty acid elongase activity(GO:0009922) 3-oxo-arachidoyl-CoA synthase activity(GO:0102336) 3-oxo-cerotoyl-CoA synthase activity(GO:0102337) 3-oxo-lignoceronyl-CoA synthase activity(GO:0102338) |
| 0.0 | 1.0 | GO:0031072 | heat shock protein binding(GO:0031072) |
| 0.0 | 0.2 | GO:0030368 | interleukin-17 receptor activity(GO:0030368) |
| 0.0 | 0.1 | GO:0004619 | bisphosphoglycerate mutase activity(GO:0004082) phosphoglycerate mutase activity(GO:0004619) |
| 0.0 | 0.6 | GO:0003755 | peptidyl-prolyl cis-trans isomerase activity(GO:0003755) |
| 0.0 | 0.4 | GO:0003785 | actin monomer binding(GO:0003785) |
| 0.0 | 0.7 | GO:0051539 | 4 iron, 4 sulfur cluster binding(GO:0051539) |
| 0.0 | 0.6 | GO:0043130 | ubiquitin binding(GO:0043130) |
| 0.0 | 0.7 | GO:0003725 | double-stranded RNA binding(GO:0003725) |
| 0.0 | 0.6 | GO:0098631 | protein binding involved in cell adhesion(GO:0098631) protein binding involved in cell-cell adhesion(GO:0098632) |
| 0.0 | 14.3 | GO:0003723 | RNA binding(GO:0003723) |
| 0.0 | 1.1 | GO:0051082 | unfolded protein binding(GO:0051082) |
| 0.0 | 0.4 | GO:0097472 | cyclin-dependent protein serine/threonine kinase activity(GO:0004693) cyclin-dependent protein kinase activity(GO:0097472) |
| 0.0 | 0.4 | GO:0004089 | carbonate dehydratase activity(GO:0004089) |
| 0.0 | 0.5 | GO:0022833 | mechanically-gated ion channel activity(GO:0008381) mechanically gated channel activity(GO:0022833) |
| 0.0 | 0.3 | GO:0022848 | acetylcholine-gated cation channel activity(GO:0022848) |
| 0.0 | 0.5 | GO:0015459 | potassium channel regulator activity(GO:0015459) |
| 0.0 | 0.2 | GO:0016500 | protein-hormone receptor activity(GO:0016500) |
| 0.0 | 0.3 | GO:0005164 | tumor necrosis factor receptor binding(GO:0005164) |
| 0.0 | 0.5 | GO:0061631 | ubiquitin conjugating enzyme activity(GO:0061631) |
| 0.0 | 0.2 | GO:0000828 | inositol hexakisphosphate kinase activity(GO:0000828) |
| 0.0 | 0.8 | GO:0030215 | semaphorin receptor binding(GO:0030215) |
| 0.0 | 0.2 | GO:0016799 | hydrolase activity, hydrolyzing N-glycosyl compounds(GO:0016799) |
| 0.0 | 0.2 | GO:0042813 | Wnt-activated receptor activity(GO:0042813) |
| 0.0 | 0.0 | GO:0001607 | neuromedin U receptor activity(GO:0001607) |
Gene overrepresentation in curated gene sets: canonical pathways category:
| Log-likelihood per target | Total log-likelihood | Term | Description |
|---|---|---|---|
| 0.3 | 9.2 | PID BARD1 PATHWAY | BARD1 signaling events |
| 0.3 | 3.3 | SA REG CASCADE OF CYCLIN EXPR | Expression of cyclins regulates progression through the cell cycle by activating cyclin-dependent kinases. |
| 0.3 | 7.0 | PID PRL SIGNALING EVENTS PATHWAY | Signaling events mediated by PRL |
| 0.2 | 4.3 | PID AURORA A PATHWAY | Aurora A signaling |
| 0.1 | 1.3 | PID INTEGRIN A9B1 PATHWAY | Alpha9 beta1 integrin signaling events |
| 0.1 | 6.6 | PID MYC ACTIV PATHWAY | Validated targets of C-MYC transcriptional activation |
| 0.1 | 1.3 | PID HIF1A PATHWAY | Hypoxic and oxygen homeostasis regulation of HIF-1-alpha |
| 0.1 | 6.0 | PID P73PATHWAY | p73 transcription factor network |
| 0.1 | 1.7 | PID DNA PK PATHWAY | DNA-PK pathway in nonhomologous end joining |
| 0.1 | 2.9 | PID TELOMERASE PATHWAY | Regulation of Telomerase |
| 0.1 | 1.6 | PID FOXM1 PATHWAY | FOXM1 transcription factor network |
| 0.1 | 1.0 | PID TCPTP PATHWAY | Signaling events mediated by TCPTP |
| 0.1 | 1.2 | PID RAC1 PATHWAY | RAC1 signaling pathway |
| 0.1 | 1.2 | PID PI3KCI AKT PATHWAY | Class I PI3K signaling events mediated by Akt |
| 0.1 | 1.7 | PID P53 REGULATION PATHWAY | p53 pathway |
| 0.0 | 0.3 | PID RANBP2 PATHWAY | Sumoylation by RanBP2 regulates transcriptional repression |
| 0.0 | 0.9 | PID CERAMIDE PATHWAY | Ceramide signaling pathway |
| 0.0 | 1.3 | ST GA13 PATHWAY | G alpha 13 Pathway |
| 0.0 | 0.7 | PID INTEGRIN2 PATHWAY | Beta2 integrin cell surface interactions |
| 0.0 | 0.6 | PID FRA PATHWAY | Validated transcriptional targets of AP1 family members Fra1 and Fra2 |
| 0.0 | 0.4 | SA CASPASE CASCADE | Apoptosis is mediated by caspases, cysteine proteases arranged in a proteolytic cascade. |
| 0.0 | 1.4 | PID E2F PATHWAY | E2F transcription factor network |
| 0.0 | 0.7 | PID RXR VDR PATHWAY | RXR and RAR heterodimerization with other nuclear receptor |
| 0.0 | 0.7 | PID WNT SIGNALING PATHWAY | Wnt signaling network |
| 0.0 | 4.3 | NABA ECM GLYCOPROTEINS | Genes encoding structural ECM glycoproteins |
| 0.0 | 0.9 | PID LKB1 PATHWAY | LKB1 signaling events |
| 0.0 | 0.3 | PID FAS PATHWAY | FAS (CD95) signaling pathway |
| 0.0 | 0.8 | PID PLK1 PATHWAY | PLK1 signaling events |
| 0.0 | 0.8 | PID MTOR 4PATHWAY | mTOR signaling pathway |
| 0.0 | 1.0 | PID ERBB2 ERBB3 PATHWAY | ErbB2/ErbB3 signaling events |
| 0.0 | 3.8 | NABA SECRETED FACTORS | Genes encoding secreted soluble factors |
| 0.0 | 0.3 | PID LPA4 PATHWAY | LPA4-mediated signaling events |
| 0.0 | 1.1 | PID HDAC CLASSI PATHWAY | Signaling events mediated by HDAC Class I |
| 0.0 | 0.4 | PID CASPASE PATHWAY | Caspase cascade in apoptosis |
| 0.0 | 0.4 | PID FCER1 PATHWAY | Fc-epsilon receptor I signaling in mast cells |
| 0.0 | 0.6 | PID CDC42 PATHWAY | CDC42 signaling events |
| 0.0 | 0.6 | PID HNF3B PATHWAY | FOXA2 and FOXA3 transcription factor networks |
| 0.0 | 0.4 | PID AP1 PATHWAY | AP-1 transcription factor network |
| 0.0 | 0.6 | ST INTEGRIN SIGNALING PATHWAY | Integrin Signaling Pathway |
| 0.0 | 0.2 | PID KIT PATHWAY | Signaling events mediated by Stem cell factor receptor (c-Kit) |
| 0.0 | 0.3 | PID AJDISS 2PATHWAY | Posttranslational regulation of adherens junction stability and dissassembly |
| 0.0 | 0.5 | PID ERA GENOMIC PATHWAY | Validated nuclear estrogen receptor alpha network |
Gene overrepresentation in curated gene sets: REACTOME pathways category:
| Log-likelihood per target | Total log-likelihood | Term | Description |
|---|---|---|---|
| 0.7 | 4.5 | REACTOME INTEGRATION OF PROVIRUS | Genes involved in Integration of provirus |
| 0.4 | 6.1 | REACTOME METABOLISM OF POLYAMINES | Genes involved in Metabolism of polyamines |
| 0.4 | 5.1 | REACTOME UNWINDING OF DNA | Genes involved in Unwinding of DNA |
| 0.3 | 1.8 | REACTOME HS GAG BIOSYNTHESIS | Genes involved in HS-GAG biosynthesis |
| 0.3 | 2.7 | REACTOME ACTIVATION OF BH3 ONLY PROTEINS | Genes involved in Activation of BH3-only proteins |
| 0.2 | 7.1 | REACTOME ACTIVATION OF THE PRE REPLICATIVE COMPLEX | Genes involved in Activation of the pre-replicative complex |
| 0.2 | 3.2 | REACTOME PURINE RIBONUCLEOSIDE MONOPHOSPHATE BIOSYNTHESIS | Genes involved in Purine ribonucleoside monophosphate biosynthesis |
| 0.2 | 5.2 | REACTOME G0 AND EARLY G1 | Genes involved in G0 and Early G1 |
| 0.2 | 7.4 | REACTOME MRNA SPLICING MINOR PATHWAY | Genes involved in mRNA Splicing - Minor Pathway |
| 0.2 | 3.6 | REACTOME A TETRASACCHARIDE LINKER SEQUENCE IS REQUIRED FOR GAG SYNTHESIS | Genes involved in A tetrasaccharide linker sequence is required for GAG synthesis |
| 0.2 | 2.9 | REACTOME MRNA DECAY BY 5 TO 3 EXORIBONUCLEASE | Genes involved in mRNA Decay by 5' to 3' Exoribonuclease |
| 0.1 | 1.1 | REACTOME TRANSPORT OF MATURE MRNA DERIVED FROM AN INTRONLESS TRANSCRIPT | Genes involved in Transport of Mature mRNA Derived from an Intronless Transcript |
| 0.1 | 2.5 | REACTOME HOMOLOGOUS RECOMBINATION REPAIR OF REPLICATION INDEPENDENT DOUBLE STRAND BREAKS | Genes involved in Homologous recombination repair of replication-independent double-strand breaks |
| 0.1 | 1.2 | REACTOME MTORC1 MEDIATED SIGNALLING | Genes involved in mTORC1-mediated signalling |
| 0.1 | 1.0 | REACTOME PRESYNAPTIC NICOTINIC ACETYLCHOLINE RECEPTORS | Genes involved in Presynaptic nicotinic acetylcholine receptors |
| 0.1 | 1.1 | REACTOME RECRUITMENT OF NUMA TO MITOTIC CENTROSOMES | Genes involved in Recruitment of NuMA to mitotic centrosomes |
| 0.1 | 4.2 | REACTOME NEP NS2 INTERACTS WITH THE CELLULAR EXPORT MACHINERY | Genes involved in NEP/NS2 Interacts with the Cellular Export Machinery |
| 0.1 | 1.7 | REACTOME POST CHAPERONIN TUBULIN FOLDING PATHWAY | Genes involved in Post-chaperonin tubulin folding pathway |
| 0.1 | 0.4 | REACTOME REGULATION OF COMPLEMENT CASCADE | Genes involved in Regulation of Complement cascade |
| 0.1 | 0.9 | REACTOME REGULATION OF AMPK ACTIVITY VIA LKB1 | Genes involved in Regulation of AMPK activity via LKB1 |
| 0.1 | 1.0 | REACTOME BASE FREE SUGAR PHOSPHATE REMOVAL VIA THE SINGLE NUCLEOTIDE REPLACEMENT PATHWAY | Genes involved in Base-free sugar-phosphate removal via the single-nucleotide replacement pathway |
| 0.1 | 0.9 | REACTOME HEPARAN SULFATE HEPARIN HS GAG METABOLISM | Genes involved in Heparan sulfate/heparin (HS-GAG) metabolism |
| 0.1 | 1.3 | REACTOME OXYGEN DEPENDENT PROLINE HYDROXYLATION OF HYPOXIA INDUCIBLE FACTOR ALPHA | Genes involved in Oxygen-dependent Proline Hydroxylation of Hypoxia-inducible Factor Alpha |
| 0.1 | 0.4 | REACTOME THE NLRP3 INFLAMMASOME | Genes involved in The NLRP3 inflammasome |
| 0.1 | 1.5 | REACTOME SYNTHESIS OF SUBSTRATES IN N GLYCAN BIOSYTHESIS | Genes involved in Synthesis of substrates in N-glycan biosythesis |
| 0.1 | 1.1 | REACTOME NONSENSE MEDIATED DECAY ENHANCED BY THE EXON JUNCTION COMPLEX | Genes involved in Nonsense Mediated Decay Enhanced by the Exon Junction Complex |
| 0.1 | 1.5 | REACTOME DEPOSITION OF NEW CENPA CONTAINING NUCLEOSOMES AT THE CENTROMERE | Genes involved in Deposition of New CENPA-containing Nucleosomes at the Centromere |
| 0.1 | 1.3 | REACTOME RIP MEDIATED NFKB ACTIVATION VIA DAI | Genes involved in RIP-mediated NFkB activation via DAI |
| 0.1 | 3.2 | REACTOME MITOCHONDRIAL PROTEIN IMPORT | Genes involved in Mitochondrial Protein Import |
| 0.1 | 2.1 | REACTOME RNA POL II TRANSCRIPTION PRE INITIATION AND PROMOTER OPENING | Genes involved in RNA Polymerase II Transcription Pre-Initiation And Promoter Opening |
| 0.1 | 0.8 | REACTOME ABCA TRANSPORTERS IN LIPID HOMEOSTASIS | Genes involved in ABCA transporters in lipid homeostasis |
| 0.1 | 1.2 | REACTOME SYNTHESIS AND INTERCONVERSION OF NUCLEOTIDE DI AND TRIPHOSPHATES | Genes involved in Synthesis and interconversion of nucleotide di- and triphosphates |
| 0.1 | 0.4 | REACTOME INTRINSIC PATHWAY FOR APOPTOSIS | Genes involved in Intrinsic Pathway for Apoptosis |
| 0.1 | 3.1 | REACTOME MITOTIC PROMETAPHASE | Genes involved in Mitotic Prometaphase |
| 0.1 | 0.7 | REACTOME FORMATION OF TUBULIN FOLDING INTERMEDIATES BY CCT TRIC | Genes involved in Formation of tubulin folding intermediates by CCT/TriC |
| 0.1 | 0.4 | REACTOME CD28 DEPENDENT VAV1 PATHWAY | Genes involved in CD28 dependent Vav1 pathway |
| 0.1 | 0.6 | REACTOME RETROGRADE NEUROTROPHIN SIGNALLING | Genes involved in Retrograde neurotrophin signalling |
| 0.1 | 1.0 | REACTOME RNA POL III TRANSCRIPTION INITIATION FROM TYPE 3 PROMOTER | Genes involved in RNA Polymerase III Transcription Initiation From Type 3 Promoter |
| 0.1 | 0.4 | REACTOME CHYLOMICRON MEDIATED LIPID TRANSPORT | Genes involved in Chylomicron-mediated lipid transport |
| 0.0 | 1.0 | REACTOME EXTENSION OF TELOMERES | Genes involved in Extension of Telomeres |
| 0.0 | 1.1 | REACTOME COMPLEMENT CASCADE | Genes involved in Complement cascade |
| 0.0 | 0.7 | REACTOME METABOLISM OF PORPHYRINS | Genes involved in Metabolism of porphyrins |
| 0.0 | 0.4 | REACTOME CASPASE MEDIATED CLEAVAGE OF CYTOSKELETAL PROTEINS | Genes involved in Caspase-mediated cleavage of cytoskeletal proteins |
| 0.0 | 1.5 | REACTOME PRE NOTCH EXPRESSION AND PROCESSING | Genes involved in Pre-NOTCH Expression and Processing |
| 0.0 | 1.4 | REACTOME GLYCOSPHINGOLIPID METABOLISM | Genes involved in Glycosphingolipid metabolism |
| 0.0 | 0.7 | REACTOME IRON UPTAKE AND TRANSPORT | Genes involved in Iron uptake and transport |
| 0.0 | 0.6 | REACTOME GLYCOLYSIS | Genes involved in Glycolysis |
| 0.0 | 1.5 | REACTOME LOSS OF NLP FROM MITOTIC CENTROSOMES | Genes involved in Loss of Nlp from mitotic centrosomes |
| 0.0 | 1.4 | REACTOME ACTIVATION OF CHAPERONE GENES BY XBP1S | Genes involved in Activation of Chaperone Genes by XBP1(S) |
| 0.0 | 0.5 | REACTOME DOWNREGULATION OF TGF BETA RECEPTOR SIGNALING | Genes involved in Downregulation of TGF-beta receptor signaling |
| 0.0 | 0.3 | REACTOME PURINE SALVAGE | Genes involved in Purine salvage |
| 0.0 | 1.1 | REACTOME PYRUVATE METABOLISM AND CITRIC ACID TCA CYCLE | Genes involved in Pyruvate metabolism and Citric Acid (TCA) cycle |
| 0.0 | 0.2 | REACTOME GENERATION OF SECOND MESSENGER MOLECULES | Genes involved in Generation of second messenger molecules |
| 0.0 | 1.7 | REACTOME TRANSCRIPTIONAL REGULATION OF WHITE ADIPOCYTE DIFFERENTIATION | Genes involved in Transcriptional Regulation of White Adipocyte Differentiation |
| 0.0 | 0.2 | REACTOME ROLE OF DCC IN REGULATING APOPTOSIS | Genes involved in Role of DCC in regulating apoptosis |
| 0.0 | 0.6 | REACTOME CYTOSOLIC TRNA AMINOACYLATION | Genes involved in Cytosolic tRNA aminoacylation |
| 0.0 | 0.3 | REACTOME BIOSYNTHESIS OF THE N GLYCAN PRECURSOR DOLICHOL LIPID LINKED OLIGOSACCHARIDE LLO AND TRANSFER TO A NASCENT PROTEIN | Genes involved in Biosynthesis of the N-glycan precursor (dolichol lipid-linked oligosaccharide, LLO) and transfer to a nascent protein |
| 0.0 | 0.4 | REACTOME SYNTHESIS OF PIPS AT THE GOLGI MEMBRANE | Genes involved in Synthesis of PIPs at the Golgi membrane |
| 0.0 | 0.6 | REACTOME SIGNALING BY ROBO RECEPTOR | Genes involved in Signaling by Robo receptor |
| 0.0 | 0.2 | REACTOME INTRINSIC PATHWAY | Genes involved in Intrinsic Pathway |
| 0.0 | 0.1 | REACTOME PLATELET AGGREGATION PLUG FORMATION | Genes involved in Platelet Aggregation (Plug Formation) |
| 0.0 | 0.6 | REACTOME CELL SURFACE INTERACTIONS AT THE VASCULAR WALL | Genes involved in Cell surface interactions at the vascular wall |
| 0.0 | 0.1 | REACTOME MITOCHONDRIAL FATTY ACID BETA OXIDATION | Genes involved in Mitochondrial Fatty Acid Beta-Oxidation |
| 0.0 | 0.1 | REACTOME CLASS C 3 METABOTROPIC GLUTAMATE PHEROMONE RECEPTORS | Genes involved in Class C/3 (Metabotropic glutamate/pheromone receptors) |
| 0.0 | 0.1 | REACTOME KERATAN SULFATE DEGRADATION | Genes involved in Keratan sulfate degradation |
| 0.0 | 0.5 | REACTOME GOLGI ASSOCIATED VESICLE BIOGENESIS | Genes involved in Golgi Associated Vesicle Biogenesis |
| 0.0 | 0.7 | REACTOME TRANSPORT OF INORGANIC CATIONS ANIONS AND AMINO ACIDS OLIGOPEPTIDES | Genes involved in Transport of inorganic cations/anions and amino acids/oligopeptides |