Project
PRJEB1986: zebrafish developmental stages transcriptome
Navigation
Downloads
Results for pax8
Z-value: 0.50
Motif logo

Transcription factors associated with pax8
| Gene Symbol | Gene ID | Gene Info |
|---|---|---|
|
pax8
|
ENSDARG00000015879 | paired box 8 |
Activity-expression correlation:
| Gene | Promoter | Pearson corr. coef. | P-value | Plot |
|---|---|---|---|---|
| pax8 | dr11_v1_chr5_-_72415578_72415578 | 0.39 | 9.6e-02 | Click! |
Activity profile of pax8 motif
Sorted Z-values of pax8 motif
| Promoter | Log-likelihood | Transcript | Gene | Gene Info |
|---|---|---|---|---|
| chr4_+_25630555 | 1.58 |
ENSDART00000133425
|
acot15
|
acyl-CoA thioesterase 15 |
| chr20_-_9436521 | 0.99 |
ENSDART00000133000
|
zgc:101840
|
zgc:101840 |
| chr16_+_23487051 | 0.92 |
ENSDART00000145496
|
icn2
|
ictacalcin 2 |
| chr7_+_10610791 | 0.65 |
ENSDART00000166064
|
fah
|
fumarylacetoacetate hydrolase (fumarylacetoacetase) |
| chr25_-_7520937 | 0.64 |
ENSDART00000170050
|
cdkn1cb
|
cyclin-dependent kinase inhibitor 1Cb |
| chr16_+_49601838 | 0.57 |
ENSDART00000168570
ENSDART00000159236 |
si:dkey-82o10.4
|
si:dkey-82o10.4 |
| chr10_+_36037977 | 0.48 |
ENSDART00000164678
|
katnal1
|
katanin p60 subunit A-like 1 |
| chr22_-_25033105 | 0.47 |
ENSDART00000124220
|
nptxrb
|
neuronal pentraxin receptor b |
| chr2_-_985417 | 0.47 |
ENSDART00000140540
|
si:ch211-241e1.3
|
si:ch211-241e1.3 |
| chr24_-_25442342 | 0.47 |
ENSDART00000177140
ENSDART00000138215 |
phex
|
phosphate regulating endopeptidase homolog, X-linked |
| chr16_+_43347966 | 0.45 |
ENSDART00000171308
|
zmp:0000000930
|
zmp:0000000930 |
| chr20_+_10498986 | 0.42 |
ENSDART00000064114
|
zgc:100997
|
zgc:100997 |
| chr20_-_14680897 | 0.41 |
ENSDART00000063857
ENSDART00000161314 |
scrn2
|
secernin 2 |
| chr9_+_17348745 | 0.39 |
ENSDART00000147488
|
slain1a
|
SLAIN motif family, member 1a |
| chr22_-_16412496 | 0.39 |
ENSDART00000137497
|
cts12
|
cathepsin 12 |
| chr9_+_39027123 | 0.37 |
ENSDART00000004742
|
cps1
|
carbamoyl-phosphate synthase 1, mitochondrial |
| chr9_+_39027312 | 0.36 |
ENSDART00000192258
ENSDART00000164407 |
cps1
|
carbamoyl-phosphate synthase 1, mitochondrial |
| chr15_+_16387088 | 0.36 |
ENSDART00000101789
|
flot2b
|
flotillin 2b |
| chr15_+_638457 | 0.34 |
ENSDART00000157162
|
znf1013
|
zinc finger protein 1013 |
| chr20_+_10498704 | 0.33 |
ENSDART00000192985
|
zgc:100997
|
zgc:100997 |
| chr25_+_18475032 | 0.33 |
ENSDART00000073564
|
tes
|
testis derived transcript (3 LIM domains) |
| chr22_+_18929412 | 0.33 |
ENSDART00000161598
ENSDART00000166650 ENSDART00000015951 ENSDART00000105392 ENSDART00000131131 |
bsg
|
basigin |
| chr3_+_46444625 | 0.31 |
ENSDART00000108686
|
si:ch211-66e2.3
|
si:ch211-66e2.3 |
| chr9_-_25425381 | 0.31 |
ENSDART00000129522
|
acvr2aa
|
activin A receptor type 2Aa |
| chr9_+_43797902 | 0.30 |
ENSDART00000020550
|
ube2e3
|
ubiquitin-conjugating enzyme E2E 3 (UBC4/5 homolog, yeast) |
| chr7_+_20019125 | 0.30 |
ENSDART00000186391
|
bcl6b
|
B-cell CLL/lymphoma 6, member B |
| chr3_+_46444999 | 0.27 |
ENSDART00000186530
|
si:ch211-66e2.3
|
si:ch211-66e2.3 |
| chr7_-_8981507 | 0.26 |
ENSDART00000161422
|
si:ch211-183d5.2
|
si:ch211-183d5.2 |
| chr10_-_40352250 | 0.25 |
ENSDART00000150821
|
taar20f
|
trace amine associated receptor 20f |
| chr15_-_33734105 | 0.25 |
ENSDART00000172729
ENSDART00000172045 |
trmt9b
|
tRNA methyltransferase 9B |
| chr3_-_16110351 | 0.24 |
ENSDART00000064838
|
lasp1
|
LIM and SH3 protein 1 |
| chr24_+_31334209 | 0.22 |
ENSDART00000168837
ENSDART00000172473 |
fam168b
|
family with sequence similarity 168, member B |
| chr18_-_19004247 | 0.22 |
ENSDART00000135800
|
ints14
|
integrator complex subunit 14 |
| chr1_+_51721851 | 0.22 |
ENSDART00000040397
|
prdx2
|
peroxiredoxin 2 |
| chr23_+_26733232 | 0.22 |
ENSDART00000035080
|
zgc:158263
|
zgc:158263 |
| chr9_-_21825913 | 0.21 |
ENSDART00000101986
|
mrpl30
|
mitochondrial ribosomal protein L30 |
| chr23_+_43255328 | 0.20 |
ENSDART00000102712
|
tgm2a
|
transglutaminase 2, C polypeptide A |
| chr20_+_15164482 | 0.20 |
ENSDART00000181842
ENSDART00000063877 |
prdx6
|
peroxiredoxin 6 |
| chr23_-_24699400 | 0.20 |
ENSDART00000104031
|
sdf4
|
stromal cell derived factor 4 |
| chr23_+_32039386 | 0.19 |
ENSDART00000133801
|
mylk2
|
myosin light chain kinase 2 |
| chr3_-_16110100 | 0.19 |
ENSDART00000051807
|
lasp1
|
LIM and SH3 protein 1 |
| chr7_-_73843720 | 0.19 |
ENSDART00000111622
|
caap1
|
caspase activity and apoptosis inhibitor 1 |
| chr16_-_34195002 | 0.17 |
ENSDART00000054026
|
rcc1
|
regulator of chromosome condensation 1 |
| chr9_+_35014728 | 0.17 |
ENSDART00000100700
|
gabpa
|
GA binding protein transcription factor, alpha subunit |
| chr24_-_21973163 | 0.17 |
ENSDART00000131406
|
acot9.1
|
acyl-CoA thioesterase 9, tandem duplicate 1 |
| chr6_+_25215944 | 0.17 |
ENSDART00000165456
|
si:ch73-97h19.2
|
si:ch73-97h19.2 |
| chr5_+_68826514 | 0.16 |
ENSDART00000061406
|
usp39
|
ubiquitin specific peptidase 39 |
| chr4_-_17803784 | 0.16 |
ENSDART00000187195
|
spi2
|
Spi-2 proto-oncogene |
| chr20_+_35445462 | 0.16 |
ENSDART00000124497
|
tdrd6
|
tudor domain containing 6 |
| chr22_-_16154771 | 0.15 |
ENSDART00000009464
|
slc30a7
|
solute carrier family 30 (zinc transporter), member 7 |
| chr7_-_29356084 | 0.15 |
ENSDART00000075757
|
gtf2a2
|
general transcription factor IIA, 2 |
| chr11_-_165288 | 0.15 |
ENSDART00000108703
ENSDART00000173151 |
tegt
|
testis enhanced gene transcript (BAX inhibitor 1) |
| chr16_+_41135018 | 0.14 |
ENSDART00000139435
|
si:ch211-53m15.2
|
si:ch211-53m15.2 |
| chr10_+_24660225 | 0.14 |
ENSDART00000190695
|
vps36
|
vacuolar protein sorting 36 homolog (S. cerevisiae) |
| chr5_-_35888499 | 0.14 |
ENSDART00000193932
|
rxfp2l
|
relaxin/insulin-like family peptide receptor 2, like |
| chr5_+_4298636 | 0.14 |
ENSDART00000100061
|
prdx4
|
peroxiredoxin 4 |
| chr1_+_55239710 | 0.14 |
ENSDART00000174846
|
si:ch211-286b5.2
|
si:ch211-286b5.2 |
| chr6_-_436658 | 0.13 |
ENSDART00000191515
|
grap2b
|
GRB2-related adaptor protein 2b |
| chr24_-_36727922 | 0.12 |
ENSDART00000135142
|
si:ch73-334d15.1
|
si:ch73-334d15.1 |
| chr24_-_21973365 | 0.12 |
ENSDART00000081204
ENSDART00000030592 |
acot9.1
|
acyl-CoA thioesterase 9, tandem duplicate 1 |
| chr10_+_40598791 | 0.11 |
ENSDART00000131895
|
taar17a
|
trace amine associated receptor 17a |
| chr22_-_31752937 | 0.11 |
ENSDART00000169611
|
CABZ01028298.1
|
|
| chr10_+_24660017 | 0.10 |
ENSDART00000079597
|
vps36
|
vacuolar protein sorting 36 homolog (S. cerevisiae) |
| chr20_+_32224405 | 0.10 |
ENSDART00000062993
ENSDART00000147448 |
sesn1
|
sestrin 1 |
| chr25_+_10834903 | 0.10 |
ENSDART00000155247
|
si:ch211-147g22.5
|
si:ch211-147g22.5 |
| chr7_+_19374683 | 0.10 |
ENSDART00000162700
|
snrpf
|
small nuclear ribonucleoprotein polypeptide F |
| chr7_+_3444473 | 0.09 |
ENSDART00000122334
|
si:ch211-285c6.2
|
si:ch211-285c6.2 |
| chr23_+_44049509 | 0.09 |
ENSDART00000102003
|
txk
|
TXK tyrosine kinase |
| chr10_+_29770120 | 0.09 |
ENSDART00000100032
ENSDART00000193205 |
hyou1
|
hypoxia up-regulated 1 |
| chr22_+_4447387 | 0.09 |
ENSDART00000189742
ENSDART00000166768 |
timm44
|
translocase of inner mitochondrial membrane 44 homolog (yeast) |
| chr6_-_10927766 | 0.09 |
ENSDART00000134327
|
ccr7
|
chemokine (C-C motif) receptor 7 |
| chr1_+_9966384 | 0.08 |
ENSDART00000132607
|
si:dkeyp-75b4.8
|
si:dkeyp-75b4.8 |
| chr16_-_11986321 | 0.08 |
ENSDART00000148666
ENSDART00000029121 |
usp5
|
ubiquitin specific peptidase 5 (isopeptidase T) |
| chr6_-_130849 | 0.07 |
ENSDART00000108710
|
LRRC8E
|
si:zfos-323e3.4 |
| chr5_+_23630384 | 0.07 |
ENSDART00000013745
|
cx39.9
|
connexin 39.9 |
| chr14_+_48062180 | 0.07 |
ENSDART00000056713
|
ppid
|
peptidylprolyl isomerase D |
| chr15_-_34892664 | 0.07 |
ENSDART00000153787
ENSDART00000099721 |
rnf183
|
ring finger protein 183 |
| chr17_-_33405301 | 0.06 |
ENSDART00000157089
|
BX323819.1
|
|
| chr16_-_43011470 | 0.06 |
ENSDART00000131898
ENSDART00000142003 ENSDART00000017966 |
nudt17
|
nudix (nucleoside diphosphate linked moiety X)-type motif 17 |
| chr5_-_37341044 | 0.06 |
ENSDART00000084675
|
wdr44
|
WD repeat domain 44 |
| chr20_+_36234335 | 0.06 |
ENSDART00000193484
ENSDART00000181664 |
cnih3
|
cornichon family AMPA receptor auxiliary protein 3 |
| chr22_+_2598998 | 0.05 |
ENSDART00000176665
|
CU570894.1
|
|
| chr4_-_30528239 | 0.05 |
ENSDART00000169290
|
znf1052
|
zinc finger protein 1052 |
| chr5_-_27438812 | 0.03 |
ENSDART00000078755
|
drd7
|
dopamine receptor D7 |
| chr4_-_39265279 | 0.02 |
ENSDART00000164912
|
si:ch73-236c18.2
|
si:ch73-236c18.2 |
| chr14_-_32491127 | 0.02 |
ENSDART00000186724
|
mcf2a
|
MCF.2 cell line derived transforming sequence a |
| chr19_+_46372115 | 0.02 |
ENSDART00000163935
|
med30
|
mediator complex subunit 30 |
| chr4_+_36489448 | 0.01 |
ENSDART00000143181
|
znf1149
|
zinc finger protein 1149 |
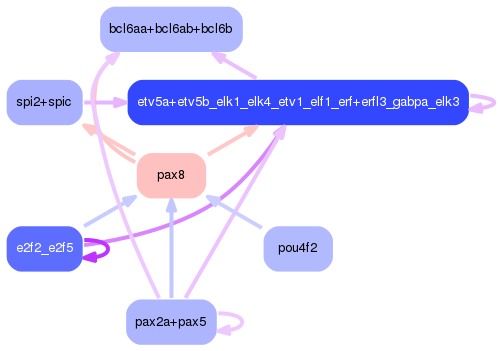
Network of associatons between targets according to the STRING database.

First level regulatory network of pax8
Gene Ontology Analysis
Gene overrepresentation in biological process category:
| Log-likelihood per target | Total log-likelihood | Term | Description |
|---|---|---|---|
| 0.1 | 0.7 | GO:0097272 | ammonia homeostasis(GO:0097272) |
| 0.1 | 0.6 | GO:0032979 | protein insertion into membrane from inner side(GO:0032978) protein insertion into mitochondrial membrane from inner side(GO:0032979) protein insertion into mitochondrial membrane(GO:0051204) |
| 0.1 | 0.4 | GO:0035994 | response to muscle stretch(GO:0035994) |
| 0.1 | 0.7 | GO:0006572 | tyrosine catabolic process(GO:0006572) |
| 0.1 | 0.6 | GO:1904030 | negative regulation of cyclin-dependent protein serine/threonine kinase activity(GO:0045736) negative regulation of cyclin-dependent protein kinase activity(GO:1904030) |
| 0.1 | 0.5 | GO:0051013 | microtubule severing(GO:0051013) |
| 0.0 | 0.2 | GO:0048855 | adenohypophysis morphogenesis(GO:0048855) |
| 0.0 | 0.3 | GO:0070979 | protein K11-linked ubiquitination(GO:0070979) |
| 0.0 | 0.2 | GO:0043328 | protein targeting to vacuole involved in ubiquitin-dependent protein catabolic process via the multivesicular body sorting pathway(GO:0043328) |
| 0.0 | 0.2 | GO:1901673 | regulation of mitotic spindle assembly(GO:1901673) |
| 0.0 | 0.2 | GO:0000305 | response to superoxide(GO:0000303) response to oxygen radical(GO:0000305) removal of superoxide radicals(GO:0019430) cellular response to oxygen radical(GO:0071450) cellular response to superoxide(GO:0071451) cellular oxidant detoxification(GO:0098869) cellular detoxification(GO:1990748) |
| 0.0 | 0.1 | GO:0019364 | pyridine nucleotide catabolic process(GO:0019364) NAD catabolic process(GO:0019677) pyridine-containing compound catabolic process(GO:0072526) |
| 0.0 | 0.4 | GO:0045661 | regulation of myoblast differentiation(GO:0045661) |
| 0.0 | 1.9 | GO:0006637 | acyl-CoA metabolic process(GO:0006637) thioester metabolic process(GO:0035383) |
| 0.0 | 0.1 | GO:0038083 | peptidyl-tyrosine autophosphorylation(GO:0038083) |
| 0.0 | 0.1 | GO:1901031 | response to leucine(GO:0043201) cellular response to leucine(GO:0071233) regulation of response to reactive oxygen species(GO:1901031) |
| 0.0 | 0.3 | GO:0045454 | cell redox homeostasis(GO:0045454) |
| 0.0 | 0.2 | GO:0030719 | P granule organization(GO:0030719) |
| 0.0 | 0.2 | GO:0043154 | negative regulation of cysteine-type endopeptidase activity involved in apoptotic process(GO:0043154) |
| 0.0 | 0.2 | GO:0051123 | RNA polymerase II transcriptional preinitiation complex assembly(GO:0051123) |
| 0.0 | 0.3 | GO:0070593 | dendrite self-avoidance(GO:0070593) |
| 0.0 | 0.2 | GO:0002098 | tRNA wobble uridine modification(GO:0002098) |
| 0.0 | 0.1 | GO:0007190 | activation of adenylate cyclase activity(GO:0007190) positive regulation of cAMP metabolic process(GO:0030816) positive regulation of cAMP biosynthetic process(GO:0030819) positive regulation of adenylate cyclase activity(GO:0045762) |
Gene overrepresentation in cellular component category:
| Log-likelihood per target | Total log-likelihood | Term | Description |
|---|---|---|---|
| 0.1 | 0.4 | GO:0016600 | flotillin complex(GO:0016600) |
| 0.1 | 0.2 | GO:0033391 | chromatoid body(GO:0033391) |
| 0.0 | 0.2 | GO:0000814 | ESCRT II complex(GO:0000814) |
| 0.0 | 0.2 | GO:0005672 | transcription factor TFIIA complex(GO:0005672) |
| 0.0 | 0.1 | GO:0034663 | endoplasmic reticulum chaperone complex(GO:0034663) |
| 0.0 | 0.3 | GO:0048179 | activin receptor complex(GO:0048179) |
| 0.0 | 0.1 | GO:0061700 | GATOR2 complex(GO:0061700) |
| 0.0 | 0.2 | GO:0032039 | integrator complex(GO:0032039) |
Gene overrepresentation in molecular function category:
| Log-likelihood per target | Total log-likelihood | Term | Description |
|---|---|---|---|
| 0.2 | 0.7 | GO:0004087 | carbamoyl-phosphate synthase (ammonia) activity(GO:0004087) |
| 0.1 | 0.7 | GO:0016823 | hydrolase activity, acting on acid carbon-carbon bonds(GO:0016822) hydrolase activity, acting on acid carbon-carbon bonds, in ketonic substances(GO:0016823) |
| 0.1 | 0.4 | GO:0070004 | cysteine-type exopeptidase activity(GO:0070004) |
| 0.1 | 0.6 | GO:0004861 | cyclin-dependent protein serine/threonine kinase inhibitor activity(GO:0004861) |
| 0.1 | 0.2 | GO:0001729 | ceramide kinase activity(GO:0001729) |
| 0.1 | 0.6 | GO:0051920 | peroxiredoxin activity(GO:0051920) |
| 0.0 | 0.5 | GO:0008568 | microtubule-severing ATPase activity(GO:0008568) |
| 0.0 | 1.9 | GO:0016790 | thiolester hydrolase activity(GO:0016790) |
| 0.0 | 0.9 | GO:0048306 | calcium-dependent protein binding(GO:0048306) |
| 0.0 | 0.3 | GO:0017002 | activin-activated receptor activity(GO:0017002) |
| 0.0 | 0.4 | GO:0008307 | structural constituent of muscle(GO:0008307) |
| 0.0 | 0.2 | GO:0004687 | myosin light chain kinase activity(GO:0004687) |
| 0.0 | 0.1 | GO:0070728 | leucine binding(GO:0070728) |
| 0.0 | 0.1 | GO:0035529 | NADH pyrophosphatase activity(GO:0035529) |
| 0.0 | 0.6 | GO:0043022 | ribosome binding(GO:0043022) |
| 0.0 | 0.0 | GO:0001588 | dopamine neurotransmitter receptor activity, coupled via Gs(GO:0001588) |
| 0.0 | 0.2 | GO:0003810 | protein-glutamine gamma-glutamyltransferase activity(GO:0003810) |
Gene overrepresentation in curated gene sets: REACTOME pathways category:
| Log-likelihood per target | Total log-likelihood | Term | Description |
|---|---|---|---|
| 0.0 | 0.1 | REACTOME CHEMOKINE RECEPTORS BIND CHEMOKINES | Genes involved in Chemokine receptors bind chemokines |
| 0.0 | 0.3 | REACTOME PYRUVATE METABOLISM | Genes involved in Pyruvate metabolism |
| 0.0 | 0.2 | REACTOME ZINC TRANSPORTERS | Genes involved in Zinc transporters |