Project
PRJNA375882: Comprehensive Mouse Transcriptomic BodyMap
Navigation
Downloads
Results for Cebpa_Cebpg
Z-value: 1.94
Motif logo
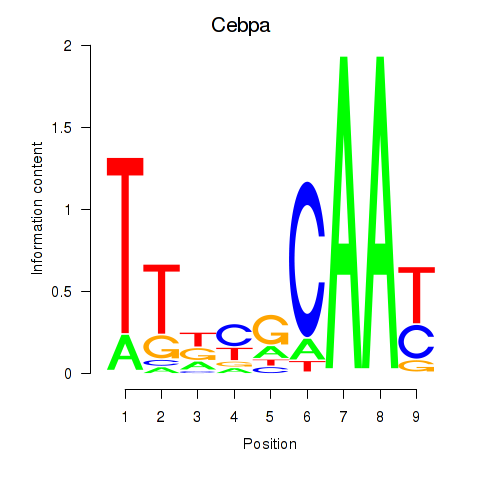
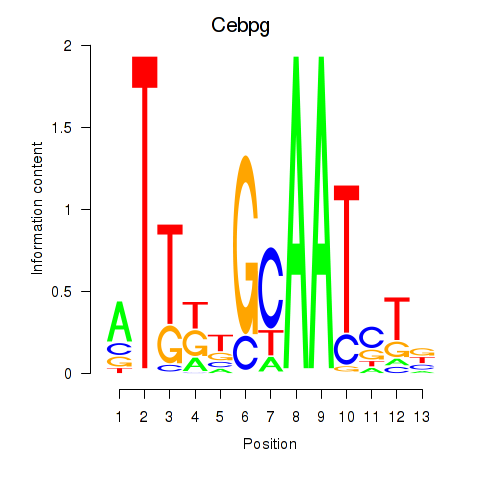
Transcription factors associated with Cebpa_Cebpg
| Gene Symbol | Gene ID | Gene Info |
|---|---|---|
|
Cebpa
|
ENSMUSG00000034957.11 | Cebpa |
|
Cebpg
|
ENSMUSG00000056216.10 | Cebpg |
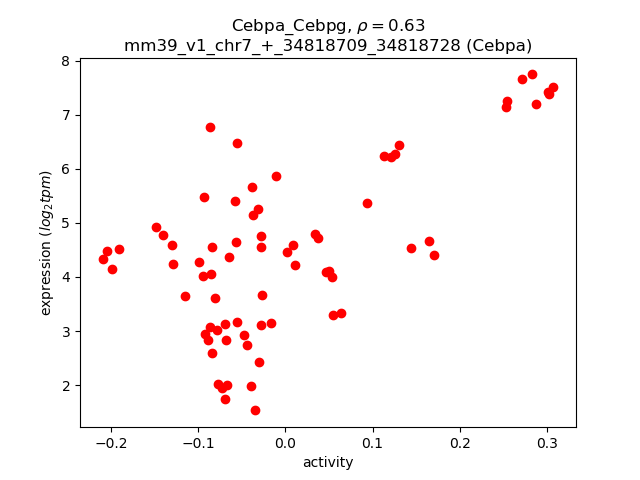
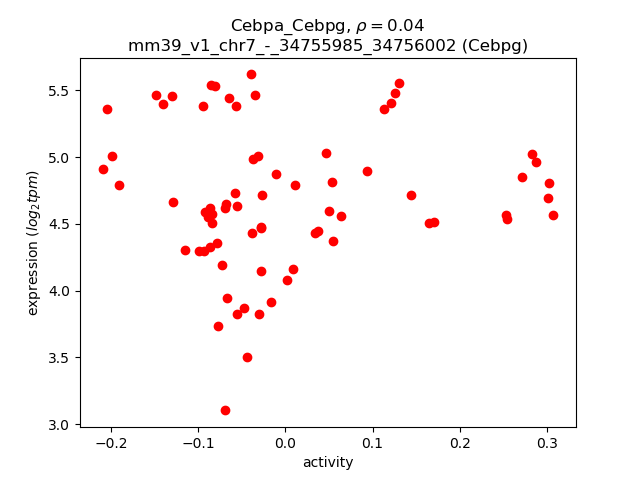
Activity-expression correlation:
| Gene | Promoter | Pearson corr. coef. | P-value | Plot |
|---|---|---|---|---|
| Cebpa | mm39_v1_chr7_+_34818709_34818728 | 0.63 | 2.2e-09 | Click! |
| Cebpg | mm39_v1_chr7_-_34755985_34756002 | 0.04 | 7.1e-01 | Click! |
Activity profile of Cebpa_Cebpg motif
Sorted Z-values of Cebpa_Cebpg motif
Network of associatons between targets according to the STRING database.

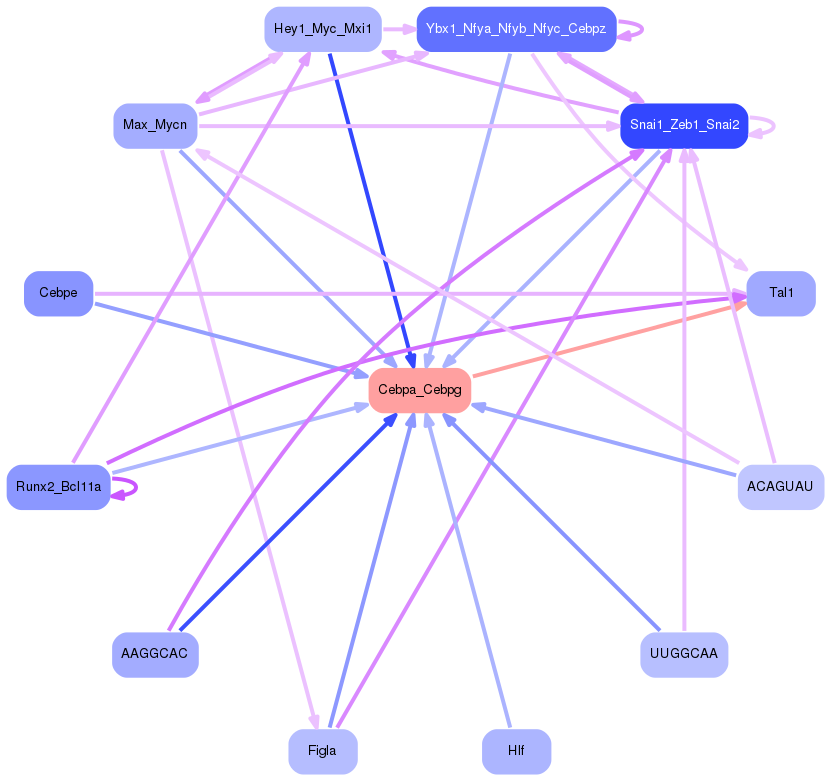
First level regulatory network of Cebpa_Cebpg
| Promoter | Score | Transcript | Gene | Gene Info |
|---|---|---|---|---|
| chr16_+_22710785 | 38.50 |
ENSMUST00000023583.7
ENSMUST00000232098.2 |
Ahsg
|
alpha-2-HS-glycoprotein |
| chr3_+_20011201 | 33.97 |
ENSMUST00000091309.12
ENSMUST00000108329.8 ENSMUST00000003714.13 |
Cp
|
ceruloplasmin |
| chr14_+_75479727 | 32.30 |
ENSMUST00000022576.10
|
Cpb2
|
carboxypeptidase B2 (plasma) |
| chr16_+_22877000 | 31.01 |
ENSMUST00000039492.14
ENSMUST00000023589.15 ENSMUST00000089902.8 |
Kng1
|
kininogen 1 |
| chr3_+_20011251 | 30.35 |
ENSMUST00000108328.8
|
Cp
|
ceruloplasmin |
| chr3_+_20011405 | 29.31 |
ENSMUST00000108325.9
|
Cp
|
ceruloplasmin |
| chr16_-_22847808 | 25.45 |
ENSMUST00000115349.9
|
Kng2
|
kininogen 2 |
| chr16_-_22847760 | 23.19 |
ENSMUST00000039338.13
|
Kng2
|
kininogen 2 |
| chr12_-_81014849 | 22.52 |
ENSMUST00000095572.5
|
Slc10a1
|
solute carrier family 10 (sodium/bile acid cotransporter family), member 1 |
| chr17_-_56428968 | 22.43 |
ENSMUST00000041357.9
|
Lrg1
|
leucine-rich alpha-2-glycoprotein 1 |
| chr16_-_22847829 | 20.99 |
ENSMUST00000100046.9
|
Kng2
|
kininogen 2 |
| chr12_-_81014755 | 19.44 |
ENSMUST00000218342.2
|
Slc10a1
|
solute carrier family 10 (sodium/bile acid cotransporter family), member 1 |
| chr10_+_23727325 | 19.28 |
ENSMUST00000020190.8
|
Vnn3
|
vanin 3 |
| chr7_+_46401214 | 17.01 |
ENSMUST00000210769.2
ENSMUST00000210272.2 ENSMUST00000075982.4 |
Saa2
|
serum amyloid A 2 |
| chr16_-_22848153 | 16.78 |
ENSMUST00000232459.2
|
Kng2
|
kininogen 2 |
| chr6_+_37507108 | 16.53 |
ENSMUST00000040987.11
|
Akr1d1
|
aldo-keto reductase family 1, member D1 |
| chr7_+_26534730 | 16.43 |
ENSMUST00000005685.15
|
Cyp2a5
|
cytochrome P450, family 2, subfamily a, polypeptide 5 |
| chr7_-_103463120 | 15.94 |
ENSMUST00000098192.4
|
Hbb-bt
|
hemoglobin, beta adult t chain |
| chr4_+_63262775 | 14.73 |
ENSMUST00000030044.3
|
Orm1
|
orosomucoid 1 |
| chr11_+_3981769 | 14.72 |
ENSMUST00000019512.8
|
Sec14l4
|
SEC14-like lipid binding 4 |
| chr7_+_13467422 | 13.46 |
ENSMUST00000086148.8
|
Sult2a2
|
sulfotransferase family 2A, dehydroepiandrosterone (DHEA)-preferring, member 2 |
| chr17_-_57535003 | 13.02 |
ENSMUST00000177046.2
ENSMUST00000024988.15 |
C3
|
complement component 3 |
| chr16_-_30086317 | 12.22 |
ENSMUST00000064856.9
|
Cpn2
|
carboxypeptidase N, polypeptide 2 |
| chr19_-_7779943 | 12.04 |
ENSMUST00000120522.8
|
Slc22a26
|
solute carrier family 22 (organic cation transporter), member 26 |
| chr10_+_21253190 | 11.75 |
ENSMUST00000042699.14
|
Aldh8a1
|
aldehyde dehydrogenase 8 family, member A1 |
| chr11_+_108286114 | 11.19 |
ENSMUST00000000049.6
|
Apoh
|
apolipoprotein H |
| chr19_-_38113696 | 11.15 |
ENSMUST00000025951.14
ENSMUST00000237287.2 |
Rbp4
|
retinol binding protein 4, plasma |
| chr6_+_141575226 | 11.14 |
ENSMUST00000042812.9
|
Slco1b2
|
solute carrier organic anion transporter family, member 1b2 |
| chr6_+_17463748 | 10.76 |
ENSMUST00000115443.8
|
Met
|
met proto-oncogene |
| chr9_+_21746785 | 10.73 |
ENSMUST00000058777.8
|
Angptl8
|
angiopoietin-like 8 |
| chr5_-_104125270 | 10.55 |
ENSMUST00000112803.3
|
Hsd17b13
|
hydroxysteroid (17-beta) dehydrogenase 13 |
| chr5_-_104125192 | 10.46 |
ENSMUST00000120320.8
|
Hsd17b13
|
hydroxysteroid (17-beta) dehydrogenase 13 |
| chr14_+_66208498 | 10.10 |
ENSMUST00000128539.8
|
Clu
|
clusterin |
| chr14_+_66208059 | 9.88 |
ENSMUST00000127387.8
|
Clu
|
clusterin |
| chr5_-_104125226 | 9.69 |
ENSMUST00000048118.15
|
Hsd17b13
|
hydroxysteroid (17-beta) dehydrogenase 13 |
| chrX_+_59044796 | 9.37 |
ENSMUST00000033477.5
|
F9
|
coagulation factor IX |
| chr7_+_27147403 | 9.32 |
ENSMUST00000037399.16
ENSMUST00000108358.8 |
Blvrb
|
biliverdin reductase B (flavin reductase (NADPH)) |
| chr6_-_141892686 | 9.12 |
ENSMUST00000042119.6
|
Slco1a1
|
solute carrier organic anion transporter family, member 1a1 |
| chr2_-_32277773 | 9.05 |
ENSMUST00000050785.14
|
Lcn2
|
lipocalin 2 |
| chr10_+_93324624 | 9.05 |
ENSMUST00000129421.8
|
Hal
|
histidine ammonia lyase |
| chr5_+_90708962 | 9.04 |
ENSMUST00000094615.8
ENSMUST00000200765.2 |
Albfm1
|
albumin superfamily member 1 |
| chr14_+_66208613 | 8.92 |
ENSMUST00000144619.2
|
Clu
|
clusterin |
| chr4_+_63280675 | 8.87 |
ENSMUST00000075341.4
|
Orm2
|
orosomucoid 2 |
| chr16_-_93726399 | 8.67 |
ENSMUST00000177648.8
ENSMUST00000142083.2 |
Cldn14
|
claudin 14 |
| chr7_+_127399776 | 8.17 |
ENSMUST00000046863.12
ENSMUST00000206674.2 ENSMUST00000106272.8 |
Hsd3b7
|
hydroxy-delta-5-steroid dehydrogenase, 3 beta- and steroid delta-isomerase 7 |
| chr6_-_141892517 | 8.16 |
ENSMUST00000168119.8
|
Slco1a1
|
solute carrier organic anion transporter family, member 1a1 |
| chr14_+_66208253 | 8.14 |
ENSMUST00000138191.8
|
Clu
|
clusterin |
| chr19_-_7780025 | 8.08 |
ENSMUST00000065634.8
|
Slc22a26
|
solute carrier family 22 (organic cation transporter), member 26 |
| chr2_-_32278245 | 7.55 |
ENSMUST00000192241.2
|
Lcn2
|
lipocalin 2 |
| chr7_-_46365108 | 7.49 |
ENSMUST00000006956.9
ENSMUST00000210913.2 |
Saa3
|
serum amyloid A 3 |
| chr7_+_13357892 | 7.42 |
ENSMUST00000108525.4
|
Sult2a5
|
sulfotransferase family 2A, dehydroepiandrosterone (DHEA)-preferring, member 5 |
| chr2_+_102536701 | 7.37 |
ENSMUST00000123759.8
ENSMUST00000005220.11 ENSMUST00000111212.8 |
Slc1a2
|
solute carrier family 1 (glial high affinity glutamate transporter), member 2 |
| chr6_-_124519240 | 7.31 |
ENSMUST00000159463.8
ENSMUST00000162844.2 ENSMUST00000160505.8 ENSMUST00000162443.8 |
C1s1
|
complement component 1, s subcomponent 1 |
| chr9_+_107957621 | 6.80 |
ENSMUST00000035211.14
|
Mst1
|
macrophage stimulating 1 (hepatocyte growth factor-like) |
| chr9_+_107957640 | 6.55 |
ENSMUST00000162886.2
|
Mst1
|
macrophage stimulating 1 (hepatocyte growth factor-like) |
| chr2_+_172994841 | 6.33 |
ENSMUST00000029017.6
|
Pck1
|
phosphoenolpyruvate carboxykinase 1, cytosolic |
| chr8_+_46924074 | 6.16 |
ENSMUST00000034046.13
ENSMUST00000211644.2 |
Acsl1
|
acyl-CoA synthetase long-chain family member 1 |
| chr6_-_3968365 | 6.07 |
ENSMUST00000031674.11
|
Tfpi2
|
tissue factor pathway inhibitor 2 |
| chr6_+_17463819 | 6.05 |
ENSMUST00000140070.8
|
Met
|
met proto-oncogene |
| chr14_+_44340111 | 5.96 |
ENSMUST00000074839.7
|
Ear2
|
eosinophil-associated, ribonuclease A family, member 2 |
| chr18_+_21077627 | 5.75 |
ENSMUST00000050004.3
|
Rnf125
|
ring finger protein 125 |
| chr6_+_129374441 | 5.75 |
ENSMUST00000112081.9
ENSMUST00000112079.3 |
Clec1b
|
C-type lectin domain family 1, member b |
| chr17_-_57501170 | 5.61 |
ENSMUST00000005976.8
|
Tnfsf14
|
tumor necrosis factor (ligand) superfamily, member 14 |
| chr11_-_43792013 | 5.60 |
ENSMUST00000067258.9
ENSMUST00000139906.2 |
Adra1b
|
adrenergic receptor, alpha 1b |
| chr7_-_45109262 | 5.60 |
ENSMUST00000094434.13
|
Ftl1
|
ferritin light polypeptide 1 |
| chr7_-_13571334 | 5.48 |
ENSMUST00000108522.5
|
Sult2a1
|
sulfotransferase family 2A, dehydroepiandrosterone (DHEA)-preferring, member 1 |
| chr7_-_126873219 | 5.37 |
ENSMUST00000082428.6
|
Sephs2
|
selenophosphate synthetase 2 |
| chr15_-_55770118 | 5.23 |
ENSMUST00000110200.3
|
Sntb1
|
syntrophin, basic 1 |
| chr15_+_31224460 | 5.22 |
ENSMUST00000044524.16
|
Dap
|
death-associated protein |
| chr14_-_44057096 | 4.64 |
ENSMUST00000100691.4
|
Ear1
|
eosinophil-associated, ribonuclease A family, member 1 |
| chr9_+_110248815 | 4.60 |
ENSMUST00000035061.9
|
Ngp
|
neutrophilic granule protein |
| chr13_+_47347301 | 4.54 |
ENSMUST00000110111.4
|
Rnf144b
|
ring finger protein 144B |
| chr7_-_45109075 | 4.50 |
ENSMUST00000210864.2
|
Ftl1
|
ferritin light polypeptide 1 |
| chr15_+_100202642 | 4.46 |
ENSMUST00000067752.5
ENSMUST00000229588.2 |
Mettl7a1
|
methyltransferase like 7A1 |
| chr2_-_129213050 | 4.27 |
ENSMUST00000028881.14
|
Il1b
|
interleukin 1 beta |
| chr2_-_32314017 | 4.22 |
ENSMUST00000113307.9
|
Slc25a25
|
solute carrier family 25 (mitochondrial carrier, phosphate carrier), member 25 |
| chr15_+_31224616 | 4.14 |
ENSMUST00000186547.7
|
Dap
|
death-associated protein |
| chr19_-_11618165 | 4.01 |
ENSMUST00000186023.7
|
Ms4a3
|
membrane-spanning 4-domains, subfamily A, member 3 |
| chr19_-_11618192 | 3.99 |
ENSMUST00000112984.4
|
Ms4a3
|
membrane-spanning 4-domains, subfamily A, member 3 |
| chr7_+_51530060 | 3.98 |
ENSMUST00000145049.2
|
Gas2
|
growth arrest specific 2 |
| chr15_+_31224555 | 3.91 |
ENSMUST00000186109.2
|
Dap
|
death-associated protein |
| chr7_+_27147475 | 3.90 |
ENSMUST00000133750.8
|
Blvrb
|
biliverdin reductase B (flavin reductase (NADPH)) |
| chr17_+_57665691 | 3.77 |
ENSMUST00000086763.13
ENSMUST00000233376.2 ENSMUST00000233840.2 ENSMUST00000232808.2 ENSMUST00000004850.8 |
Adgre1
|
adhesion G protein-coupled receptor E1 |
| chr19_-_34855278 | 3.74 |
ENSMUST00000112460.3
|
Pank1
|
pantothenate kinase 1 |
| chr15_-_76191301 | 3.71 |
ENSMUST00000171340.9
ENSMUST00000023222.13 ENSMUST00000164189.2 |
Oplah
|
5-oxoprolinase (ATP-hydrolysing) |
| chr15_+_31225302 | 3.70 |
ENSMUST00000186425.7
|
Dap
|
death-associated protein |
| chr1_+_130793406 | 3.61 |
ENSMUST00000038829.7
|
Fcmr
|
Fc fragment of IgM receptor |
| chr10_+_5543769 | 3.53 |
ENSMUST00000051809.10
|
Myct1
|
myc target 1 |
| chr7_-_120673761 | 3.52 |
ENSMUST00000047194.4
|
Igsf6
|
immunoglobulin superfamily, member 6 |
| chr1_+_74414354 | 3.46 |
ENSMUST00000187516.7
ENSMUST00000027368.6 |
Slc11a1
|
solute carrier family 11 (proton-coupled divalent metal ion transporters), member 1 |
| chr5_-_137856280 | 3.43 |
ENSMUST00000110978.7
ENSMUST00000199387.2 ENSMUST00000196195.2 |
Pilrb1
|
paired immunoglobin-like type 2 receptor beta 1 |
| chr1_+_134110142 | 3.31 |
ENSMUST00000082060.10
ENSMUST00000153856.8 ENSMUST00000133701.8 ENSMUST00000132873.8 |
Chil1
|
chitinase-like 1 |
| chr16_-_38253507 | 3.23 |
ENSMUST00000002926.8
|
Pla1a
|
phospholipase A1 member A |
| chr19_-_34855242 | 3.05 |
ENSMUST00000238065.2
|
Pank1
|
pantothenate kinase 1 |
| chr14_-_44112974 | 2.94 |
ENSMUST00000179200.2
|
Ear1
|
eosinophil-associated, ribonuclease A family, member 1 |
| chr14_+_52091156 | 2.92 |
ENSMUST00000169070.2
ENSMUST00000074477.7 |
Ear6
|
eosinophil-associated, ribonuclease A family, member 6 |
| chr2_-_45007407 | 2.87 |
ENSMUST00000176438.9
|
Zeb2
|
zinc finger E-box binding homeobox 2 |
| chr3_-_116762476 | 2.83 |
ENSMUST00000119557.8
|
Palmd
|
palmdelphin |
| chr1_-_39616445 | 2.66 |
ENSMUST00000062525.11
|
Rnf149
|
ring finger protein 149 |
| chr1_+_40554513 | 2.65 |
ENSMUST00000027237.12
|
Il18rap
|
interleukin 18 receptor accessory protein |
| chr4_+_114916703 | 2.62 |
ENSMUST00000162489.2
|
Tal1
|
T cell acute lymphocytic leukemia 1 |
| chr6_+_72281587 | 2.58 |
ENSMUST00000183018.8
ENSMUST00000182014.10 |
Sftpb
|
surfactant associated protein B |
| chr5_-_88823989 | 2.55 |
ENSMUST00000078945.12
|
Grsf1
|
G-rich RNA sequence binding factor 1 |
| chr7_-_15978077 | 2.53 |
ENSMUST00000238893.2
ENSMUST00000171425.4 |
C5ar2
|
complement component 5a receptor 2 |
| chr16_+_42727926 | 2.52 |
ENSMUST00000151244.8
ENSMUST00000114694.9 |
Zbtb20
|
zinc finger and BTB domain containing 20 |
| chr2_-_143853122 | 2.52 |
ENSMUST00000016072.12
ENSMUST00000037875.6 |
Rrbp1
|
ribosome binding protein 1 |
| chr13_+_51254852 | 2.43 |
ENSMUST00000095797.6
|
Spin1
|
spindlin 1 |
| chr9_+_7571397 | 2.38 |
ENSMUST00000120900.8
ENSMUST00000151853.8 ENSMUST00000152878.3 |
Mmp27
|
matrix metallopeptidase 27 |
| chr5_-_137869969 | 2.38 |
ENSMUST00000196162.5
|
Pilrb2
|
paired immunoglobin-like type 2 receptor beta 2 |
| chr1_-_39616369 | 2.29 |
ENSMUST00000195705.2
|
Rnf149
|
ring finger protein 149 |
| chr14_-_44161016 | 2.27 |
ENSMUST00000159175.2
|
Ear10
|
eosinophil-associated, ribonuclease A family, member 10 |
| chr5_-_18093739 | 2.20 |
ENSMUST00000169095.6
ENSMUST00000197574.2 |
Cd36
|
CD36 molecule |
| chr8_-_41507808 | 2.18 |
ENSMUST00000093534.11
|
Mtus1
|
mitochondrial tumor suppressor 1 |
| chr5_-_137870001 | 2.08 |
ENSMUST00000164886.2
|
Pilrb2
|
paired immunoglobin-like type 2 receptor beta 2 |
| chrX_+_108240356 | 1.92 |
ENSMUST00000139259.2
ENSMUST00000060013.4 |
Gm6377
|
predicted gene 6377 |
| chr15_-_103218876 | 1.85 |
ENSMUST00000079824.6
|
Gpr84
|
G protein-coupled receptor 84 |
| chr14_-_45715308 | 1.83 |
ENSMUST00000141424.2
|
Fermt2
|
fermitin family member 2 |
| chr8_-_96615138 | 1.83 |
ENSMUST00000034097.8
|
Got2
|
glutamatic-oxaloacetic transaminase 2, mitochondrial |
| chr12_+_98234884 | 1.82 |
ENSMUST00000075072.6
|
Gpr65
|
G-protein coupled receptor 65 |
| chr13_-_61084358 | 1.78 |
ENSMUST00000225859.2
ENSMUST00000225167.2 ENSMUST00000021880.10 |
Gm49391
Ctla2a
|
predicted gene, 49391 cytotoxic T lymphocyte-associated protein 2 alpha |
| chr14_+_31887739 | 1.74 |
ENSMUST00000111994.10
ENSMUST00000168114.8 ENSMUST00000168034.8 |
Ncoa4
|
nuclear receptor coactivator 4 |
| chr13_+_25127127 | 1.71 |
ENSMUST00000021773.13
|
Gpld1
|
glycosylphosphatidylinositol specific phospholipase D1 |
| chr11_+_40624466 | 1.70 |
ENSMUST00000020578.11
|
Nudcd2
|
NudC domain containing 2 |
| chr18_-_33346885 | 1.63 |
ENSMUST00000025236.9
|
Stard4
|
StAR-related lipid transfer (START) domain containing 4 |
| chr12_-_113542610 | 1.63 |
ENSMUST00000195468.6
ENSMUST00000103442.3 |
Ighv5-2
|
immunoglobulin heavy variable 5-2 |
| chr4_-_132459762 | 1.51 |
ENSMUST00000045550.5
|
Xkr8
|
X-linked Kx blood group related 8 |
| chr11_-_83540175 | 1.44 |
ENSMUST00000001008.6
|
Ccl3
|
chemokine (C-C motif) ligand 3 |
| chr3_-_107893676 | 1.42 |
ENSMUST00000066530.7
ENSMUST00000012348.9 |
Gstm2
|
glutathione S-transferase, mu 2 |
| chr15_+_102379621 | 1.38 |
ENSMUST00000229918.2
|
Pcbp2
|
poly(rC) binding protein 2 |
| chr17_+_37253802 | 1.38 |
ENSMUST00000040498.12
|
Rnf39
|
ring finger protein 39 |
| chr11_+_40624763 | 1.34 |
ENSMUST00000127382.2
|
Nudcd2
|
NudC domain containing 2 |
| chr11_-_106811185 | 1.33 |
ENSMUST00000167787.2
ENSMUST00000092517.9 |
Smurf2
|
SMAD specific E3 ubiquitin protein ligase 2 |
| chr3_+_31956656 | 1.31 |
ENSMUST00000119310.8
|
Kcnmb2
|
potassium large conductance calcium-activated channel, subfamily M, beta member 2 |
| chr12_+_86781154 | 1.30 |
ENSMUST00000095527.6
|
Lrrc74a
|
leucine rich repeat containing 74A |
| chr10_+_100428212 | 1.28 |
ENSMUST00000187119.7
ENSMUST00000188736.7 ENSMUST00000191336.7 |
1700017N19Rik
|
RIKEN cDNA 1700017N19 gene |
| chr11_+_4014841 | 1.27 |
ENSMUST00000068322.7
|
Sec14l3
|
SEC14-like lipid binding 3 |
| chr18_-_33346819 | 1.27 |
ENSMUST00000119991.8
ENSMUST00000118990.2 |
Stard4
|
StAR-related lipid transfer (START) domain containing 4 |
| chr15_+_102379503 | 1.26 |
ENSMUST00000229222.2
|
Pcbp2
|
poly(rC) binding protein 2 |
| chr6_-_42524521 | 1.21 |
ENSMUST00000217978.2
|
Olfr455
|
olfactory receptor 455 |
| chr15_+_6673167 | 1.19 |
ENSMUST00000163073.2
|
Fyb
|
FYN binding protein |
| chr2_-_151815307 | 1.17 |
ENSMUST00000109863.2
|
Fam110a
|
family with sequence similarity 110, member A |
| chr15_-_98278827 | 1.16 |
ENSMUST00000215830.2
|
Olfr283
|
olfactory receptor 283 |
| chr2_-_160714749 | 1.16 |
ENSMUST00000176141.8
|
Zhx3
|
zinc fingers and homeoboxes 3 |
| chr11_-_66059270 | 1.16 |
ENSMUST00000108691.2
|
Dnah9
|
dynein, axonemal, heavy chain 9 |
| chr13_+_23930717 | 1.16 |
ENSMUST00000099703.5
|
H2bc3
|
H2B clustered histone 3 |
| chr3_+_31956814 | 1.10 |
ENSMUST00000192429.6
ENSMUST00000191869.6 ENSMUST00000178668.2 ENSMUST00000119970.8 |
Kcnmb2
|
potassium large conductance calcium-activated channel, subfamily M, beta member 2 |
| chr7_+_28136861 | 1.07 |
ENSMUST00000108292.9
ENSMUST00000108289.8 |
Gmfg
|
glia maturation factor, gamma |
| chr4_+_155646807 | 1.07 |
ENSMUST00000030939.14
|
Nadk
|
NAD kinase |
| chr4_-_15149051 | 1.04 |
ENSMUST00000041606.14
|
Necab1
|
N-terminal EF-hand calcium binding protein 1 |
| chr7_-_133304244 | 1.04 |
ENSMUST00000209636.2
ENSMUST00000153698.3 |
Uros
|
uroporphyrinogen III synthase |
| chr2_+_172090412 | 1.04 |
ENSMUST00000038532.2
|
Mc3r
|
melanocortin 3 receptor |
| chr15_-_101361632 | 1.02 |
ENSMUST00000061185.8
|
Krt81
|
keratin 81 |
| chr11_-_105347500 | 1.00 |
ENSMUST00000049995.10
ENSMUST00000100332.4 |
Marchf10
|
membrane associated ring-CH-type finger 10 |
| chr13_-_53135064 | 0.99 |
ENSMUST00000071065.8
|
Nfil3
|
nuclear factor, interleukin 3, regulated |
| chr2_-_52566583 | 0.98 |
ENSMUST00000178799.8
|
Cacnb4
|
calcium channel, voltage-dependent, beta 4 subunit |
| chr2_-_160714904 | 0.98 |
ENSMUST00000109460.8
ENSMUST00000127201.2 |
Zhx3
|
zinc fingers and homeoboxes 3 |
| chr18_+_37397991 | 0.98 |
ENSMUST00000052366.5
|
Pcdhb1
|
protocadherin beta 1 |
| chr12_+_100745314 | 0.97 |
ENSMUST00000069782.11
|
Dglucy
|
D-glutamate cyclase |
| chr14_+_51181956 | 0.96 |
ENSMUST00000178092.2
ENSMUST00000227052.2 |
Pnp
Gm49342
|
purine-nucleoside phosphorylase predicted gene, 49342 |
| chr11_-_84761538 | 0.95 |
ENSMUST00000170741.2
ENSMUST00000172405.8 ENSMUST00000100686.10 ENSMUST00000108081.9 |
Ggnbp2
|
gametogenetin binding protein 2 |
| chr15_+_102012782 | 0.95 |
ENSMUST00000230474.2
|
Tns2
|
tensin 2 |
| chr7_-_46392403 | 0.90 |
ENSMUST00000128088.4
|
Saa1
|
serum amyloid A 1 |
| chr6_+_30401864 | 0.89 |
ENSMUST00000068240.13
ENSMUST00000068259.10 ENSMUST00000132581.8 |
Klhdc10
|
kelch domain containing 10 |
| chr17_+_37253916 | 0.88 |
ENSMUST00000173072.2
|
Rnf39
|
ring finger protein 39 |
| chr17_+_28910302 | 0.86 |
ENSMUST00000004990.14
ENSMUST00000114754.8 ENSMUST00000062694.16 |
Mapk14
|
mitogen-activated protein kinase 14 |
| chr2_-_152673585 | 0.86 |
ENSMUST00000156688.2
ENSMUST00000007803.12 |
Bcl2l1
|
BCL2-like 1 |
| chr3_-_63872189 | 0.85 |
ENSMUST00000029402.15
|
Slc33a1
|
solute carrier family 33 (acetyl-CoA transporter), member 1 |
| chr7_+_78563513 | 0.83 |
ENSMUST00000038142.15
|
Isg20
|
interferon-stimulated protein |
| chr12_+_100745333 | 0.83 |
ENSMUST00000110073.8
ENSMUST00000110069.8 |
Dglucy
|
D-glutamate cyclase |
| chr5_-_147831610 | 0.82 |
ENSMUST00000118527.8
ENSMUST00000031655.4 ENSMUST00000138244.2 |
Slc46a3
|
solute carrier family 46, member 3 |
| chr17_+_28910393 | 0.80 |
ENSMUST00000124886.9
ENSMUST00000114758.9 |
Mapk14
|
mitogen-activated protein kinase 14 |
| chrX_-_103244728 | 0.80 |
ENSMUST00000056502.7
|
Nexmif
|
neurite extension and migration factor |
| chr10_+_100428246 | 0.77 |
ENSMUST00000041162.13
ENSMUST00000190386.7 ENSMUST00000190708.7 |
1700017N19Rik
|
RIKEN cDNA 1700017N19 gene |
| chr15_+_44482944 | 0.76 |
ENSMUST00000022964.9
|
Ebag9
|
estrogen receptor-binding fragment-associated gene 9 |
| chr8_-_56359983 | 0.75 |
ENSMUST00000053441.5
|
Adam29
|
a disintegrin and metallopeptidase domain 29 |
| chr3_-_107993906 | 0.73 |
ENSMUST00000102638.8
ENSMUST00000102637.8 |
Ampd2
|
adenosine monophosphate deaminase 2 |
| chr17_+_29712008 | 0.71 |
ENSMUST00000234665.2
|
Pim1
|
proviral integration site 1 |
| chr6_+_40470463 | 0.69 |
ENSMUST00000038750.7
|
Tas2r108
|
taste receptor, type 2, member 108 |
| chr7_-_130931235 | 0.69 |
ENSMUST00000188899.2
|
Fam24b
|
family with sequence similarity 24 member B |
| chr14_-_36770898 | 0.67 |
ENSMUST00000225070.2
ENSMUST00000022338.7 |
Rgr
|
retinal G protein coupled receptor |
| chrX_-_103244784 | 0.67 |
ENSMUST00000118314.8
|
Nexmif
|
neurite extension and migration factor |
| chr10_-_88192852 | 0.65 |
ENSMUST00000020249.2
|
Dram1
|
DNA-damage regulated autophagy modulator 1 |
| chr7_-_25112256 | 0.65 |
ENSMUST00000200880.4
ENSMUST00000074040.4 |
Cxcl17
|
chemokine (C-X-C motif) ligand 17 |
| chr8_+_95781722 | 0.63 |
ENSMUST00000058479.7
|
Drc7
|
dynein regulatory complex subunit 7 |
| chr8_+_95055829 | 0.63 |
ENSMUST00000034218.5
ENSMUST00000212134.2 |
Slc12a3
|
solute carrier family 12, member 3 |
| chr11_-_84761472 | 0.63 |
ENSMUST00000018547.9
|
Ggnbp2
|
gametogenetin binding protein 2 |
| chr5_+_145077172 | 0.62 |
ENSMUST00000162594.8
ENSMUST00000162308.8 ENSMUST00000159018.8 ENSMUST00000160075.2 |
Bud31
|
BUD31 homolog |
| chr13_-_57043550 | 0.61 |
ENSMUST00000022023.13
ENSMUST00000174457.9 ENSMUST00000109871.8 |
Trpc7
|
transient receptor potential cation channel, subfamily C, member 7 |
| chr11_-_66059330 | 0.58 |
ENSMUST00000080665.10
|
Dnah9
|
dynein, axonemal, heavy chain 9 |
| chr6_+_83055321 | 0.57 |
ENSMUST00000165164.9
ENSMUST00000092614.9 |
Pcgf1
|
polycomb group ring finger 1 |
| chr4_+_152123772 | 0.56 |
ENSMUST00000084116.13
ENSMUST00000103197.5 |
Nol9
|
nucleolar protein 9 |
| chr12_-_105188993 | 0.55 |
ENSMUST00000041316.15
|
Tcl1
|
T cell lymphoma breakpoint 1 |
| chr15_+_44482667 | 0.54 |
ENSMUST00000228648.2
ENSMUST00000226165.2 |
Ebag9
|
estrogen receptor-binding fragment-associated gene 9 |
| chr7_-_45264908 | 0.54 |
ENSMUST00000033099.6
|
Fgf21
|
fibroblast growth factor 21 |
| chr4_+_130001349 | 0.54 |
ENSMUST00000030563.6
|
Pef1
|
penta-EF hand domain containing 1 |
| chr11_-_102120917 | 0.54 |
ENSMUST00000008999.12
|
Hdac5
|
histone deacetylase 5 |
| chr7_-_28078671 | 0.53 |
ENSMUST00000209061.2
|
Zfp36
|
zinc finger protein 36 |
| chr11_-_84761637 | 0.53 |
ENSMUST00000168434.8
|
Ggnbp2
|
gametogenetin binding protein 2 |
| chr6_+_83055581 | 0.52 |
ENSMUST00000177177.8
ENSMUST00000176089.2 |
Pcgf1
|
polycomb group ring finger 1 |
| chr10_-_128885867 | 0.52 |
ENSMUST00000216460.2
|
Olfr765
|
olfactory receptor 765 |
Gene Ontology Analysis
Gene overrepresentation in biological process category:
| Log-likelihood per target | Total log-likelihood | Term | Description |
|---|---|---|---|
| 10.8 | 32.3 | GO:0003331 | regulation of extracellular matrix constituent secretion(GO:0003330) positive regulation of extracellular matrix constituent secretion(GO:0003331) |
| 6.2 | 37.0 | GO:1902998 | regulation of neuronal signal transduction(GO:1902847) positive regulation of neurofibrillary tangle assembly(GO:1902998) |
| 5.5 | 16.6 | GO:0015688 | iron chelate transport(GO:0015688) siderophore transport(GO:0015891) |
| 5.5 | 16.5 | GO:0030573 | bile acid catabolic process(GO:0030573) |
| 3.4 | 16.8 | GO:0070494 | regulation of thrombin receptor signaling pathway(GO:0070494) negative regulation of thrombin receptor signaling pathway(GO:0070495) |
| 3.3 | 13.0 | GO:0001970 | positive regulation of activation of membrane attack complex(GO:0001970) |
| 2.8 | 11.2 | GO:0034197 | acylglycerol transport(GO:0034196) triglyceride transport(GO:0034197) |
| 2.5 | 93.6 | GO:0006825 | copper ion transport(GO:0006825) response to copper ion(GO:0046688) |
| 2.2 | 11.2 | GO:0048807 | female genitalia morphogenesis(GO:0048807) |
| 1.9 | 5.6 | GO:0008588 | release of cytoplasmic sequestered NF-kappaB(GO:0008588) |
| 1.9 | 5.6 | GO:0001982 | baroreceptor response to decreased systemic arterial blood pressure(GO:0001982) |
| 1.8 | 60.4 | GO:0035634 | response to stilbenoid(GO:0035634) |
| 1.8 | 9.1 | GO:0006548 | histidine catabolic process(GO:0006548) |
| 1.8 | 10.7 | GO:0051005 | negative regulation of lipoprotein lipase activity(GO:0051005) |
| 1.7 | 13.2 | GO:0046149 | porphyrin-containing compound catabolic process(GO:0006787) tetrapyrrole catabolic process(GO:0033015) heme catabolic process(GO:0042167) pigment catabolic process(GO:0046149) |
| 1.6 | 53.1 | GO:0015721 | bile acid and bile salt transport(GO:0015721) |
| 1.6 | 6.3 | GO:0061402 | glycerol biosynthetic process(GO:0006114) positive regulation of transcription from RNA polymerase II promoter in response to acidic pH(GO:0061402) |
| 1.5 | 98.9 | GO:0030195 | negative regulation of blood coagulation(GO:0030195) negative regulation of hemostasis(GO:1900047) |
| 1.5 | 13.3 | GO:0060763 | mammary duct terminal end bud growth(GO:0060763) |
| 1.4 | 2.9 | GO:0010877 | lipid transport involved in lipid storage(GO:0010877) |
| 1.4 | 4.3 | GO:0060557 | positive regulation of vitamin metabolic process(GO:0046136) positive regulation of vitamin D biosynthetic process(GO:0060557) positive regulation of calcidiol 1-monooxygenase activity(GO:0060559) |
| 1.3 | 20.1 | GO:0015747 | urate transport(GO:0015747) |
| 1.3 | 11.8 | GO:0042904 | 9-cis-retinoic acid biosynthetic process(GO:0042904) 9-cis-retinoic acid metabolic process(GO:0042905) |
| 1.3 | 2.5 | GO:1902623 | negative regulation of neutrophil migration(GO:1902623) |
| 1.2 | 3.5 | GO:0070839 | divalent metal ion export(GO:0070839) |
| 1.2 | 4.6 | GO:1901491 | negative regulation of lymphangiogenesis(GO:1901491) |
| 1.1 | 62.7 | GO:0006953 | acute-phase response(GO:0006953) |
| 1.1 | 7.4 | GO:0070779 | D-aspartate transport(GO:0070777) D-aspartate import(GO:0070779) |
| 1.0 | 10.1 | GO:0006880 | intracellular sequestering of iron ion(GO:0006880) sequestering of iron ion(GO:0097577) |
| 0.9 | 1.8 | GO:0006533 | fumarate metabolic process(GO:0006106) aspartate catabolic process(GO:0006533) |
| 0.9 | 2.6 | GO:0060217 | hemangioblast cell differentiation(GO:0060217) |
| 0.9 | 1.7 | GO:0010982 | regulation of high-density lipoprotein particle clearance(GO:0010982) |
| 0.8 | 8.2 | GO:0006707 | cholesterol catabolic process(GO:0006707) sterol catabolic process(GO:0016127) |
| 0.8 | 5.4 | GO:0016259 | selenocysteine metabolic process(GO:0016259) |
| 0.6 | 6.2 | GO:0044539 | long-chain fatty acid import(GO:0044539) |
| 0.5 | 22.4 | GO:1903846 | positive regulation of transforming growth factor beta receptor signaling pathway(GO:0030511) positive regulation of cellular response to transforming growth factor beta stimulus(GO:1903846) |
| 0.5 | 19.3 | GO:0006767 | water-soluble vitamin metabolic process(GO:0006767) |
| 0.4 | 2.9 | GO:1902748 | positive regulation of lens fiber cell differentiation(GO:1902748) |
| 0.4 | 1.5 | GO:0070782 | phosphatidylserine exposure on apoptotic cell surface(GO:0070782) |
| 0.4 | 6.8 | GO:0015937 | coenzyme A biosynthetic process(GO:0015937) |
| 0.4 | 1.1 | GO:0071846 | actin filament debranching(GO:0071846) |
| 0.4 | 2.1 | GO:0033140 | negative regulation of peptidyl-serine phosphorylation of STAT protein(GO:0033140) |
| 0.3 | 1.0 | GO:0006780 | uroporphyrinogen III biosynthetic process(GO:0006780) |
| 0.3 | 1.0 | GO:0046122 | purine deoxyribonucleoside metabolic process(GO:0046122) |
| 0.3 | 1.6 | GO:0000738 | DNA catabolic process, exonucleolytic(GO:0000738) |
| 0.3 | 17.1 | GO:0034198 | cellular response to amino acid starvation(GO:0034198) |
| 0.3 | 2.4 | GO:0005513 | detection of calcium ion(GO:0005513) |
| 0.3 | 1.3 | GO:1901165 | positive regulation of trophoblast cell migration(GO:1901165) |
| 0.2 | 5.5 | GO:0051923 | sulfation(GO:0051923) |
| 0.2 | 1.4 | GO:0051410 | detoxification of nitrogen compound(GO:0051410) cellular detoxification of nitrogen compound(GO:0070458) |
| 0.2 | 30.7 | GO:0046889 | positive regulation of lipid biosynthetic process(GO:0046889) |
| 0.2 | 0.9 | GO:0046898 | response to cycloheximide(GO:0046898) |
| 0.2 | 1.7 | GO:0014835 | myoblast differentiation involved in skeletal muscle regeneration(GO:0014835) positive regulation of interleukin-12 secretion(GO:2001184) |
| 0.2 | 0.6 | GO:0000448 | cleavage in ITS2 between 5.8S rRNA and LSU-rRNA of tricistronic rRNA transcript (SSU-rRNA, 5.8S rRNA, LSU-rRNA)(GO:0000448) |
| 0.2 | 3.6 | GO:1990001 | inhibition of cysteine-type endopeptidase activity involved in apoptotic process(GO:1990001) |
| 0.2 | 0.5 | GO:1902527 | positive regulation of protein monoubiquitination(GO:1902527) |
| 0.2 | 0.5 | GO:1904582 | positive regulation of intracellular mRNA localization(GO:1904582) |
| 0.2 | 0.9 | GO:0046684 | response to pyrethroid(GO:0046684) |
| 0.2 | 5.2 | GO:0014823 | response to activity(GO:0014823) |
| 0.2 | 3.3 | GO:0007250 | activation of NF-kappaB-inducing kinase activity(GO:0007250) |
| 0.1 | 0.7 | GO:0031659 | positive regulation of cyclin-dependent protein serine/threonine kinase activity involved in G1/S transition of mitotic cell cycle(GO:0031659) |
| 0.1 | 0.5 | GO:0090208 | positive regulation of triglyceride metabolic process(GO:0090208) |
| 0.1 | 1.1 | GO:0006741 | NADP biosynthetic process(GO:0006741) |
| 0.1 | 5.7 | GO:0030220 | platelet formation(GO:0030220) |
| 0.1 | 2.6 | GO:0075522 | IRES-dependent viral translational initiation(GO:0075522) |
| 0.1 | 2.8 | GO:0010758 | regulation of macrophage chemotaxis(GO:0010758) |
| 0.1 | 3.4 | GO:0045671 | negative regulation of osteoclast differentiation(GO:0045671) |
| 0.1 | 1.7 | GO:0006622 | protein targeting to lysosome(GO:0006622) |
| 0.1 | 1.4 | GO:0048246 | macrophage chemotaxis(GO:0048246) |
| 0.1 | 0.3 | GO:0030200 | heparan sulfate proteoglycan catabolic process(GO:0030200) |
| 0.1 | 1.8 | GO:0010447 | response to acidic pH(GO:0010447) |
| 0.1 | 1.0 | GO:0019227 | neuronal action potential propagation(GO:0019227) action potential propagation(GO:0098870) |
| 0.1 | 0.5 | GO:0033313 | meiotic cell cycle checkpoint(GO:0033313) |
| 0.1 | 2.4 | GO:0009303 | rRNA transcription(GO:0009303) |
| 0.1 | 0.7 | GO:0001867 | complement activation, lectin pathway(GO:0001867) |
| 0.1 | 1.8 | GO:0033622 | integrin activation(GO:0033622) |
| 0.1 | 12.2 | GO:0007596 | blood coagulation(GO:0007596) |
| 0.1 | 1.1 | GO:0090051 | negative regulation of cell migration involved in sprouting angiogenesis(GO:0090051) |
| 0.1 | 7.9 | GO:0032436 | positive regulation of proteasomal ubiquitin-dependent protein catabolic process(GO:0032436) |
| 0.1 | 1.8 | GO:0045589 | regulation of regulatory T cell differentiation(GO:0045589) |
| 0.1 | 0.5 | GO:0019368 | fatty acid elongation, saturated fatty acid(GO:0019367) fatty acid elongation, unsaturated fatty acid(GO:0019368) fatty acid elongation, monounsaturated fatty acid(GO:0034625) fatty acid elongation, polyunsaturated fatty acid(GO:0034626) |
| 0.1 | 3.7 | GO:0006749 | glutathione metabolic process(GO:0006749) |
| 0.1 | 0.4 | GO:0010936 | negative regulation of macrophage cytokine production(GO:0010936) |
| 0.1 | 0.7 | GO:0072015 | glomerular visceral epithelial cell development(GO:0072015) glomerular epithelial cell development(GO:0072310) |
| 0.1 | 0.1 | GO:0033031 | positive regulation of neutrophil apoptotic process(GO:0033031) |
| 0.0 | 3.7 | GO:0035690 | cellular response to drug(GO:0035690) |
| 0.0 | 0.5 | GO:0001731 | formation of translation preinitiation complex(GO:0001731) |
| 0.0 | 0.7 | GO:0018298 | protein-chromophore linkage(GO:0018298) |
| 0.0 | 1.1 | GO:0035518 | histone H2A monoubiquitination(GO:0035518) |
| 0.0 | 0.4 | GO:0060391 | positive regulation of SMAD protein import into nucleus(GO:0060391) |
| 0.0 | 1.0 | GO:0001659 | temperature homeostasis(GO:0001659) |
| 0.0 | 0.6 | GO:0006828 | manganese ion transport(GO:0006828) |
| 0.0 | 0.5 | GO:0010918 | positive regulation of mitochondrial membrane potential(GO:0010918) |
| 0.0 | 0.4 | GO:2000741 | regulation of mesenchymal stem cell differentiation(GO:2000739) positive regulation of mesenchymal stem cell differentiation(GO:2000741) |
| 0.0 | 9.0 | GO:0008202 | steroid metabolic process(GO:0008202) |
| 0.0 | 2.1 | GO:0045669 | positive regulation of osteoblast differentiation(GO:0045669) |
| 0.0 | 1.0 | GO:0071353 | cellular response to interleukin-4(GO:0071353) |
| 0.0 | 2.5 | GO:0032755 | positive regulation of interleukin-6 production(GO:0032755) |
| 0.0 | 0.3 | GO:0035608 | protein deglutamylation(GO:0035608) |
| 0.0 | 1.7 | GO:0003341 | cilium movement(GO:0003341) |
| 0.0 | 1.3 | GO:0060395 | SMAD protein signal transduction(GO:0060395) |
| 0.0 | 0.8 | GO:0001580 | detection of chemical stimulus involved in sensory perception of bitter taste(GO:0001580) |
| 0.0 | 1.7 | GO:0007200 | phospholipase C-activating G-protein coupled receptor signaling pathway(GO:0007200) |
| 0.0 | 0.4 | GO:0030574 | collagen catabolic process(GO:0030574) |
| 0.0 | 3.0 | GO:0006457 | protein folding(GO:0006457) |
| 0.0 | 0.5 | GO:0051281 | positive regulation of release of sequestered calcium ion into cytosol(GO:0051281) |
| 0.0 | 1.6 | GO:0006910 | phagocytosis, recognition(GO:0006910) |
| 0.0 | 2.6 | GO:0009952 | anterior/posterior pattern specification(GO:0009952) |
Gene overrepresentation in cellular component category:
| Log-likelihood per target | Total log-likelihood | Term | Description |
|---|---|---|---|
| 3.2 | 15.9 | GO:0031838 | haptoglobin-hemoglobin complex(GO:0031838) |
| 2.5 | 37.0 | GO:0034366 | spherical high-density lipoprotein particle(GO:0034366) |
| 1.5 | 38.3 | GO:0034364 | high-density lipoprotein particle(GO:0034364) |
| 1.3 | 90.1 | GO:0046658 | anchored component of plasma membrane(GO:0046658) |
| 0.9 | 2.6 | GO:0033193 | Lsd1/2 complex(GO:0033193) |
| 0.7 | 11.8 | GO:0044754 | autolysosome(GO:0044754) |
| 0.7 | 183.5 | GO:0072562 | blood microparticle(GO:0072562) |
| 0.7 | 3.5 | GO:0030312 | external encapsulating structure(GO:0030312) |
| 0.3 | 2.4 | GO:0042406 | extrinsic component of endoplasmic reticulum membrane(GO:0042406) |
| 0.3 | 35.2 | GO:0005811 | lipid particle(GO:0005811) |
| 0.3 | 2.6 | GO:0097208 | alveolar lamellar body(GO:0097208) |
| 0.2 | 16.4 | GO:0005881 | cytoplasmic microtubule(GO:0005881) |
| 0.1 | 3.2 | GO:0002080 | acrosomal membrane(GO:0002080) |
| 0.1 | 51.1 | GO:0016323 | basolateral plasma membrane(GO:0016323) |
| 0.1 | 0.4 | GO:0005896 | interleukin-6 receptor complex(GO:0005896) |
| 0.1 | 0.5 | GO:0030896 | checkpoint clamp complex(GO:0030896) |
| 0.1 | 14.8 | GO:0031225 | anchored component of membrane(GO:0031225) |
| 0.1 | 13.2 | GO:0043195 | terminal bouton(GO:0043195) |
| 0.1 | 6.8 | GO:0030118 | clathrin coat(GO:0030118) |
| 0.1 | 1.0 | GO:0090571 | RNA polymerase II transcription repressor complex(GO:0090571) |
| 0.1 | 6.2 | GO:0031903 | peroxisomal membrane(GO:0005778) microbody membrane(GO:0031903) |
| 0.1 | 0.9 | GO:0097136 | Bcl-2 family protein complex(GO:0097136) |
| 0.0 | 8.7 | GO:0005923 | bicellular tight junction(GO:0005923) |
| 0.0 | 0.5 | GO:0070578 | RISC-loading complex(GO:0070578) |
| 0.0 | 0.5 | GO:0016281 | eukaryotic translation initiation factor 4F complex(GO:0016281) |
| 0.0 | 0.9 | GO:0001518 | voltage-gated sodium channel complex(GO:0001518) |
| 0.0 | 72.0 | GO:0005615 | extracellular space(GO:0005615) |
| 0.0 | 2.0 | GO:0042645 | nucleoid(GO:0009295) mitochondrial nucleoid(GO:0042645) |
| 0.0 | 1.8 | GO:0031941 | filamentous actin(GO:0031941) |
| 0.0 | 7.4 | GO:0043197 | dendritic spine(GO:0043197) |
| 0.0 | 1.7 | GO:0030286 | dynein complex(GO:0030286) |
| 0.0 | 0.5 | GO:0030127 | COPII vesicle coat(GO:0030127) |
| 0.0 | 4.4 | GO:0009897 | external side of plasma membrane(GO:0009897) |
| 0.0 | 3.0 | GO:0030176 | integral component of endoplasmic reticulum membrane(GO:0030176) |
| 0.0 | 1.8 | GO:0008076 | voltage-gated potassium channel complex(GO:0008076) |
| 0.0 | 0.5 | GO:0045120 | pronucleus(GO:0045120) |
| 0.0 | 4.8 | GO:0031965 | nuclear membrane(GO:0031965) |
| 0.0 | 4.3 | GO:0031012 | extracellular matrix(GO:0031012) |
| 0.0 | 1.1 | GO:0031519 | PcG protein complex(GO:0031519) |
| 0.0 | 0.4 | GO:0005685 | U1 snRNP(GO:0005685) |
| 0.0 | 0.6 | GO:0005801 | cis-Golgi network(GO:0005801) |
Gene overrepresentation in molecular function category:
| Log-likelihood per target | Total log-likelihood | Term | Description |
|---|---|---|---|
| 7.8 | 93.6 | GO:0016724 | ferroxidase activity(GO:0004322) oxidoreductase activity, oxidizing metal ions, oxygen as acceptor(GO:0016724) |
| 6.4 | 38.5 | GO:0030294 | receptor signaling protein tyrosine kinase inhibitor activity(GO:0030294) |
| 5.2 | 42.0 | GO:0008508 | bile acid:sodium symporter activity(GO:0008508) |
| 4.4 | 13.2 | GO:0042602 | riboflavin reductase (NADPH) activity(GO:0042602) |
| 4.2 | 16.8 | GO:0005008 | hepatocyte growth factor-activated receptor activity(GO:0005008) |
| 4.0 | 15.9 | GO:0031721 | haptoglobin binding(GO:0031720) hemoglobin alpha binding(GO:0031721) |
| 3.7 | 11.2 | GO:0034632 | retinol transporter activity(GO:0034632) |
| 3.3 | 16.5 | GO:0033765 | steroid dehydrogenase activity, acting on the CH-CH group of donors(GO:0033765) |
| 2.1 | 6.3 | GO:0004613 | phosphoenolpyruvate carboxykinase activity(GO:0004611) phosphoenolpyruvate carboxykinase (GTP) activity(GO:0004613) |
| 2.0 | 8.2 | GO:0047016 | cholest-5-ene-3-beta,7-alpha-diol 3-beta-dehydrogenase activity(GO:0047016) |
| 2.0 | 12.0 | GO:0050656 | 3'-phosphoadenosine 5'-phosphosulfate binding(GO:0050656) |
| 1.9 | 11.2 | GO:0060230 | lipoprotein lipase activator activity(GO:0060230) |
| 1.8 | 5.4 | GO:0004756 | selenide, water dikinase activity(GO:0004756) phosphotransferase activity, paired acceptors(GO:0016781) |
| 1.4 | 37.0 | GO:0051787 | misfolded protein binding(GO:0051787) |
| 1.4 | 5.6 | GO:0004937 | alpha1-adrenergic receptor activity(GO:0004937) |
| 1.3 | 9.1 | GO:0016841 | ammonia-lyase activity(GO:0016841) |
| 1.2 | 11.1 | GO:0015198 | oligopeptide transporter activity(GO:0015198) |
| 1.2 | 6.2 | GO:0043758 | acetate-CoA ligase (ADP-forming) activity(GO:0043758) |
| 1.2 | 7.4 | GO:0015501 | glutamate:sodium symporter activity(GO:0015501) |
| 1.2 | 20.1 | GO:0015143 | urate transmembrane transporter activity(GO:0015143) salt transmembrane transporter activity(GO:1901702) |
| 1.1 | 6.8 | GO:0004594 | pantothenate kinase activity(GO:0004594) |
| 1.1 | 32.6 | GO:0004181 | metallocarboxypeptidase activity(GO:0004181) |
| 1.0 | 120.1 | GO:0004869 | cysteine-type endopeptidase inhibitor activity(GO:0004869) |
| 1.0 | 17.0 | GO:0070513 | death domain binding(GO:0070513) |
| 0.9 | 7.5 | GO:0035662 | Toll-like receptor 4 binding(GO:0035662) |
| 0.8 | 2.5 | GO:0001847 | opsonin receptor activity(GO:0001847) |
| 0.8 | 11.8 | GO:0001758 | retinal dehydrogenase activity(GO:0001758) |
| 0.6 | 1.8 | GO:0080130 | L-phenylalanine:2-oxoglutarate aminotransferase activity(GO:0080130) |
| 0.5 | 17.3 | GO:0015347 | sodium-independent organic anion transmembrane transporter activity(GO:0015347) |
| 0.5 | 3.2 | GO:0008970 | phosphatidylcholine 1-acylhydrolase activity(GO:0008970) |
| 0.4 | 17.9 | GO:0042056 | chemoattractant activity(GO:0042056) |
| 0.4 | 1.3 | GO:0051185 | coenzyme transporter activity(GO:0051185) |
| 0.4 | 16.4 | GO:0008392 | arachidonic acid epoxygenase activity(GO:0008392) |
| 0.4 | 2.2 | GO:0070892 | lipoteichoic acid receptor activity(GO:0070892) |
| 0.4 | 3.7 | GO:0016812 | hydrolase activity, acting on carbon-nitrogen (but not peptide) bonds, in cyclic amides(GO:0016812) |
| 0.4 | 4.2 | GO:0005347 | ATP transmembrane transporter activity(GO:0005347) ADP transmembrane transporter activity(GO:0015217) |
| 0.4 | 23.8 | GO:0005160 | transforming growth factor beta receptor binding(GO:0005160) |
| 0.3 | 1.0 | GO:0004980 | melanocyte-stimulating hormone receptor activity(GO:0004980) |
| 0.3 | 7.3 | GO:0042288 | MHC class I protein binding(GO:0042288) |
| 0.3 | 1.6 | GO:0008859 | exoribonuclease II activity(GO:0008859) |
| 0.3 | 1.0 | GO:0004731 | purine-nucleoside phosphorylase activity(GO:0004731) |
| 0.3 | 1.8 | GO:0004966 | galanin receptor activity(GO:0004966) |
| 0.2 | 2.6 | GO:0004908 | interleukin-1 receptor activity(GO:0004908) |
| 0.2 | 13.5 | GO:0008146 | sulfotransferase activity(GO:0008146) |
| 0.2 | 1.7 | GO:0004630 | phospholipase D activity(GO:0004630) |
| 0.2 | 2.6 | GO:1990829 | C-rich single-stranded DNA binding(GO:1990829) |
| 0.2 | 3.1 | GO:0015299 | solute:proton antiporter activity(GO:0015299) |
| 0.2 | 10.3 | GO:0031624 | ubiquitin conjugating enzyme binding(GO:0031624) |
| 0.2 | 1.0 | GO:0004852 | uroporphyrinogen-III synthase activity(GO:0004852) |
| 0.2 | 1.0 | GO:0001226 | RNA polymerase II transcription corepressor binding(GO:0001226) |
| 0.2 | 0.5 | GO:0004947 | bradykinin receptor activity(GO:0004947) |
| 0.1 | 3.6 | GO:0005149 | interleukin-1 receptor binding(GO:0005149) |
| 0.1 | 13.9 | GO:0016811 | hydrolase activity, acting on carbon-nitrogen (but not peptide) bonds, in linear amides(GO:0016811) |
| 0.1 | 1.7 | GO:0051525 | NFAT protein binding(GO:0051525) |
| 0.1 | 26.7 | GO:0005506 | iron ion binding(GO:0005506) |
| 0.1 | 30.0 | GO:0004252 | serine-type endopeptidase activity(GO:0004252) |
| 0.1 | 15.8 | GO:0004540 | ribonuclease activity(GO:0004540) |
| 0.1 | 2.9 | GO:0017127 | cholesterol transporter activity(GO:0017127) |
| 0.1 | 2.7 | GO:0070412 | R-SMAD binding(GO:0070412) |
| 0.1 | 0.4 | GO:0035614 | snRNA stem-loop binding(GO:0035614) |
| 0.1 | 2.4 | GO:0015269 | calcium-activated potassium channel activity(GO:0015269) |
| 0.1 | 0.6 | GO:0051731 | polynucleotide 5'-hydroxyl-kinase activity(GO:0051731) |
| 0.1 | 1.1 | GO:0071933 | Arp2/3 complex binding(GO:0071933) |
| 0.1 | 0.5 | GO:0033592 | RNA strand annealing activity(GO:0033592) |
| 0.1 | 0.7 | GO:0008020 | G-protein coupled photoreceptor activity(GO:0008020) |
| 0.1 | 0.7 | GO:0008061 | chitin binding(GO:0008061) |
| 0.1 | 1.7 | GO:0008569 | ATP-dependent microtubule motor activity, minus-end-directed(GO:0008569) |
| 0.1 | 1.8 | GO:0009975 | cyclase activity(GO:0009975) |
| 0.1 | 2.1 | GO:0008009 | chemokine activity(GO:0008009) |
| 0.0 | 1.4 | GO:1900750 | glutathione binding(GO:0043295) oligopeptide binding(GO:1900750) |
| 0.0 | 14.0 | GO:0001664 | G-protein coupled receptor binding(GO:0001664) |
| 0.0 | 0.5 | GO:0009922 | fatty acid elongase activity(GO:0009922) 3-oxo-arachidoyl-CoA synthase activity(GO:0102336) 3-oxo-cerotoyl-CoA synthase activity(GO:0102337) 3-oxo-lignoceronyl-CoA synthase activity(GO:0102338) |
| 0.0 | 0.6 | GO:0015279 | store-operated calcium channel activity(GO:0015279) |
| 0.0 | 0.8 | GO:0033038 | bitter taste receptor activity(GO:0033038) |
| 0.0 | 0.4 | GO:0005138 | interleukin-6 receptor binding(GO:0005138) |
| 0.0 | 1.1 | GO:0003951 | NAD+ kinase activity(GO:0003951) |
| 0.0 | 0.5 | GO:0035925 | mRNA 3'-UTR AU-rich region binding(GO:0035925) |
| 0.0 | 0.3 | GO:0045545 | syndecan binding(GO:0045545) |
| 0.0 | 5.2 | GO:0030165 | PDZ domain binding(GO:0030165) |
| 0.0 | 1.8 | GO:0005547 | phosphatidylinositol-3,4,5-trisphosphate binding(GO:0005547) |
| 0.0 | 2.4 | GO:0035064 | methylated histone binding(GO:0035064) |
| 0.0 | 2.1 | GO:0070888 | E-box binding(GO:0070888) |
| 0.0 | 0.3 | GO:0001594 | trace-amine receptor activity(GO:0001594) |
| 0.0 | 3.0 | GO:0051082 | unfolded protein binding(GO:0051082) |
| 0.0 | 0.9 | GO:0005248 | voltage-gated sodium channel activity(GO:0005248) |
| 0.0 | 0.1 | GO:0043120 | tumor necrosis factor binding(GO:0043120) |
| 0.0 | 0.5 | GO:0004198 | calcium-dependent cysteine-type endopeptidase activity(GO:0004198) |
| 0.0 | 13.2 | GO:0016491 | oxidoreductase activity(GO:0016491) |
| 0.0 | 0.5 | GO:0043539 | protein serine/threonine kinase activator activity(GO:0043539) |
| 0.0 | 0.5 | GO:0005104 | fibroblast growth factor receptor binding(GO:0005104) |
| 0.0 | 0.5 | GO:0005044 | scavenger receptor activity(GO:0005044) |
| 0.0 | 1.6 | GO:0034987 | immunoglobulin receptor binding(GO:0034987) |
| 0.0 | 0.7 | GO:0030145 | manganese ion binding(GO:0030145) |
Gene overrepresentation in curated gene sets: canonical pathways category:
| Log-likelihood per target | Total log-likelihood | Term | Description |
|---|---|---|---|
| 1.3 | 44.0 | PID INTEGRIN2 PATHWAY | Beta2 integrin cell surface interactions |
| 0.8 | 90.4 | PID HIF1 TFPATHWAY | HIF-1-alpha transcription factor network |
| 0.6 | 39.8 | PID BMP PATHWAY | BMP receptor signaling |
| 0.4 | 40.5 | PID MYC REPRESS PATHWAY | Validated targets of C-MYC transcriptional repression |
| 0.4 | 30.1 | PID A6B1 A6B4 INTEGRIN PATHWAY | a6b1 and a6b4 Integrin signaling |
| 0.3 | 4.3 | SA MMP CYTOKINE CONNECTION | Cytokines can induce activation of matrix metalloproteinases, which degrade extracellular matrix. |
| 0.1 | 6.3 | PID HNF3B PATHWAY | FOXA2 and FOXA3 transcription factor networks |
| 0.1 | 3.8 | PID CASPASE PATHWAY | Caspase cascade in apoptosis |
| 0.1 | 1.7 | PID LYMPH ANGIOGENESIS PATHWAY | VEGFR3 signaling in lymphatic endothelium |
| 0.1 | 14.0 | NABA ECM GLYCOPROTEINS | Genes encoding structural ECM glycoproteins |
| 0.1 | 2.6 | PID IL12 STAT4 PATHWAY | IL12 signaling mediated by STAT4 |
| 0.1 | 6.0 | PID LYSOPHOSPHOLIPID PATHWAY | LPA receptor mediated events |
| 0.1 | 5.4 | PID E2F PATHWAY | E2F transcription factor network |
| 0.1 | 1.7 | PID UPA UPAR PATHWAY | Urokinase-type plasminogen activator (uPA) and uPAR-mediated signaling |
| 0.0 | 0.9 | SA PROGRAMMED CELL DEATH | Programmed cell death, or apoptosis, eliminates damaged or unneeded cells. |
| 0.0 | 8.0 | NABA ECM AFFILIATED | Genes encoding proteins affiliated structurally or functionally to extracellular matrix proteins |
| 0.0 | 0.7 | PID IL5 PATHWAY | IL5-mediated signaling events |
| 0.0 | 0.4 | PID IL1 PATHWAY | IL1-mediated signaling events |
| 0.0 | 4.5 | NABA ECM REGULATORS | Genes encoding enzymes and their regulators involved in the remodeling of the extracellular matrix |
| 0.0 | 1.0 | PID HDAC CLASSII PATHWAY | Signaling events mediated by HDAC Class II |
| 0.0 | 1.3 | PID ERA GENOMIC PATHWAY | Validated nuclear estrogen receptor alpha network |
| 0.0 | 0.1 | SA FAS SIGNALING | The TNF-type receptor Fas induces apoptosis on ligand binding. |
| 0.0 | 1.3 | PID AR PATHWAY | Coregulation of Androgen receptor activity |
| 0.0 | 0.9 | PID TCR PATHWAY | TCR signaling in naïve CD4+ T cells |
Gene overrepresentation in curated gene sets: REACTOME pathways category:
| Log-likelihood per target | Total log-likelihood | Term | Description |
|---|---|---|---|
| 3.8 | 42.0 | REACTOME RECYCLING OF BILE ACIDS AND SALTS | Genes involved in Recycling of bile acids and salts |
| 2.3 | 97.1 | REACTOME METAL ION SLC TRANSPORTERS | Genes involved in Metal ion SLC transporters |
| 1.9 | 24.7 | REACTOME SYNTHESIS OF BILE ACIDS AND BILE SALTS VIA 24 HYDROXYCHOLESTEROL | Genes involved in Synthesis of bile acids and bile salts via 24-hydroxycholesterol |
| 1.8 | 40.4 | REACTOME INTRINSIC PATHWAY | Genes involved in Intrinsic Pathway |
| 0.9 | 13.0 | REACTOME REGULATION OF COMPLEMENT CASCADE | Genes involved in Regulation of Complement cascade |
| 0.6 | 14.3 | REACTOME METABOLISM OF PORPHYRINS | Genes involved in Metabolism of porphyrins |
| 0.4 | 6.8 | REACTOME VITAMIN B5 PANTOTHENATE METABOLISM | Genes involved in Vitamin B5 (pantothenate) metabolism |
| 0.4 | 6.3 | REACTOME ABACAVIR TRANSPORT AND METABOLISM | Genes involved in Abacavir transport and metabolism |
| 0.4 | 5.5 | REACTOME CYTOSOLIC SULFONATION OF SMALL MOLECULES | Genes involved in Cytosolic sulfonation of small molecules |
| 0.4 | 16.8 | REACTOME SEMA4D IN SEMAPHORIN SIGNALING | Genes involved in Sema4D in semaphorin signaling |
| 0.3 | 39.2 | REACTOME RESPONSE TO ELEVATED PLATELET CYTOSOLIC CA2 | Genes involved in Response to elevated platelet cytosolic Ca2+ |
| 0.2 | 6.2 | REACTOME ALPHA LINOLENIC ACID ALA METABOLISM | Genes involved in alpha-linolenic acid (ALA) metabolism |
| 0.2 | 8.7 | REACTOME TIGHT JUNCTION INTERACTIONS | Genes involved in Tight junction interactions |
| 0.1 | 5.6 | REACTOME AMINE LIGAND BINDING RECEPTORS | Genes involved in Amine ligand-binding receptors |
| 0.1 | 6.7 | REACTOME NEGATIVE REGULATORS OF RIG I MDA5 SIGNALING | Genes involved in Negative regulators of RIG-I/MDA5 signaling |
| 0.1 | 4.0 | REACTOME CASPASE MEDIATED CLEAVAGE OF CYTOSKELETAL PROTEINS | Genes involved in Caspase-mediated cleavage of cytoskeletal proteins |
| 0.1 | 1.7 | REACTOME ACTIVATION OF THE AP1 FAMILY OF TRANSCRIPTION FACTORS | Genes involved in Activation of the AP-1 family of transcription factors |
| 0.1 | 3.7 | REACTOME GLUTATHIONE CONJUGATION | Genes involved in Glutathione conjugation |
| 0.1 | 1.0 | REACTOME PURINE CATABOLISM | Genes involved in Purine catabolism |
| 0.1 | 2.4 | REACTOME CGMP EFFECTS | Genes involved in cGMP effects |
| 0.1 | 0.9 | REACTOME TAK1 ACTIVATES NFKB BY PHOSPHORYLATION AND ACTIVATION OF IKKS COMPLEX | Genes involved in TAK1 activates NFkB by phosphorylation and activation of IKKs complex |
| 0.1 | 2.9 | REACTOME STEROID HORMONES | Genes involved in Steroid hormones |
| 0.1 | 4.0 | REACTOME IL1 SIGNALING | Genes involved in Interleukin-1 signaling |
| 0.1 | 1.8 | REACTOME CELL EXTRACELLULAR MATRIX INTERACTIONS | Genes involved in Cell-extracellular matrix interactions |
| 0.1 | 0.6 | REACTOME ELEVATION OF CYTOSOLIC CA2 LEVELS | Genes involved in Elevation of cytosolic Ca2+ levels |
| 0.1 | 0.7 | REACTOME OPSINS | Genes involved in Opsins |
| 0.0 | 1.3 | REACTOME SIGNALING BY BMP | Genes involved in Signaling by BMP |
| 0.0 | 0.4 | REACTOME IL 6 SIGNALING | Genes involved in Interleukin-6 signaling |
| 0.0 | 1.2 | REACTOME SIGNAL REGULATORY PROTEIN SIRP FAMILY INTERACTIONS | Genes involved in Signal regulatory protein (SIRP) family interactions |
| 0.0 | 0.5 | REACTOME MTORC1 MEDIATED SIGNALLING | Genes involved in mTORC1-mediated signalling |
| 0.0 | 1.3 | REACTOME TRANSPORT OF VITAMINS NUCLEOSIDES AND RELATED MOLECULES | Genes involved in Transport of vitamins, nucleosides, and related molecules |
| 0.0 | 1.6 | REACTOME INTERFERON ALPHA BETA SIGNALING | Genes involved in Interferon alpha/beta signaling |
| 0.0 | 0.5 | REACTOME DESTABILIZATION OF MRNA BY TRISTETRAPROLIN TTP | Genes involved in Destabilization of mRNA by Tristetraprolin (TTP) |
| 0.0 | 0.5 | REACTOME SYNTHESIS OF VERY LONG CHAIN FATTY ACYL COAS | Genes involved in Synthesis of very long-chain fatty acyl-CoAs |
| 0.0 | 5.5 | REACTOME METABOLISM OF AMINO ACIDS AND DERIVATIVES | Genes involved in Metabolism of amino acids and derivatives |
| 0.0 | 0.9 | REACTOME INTRINSIC PATHWAY FOR APOPTOSIS | Genes involved in Intrinsic Pathway for Apoptosis |
| 0.0 | 2.0 | REACTOME INFLUENZA VIRAL RNA TRANSCRIPTION AND REPLICATION | Genes involved in Influenza Viral RNA Transcription and Replication |
| 0.0 | 1.0 | REACTOME NOTCH1 INTRACELLULAR DOMAIN REGULATES TRANSCRIPTION | Genes involved in NOTCH1 Intracellular Domain Regulates Transcription |
| 0.0 | 0.3 | REACTOME HS GAG DEGRADATION | Genes involved in HS-GAG degradation |