Project
PRJNA375882: Comprehensive Mouse Transcriptomic BodyMap
Navigation
Downloads
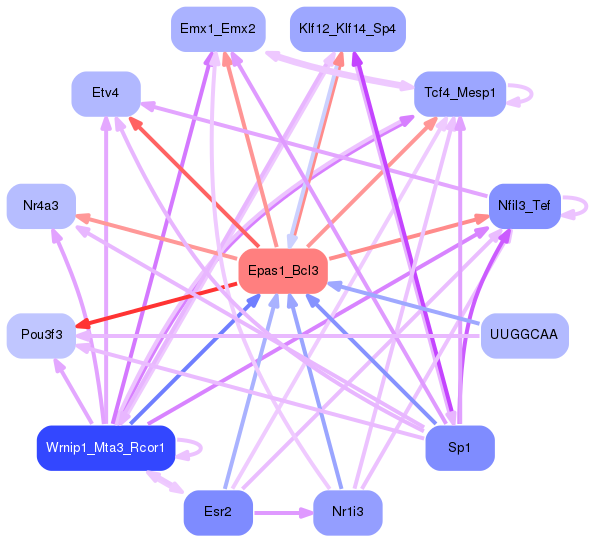
Results for Epas1_Bcl3
Z-value: 2.73
Motif logo
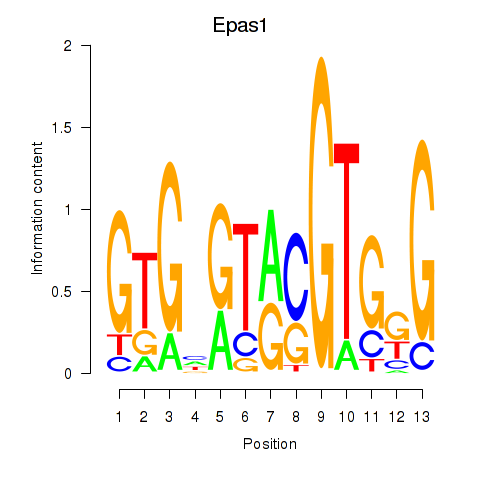
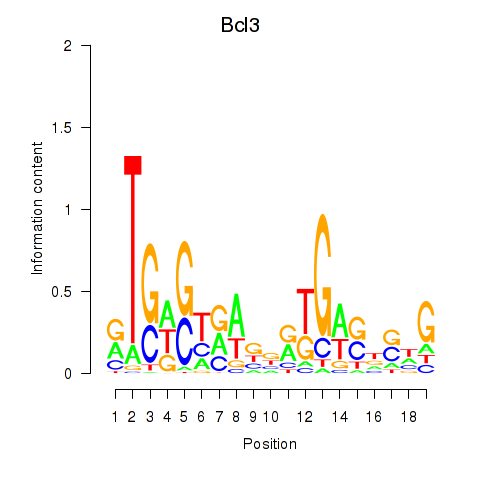
Transcription factors associated with Epas1_Bcl3
| Gene Symbol | Gene ID | Gene Info |
|---|---|---|
|
Epas1
|
ENSMUSG00000024140.11 | Epas1 |
|
Bcl3
|
ENSMUSG00000053175.18 | Bcl3 |
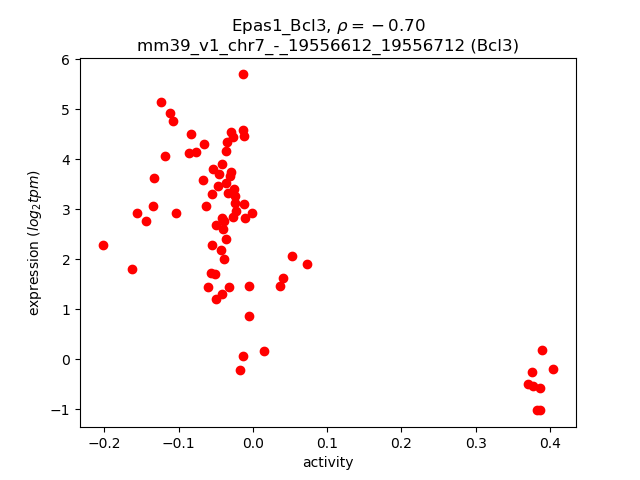
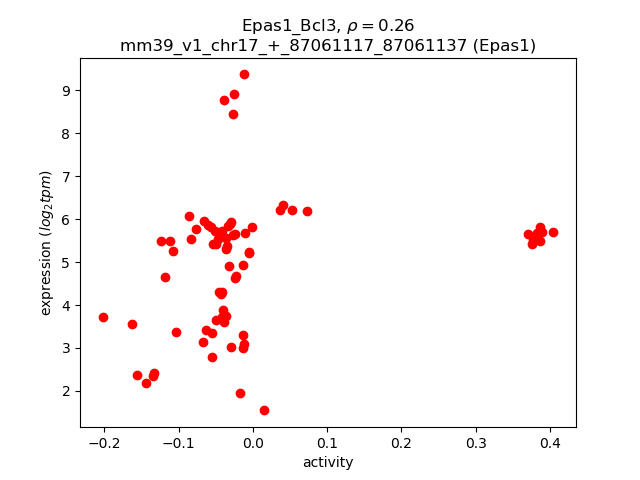
Activity-expression correlation:
| Gene | Promoter | Pearson corr. coef. | P-value | Plot |
|---|---|---|---|---|
| Bcl3 | mm39_v1_chr7_-_19556612_19556712 | -0.70 | 9.6e-12 | Click! |
| Epas1 | mm39_v1_chr17_+_87061117_87061137 | 0.26 | 3.1e-02 | Click! |
Activity profile of Epas1_Bcl3 motif
Sorted Z-values of Epas1_Bcl3 motif
Network of associatons between targets according to the STRING database.

First level regulatory network of Epas1_Bcl3
| Promoter | Score | Transcript | Gene | Gene Info |
|---|---|---|---|---|
| chr18_-_25886908 | 40.46 |
ENSMUST00000115816.3
ENSMUST00000223704.2 |
Celf4
|
CUGBP, Elav-like family member 4 |
| chr3_+_13538266 | 39.03 |
ENSMUST00000211860.2
|
Ralyl
|
RALY RNA binding protein-like |
| chr18_-_25886750 | 35.55 |
ENSMUST00000224553.2
ENSMUST00000025117.14 |
Celf4
|
CUGBP, Elav-like family member 4 |
| chr19_+_8641369 | 33.64 |
ENSMUST00000035444.10
ENSMUST00000163785.2 |
Chrm1
|
cholinergic receptor, muscarinic 1, CNS |
| chr17_+_49239393 | 32.60 |
ENSMUST00000046254.3
|
Lrfn2
|
leucine rich repeat and fibronectin type III domain containing 2 |
| chr9_+_26645024 | 31.91 |
ENSMUST00000160899.8
ENSMUST00000161431.3 ENSMUST00000159799.8 |
B3gat1
|
beta-1,3-glucuronyltransferase 1 (glucuronosyltransferase P) |
| chr15_+_82159398 | 30.12 |
ENSMUST00000023095.14
ENSMUST00000230365.2 |
Septin3
|
septin 3 |
| chr9_+_36744016 | 28.99 |
ENSMUST00000214772.2
|
Fez1
|
fasciculation and elongation protein zeta 1 (zygin I) |
| chr18_-_25887173 | 27.28 |
ENSMUST00000225477.2
|
Celf4
|
CUGBP, Elav-like family member 4 |
| chr15_+_81820954 | 27.26 |
ENSMUST00000038757.8
ENSMUST00000230633.2 |
Csdc2
|
cold shock domain containing C2, RNA binding |
| chr6_-_112924205 | 26.47 |
ENSMUST00000088373.11
|
Srgap3
|
SLIT-ROBO Rho GTPase activating protein 3 |
| chr9_-_29874401 | 25.98 |
ENSMUST00000075069.11
|
Ntm
|
neurotrimin |
| chr14_-_9015639 | 25.18 |
ENSMUST00000112656.4
|
Synpr
|
synaptoporin |
| chr4_+_123077515 | 24.87 |
ENSMUST00000152194.2
|
Hpcal4
|
hippocalcin-like 4 |
| chr5_-_121147593 | 24.49 |
ENSMUST00000079204.9
|
Rph3a
|
rabphilin 3A |
| chr6_-_112923715 | 22.49 |
ENSMUST00000113169.9
|
Srgap3
|
SLIT-ROBO Rho GTPase activating protein 3 |
| chr16_+_5703134 | 22.01 |
ENSMUST00000230658.2
|
Rbfox1
|
RNA binding protein, fox-1 homolog (C. elegans) 1 |
| chr7_+_131568167 | 21.65 |
ENSMUST00000045840.5
|
Gpr26
|
G protein-coupled receptor 26 |
| chr8_+_31581635 | 20.89 |
ENSMUST00000161713.2
|
Dusp26
|
dual specificity phosphatase 26 (putative) |
| chr15_-_78602313 | 20.34 |
ENSMUST00000229441.2
|
Elfn2
|
leucine rich repeat and fibronectin type III, extracellular 2 |
| chr7_-_105218472 | 19.94 |
ENSMUST00000187683.7
ENSMUST00000210079.2 ENSMUST00000187051.7 ENSMUST00000189265.7 ENSMUST00000190369.7 |
Apbb1
|
amyloid beta (A4) precursor protein-binding, family B, member 1 |
| chr17_-_13087012 | 19.56 |
ENSMUST00000089015.10
|
Mas1
|
MAS1 oncogene |
| chr19_+_47217279 | 19.55 |
ENSMUST00000111807.5
|
Neurl1a
|
neuralized E3 ubiquitin protein ligase 1A |
| chr13_+_58955506 | 18.86 |
ENSMUST00000079828.7
|
Ntrk2
|
neurotrophic tyrosine kinase, receptor, type 2 |
| chr4_+_32983417 | 18.25 |
ENSMUST00000084747.6
|
Rragd
|
Ras-related GTP binding D |
| chr10_-_10958031 | 18.21 |
ENSMUST00000105561.9
ENSMUST00000044306.13 |
Grm1
|
glutamate receptor, metabotropic 1 |
| chr19_-_41732104 | 18.12 |
ENSMUST00000025993.10
|
Slit1
|
slit guidance ligand 1 |
| chr11_-_97040858 | 17.88 |
ENSMUST00000118375.8
|
Tbkbp1
|
TBK1 binding protein 1 |
| chr5_-_9775151 | 17.68 |
ENSMUST00000004076.5
|
Grm3
|
glutamate receptor, metabotropic 3 |
| chr16_-_38533597 | 17.47 |
ENSMUST00000023487.5
|
Arhgap31
|
Rho GTPase activating protein 31 |
| chr4_+_127881786 | 17.36 |
ENSMUST00000184063.3
|
Csmd2
|
CUB and Sushi multiple domains 2 |
| chr12_+_61570669 | 16.35 |
ENSMUST00000055815.14
ENSMUST00000119481.2 |
Lrfn5
|
leucine rich repeat and fibronectin type III domain containing 5 |
| chr9_+_21108001 | 16.26 |
ENSMUST00000003395.10
|
Pde4a
|
phosphodiesterase 4A, cAMP specific |
| chr11_-_42070517 | 16.12 |
ENSMUST00000206105.2
ENSMUST00000153147.3 |
Gabra1
|
gamma-aminobutyric acid (GABA) A receptor, subunit alpha 1 |
| chr5_-_129030367 | 16.02 |
ENSMUST00000111346.6
ENSMUST00000200470.5 |
Rimbp2
|
RIMS binding protein 2 |
| chr5_-_129030111 | 15.95 |
ENSMUST00000196085.5
|
Rimbp2
|
RIMS binding protein 2 |
| chr3_-_80710097 | 15.91 |
ENSMUST00000075316.10
ENSMUST00000107745.8 |
Gria2
|
glutamate receptor, ionotropic, AMPA2 (alpha 2) |
| chr10_+_127561259 | 15.75 |
ENSMUST00000026466.5
|
Tac2
|
tachykinin 2 |
| chr7_-_139662402 | 15.70 |
ENSMUST00000026541.15
ENSMUST00000211283.2 |
Caly
|
calcyon neuron-specific vesicular protein |
| chr3_-_127019496 | 15.70 |
ENSMUST00000182064.9
ENSMUST00000182452.8 |
Ank2
|
ankyrin 2, brain |
| chr5_+_27109679 | 15.41 |
ENSMUST00000120555.8
|
Dpp6
|
dipeptidylpeptidase 6 |
| chr14_+_55747902 | 15.36 |
ENSMUST00000165262.8
ENSMUST00000074225.11 |
Cpne6
|
copine VI |
| chr15_-_37458768 | 15.34 |
ENSMUST00000116445.9
|
Ncald
|
neurocalcin delta |
| chr12_+_37930169 | 15.31 |
ENSMUST00000221176.2
|
Dgkb
|
diacylglycerol kinase, beta |
| chr11_+_71640739 | 15.15 |
ENSMUST00000150531.2
|
Wscd1
|
WSC domain containing 1 |
| chr12_-_14202041 | 15.02 |
ENSMUST00000020926.8
|
Lratd1
|
LRAT domain containing 1 |
| chr5_-_30619246 | 14.76 |
ENSMUST00000114747.9
ENSMUST00000074171.10 |
Otof
|
otoferlin |
| chr1_+_42734051 | 14.75 |
ENSMUST00000239323.2
ENSMUST00000199521.5 ENSMUST00000176807.3 |
Pou3f3
Gm20646
|
POU domain, class 3, transcription factor 3 predicted gene 20646 |
| chr15_+_44059531 | 14.55 |
ENSMUST00000038856.14
ENSMUST00000110289.4 |
Trhr
|
thyrotropin releasing hormone receptor |
| chr19_+_23736205 | 14.48 |
ENSMUST00000025830.9
|
Apba1
|
amyloid beta (A4) precursor protein binding, family A, member 1 |
| chr9_+_26645141 | 14.42 |
ENSMUST00000115269.9
|
B3gat1
|
beta-1,3-glucuronyltransferase 1 (glucuronosyltransferase P) |
| chr2_-_52566583 | 14.42 |
ENSMUST00000178799.8
|
Cacnb4
|
calcium channel, voltage-dependent, beta 4 subunit |
| chrX_-_63320543 | 14.31 |
ENSMUST00000114679.2
ENSMUST00000069926.14 |
Slitrk4
|
SLIT and NTRK-like family, member 4 |
| chr7_-_139662135 | 13.73 |
ENSMUST00000211044.2
|
Caly
|
calcyon neuron-specific vesicular protein |
| chr10_-_5500636 | 13.61 |
ENSMUST00000215295.2
ENSMUST00000041639.7 |
Syne1
|
spectrin repeat containing, nuclear envelope 1 |
| chr2_+_106525938 | 13.33 |
ENSMUST00000016530.14
|
Mpped2
|
metallophosphoesterase domain containing 2 |
| chr4_-_46991842 | 12.76 |
ENSMUST00000107749.4
|
Gabbr2
|
gamma-aminobutyric acid (GABA) B receptor, 2 |
| chr5_+_27466914 | 12.62 |
ENSMUST00000101471.4
|
Dpp6
|
dipeptidylpeptidase 6 |
| chr2_-_66240408 | 12.44 |
ENSMUST00000112366.8
|
Scn1a
|
sodium channel, voltage-gated, type I, alpha |
| chr7_-_139662159 | 12.34 |
ENSMUST00000166758.4
|
Caly
|
calcyon neuron-specific vesicular protein |
| chr3_+_96503944 | 12.33 |
ENSMUST00000058943.8
|
Ankrd34a
|
ankyrin repeat domain 34A |
| chr15_+_99568208 | 12.28 |
ENSMUST00000023758.9
|
Asic1
|
acid-sensing (proton-gated) ion channel 1 |
| chr7_+_122270599 | 12.25 |
ENSMUST00000182563.2
|
Cacng3
|
calcium channel, voltage-dependent, gamma subunit 3 |
| chr7_-_4550523 | 12.24 |
ENSMUST00000206023.2
|
Syt5
|
synaptotagmin V |
| chr16_-_31133622 | 12.23 |
ENSMUST00000115230.2
ENSMUST00000130560.8 |
Apod
|
apolipoprotein D |
| chr10_-_114638202 | 12.20 |
ENSMUST00000239411.2
|
Trhde
|
TRH-degrading enzyme |
| chr11_-_97466035 | 12.16 |
ENSMUST00000107596.9
ENSMUST00000238314.2 ENSMUST00000238597.2 ENSMUST00000238342.2 |
Srcin1
|
SRC kinase signaling inhibitor 1 |
| chr11_-_97427757 | 12.14 |
ENSMUST00000238233.2
|
Srcin1
|
SRC kinase signaling inhibitor 1 |
| chr4_-_131871797 | 11.82 |
ENSMUST00000056336.2
|
Oprd1
|
opioid receptor, delta 1 |
| chr7_-_30614249 | 11.56 |
ENSMUST00000190950.7
ENSMUST00000187137.7 ENSMUST00000190638.7 |
Mag
|
myelin-associated glycoprotein |
| chr4_+_124774692 | 11.53 |
ENSMUST00000059343.7
|
Epha10
|
Eph receptor A10 |
| chr7_+_122270623 | 11.49 |
ENSMUST00000182095.2
|
Cacng3
|
calcium channel, voltage-dependent, gamma subunit 3 |
| chr14_-_55231998 | 11.48 |
ENSMUST00000227518.2
ENSMUST00000226424.2 ENSMUST00000153783.2 ENSMUST00000102803.11 ENSMUST00000168485.8 |
Myh7
|
myosin, heavy polypeptide 7, cardiac muscle, beta |
| chr19_+_10366753 | 11.34 |
ENSMUST00000169121.9
ENSMUST00000076968.11 ENSMUST00000235479.2 ENSMUST00000223586.2 ENSMUST00000235784.2 ENSMUST00000224135.3 ENSMUST00000225452.3 ENSMUST00000237366.2 |
Syt7
|
synaptotagmin VII |
| chr10_+_69369632 | 11.16 |
ENSMUST00000182155.8
ENSMUST00000183169.8 ENSMUST00000183148.8 |
Ank3
|
ankyrin 3, epithelial |
| chr1_+_152275575 | 11.03 |
ENSMUST00000044311.9
|
Colgalt2
|
collagen beta(1-O)galactosyltransferase 2 |
| chr4_-_110143777 | 10.96 |
ENSMUST00000138972.8
|
Elavl4
|
ELAV like RNA binding protein 4 |
| chr10_+_69369854 | 10.90 |
ENSMUST00000182557.8
|
Ank3
|
ankyrin 3, epithelial |
| chr19_+_16933471 | 10.80 |
ENSMUST00000087689.5
|
Prune2
|
prune homolog 2 |
| chrX_+_158197568 | 10.79 |
ENSMUST00000112471.9
|
Map7d2
|
MAP7 domain containing 2 |
| chr7_-_100306160 | 10.67 |
ENSMUST00000107046.8
ENSMUST00000107045.9 ENSMUST00000139708.9 |
Plekhb1
|
pleckstrin homology domain containing, family B (evectins) member 1 |
| chr11_-_33793461 | 10.65 |
ENSMUST00000101368.9
ENSMUST00000065970.6 ENSMUST00000109340.9 |
Kcnip1
|
Kv channel-interacting protein 1 |
| chrX_-_94209913 | 10.63 |
ENSMUST00000113873.9
ENSMUST00000113876.9 ENSMUST00000199920.5 ENSMUST00000113885.8 ENSMUST00000113883.8 ENSMUST00000196012.2 ENSMUST00000182001.8 ENSMUST00000113878.8 ENSMUST00000113882.8 ENSMUST00000182562.2 |
Arhgef9
|
CDC42 guanine nucleotide exchange factor (GEF) 9 |
| chr13_+_58955675 | 10.52 |
ENSMUST00000224402.2
|
Ntrk2
|
neurotrophic tyrosine kinase, receptor, type 2 |
| chr11_-_28534260 | 10.50 |
ENSMUST00000093253.10
ENSMUST00000109502.9 ENSMUST00000042534.15 |
Ccdc85a
|
coiled-coil domain containing 85A |
| chr6_-_136150076 | 10.49 |
ENSMUST00000053880.13
|
Grin2b
|
glutamate receptor, ionotropic, NMDA2B (epsilon 2) |
| chr7_+_43959637 | 10.40 |
ENSMUST00000107938.8
|
Shank1
|
SH3 and multiple ankyrin repeat domains 1 |
| chr5_+_81169049 | 10.28 |
ENSMUST00000117253.8
ENSMUST00000120128.8 |
Adgrl3
|
adhesion G protein-coupled receptor L3 |
| chr18_+_59195534 | 10.26 |
ENSMUST00000058633.9
ENSMUST00000175897.8 ENSMUST00000118510.8 ENSMUST00000175830.2 |
Minar2
|
membrane integral NOTCH2 associated receptor 2 |
| chr6_+_128376729 | 10.19 |
ENSMUST00000001561.12
|
Nrip2
|
nuclear receptor interacting protein 2 |
| chr11_-_101676076 | 10.16 |
ENSMUST00000164750.8
ENSMUST00000107176.8 ENSMUST00000017868.7 |
Etv4
|
ets variant 4 |
| chr17_+_8744201 | 10.12 |
ENSMUST00000115715.8
|
Pde10a
|
phosphodiesterase 10A |
| chr18_+_61058684 | 10.11 |
ENSMUST00000102888.10
ENSMUST00000025519.11 |
Camk2a
|
calcium/calmodulin-dependent protein kinase II alpha |
| chr13_-_110417421 | 9.98 |
ENSMUST00000223922.2
|
Rab3c
|
RAB3C, member RAS oncogene family |
| chr9_-_102231884 | 9.80 |
ENSMUST00000035129.14
ENSMUST00000085169.12 ENSMUST00000149800.3 |
Ephb1
|
Eph receptor B1 |
| chr8_+_119010458 | 9.79 |
ENSMUST00000117160.2
|
Cdh13
|
cadherin 13 |
| chr16_-_23339329 | 9.75 |
ENSMUST00000230040.2
ENSMUST00000229619.2 |
Masp1
|
mannan-binding lectin serine peptidase 1 |
| chr10_+_69369590 | 9.65 |
ENSMUST00000182884.8
|
Ank3
|
ankyrin 3, epithelial |
| chr15_+_34837501 | 9.60 |
ENSMUST00000072868.5
|
Kcns2
|
K+ voltage-gated channel, subfamily S, 2 |
| chr5_-_8672951 | 9.49 |
ENSMUST00000047485.15
ENSMUST00000115378.2 |
Rundc3b
|
RUN domain containing 3B |
| chr8_-_49009043 | 9.43 |
ENSMUST00000110343.3
|
Tenm3
|
teneurin transmembrane protein 3 |
| chr7_+_3352019 | 9.41 |
ENSMUST00000100301.11
|
Prkcg
|
protein kinase C, gamma |
| chr2_+_143388062 | 9.31 |
ENSMUST00000028905.10
|
Pcsk2
|
proprotein convertase subtilisin/kexin type 2 |
| chr8_+_111448092 | 9.30 |
ENSMUST00000052457.15
|
Mtss2
|
MTSS I-BAR domain containing 2 |
| chr10_+_127256192 | 9.30 |
ENSMUST00000171434.8
|
R3hdm2
|
R3H domain containing 2 |
| chr9_+_89791943 | 9.22 |
ENSMUST00000189545.2
ENSMUST00000034909.11 ENSMUST00000034912.6 |
Rasgrf1
|
RAS protein-specific guanine nucleotide-releasing factor 1 |
| chr12_+_16703709 | 9.02 |
ENSMUST00000221049.2
|
Ntsr2
|
neurotensin receptor 2 |
| chr3_+_28317570 | 9.02 |
ENSMUST00000160307.9
ENSMUST00000159680.9 ENSMUST00000160518.8 ENSMUST00000162485.8 ENSMUST00000159308.8 ENSMUST00000162777.8 ENSMUST00000161964.2 |
Tnik
|
TRAF2 and NCK interacting kinase |
| chr7_+_29007349 | 8.79 |
ENSMUST00000108230.8
ENSMUST00000065181.12 |
Dpf1
|
D4, zinc and double PHD fingers family 1 |
| chr4_+_123077286 | 8.75 |
ENSMUST00000126995.2
|
Hpcal4
|
hippocalcin-like 4 |
| chr1_+_75483721 | 8.75 |
ENSMUST00000037330.5
|
Inha
|
inhibin alpha |
| chr5_-_74838461 | 8.70 |
ENSMUST00000117525.8
ENSMUST00000113531.9 ENSMUST00000039744.13 ENSMUST00000121690.8 |
Lnx1
|
ligand of numb-protein X 1 |
| chr5_+_35915217 | 8.69 |
ENSMUST00000101280.10
ENSMUST00000054598.12 ENSMUST00000114205.8 ENSMUST00000114206.9 |
Ablim2
|
actin-binding LIM protein 2 |
| chr9_-_50639367 | 8.59 |
ENSMUST00000117646.8
|
Dixdc1
|
DIX domain containing 1 |
| chr5_+_130477642 | 8.57 |
ENSMUST00000111288.4
|
Caln1
|
calneuron 1 |
| chr13_-_96269076 | 8.55 |
ENSMUST00000161263.8
|
Sv2c
|
synaptic vesicle glycoprotein 2c |
| chr6_+_128376844 | 8.46 |
ENSMUST00000120405.4
|
Nrip2
|
nuclear receptor interacting protein 2 |
| chr7_-_46782448 | 8.43 |
ENSMUST00000033142.13
|
Ptpn5
|
protein tyrosine phosphatase, non-receptor type 5 |
| chr14_+_84680993 | 8.41 |
ENSMUST00000071370.7
|
Pcdh17
|
protocadherin 17 |
| chr10_-_108846816 | 8.28 |
ENSMUST00000105276.8
ENSMUST00000064054.14 |
Syt1
|
synaptotagmin I |
| chr15_+_81821112 | 8.26 |
ENSMUST00000135663.2
|
Csdc2
|
cold shock domain containing C2, RNA binding |
| chr9_-_4795519 | 8.03 |
ENSMUST00000212533.2
|
Gria4
|
glutamate receptor, ionotropic, AMPA4 (alpha 4) |
| chr18_-_60781365 | 7.97 |
ENSMUST00000143275.3
|
Synpo
|
synaptopodin |
| chr14_-_70867588 | 7.96 |
ENSMUST00000228009.2
|
Dmtn
|
dematin actin binding protein |
| chr9_-_56703422 | 7.81 |
ENSMUST00000210032.2
|
Lingo1
|
leucine rich repeat and Ig domain containing 1 |
| chr10_+_69370038 | 7.75 |
ENSMUST00000182439.8
ENSMUST00000092434.12 ENSMUST00000047061.13 ENSMUST00000092432.12 ENSMUST00000092431.12 ENSMUST00000054167.15 |
Ank3
|
ankyrin 3, epithelial |
| chr16_-_88087087 | 7.67 |
ENSMUST00000211444.2
ENSMUST00000023652.16 ENSMUST00000072256.13 |
Grik1
|
glutamate receptor, ionotropic, kainate 1 |
| chr3_-_79645101 | 7.56 |
ENSMUST00000078527.13
|
Rxfp1
|
relaxin/insulin-like family peptide receptor 1 |
| chrX_+_100342749 | 7.56 |
ENSMUST00000118111.8
ENSMUST00000130555.8 ENSMUST00000151528.8 |
Nlgn3
|
neuroligin 3 |
| chr10_+_126914755 | 7.50 |
ENSMUST00000039259.7
ENSMUST00000217941.2 |
Agap2
|
ArfGAP with GTPase domain, ankyrin repeat and PH domain 2 |
| chr10_+_103203552 | 7.48 |
ENSMUST00000179636.3
ENSMUST00000217905.2 ENSMUST00000074204.12 |
Slc6a15
|
solute carrier family 6 (neurotransmitter transporter), member 15 |
| chr13_+_43070127 | 7.48 |
ENSMUST00000239286.2
|
Phactr1
|
phosphatase and actin regulator 1 |
| chr15_-_77191079 | 7.47 |
ENSMUST00000171751.10
|
Rbfox2
|
RNA binding protein, fox-1 homolog (C. elegans) 2 |
| chr10_+_106306122 | 7.44 |
ENSMUST00000029404.17
ENSMUST00000217854.2 |
Ppfia2
|
protein tyrosine phosphatase, receptor type, f polypeptide (PTPRF), interacting protein (liprin), alpha 2 |
| chr11_-_28533995 | 7.42 |
ENSMUST00000146385.9
|
Ccdc85a
|
coiled-coil domain containing 85A |
| chr7_-_27146024 | 7.41 |
ENSMUST00000011895.14
|
Sptbn4
|
spectrin beta, non-erythrocytic 4 |
| chr1_+_166081664 | 7.17 |
ENSMUST00000111416.7
|
Ildr2
|
immunoglobulin-like domain containing receptor 2 |
| chr11_-_118460736 | 7.04 |
ENSMUST00000136551.3
|
Rbfox3
|
RNA binding protein, fox-1 homolog (C. elegans) 3 |
| chr15_-_77037756 | 7.04 |
ENSMUST00000227314.2
ENSMUST00000227930.2 ENSMUST00000227533.2 |
Rbfox2
|
RNA binding protein, fox-1 homolog (C. elegans) 2 |
| chr2_-_113047397 | 7.01 |
ENSMUST00000080673.13
ENSMUST00000208151.2 ENSMUST00000208290.2 |
Ryr3
|
ryanodine receptor 3 |
| chr13_-_92268156 | 6.98 |
ENSMUST00000151408.9
ENSMUST00000216219.2 |
Rasgrf2
|
RAS protein-specific guanine nucleotide-releasing factor 2 |
| chr6_+_8949669 | 6.93 |
ENSMUST00000060369.4
|
Nxph1
|
neurexophilin 1 |
| chr9_+_20779924 | 6.92 |
ENSMUST00000043911.8
|
Shfl
|
shiftless antiviral inhibitor of ribosomal frameshifting |
| chr19_-_6910922 | 6.91 |
ENSMUST00000235248.2
|
Kcnk4
|
potassium channel, subfamily K, member 4 |
| chr5_-_68004743 | 6.86 |
ENSMUST00000072971.13
ENSMUST00000113652.8 ENSMUST00000113651.8 ENSMUST00000037380.15 |
Atp8a1
|
ATPase, aminophospholipid transporter (APLT), class I, type 8A, member 1 |
| chr13_+_55517545 | 6.82 |
ENSMUST00000063771.14
|
Rgs14
|
regulator of G-protein signaling 14 |
| chr1_+_66361252 | 6.81 |
ENSMUST00000123647.8
|
Map2
|
microtubule-associated protein 2 |
| chr17_+_44264130 | 6.77 |
ENSMUST00000229240.2
|
Rcan2
|
regulator of calcineurin 2 |
| chr11_-_37126709 | 6.76 |
ENSMUST00000102801.8
|
Tenm2
|
teneurin transmembrane protein 2 |
| chr15_-_77037972 | 6.75 |
ENSMUST00000111581.4
ENSMUST00000166610.8 |
Rbfox2
|
RNA binding protein, fox-1 homolog (C. elegans) 2 |
| chr6_-_88852017 | 6.75 |
ENSMUST00000145944.3
|
Podxl2
|
podocalyxin-like 2 |
| chrX_-_100129626 | 6.72 |
ENSMUST00000113710.8
|
Slc7a3
|
solute carrier family 7 (cationic amino acid transporter, y+ system), member 3 |
| chr7_+_30758767 | 6.68 |
ENSMUST00000039775.9
|
Lgi4
|
leucine-rich repeat LGI family, member 4 |
| chr5_+_81169430 | 6.67 |
ENSMUST00000121707.8
|
Adgrl3
|
adhesion G protein-coupled receptor L3 |
| chr7_+_4693603 | 6.45 |
ENSMUST00000120836.8
|
Brsk1
|
BR serine/threonine kinase 1 |
| chr1_+_166081755 | 6.41 |
ENSMUST00000194964.6
ENSMUST00000192638.6 ENSMUST00000192426.6 ENSMUST00000195557.6 ENSMUST00000192732.6 ENSMUST00000193860.2 |
Ildr2
|
immunoglobulin-like domain containing receptor 2 |
| chrX_+_47608122 | 6.37 |
ENSMUST00000033430.3
|
Rab33a
|
RAB33A, member RAS oncogene family |
| chr14_-_9015757 | 6.36 |
ENSMUST00000153954.8
|
Synpr
|
synaptoporin |
| chr13_+_89687915 | 6.29 |
ENSMUST00000022108.9
|
Hapln1
|
hyaluronan and proteoglycan link protein 1 |
| chr7_+_128858730 | 6.27 |
ENSMUST00000094018.6
ENSMUST00000205896.2 |
Plpp4
|
phospholipid phosphatase 4 |
| chr15_+_81686622 | 6.26 |
ENSMUST00000109553.10
|
Tef
|
thyrotroph embryonic factor |
| chr14_-_100522101 | 6.24 |
ENSMUST00000228216.2
|
Klf12
|
Kruppel-like factor 12 |
| chr7_+_4693759 | 6.22 |
ENSMUST00000048248.9
|
Brsk1
|
BR serine/threonine kinase 1 |
| chr3_+_105359641 | 6.19 |
ENSMUST00000098761.10
|
Kcnd3
|
potassium voltage-gated channel, Shal-related family, member 3 |
| chr19_-_50667079 | 6.19 |
ENSMUST00000209413.2
ENSMUST00000072685.13 ENSMUST00000164039.9 |
Sorcs1
|
sortilin-related VPS10 domain containing receptor 1 |
| chr4_+_49059255 | 6.17 |
ENSMUST00000076670.3
|
Plppr1
|
phospholipid phosphatase related 1 |
| chr5_-_135518098 | 6.17 |
ENSMUST00000201998.2
|
Hip1
|
huntingtin interacting protein 1 |
| chr17_+_44263890 | 6.16 |
ENSMUST00000177857.9
ENSMUST00000044792.6 |
Rcan2
|
regulator of calcineurin 2 |
| chr14_-_70864666 | 6.15 |
ENSMUST00000022694.17
|
Dmtn
|
dematin actin binding protein |
| chr5_-_116584765 | 6.06 |
ENSMUST00000139425.2
|
Srrm4
|
serine/arginine repetitive matrix 4 |
| chr11_+_98239230 | 6.03 |
ENSMUST00000078694.13
|
Ppp1r1b
|
protein phosphatase 1, regulatory inhibitor subunit 1B |
| chr18_-_77652820 | 5.98 |
ENSMUST00000026494.14
ENSMUST00000182024.2 |
Rnf165
|
ring finger protein 165 |
| chr1_+_34840785 | 5.95 |
ENSMUST00000047664.16
ENSMUST00000211073.2 |
Arhgef4
SMIM39
|
Rho guanine nucleotide exchange factor (GEF) 4 novel protein |
| chr2_-_91014163 | 5.92 |
ENSMUST00000077941.13
ENSMUST00000111381.9 ENSMUST00000111372.8 ENSMUST00000111371.8 ENSMUST00000075269.10 ENSMUST00000066473.12 |
Madd
|
MAP-kinase activating death domain |
| chr2_-_79959802 | 5.90 |
ENSMUST00000102653.8
|
Pde1a
|
phosphodiesterase 1A, calmodulin-dependent |
| chr8_-_41087793 | 5.90 |
ENSMUST00000173957.2
ENSMUST00000048898.17 ENSMUST00000174205.8 |
Mtmr7
|
myotubularin related protein 7 |
| chr3_+_102642272 | 5.86 |
ENSMUST00000196611.5
|
Tspan2
|
tetraspanin 2 |
| chr17_+_93506590 | 5.83 |
ENSMUST00000064775.8
|
Adcyap1
|
adenylate cyclase activating polypeptide 1 |
| chr4_+_127062924 | 5.82 |
ENSMUST00000046659.14
|
Dlgap3
|
DLG associated protein 3 |
| chr18_+_61058716 | 5.80 |
ENSMUST00000115297.8
|
Camk2a
|
calcium/calmodulin-dependent protein kinase II alpha |
| chr17_-_29457064 | 5.75 |
ENSMUST00000024805.15
|
Cpne5
|
copine V |
| chr9_+_95441652 | 5.73 |
ENSMUST00000079597.7
|
Paqr9
|
progestin and adipoQ receptor family member IX |
| chr15_-_77190774 | 5.47 |
ENSMUST00000048145.13
|
Rbfox2
|
RNA binding protein, fox-1 homolog (C. elegans) 2 |
| chr9_-_89620461 | 5.45 |
ENSMUST00000060700.4
ENSMUST00000185470.3 |
Ankrd34c
|
ankyrin repeat domain 34C |
| chrX_+_100342813 | 5.43 |
ENSMUST00000065858.3
|
Nlgn3
|
neuroligin 3 |
| chr11_+_97340962 | 5.34 |
ENSMUST00000107601.8
|
Arhgap23
|
Rho GTPase activating protein 23 |
| chr6_+_85164420 | 5.30 |
ENSMUST00000045942.9
|
Emx1
|
empty spiracles homeobox 1 |
| chr4_+_17853452 | 5.27 |
ENSMUST00000029881.10
|
Mmp16
|
matrix metallopeptidase 16 |
| chr8_+_63404395 | 5.21 |
ENSMUST00000119068.8
|
Spock3
|
sparc/osteonectin, cwcv and kazal-like domains proteoglycan 3 |
| chr8_+_63404228 | 5.16 |
ENSMUST00000118003.8
|
Spock3
|
sparc/osteonectin, cwcv and kazal-like domains proteoglycan 3 |
| chr18_+_69654231 | 5.11 |
ENSMUST00000202350.4
ENSMUST00000202477.4 |
Tcf4
|
transcription factor 4 |
| chr15_-_77191204 | 5.11 |
ENSMUST00000228582.2
|
Rbfox2
|
RNA binding protein, fox-1 homolog (C. elegans) 2 |
| chr4_+_48045143 | 4.98 |
ENSMUST00000030025.10
|
Nr4a3
|
nuclear receptor subfamily 4, group A, member 3 |
| chr13_+_112425113 | 4.96 |
ENSMUST00000165593.9
|
Ankrd55
|
ankyrin repeat domain 55 |
| chr9_-_50650663 | 4.90 |
ENSMUST00000117093.2
ENSMUST00000121634.8 |
Dixdc1
|
DIX domain containing 1 |
| chr2_-_63014622 | 4.80 |
ENSMUST00000075052.10
ENSMUST00000112454.8 |
Kcnh7
|
potassium voltage-gated channel, subfamily H (eag-related), member 7 |
| chr4_-_110149916 | 4.79 |
ENSMUST00000106601.8
|
Elavl4
|
ELAV like RNA binding protein 4 |
| chr5_-_137246611 | 4.76 |
ENSMUST00000196391.5
|
Muc3a
|
mucin 3A, cell surface associated |
| chr5_-_68004702 | 4.73 |
ENSMUST00000135930.8
|
Atp8a1
|
ATPase, aminophospholipid transporter (APLT), class I, type 8A, member 1 |
| chr6_+_83133381 | 4.66 |
ENSMUST00000032106.6
|
1700003E16Rik
|
RIKEN cDNA 1700003E16 gene |
Gene Ontology Analysis
Gene overrepresentation in biological process category:
| Log-likelihood per target | Total log-likelihood | Term | Description |
|---|---|---|---|
| 7.6 | 37.9 | GO:0007207 | adenylate cyclase-inhibiting G-protein coupled acetylcholine receptor signaling pathway(GO:0007197) phospholipase C-activating G-protein coupled acetylcholine receptor signaling pathway(GO:0007207) |
| 7.5 | 104.7 | GO:1902866 | regulation of retina development in camera-type eye(GO:1902866) |
| 5.7 | 28.7 | GO:0099566 | regulation of postsynaptic cytosolic calcium ion concentration(GO:0099566) |
| 5.2 | 15.6 | GO:1990926 | short-term synaptic potentiation(GO:1990926) |
| 4.9 | 29.4 | GO:0099551 | synaptic signaling via neuropeptide(GO:0099538) trans-synaptic signaling by neuropeptide(GO:0099540) trans-synaptic signaling by neuropeptide, modulating synaptic transmission(GO:0099551) |
| 4.3 | 13.0 | GO:2000331 | regulation of terminal button organization(GO:2000331) |
| 4.2 | 20.9 | GO:1902310 | positive regulation of peptidyl-serine dephosphorylation(GO:1902310) |
| 4.1 | 12.2 | GO:0034443 | negative regulation of lipoprotein oxidation(GO:0034443) |
| 3.8 | 11.5 | GO:0014862 | regulation of the force of skeletal muscle contraction(GO:0014728) regulation of skeletal muscle contraction by chemo-mechanical energy conversion(GO:0014862) |
| 3.8 | 22.6 | GO:0033563 | dorsal/ventral axon guidance(GO:0033563) |
| 3.7 | 14.7 | GO:0072233 | ascending thin limb development(GO:0072021) thick ascending limb development(GO:0072023) metanephric ascending thin limb development(GO:0072218) metanephric thick ascending limb development(GO:0072233) |
| 3.3 | 19.9 | GO:0050757 | thymidylate synthase biosynthetic process(GO:0050757) regulation of thymidylate synthase biosynthetic process(GO:0050758) negative regulation of thymidylate synthase biosynthetic process(GO:0050760) |
| 3.1 | 9.3 | GO:0030070 | insulin processing(GO:0030070) |
| 3.0 | 39.5 | GO:0010650 | positive regulation of cell communication by electrical coupling(GO:0010650) positive regulation of membrane depolarization during cardiac muscle cell action potential(GO:1900827) |
| 2.7 | 34.5 | GO:0010724 | regulation of definitive erythrocyte differentiation(GO:0010724) |
| 2.6 | 10.4 | GO:0046959 | habituation(GO:0046959) |
| 2.5 | 7.6 | GO:0060618 | nipple development(GO:0060618) |
| 2.4 | 14.1 | GO:0035585 | calcium-mediated signaling using extracellular calcium source(GO:0035585) |
| 2.2 | 20.1 | GO:0036371 | protein localization to M-band(GO:0036309) protein localization to T-tubule(GO:0036371) |
| 2.1 | 8.4 | GO:2001025 | positive regulation of response to drug(GO:2001025) |
| 2.0 | 12.3 | GO:0050915 | sensory perception of sour taste(GO:0050915) |
| 2.0 | 18.2 | GO:0071233 | response to leucine(GO:0043201) cellular response to leucine(GO:0071233) |
| 2.0 | 59.5 | GO:0030204 | chondroitin sulfate metabolic process(GO:0030204) |
| 2.0 | 5.9 | GO:1902277 | negative regulation of pancreatic amylase secretion(GO:1902277) |
| 2.0 | 15.8 | GO:0007217 | tachykinin receptor signaling pathway(GO:0007217) |
| 2.0 | 9.8 | GO:2001015 | negative regulation of skeletal muscle cell differentiation(GO:2001015) |
| 1.9 | 13.6 | GO:0090292 | nuclear matrix organization(GO:0043578) nuclear matrix anchoring at nuclear membrane(GO:0090292) |
| 1.9 | 26.9 | GO:0098870 | neuronal action potential propagation(GO:0019227) action potential propagation(GO:0098870) |
| 1.8 | 29.0 | GO:1902902 | negative regulation of autophagosome assembly(GO:1902902) |
| 1.7 | 8.7 | GO:0046882 | negative regulation of follicle-stimulating hormone secretion(GO:0046882) |
| 1.7 | 6.9 | GO:0071469 | cellular response to alkaline pH(GO:0071469) |
| 1.6 | 8.0 | GO:0098886 | modification of dendritic spine(GO:0098886) |
| 1.6 | 14.0 | GO:0061092 | regulation of phospholipid translocation(GO:0061091) positive regulation of phospholipid translocation(GO:0061092) |
| 1.5 | 6.2 | GO:2000588 | positive regulation of platelet-derived growth factor receptor-beta signaling pathway(GO:2000588) |
| 1.5 | 9.2 | GO:0032423 | regulation of mismatch repair(GO:0032423) |
| 1.5 | 4.4 | GO:0021934 | hindbrain tangential cell migration(GO:0021934) |
| 1.5 | 11.8 | GO:0038003 | opioid receptor signaling pathway(GO:0038003) |
| 1.4 | 18.7 | GO:0098989 | NMDA selective glutamate receptor signaling pathway(GO:0098989) |
| 1.4 | 7.1 | GO:0018125 | peptidyl-cysteine methylation(GO:0018125) |
| 1.4 | 16.8 | GO:0021869 | forebrain ventricular zone progenitor cell division(GO:0021869) |
| 1.4 | 9.8 | GO:0055096 | lipoprotein particle mediated signaling(GO:0055095) low-density lipoprotein particle mediated signaling(GO:0055096) |
| 1.4 | 19.6 | GO:0048170 | positive regulation of long-term neuronal synaptic plasticity(GO:0048170) |
| 1.4 | 27.8 | GO:0097264 | self proteolysis(GO:0097264) |
| 1.3 | 44.2 | GO:0048268 | clathrin coat assembly(GO:0048268) |
| 1.3 | 9.0 | GO:0007256 | activation of JNKK activity(GO:0007256) |
| 1.3 | 1.3 | GO:2000182 | regulation of progesterone biosynthetic process(GO:2000182) |
| 1.2 | 5.0 | GO:0032765 | positive regulation of mast cell cytokine production(GO:0032765) |
| 1.2 | 5.8 | GO:0071651 | positive regulation of chemokine (C-C motif) ligand 5 production(GO:0071651) |
| 1.1 | 6.7 | GO:0015819 | lysine transport(GO:0015819) |
| 1.1 | 14.6 | GO:0090073 | positive regulation of protein homodimerization activity(GO:0090073) |
| 1.1 | 29.9 | GO:0031987 | locomotion involved in locomotory behavior(GO:0031987) |
| 1.1 | 7.4 | GO:0043985 | histone H4-R3 methylation(GO:0043985) |
| 1.0 | 23.6 | GO:0035235 | ionotropic glutamate receptor signaling pathway(GO:0035235) |
| 1.0 | 3.1 | GO:0019464 | glycine catabolic process(GO:0006546) glycine decarboxylation via glycine cleavage system(GO:0019464) |
| 1.0 | 10.2 | GO:0033600 | negative regulation of mammary gland epithelial cell proliferation(GO:0033600) regulation of branching involved in mammary gland duct morphogenesis(GO:0060762) |
| 1.0 | 6.0 | GO:0007621 | negative regulation of female receptivity(GO:0007621) |
| 1.0 | 47.9 | GO:0048791 | calcium ion-regulated exocytosis of neurotransmitter(GO:0048791) |
| 1.0 | 5.9 | GO:0014005 | microglia differentiation(GO:0014004) microglia development(GO:0014005) |
| 1.0 | 5.8 | GO:0070164 | negative regulation of adiponectin secretion(GO:0070164) |
| 0.9 | 7.5 | GO:0015803 | branched-chain amino acid transport(GO:0015803) leucine transport(GO:0015820) |
| 0.9 | 19.6 | GO:0060732 | positive regulation of inositol phosphate biosynthetic process(GO:0060732) |
| 0.9 | 7.4 | GO:0045162 | clustering of voltage-gated sodium channels(GO:0045162) |
| 0.8 | 32.3 | GO:0006198 | cAMP catabolic process(GO:0006198) |
| 0.8 | 20.4 | GO:2001014 | regulation of skeletal muscle cell differentiation(GO:2001014) |
| 0.8 | 3.2 | GO:0031959 | mineralocorticoid receptor signaling pathway(GO:0031959) |
| 0.8 | 28.9 | GO:0007214 | gamma-aminobutyric acid signaling pathway(GO:0007214) |
| 0.8 | 2.4 | GO:0071503 | intrahepatic bile duct development(GO:0035622) retinal rod cell differentiation(GO:0060221) response to heparin(GO:0071503) cellular response to heparin(GO:0071504) renal vesicle induction(GO:0072034) |
| 0.8 | 14.8 | GO:0016082 | synaptic vesicle priming(GO:0016082) |
| 0.8 | 6.2 | GO:0097623 | potassium ion export across plasma membrane(GO:0097623) |
| 0.8 | 22.1 | GO:1903861 | positive regulation of dendrite extension(GO:1903861) |
| 0.8 | 11.4 | GO:0045760 | positive regulation of action potential(GO:0045760) |
| 0.7 | 9.6 | GO:1902259 | regulation of delayed rectifier potassium channel activity(GO:1902259) |
| 0.7 | 14.5 | GO:0014051 | gamma-aminobutyric acid secretion(GO:0014051) |
| 0.7 | 4.2 | GO:2000124 | regulation of endocannabinoid signaling pathway(GO:2000124) |
| 0.7 | 8.4 | GO:2000807 | regulation of synaptic vesicle clustering(GO:2000807) |
| 0.7 | 2.7 | GO:0060279 | striatal medium spiny neuron differentiation(GO:0021773) positive regulation of ovulation(GO:0060279) |
| 0.7 | 2.0 | GO:0060300 | regulation of cytokine activity(GO:0060300) |
| 0.7 | 8.7 | GO:0001867 | complement activation, lectin pathway(GO:0001867) |
| 0.6 | 4.4 | GO:0045218 | zonula adherens maintenance(GO:0045218) |
| 0.6 | 6.8 | GO:0031914 | negative regulation of synaptic plasticity(GO:0031914) |
| 0.6 | 39.9 | GO:1900449 | regulation of glutamate receptor signaling pathway(GO:1900449) |
| 0.6 | 1.2 | GO:0006649 | phospholipid transfer to membrane(GO:0006649) |
| 0.6 | 3.6 | GO:0014846 | esophagus smooth muscle contraction(GO:0014846) glial cell-derived neurotrophic factor receptor signaling pathway(GO:0035860) |
| 0.6 | 11.6 | GO:0022010 | central nervous system myelination(GO:0022010) axon ensheathment in central nervous system(GO:0032291) |
| 0.6 | 3.5 | GO:0034227 | tRNA thio-modification(GO:0034227) |
| 0.5 | 1.1 | GO:2000820 | negative regulation of transcription from RNA polymerase II promoter involved in smooth muscle cell differentiation(GO:2000820) |
| 0.5 | 2.6 | GO:0060907 | positive regulation of macrophage cytokine production(GO:0060907) |
| 0.5 | 3.2 | GO:0034436 | glycoprotein transport(GO:0034436) |
| 0.5 | 3.1 | GO:0051583 | dopamine uptake involved in synaptic transmission(GO:0051583) catecholamine uptake involved in synaptic transmission(GO:0051934) |
| 0.5 | 5.2 | GO:0032264 | IMP salvage(GO:0032264) |
| 0.5 | 20.6 | GO:0051931 | regulation of sensory perception of pain(GO:0051930) regulation of sensory perception(GO:0051931) |
| 0.5 | 1.0 | GO:0051344 | negative regulation of cyclic-nucleotide phosphodiesterase activity(GO:0051344) |
| 0.5 | 3.4 | GO:1901509 | regulation of endothelial tube morphogenesis(GO:1901509) |
| 0.5 | 15.3 | GO:0007205 | protein kinase C-activating G-protein coupled receptor signaling pathway(GO:0007205) |
| 0.5 | 52.3 | GO:0010923 | negative regulation of phosphatase activity(GO:0010923) |
| 0.5 | 2.4 | GO:0021564 | vagus nerve development(GO:0021564) |
| 0.5 | 1.9 | GO:0010980 | regulation of vitamin D 24-hydroxylase activity(GO:0010979) positive regulation of vitamin D 24-hydroxylase activity(GO:0010980) positive regulation of MAPKKK cascade by fibroblast growth factor receptor signaling pathway(GO:0090080) |
| 0.5 | 25.9 | GO:1901381 | positive regulation of potassium ion transmembrane transport(GO:1901381) |
| 0.4 | 1.3 | GO:0090063 | positive regulation of microtubule nucleation(GO:0090063) |
| 0.4 | 0.4 | GO:2000172 | regulation of branching morphogenesis of a nerve(GO:2000172) |
| 0.4 | 3.6 | GO:0060313 | negative regulation of neutrophil degranulation(GO:0043314) negative regulation of blood vessel remodeling(GO:0060313) |
| 0.4 | 7.5 | GO:0033601 | positive regulation of mammary gland epithelial cell proliferation(GO:0033601) |
| 0.4 | 0.4 | GO:0071879 | positive regulation of adrenergic receptor signaling pathway(GO:0071879) |
| 0.4 | 24.3 | GO:0061099 | negative regulation of protein tyrosine kinase activity(GO:0061099) |
| 0.4 | 3.8 | GO:0071313 | cellular response to caffeine(GO:0071313) |
| 0.4 | 5.3 | GO:0070444 | oligodendrocyte progenitor proliferation(GO:0070444) regulation of oligodendrocyte progenitor proliferation(GO:0070445) |
| 0.4 | 1.6 | GO:0046725 | modulation by host of viral RNA genome replication(GO:0044830) negative regulation by virus of viral protein levels in host cell(GO:0046725) |
| 0.4 | 7.5 | GO:0036295 | cellular response to increased oxygen levels(GO:0036295) |
| 0.4 | 2.7 | GO:0043415 | positive regulation of skeletal muscle tissue regeneration(GO:0043415) |
| 0.4 | 3.8 | GO:0010764 | negative regulation of fibroblast migration(GO:0010764) |
| 0.4 | 18.3 | GO:0046839 | phospholipid dephosphorylation(GO:0046839) |
| 0.4 | 4.9 | GO:0048715 | negative regulation of oligodendrocyte differentiation(GO:0048715) |
| 0.4 | 0.7 | GO:1902256 | apoptotic process involved in outflow tract morphogenesis(GO:0003275) regulation of apoptotic process involved in outflow tract morphogenesis(GO:1902256) |
| 0.4 | 8.0 | GO:0051968 | positive regulation of synaptic transmission, glutamatergic(GO:0051968) |
| 0.4 | 2.5 | GO:0042711 | maternal behavior(GO:0042711) |
| 0.4 | 3.2 | GO:0097475 | motor neuron migration(GO:0097475) |
| 0.3 | 2.8 | GO:0045650 | negative regulation of macrophage differentiation(GO:0045650) |
| 0.3 | 1.7 | GO:0070314 | threonine metabolic process(GO:0006566) G1 to G0 transition(GO:0070314) |
| 0.3 | 3.4 | GO:0045085 | negative regulation of interleukin-2 biosynthetic process(GO:0045085) |
| 0.3 | 7.0 | GO:0051481 | negative regulation of cytosolic calcium ion concentration(GO:0051481) |
| 0.3 | 21.6 | GO:0007189 | adenylate cyclase-activating G-protein coupled receptor signaling pathway(GO:0007189) |
| 0.3 | 2.7 | GO:0010459 | negative regulation of heart rate(GO:0010459) |
| 0.3 | 14.2 | GO:0043171 | peptide catabolic process(GO:0043171) |
| 0.3 | 1.3 | GO:0002101 | tRNA wobble cytosine modification(GO:0002101) |
| 0.3 | 36.3 | GO:0043488 | regulation of mRNA stability(GO:0043488) |
| 0.3 | 11.0 | GO:0050901 | leukocyte tethering or rolling(GO:0050901) |
| 0.3 | 1.8 | GO:0046013 | regulation of T cell homeostatic proliferation(GO:0046013) |
| 0.3 | 13.6 | GO:0048873 | homeostasis of number of cells within a tissue(GO:0048873) |
| 0.3 | 6.0 | GO:0060384 | innervation(GO:0060384) |
| 0.3 | 5.3 | GO:0035988 | chondrocyte proliferation(GO:0035988) |
| 0.3 | 0.8 | GO:0003032 | detection of oxygen(GO:0003032) |
| 0.3 | 15.1 | GO:0031572 | G2 DNA damage checkpoint(GO:0031572) |
| 0.2 | 1.2 | GO:1902897 | regulation of postsynaptic density protein 95 clustering(GO:1902897) |
| 0.2 | 24.8 | GO:0051965 | positive regulation of synapse assembly(GO:0051965) |
| 0.2 | 3.4 | GO:0021707 | cerebellar granular layer formation(GO:0021684) cerebellar granule cell differentiation(GO:0021707) |
| 0.2 | 4.7 | GO:0030953 | astral microtubule organization(GO:0030953) |
| 0.2 | 6.4 | GO:2000785 | regulation of autophagosome assembly(GO:2000785) |
| 0.2 | 0.9 | GO:0070649 | formin-nucleated actin cable assembly(GO:0070649) |
| 0.2 | 2.6 | GO:0006654 | phosphatidic acid biosynthetic process(GO:0006654) |
| 0.2 | 5.1 | GO:0042118 | endothelial cell activation(GO:0042118) |
| 0.2 | 3.8 | GO:1902572 | regulation of serine-type endopeptidase activity(GO:1900003) negative regulation of serine-type endopeptidase activity(GO:1900004) regulation of serine-type peptidase activity(GO:1902571) negative regulation of serine-type peptidase activity(GO:1902572) |
| 0.2 | 1.0 | GO:0001973 | adenosine receptor signaling pathway(GO:0001973) |
| 0.2 | 1.0 | GO:0021815 | modulation of microtubule cytoskeleton involved in cerebral cortex radial glia guided migration(GO:0021815) |
| 0.2 | 0.8 | GO:0015755 | fructose transport(GO:0015755) |
| 0.2 | 6.7 | GO:0032292 | myelination in peripheral nervous system(GO:0022011) peripheral nervous system axon ensheathment(GO:0032292) |
| 0.2 | 4.4 | GO:0014067 | negative regulation of phosphatidylinositol 3-kinase signaling(GO:0014067) |
| 0.2 | 3.0 | GO:0006044 | N-acetylglucosamine metabolic process(GO:0006044) |
| 0.2 | 1.1 | GO:0044334 | canonical Wnt signaling pathway involved in positive regulation of epithelial to mesenchymal transition(GO:0044334) |
| 0.2 | 2.1 | GO:1904776 | regulation of protein localization to cell cortex(GO:1904776) positive regulation of protein localization to cell cortex(GO:1904778) |
| 0.2 | 6.8 | GO:0007026 | negative regulation of microtubule depolymerization(GO:0007026) regulation of microtubule depolymerization(GO:0031114) |
| 0.2 | 6.5 | GO:0043113 | receptor clustering(GO:0043113) |
| 0.2 | 3.1 | GO:0016486 | peptide hormone processing(GO:0016486) |
| 0.2 | 1.7 | GO:0070307 | lens fiber cell development(GO:0070307) |
| 0.1 | 28.0 | GO:0010977 | negative regulation of neuron projection development(GO:0010977) |
| 0.1 | 4.8 | GO:0090162 | establishment of epithelial cell polarity(GO:0090162) |
| 0.1 | 2.4 | GO:2000369 | regulation of clathrin-mediated endocytosis(GO:2000369) |
| 0.1 | 1.4 | GO:0071447 | cellular response to hydroperoxide(GO:0071447) |
| 0.1 | 24.5 | GO:0030336 | negative regulation of cell migration(GO:0030336) |
| 0.1 | 1.7 | GO:0010944 | negative regulation of transcription by competitive promoter binding(GO:0010944) |
| 0.1 | 7.6 | GO:0003073 | regulation of systemic arterial blood pressure(GO:0003073) |
| 0.1 | 0.6 | GO:0035887 | aortic smooth muscle cell differentiation(GO:0035887) |
| 0.1 | 0.3 | GO:0006788 | heme oxidation(GO:0006788) |
| 0.1 | 13.8 | GO:0017157 | regulation of exocytosis(GO:0017157) |
| 0.1 | 1.5 | GO:0034063 | stress granule assembly(GO:0034063) |
| 0.1 | 0.2 | GO:0001835 | blastocyst hatching(GO:0001835) hatching(GO:0035188) organism emergence from protective structure(GO:0071684) |
| 0.1 | 3.1 | GO:0010107 | potassium ion import(GO:0010107) |
| 0.1 | 12.2 | GO:0035023 | regulation of Rho protein signal transduction(GO:0035023) |
| 0.1 | 0.6 | GO:0006032 | chitin metabolic process(GO:0006030) chitin catabolic process(GO:0006032) glucosamine-containing compound catabolic process(GO:1901072) |
| 0.1 | 3.4 | GO:0000381 | regulation of alternative mRNA splicing, via spliceosome(GO:0000381) |
| 0.1 | 3.0 | GO:0045773 | positive regulation of axon extension(GO:0045773) |
| 0.1 | 0.5 | GO:0043267 | negative regulation of potassium ion transport(GO:0043267) |
| 0.1 | 0.9 | GO:0034498 | early endosome to Golgi transport(GO:0034498) |
| 0.1 | 6.6 | GO:0031532 | actin cytoskeleton reorganization(GO:0031532) |
| 0.1 | 1.9 | GO:0071539 | protein localization to centrosome(GO:0071539) |
| 0.1 | 0.8 | GO:0006622 | protein targeting to lysosome(GO:0006622) |
| 0.0 | 2.6 | GO:0042073 | intraciliary transport(GO:0042073) |
| 0.0 | 0.7 | GO:0060218 | hematopoietic stem cell differentiation(GO:0060218) |
| 0.0 | 6.8 | GO:0007219 | Notch signaling pathway(GO:0007219) |
| 0.0 | 5.1 | GO:0051291 | protein heterooligomerization(GO:0051291) |
| 0.0 | 0.4 | GO:0071850 | cellular response to UV-B(GO:0071493) mitotic cell cycle arrest(GO:0071850) |
| 0.0 | 0.5 | GO:0071688 | striated muscle myosin thick filament assembly(GO:0071688) |
| 0.0 | 0.3 | GO:0045040 | protein import into mitochondrial outer membrane(GO:0045040) |
| 0.0 | 0.3 | GO:0045721 | negative regulation of gluconeogenesis(GO:0045721) |
| 0.0 | 0.3 | GO:0035871 | protein K11-linked deubiquitination(GO:0035871) |
| 0.0 | 0.2 | GO:0042754 | negative regulation of circadian rhythm(GO:0042754) |
| 0.0 | 0.4 | GO:0043457 | regulation of cellular respiration(GO:0043457) |
| 0.0 | 0.7 | GO:0008542 | visual learning(GO:0008542) |
| 0.0 | 0.1 | GO:0070862 | negative regulation of protein exit from endoplasmic reticulum(GO:0070862) negative regulation of retrograde protein transport, ER to cytosol(GO:1904153) |
| 0.0 | 0.6 | GO:0045670 | regulation of osteoclast differentiation(GO:0045670) |
| 0.0 | 0.1 | GO:1901250 | regulation of lung goblet cell differentiation(GO:1901249) negative regulation of lung goblet cell differentiation(GO:1901250) |
Gene overrepresentation in cellular component category:
| Log-likelihood per target | Total log-likelihood | Term | Description |
|---|---|---|---|
| 4.0 | 15.9 | GO:0099573 | glutamatergic postsynaptic density(GO:0099573) |
| 3.8 | 11.5 | GO:0043512 | inhibin A complex(GO:0043512) |
| 3.6 | 18.2 | GO:1990131 | Gtr1-Gtr2 GTPase complex(GO:1990131) |
| 3.1 | 12.2 | GO:1990769 | proximal neuron projection(GO:1990769) |
| 2.6 | 12.8 | GO:0038039 | G-protein coupled receptor heterodimeric complex(GO:0038039) |
| 2.3 | 18.2 | GO:0097648 | G-protein coupled receptor dimeric complex(GO:0038037) G-protein coupled receptor complex(GO:0097648) |
| 2.3 | 49.6 | GO:0032279 | asymmetric synapse(GO:0032279) |
| 2.0 | 14.1 | GO:0031095 | platelet dense tubular network membrane(GO:0031095) |
| 2.0 | 8.0 | GO:0097444 | spine apparatus(GO:0097444) |
| 2.0 | 15.7 | GO:0032983 | kainate selective glutamate receptor complex(GO:0032983) |
| 1.8 | 19.9 | GO:1990761 | growth cone lamellipodium(GO:1990761) growth cone filopodium(GO:1990812) |
| 1.8 | 39.5 | GO:0014731 | spectrin-associated cytoskeleton(GO:0014731) |
| 1.4 | 39.8 | GO:0098563 | integral component of synaptic vesicle membrane(GO:0030285) intrinsic component of synaptic vesicle membrane(GO:0098563) |
| 1.4 | 15.6 | GO:0032009 | early phagosome(GO:0032009) |
| 1.3 | 11.6 | GO:0035749 | myelin sheath adaxonal region(GO:0035749) |
| 1.2 | 7.4 | GO:0008091 | spectrin(GO:0008091) |
| 1.2 | 6.2 | GO:0098890 | extrinsic component of postsynaptic membrane(GO:0098890) |
| 1.2 | 29.6 | GO:0017146 | NMDA selective glutamate receptor complex(GO:0017146) |
| 1.1 | 13.6 | GO:0034993 | microtubule organizing center attachment site(GO:0034992) LINC complex(GO:0034993) |
| 1.0 | 61.8 | GO:0048786 | presynaptic active zone(GO:0048786) |
| 1.0 | 7.1 | GO:0070381 | endosome to plasma membrane transport vesicle(GO:0070381) |
| 1.0 | 15.7 | GO:0042788 | polysomal ribosome(GO:0042788) |
| 0.8 | 2.4 | GO:0031523 | Myb complex(GO:0031523) |
| 0.8 | 6.8 | GO:0097442 | CA3 pyramidal cell dendrite(GO:0097442) |
| 0.7 | 2.7 | GO:1990578 | perinuclear endoplasmic reticulum membrane(GO:1990578) |
| 0.6 | 7.0 | GO:0030314 | junctional membrane complex(GO:0030314) |
| 0.6 | 7.5 | GO:0033180 | proton-transporting V-type ATPase, V1 domain(GO:0033180) |
| 0.6 | 2.5 | GO:0043202 | lysosomal lumen(GO:0043202) |
| 0.6 | 28.8 | GO:0097440 | apical dendrite(GO:0097440) |
| 0.6 | 8.4 | GO:1990635 | proximal dendrite(GO:1990635) |
| 0.6 | 16.1 | GO:1902710 | GABA receptor complex(GO:1902710) GABA-A receptor complex(GO:1902711) |
| 0.6 | 15.3 | GO:0031430 | M band(GO:0031430) |
| 0.6 | 23.7 | GO:0032281 | AMPA glutamate receptor complex(GO:0032281) |
| 0.5 | 13.0 | GO:0060077 | inhibitory synapse(GO:0060077) |
| 0.5 | 9.8 | GO:0032433 | filopodium tip(GO:0032433) |
| 0.5 | 12.4 | GO:0001518 | voltage-gated sodium channel complex(GO:0001518) |
| 0.5 | 59.7 | GO:0034705 | potassium channel complex(GO:0034705) |
| 0.5 | 24.5 | GO:0030672 | synaptic vesicle membrane(GO:0030672) exocytic vesicle membrane(GO:0099501) |
| 0.4 | 12.0 | GO:0005859 | muscle myosin complex(GO:0005859) |
| 0.4 | 15.4 | GO:0045334 | clathrin-coated endocytic vesicle(GO:0045334) |
| 0.4 | 5.3 | GO:0032584 | growth cone membrane(GO:0032584) |
| 0.3 | 89.7 | GO:0045211 | postsynaptic membrane(GO:0045211) |
| 0.3 | 22.5 | GO:0043198 | dendritic shaft(GO:0043198) |
| 0.3 | 4.4 | GO:0036449 | microtubule minus-end(GO:0036449) |
| 0.3 | 9.4 | GO:0071565 | nBAF complex(GO:0071565) |
| 0.3 | 44.1 | GO:0008021 | synaptic vesicle(GO:0008021) |
| 0.3 | 14.4 | GO:0005891 | voltage-gated calcium channel complex(GO:0005891) |
| 0.3 | 2.4 | GO:0070436 | Grb2-EGFR complex(GO:0070436) |
| 0.2 | 30.9 | GO:0043204 | perikaryon(GO:0043204) |
| 0.2 | 8.6 | GO:0032588 | trans-Golgi network membrane(GO:0032588) |
| 0.2 | 4.2 | GO:0043196 | varicosity(GO:0043196) |
| 0.2 | 23.2 | GO:0043679 | axon terminus(GO:0043679) |
| 0.2 | 2.8 | GO:0060091 | kinocilium(GO:0060091) |
| 0.2 | 1.0 | GO:0034751 | aryl hydrocarbon receptor complex(GO:0034751) |
| 0.2 | 3.1 | GO:0016600 | flotillin complex(GO:0016600) |
| 0.2 | 9.4 | GO:0097060 | synaptic membrane(GO:0097060) |
| 0.2 | 3.4 | GO:0031235 | intrinsic component of the cytoplasmic side of the plasma membrane(GO:0031235) |
| 0.2 | 67.0 | GO:0030424 | axon(GO:0030424) |
| 0.2 | 32.6 | GO:0005802 | trans-Golgi network(GO:0005802) |
| 0.2 | 1.1 | GO:0070369 | beta-catenin-TCF7L2 complex(GO:0070369) |
| 0.2 | 47.9 | GO:0000139 | Golgi membrane(GO:0000139) |
| 0.1 | 0.4 | GO:0070557 | PCNA-p21 complex(GO:0070557) |
| 0.1 | 3.2 | GO:0034385 | very-low-density lipoprotein particle(GO:0034361) triglyceride-rich lipoprotein particle(GO:0034385) |
| 0.1 | 0.9 | GO:0097197 | tetraspanin-enriched microdomain(GO:0097197) |
| 0.1 | 41.2 | GO:0045202 | synapse(GO:0045202) |
| 0.1 | 4.4 | GO:0032420 | stereocilium(GO:0032420) |
| 0.1 | 1.3 | GO:0005869 | dynactin complex(GO:0005869) |
| 0.1 | 18.2 | GO:0030027 | lamellipodium(GO:0030027) |
| 0.1 | 12.2 | GO:0022626 | cytosolic ribosome(GO:0022626) |
| 0.1 | 1.9 | GO:0034451 | centriolar satellite(GO:0034451) |
| 0.1 | 4.9 | GO:0032587 | ruffle membrane(GO:0032587) |
| 0.1 | 2.6 | GO:0032391 | photoreceptor connecting cilium(GO:0032391) |
| 0.1 | 1.1 | GO:0016580 | Sin3 complex(GO:0016580) |
| 0.0 | 1.3 | GO:0005697 | telomerase holoenzyme complex(GO:0005697) |
| 0.0 | 1.4 | GO:0016235 | aggresome(GO:0016235) |
| 0.0 | 0.9 | GO:0030904 | retromer complex(GO:0030904) |
| 0.0 | 7.2 | GO:0031225 | anchored component of membrane(GO:0031225) |
| 0.0 | 0.3 | GO:0016011 | dystroglycan complex(GO:0016011) sarcoglycan complex(GO:0016012) |
| 0.0 | 1.6 | GO:0016529 | sarcoplasmic reticulum(GO:0016529) |
| 0.0 | 2.1 | GO:0045171 | intercellular bridge(GO:0045171) |
| 0.0 | 0.9 | GO:0032154 | cleavage furrow(GO:0032154) cell surface furrow(GO:0097610) |
| 0.0 | 1.2 | GO:0001750 | photoreceptor outer segment(GO:0001750) |
| 0.0 | 0.3 | GO:0098799 | outer mitochondrial membrane protein complex(GO:0098799) |
| 0.0 | 2.4 | GO:0030496 | midbody(GO:0030496) |
| 0.0 | 3.2 | GO:0043209 | myelin sheath(GO:0043209) |
| 0.0 | 2.2 | GO:0031234 | extrinsic component of cytoplasmic side of plasma membrane(GO:0031234) |
| 0.0 | 0.9 | GO:0001533 | cornified envelope(GO:0001533) |
| 0.0 | 1.7 | GO:0005882 | intermediate filament(GO:0005882) |
Gene overrepresentation in molecular function category:
| Log-likelihood per target | Total log-likelihood | Term | Description |
|---|---|---|---|
| 7.7 | 46.3 | GO:0015018 | galactosylgalactosylxylosylprotein 3-beta-glucuronosyltransferase activity(GO:0015018) |
| 7.6 | 37.9 | GO:0016907 | G-protein coupled acetylcholine receptor activity(GO:0016907) |
| 6.1 | 18.2 | GO:0001639 | PLC activating G-protein coupled glutamate receptor activity(GO:0001639) G-protein coupled receptor activity involved in regulation of postsynaptic membrane potential(GO:0099530) |
| 4.9 | 29.4 | GO:0060175 | brain-derived neurotrophic factor-activated receptor activity(GO:0060175) |
| 4.9 | 19.6 | GO:0045183 | translation factor activity, non-nucleic acid binding(GO:0045183) |
| 4.2 | 50.4 | GO:0032051 | clathrin light chain binding(GO:0032051) |
| 3.9 | 23.6 | GO:0015277 | kainate selective glutamate receptor activity(GO:0015277) |
| 3.5 | 20.9 | GO:0004647 | phosphoserine phosphatase activity(GO:0004647) |
| 3.1 | 9.4 | GO:0004698 | calcium-dependent protein kinase C activity(GO:0004698) |
| 3.0 | 21.3 | GO:0005005 | transmembrane-ephrin receptor activity(GO:0005005) |
| 3.0 | 18.1 | GO:0048495 | Roundabout binding(GO:0048495) |
| 3.0 | 9.0 | GO:0016492 | G-protein coupled neurotensin receptor activity(GO:0016492) |
| 2.8 | 8.3 | GO:0030348 | syntaxin-3 binding(GO:0030348) |
| 2.4 | 19.6 | GO:0001595 | angiotensin receptor activity(GO:0001595) |
| 2.4 | 26.6 | GO:0099529 | neurotransmitter receptor activity involved in regulation of postsynaptic membrane potential(GO:0099529) |
| 2.3 | 6.9 | GO:0098782 | mechanically-gated potassium channel activity(GO:0098782) |
| 2.1 | 12.8 | GO:0004965 | G-protein coupled GABA receptor activity(GO:0004965) |
| 2.0 | 6.0 | GO:0031751 | D4 dopamine receptor binding(GO:0031751) |
| 2.0 | 17.7 | GO:0001640 | adenylate cyclase inhibiting G-protein coupled glutamate receptor activity(GO:0001640) |
| 1.8 | 7.0 | GO:0005219 | ryanodine-sensitive calcium-release channel activity(GO:0005219) |
| 1.7 | 11.8 | GO:0004985 | opioid receptor activity(GO:0004985) |
| 1.7 | 10.1 | GO:0004118 | cGMP-stimulated cyclic-nucleotide phosphodiesterase activity(GO:0004118) |
| 1.6 | 9.8 | GO:0055100 | adiponectin binding(GO:0055100) |
| 1.6 | 8.0 | GO:0004971 | AMPA glutamate receptor activity(GO:0004971) |
| 1.6 | 105.7 | GO:0036002 | pre-mRNA binding(GO:0036002) |
| 1.5 | 24.5 | GO:0070679 | inositol 1,4,5 trisphosphate binding(GO:0070679) |
| 1.5 | 10.4 | GO:0030160 | GKAP/Homer scaffold activity(GO:0030160) ankyrin repeat binding(GO:0071532) |
| 1.4 | 12.9 | GO:0008597 | calcium-dependent protein serine/threonine phosphatase regulator activity(GO:0008597) |
| 1.3 | 6.7 | GO:0015189 | L-lysine transmembrane transporter activity(GO:0015189) |
| 1.3 | 11.5 | GO:0034711 | inhibin binding(GO:0034711) |
| 1.2 | 6.2 | GO:0005250 | A-type (transient outward) potassium channel activity(GO:0005250) |
| 1.2 | 15.9 | GO:0009931 | calcium-dependent protein serine/threonine kinase activity(GO:0009931) |
| 1.1 | 64.3 | GO:0043015 | gamma-tubulin binding(GO:0043015) |
| 1.1 | 3.2 | GO:0017082 | mineralocorticoid receptor activity(GO:0017082) |
| 1.1 | 11.6 | GO:0033691 | sialic acid binding(GO:0033691) |
| 1.1 | 3.2 | GO:0034189 | very-low-density lipoprotein particle binding(GO:0034189) |
| 1.0 | 3.1 | GO:0005330 | dopamine:sodium symporter activity(GO:0005330) |
| 1.0 | 12.3 | GO:0015280 | ligand-gated sodium channel activity(GO:0015280) |
| 1.0 | 88.3 | GO:0030507 | spectrin binding(GO:0030507) |
| 1.0 | 16.6 | GO:0004143 | diacylglycerol kinase activity(GO:0004143) |
| 0.8 | 14.8 | GO:0035612 | AP-2 adaptor complex binding(GO:0035612) |
| 0.8 | 6.8 | GO:0005519 | cytoskeletal regulatory protein binding(GO:0005519) |
| 0.7 | 7.5 | GO:0015193 | L-proline transmembrane transporter activity(GO:0015193) |
| 0.7 | 5.9 | GO:0016312 | inositol bisphosphate phosphatase activity(GO:0016312) |
| 0.7 | 2.2 | GO:0099580 | ion antiporter activity involved in regulation of postsynaptic membrane potential(GO:0099580) |
| 0.7 | 13.0 | GO:0042043 | neurexin family protein binding(GO:0042043) |
| 0.7 | 2.8 | GO:0004096 | catalase activity(GO:0004096) |
| 0.7 | 2.7 | GO:0004999 | vasoactive intestinal polypeptide receptor activity(GO:0004999) |
| 0.7 | 3.4 | GO:0042289 | MHC class II protein binding(GO:0042289) |
| 0.7 | 17.5 | GO:0070006 | metalloaminopeptidase activity(GO:0070006) |
| 0.6 | 3.9 | GO:0003839 | gamma-glutamylcyclotransferase activity(GO:0003839) |
| 0.6 | 3.2 | GO:0004045 | aminoacyl-tRNA hydrolase activity(GO:0004045) |
| 0.6 | 9.0 | GO:0008349 | MAP kinase kinase kinase kinase activity(GO:0008349) |
| 0.6 | 4.5 | GO:0004111 | creatine kinase activity(GO:0004111) |
| 0.6 | 10.1 | GO:0035014 | phosphatidylinositol 3-kinase regulator activity(GO:0035014) |
| 0.6 | 17.1 | GO:0031489 | myosin V binding(GO:0031489) |
| 0.6 | 14.4 | GO:0008331 | high voltage-gated calcium channel activity(GO:0008331) |
| 0.6 | 23.7 | GO:0005245 | voltage-gated calcium channel activity(GO:0005245) |
| 0.6 | 3.1 | GO:0001537 | N-acetylgalactosamine 4-O-sulfotransferase activity(GO:0001537) |
| 0.6 | 22.2 | GO:0004115 | 3',5'-cyclic-AMP phosphodiesterase activity(GO:0004115) |
| 0.6 | 46.0 | GO:0030276 | clathrin binding(GO:0030276) |
| 0.6 | 33.6 | GO:0005246 | calcium channel regulator activity(GO:0005246) |
| 0.6 | 13.6 | GO:0005521 | lamin binding(GO:0005521) |
| 0.6 | 18.6 | GO:0004190 | aspartic-type endopeptidase activity(GO:0004190) |
| 0.6 | 40.2 | GO:0001540 | beta-amyloid binding(GO:0001540) |
| 0.6 | 41.9 | GO:0015459 | potassium channel regulator activity(GO:0015459) |
| 0.6 | 27.8 | GO:0004864 | protein phosphatase inhibitor activity(GO:0004864) |
| 0.6 | 52.7 | GO:0048365 | Rac GTPase binding(GO:0048365) |
| 0.6 | 1.7 | GO:0071820 | N-box binding(GO:0071820) |
| 0.6 | 4.4 | GO:0005042 | netrin receptor activity(GO:0005042) |
| 0.5 | 1.6 | GO:0033149 | FFAT motif binding(GO:0033149) |
| 0.5 | 11.5 | GO:0030898 | actin-dependent ATPase activity(GO:0030898) |
| 0.5 | 5.2 | GO:0047623 | AMP deaminase activity(GO:0003876) adenosine-phosphate deaminase activity(GO:0047623) |
| 0.5 | 3.6 | GO:0008449 | N-acetylglucosamine-6-sulfatase activity(GO:0008449) |
| 0.5 | 12.4 | GO:0008195 | phosphatidate phosphatase activity(GO:0008195) |
| 0.5 | 1.0 | GO:0036004 | GAF domain binding(GO:0036004) |
| 0.5 | 10.4 | GO:0008191 | metalloendopeptidase inhibitor activity(GO:0008191) |
| 0.4 | 15.3 | GO:0004012 | phospholipid-translocating ATPase activity(GO:0004012) |
| 0.4 | 10.0 | GO:0030676 | Rac guanyl-nucleotide exchange factor activity(GO:0030676) |
| 0.4 | 46.1 | GO:0003730 | mRNA 3'-UTR binding(GO:0003730) |
| 0.4 | 13.0 | GO:1905030 | voltage-gated sodium channel activity(GO:0005248) voltage-gated ion channel activity involved in regulation of postsynaptic membrane potential(GO:1905030) |
| 0.4 | 11.0 | GO:0035250 | UDP-galactosyltransferase activity(GO:0035250) |
| 0.4 | 1.9 | GO:0005105 | type 1 fibroblast growth factor receptor binding(GO:0005105) |
| 0.4 | 1.1 | GO:0035939 | microsatellite binding(GO:0035939) |
| 0.3 | 4.4 | GO:0017154 | semaphorin receptor activity(GO:0017154) |
| 0.3 | 6.8 | GO:0005092 | GDP-dissociation inhibitor activity(GO:0005092) |
| 0.3 | 2.9 | GO:0004972 | NMDA glutamate receptor activity(GO:0004972) |
| 0.3 | 5.1 | GO:0001011 | transcription factor activity, sequence-specific DNA binding, RNA polymerase recruiting(GO:0001011) transcription factor activity, TFIIB-class binding(GO:0001087) |
| 0.3 | 59.6 | GO:0003729 | mRNA binding(GO:0003729) poly(A) RNA binding(GO:0044822) |
| 0.3 | 4.2 | GO:0047372 | acylglycerol lipase activity(GO:0047372) |
| 0.3 | 2.6 | GO:0035374 | chondroitin sulfate binding(GO:0035374) |
| 0.3 | 32.6 | GO:0005089 | Rho guanyl-nucleotide exchange factor activity(GO:0005089) |
| 0.3 | 6.3 | GO:0005540 | hyaluronic acid binding(GO:0005540) |
| 0.2 | 3.5 | GO:0016783 | sulfurtransferase activity(GO:0016783) |
| 0.2 | 0.7 | GO:0004348 | glucosylceramidase activity(GO:0004348) |
| 0.2 | 3.3 | GO:0001206 | transcriptional repressor activity, RNA polymerase II distal enhancer sequence-specific binding(GO:0001206) |
| 0.2 | 8.1 | GO:0005242 | inward rectifier potassium channel activity(GO:0005242) |
| 0.2 | 4.2 | GO:0045499 | chemorepellent activity(GO:0045499) |
| 0.2 | 10.4 | GO:0071837 | HMG box domain binding(GO:0071837) |
| 0.2 | 5.8 | GO:0051428 | peptide hormone receptor binding(GO:0051428) |
| 0.2 | 2.6 | GO:0038191 | neuropilin binding(GO:0038191) |
| 0.2 | 3.8 | GO:0001222 | transcription corepressor binding(GO:0001222) |
| 0.2 | 3.4 | GO:0044548 | S100 protein binding(GO:0044548) |
| 0.2 | 0.5 | GO:0016898 | D-lactate dehydrogenase (cytochrome) activity(GO:0004458) oxidoreductase activity, acting on the CH-OH group of donors, cytochrome as acceptor(GO:0016898) |
| 0.1 | 9.9 | GO:0008146 | sulfotransferase activity(GO:0008146) |
| 0.1 | 5.0 | GO:0035259 | glucocorticoid receptor binding(GO:0035259) |
| 0.1 | 7.5 | GO:0005154 | epidermal growth factor receptor binding(GO:0005154) |
| 0.1 | 0.4 | GO:0019912 | cyclin-dependent protein kinase activating kinase activity(GO:0019912) |
| 0.1 | 0.8 | GO:0005114 | type II transforming growth factor beta receptor binding(GO:0005114) |
| 0.1 | 6.1 | GO:0051019 | mitogen-activated protein kinase binding(GO:0051019) |
| 0.1 | 2.6 | GO:0003841 | 1-acylglycerol-3-phosphate O-acyltransferase activity(GO:0003841) |
| 0.1 | 7.9 | GO:0005249 | voltage-gated potassium channel activity(GO:0005249) |
| 0.1 | 3.1 | GO:0046961 | proton-transporting ATPase activity, rotational mechanism(GO:0046961) |
| 0.1 | 0.3 | GO:0004392 | heme oxygenase (decyclizing) activity(GO:0004392) |
| 0.1 | 3.0 | GO:0005031 | tumor necrosis factor-activated receptor activity(GO:0005031) death receptor activity(GO:0005035) |
| 0.1 | 1.0 | GO:0001609 | G-protein coupled adenosine receptor activity(GO:0001609) |
| 0.1 | 0.6 | GO:0004568 | chitinase activity(GO:0004568) |
| 0.1 | 5.2 | GO:0015485 | cholesterol binding(GO:0015485) |
| 0.1 | 12.9 | GO:0017124 | SH3 domain binding(GO:0017124) |
| 0.1 | 9.3 | GO:0030165 | PDZ domain binding(GO:0030165) |
| 0.1 | 0.7 | GO:0017151 | DEAD/H-box RNA helicase binding(GO:0017151) |
| 0.1 | 1.6 | GO:1900750 | glutathione binding(GO:0043295) oligopeptide binding(GO:1900750) |
| 0.1 | 1.3 | GO:0070182 | DNA polymerase binding(GO:0070182) |
| 0.1 | 3.3 | GO:0019003 | GDP binding(GO:0019003) |
| 0.1 | 1.7 | GO:0005212 | structural constituent of eye lens(GO:0005212) |
| 0.1 | 2.2 | GO:0005086 | ARF guanyl-nucleotide exchange factor activity(GO:0005086) |
| 0.0 | 0.5 | GO:0001665 | alpha-N-acetylgalactosaminide alpha-2,6-sialyltransferase activity(GO:0001665) |
| 0.0 | 1.2 | GO:0070577 | lysine-acetylated histone binding(GO:0070577) |
| 0.0 | 1.3 | GO:0070840 | dynein complex binding(GO:0070840) |
| 0.0 | 0.4 | GO:0070700 | BMP receptor binding(GO:0070700) |
| 0.0 | 7.2 | GO:0008201 | heparin binding(GO:0008201) |
| 0.0 | 0.9 | GO:0004993 | G-protein coupled serotonin receptor activity(GO:0004993) |
| 0.0 | 19.4 | GO:0004930 | G-protein coupled receptor activity(GO:0004930) |
| 0.0 | 0.4 | GO:0050321 | tau-protein kinase activity(GO:0050321) |
| 0.0 | 0.5 | GO:0097493 | structural molecule activity conferring elasticity(GO:0097493) |
| 0.0 | 1.1 | GO:0001103 | RNA polymerase II repressing transcription factor binding(GO:0001103) |
| 0.0 | 0.7 | GO:1990841 | promoter-specific chromatin binding(GO:1990841) |
| 0.0 | 1.0 | GO:0019905 | syntaxin binding(GO:0019905) |
| 0.0 | 0.4 | GO:0051537 | 2 iron, 2 sulfur cluster binding(GO:0051537) |
| 0.0 | 0.5 | GO:0017112 | Rab guanyl-nucleotide exchange factor activity(GO:0017112) |
| 0.0 | 2.6 | GO:0003924 | GTPase activity(GO:0003924) |
Gene overrepresentation in curated gene sets: canonical pathways category:
| Log-likelihood per target | Total log-likelihood | Term | Description |
|---|---|---|---|
| 0.5 | 48.6 | PID AJDISS 2PATHWAY | Posttranslational regulation of adherens junction stability and dissassembly |
| 0.5 | 17.3 | PID NCADHERIN PATHWAY | N-cadherin signaling events |
| 0.5 | 30.6 | PID NETRIN PATHWAY | Netrin-mediated signaling events |
| 0.4 | 29.6 | PID LKB1 PATHWAY | LKB1 signaling events |
| 0.4 | 16.7 | NABA PROTEOGLYCANS | Genes encoding proteoglycans |
| 0.3 | 12.8 | PID CDC42 REG PATHWAY | Regulation of CDC42 activity |
| 0.3 | 13.6 | PID REELIN PATHWAY | Reelin signaling pathway |
| 0.3 | 9.8 | PID EPHRINB REV PATHWAY | Ephrin B reverse signaling |
| 0.3 | 22.3 | PID NFAT 3PATHWAY | Role of Calcineurin-dependent NFAT signaling in lymphocytes |
| 0.3 | 23.8 | PID RAC1 REG PATHWAY | Regulation of RAC1 activity |
| 0.2 | 18.5 | PID P75 NTR PATHWAY | p75(NTR)-mediated signaling |
| 0.2 | 10.6 | PID TNF PATHWAY | TNF receptor signaling pathway |
| 0.2 | 14.5 | PID MTOR 4PATHWAY | mTOR signaling pathway |
| 0.1 | 6.0 | ST PHOSPHOINOSITIDE 3 KINASE PATHWAY | PI3K Pathway |
| 0.1 | 6.0 | PID MET PATHWAY | Signaling events mediated by Hepatocyte Growth Factor Receptor (c-Met) |
| 0.1 | 5.2 | PID FGF PATHWAY | FGF signaling pathway |
| 0.1 | 17.3 | WNT SIGNALING | Genes related to Wnt-mediated signal transduction |
| 0.1 | 9.1 | PID NOTCH PATHWAY | Notch signaling pathway |
| 0.1 | 2.4 | PID FAS PATHWAY | FAS (CD95) signaling pathway |
| 0.1 | 11.3 | PID AR PATHWAY | Coregulation of Androgen receptor activity |
| 0.1 | 3.1 | PID ALPHA SYNUCLEIN PATHWAY | Alpha-synuclein signaling |
| 0.1 | 1.6 | PID PI3KCI PATHWAY | Class I PI3K signaling events |
| 0.1 | 3.2 | PID TRKR PATHWAY | Neurotrophic factor-mediated Trk receptor signaling |
| 0.1 | 13.2 | NABA ECM AFFILIATED | Genes encoding proteins affiliated structurally or functionally to extracellular matrix proteins |
| 0.1 | 2.9 | PID ECADHERIN STABILIZATION PATHWAY | Stabilization and expansion of the E-cadherin adherens junction |
| 0.0 | 2.4 | PID CDC42 PATHWAY | CDC42 signaling events |
| 0.0 | 2.7 | PID REG GR PATHWAY | Glucocorticoid receptor regulatory network |
| 0.0 | 3.7 | PID ERA GENOMIC PATHWAY | Validated nuclear estrogen receptor alpha network |
| 0.0 | 2.7 | PID PDGFRB PATHWAY | PDGFR-beta signaling pathway |
| 0.0 | 0.9 | PID AP1 PATHWAY | AP-1 transcription factor network |
| 0.0 | 0.6 | PID AR TF PATHWAY | Regulation of Androgen receptor activity |
Gene overrepresentation in curated gene sets: REACTOME pathways category:
| Log-likelihood per target | Total log-likelihood | Term | Description |
|---|---|---|---|
| 2.3 | 48.7 | REACTOME CLASS C 3 METABOTROPIC GLUTAMATE PHEROMONE RECEPTORS | Genes involved in Class C/3 (Metabotropic glutamate/pheromone receptors) |
| 2.3 | 16.2 | REACTOME RAS ACTIVATION UOPN CA2 INFUX THROUGH NMDA RECEPTOR | Genes involved in Ras activation uopn Ca2+ infux through NMDA receptor |
| 1.6 | 53.2 | REACTOME UNBLOCKING OF NMDA RECEPTOR GLUTAMATE BINDING AND ACTIVATION | Genes involved in Unblocking of NMDA receptor, glutamate binding and activation |
| 1.4 | 11.5 | REACTOME CREATION OF C4 AND C2 ACTIVATORS | Genes involved in Creation of C4 and C2 activators |
| 1.4 | 23.0 | REACTOME IONOTROPIC ACTIVITY OF KAINATE RECEPTORS | Genes involved in Ionotropic activity of Kainate Receptors |
| 1.3 | 45.2 | REACTOME A TETRASACCHARIDE LINKER SEQUENCE IS REQUIRED FOR GAG SYNTHESIS | Genes involved in A tetrasaccharide linker sequence is required for GAG synthesis |
| 1.1 | 26.7 | REACTOME GABA A RECEPTOR ACTIVATION | Genes involved in GABA A receptor activation |
| 1.1 | 33.1 | REACTOME TRAFFICKING OF AMPA RECEPTORS | Genes involved in Trafficking of AMPA receptors |
| 1.0 | 11.5 | REACTOME GLYCOPROTEIN HORMONES | Genes involved in Glycoprotein hormones |
| 1.0 | 49.9 | REACTOME SIGNALING BY ROBO RECEPTOR | Genes involved in Signaling by Robo receptor |
| 0.9 | 37.9 | REACTOME AMINE LIGAND BINDING RECEPTORS | Genes involved in Amine ligand-binding receptors |
| 0.9 | 46.9 | REACTOME INTERACTION BETWEEN L1 AND ANKYRINS | Genes involved in Interaction between L1 and Ankyrins |
| 0.6 | 8.3 | REACTOME NOREPINEPHRINE NEUROTRANSMITTER RELEASE CYCLE | Genes involved in Norepinephrine Neurotransmitter Release Cycle |
| 0.5 | 16.0 | REACTOME CGMP EFFECTS | Genes involved in cGMP effects |
| 0.4 | 9.3 | REACTOME INSULIN SYNTHESIS AND PROCESSING | Genes involved in Insulin Synthesis and Processing |
| 0.4 | 6.9 | REACTOME TANDEM PORE DOMAIN POTASSIUM CHANNELS | Genes involved in Tandem pore domain potassium channels |
| 0.4 | 21.3 | REACTOME VOLTAGE GATED POTASSIUM CHANNELS | Genes involved in Voltage gated Potassium channels |
| 0.4 | 12.3 | REACTOME EFFECTS OF PIP2 HYDROLYSIS | Genes involved in Effects of PIP2 hydrolysis |
| 0.3 | 5.9 | REACTOME SYNTHESIS OF PIPS AT THE LATE ENDOSOME MEMBRANE | Genes involved in Synthesis of PIPs at the late endosome membrane |
| 0.3 | 21.2 | REACTOME NETRIN1 SIGNALING | Genes involved in Netrin-1 signaling |
| 0.3 | 7.0 | REACTOME CRMPS IN SEMA3A SIGNALING | Genes involved in CRMPs in Sema3A signaling |
| 0.3 | 6.0 | REACTOME DARPP 32 EVENTS | Genes involved in DARPP-32 events |
| 0.3 | 2.2 | REACTOME PLATELET CALCIUM HOMEOSTASIS | Genes involved in Platelet calcium homeostasis |
| 0.3 | 9.8 | REACTOME ADHERENS JUNCTIONS INTERACTIONS | Genes involved in Adherens junctions interactions |
| 0.3 | 11.8 | REACTOME BASIGIN INTERACTIONS | Genes involved in Basigin interactions |
| 0.3 | 12.1 | REACTOME ION TRANSPORT BY P TYPE ATPASES | Genes involved in Ion transport by P-type ATPases |
| 0.2 | 5.2 | REACTOME FGFR4 LIGAND BINDING AND ACTIVATION | Genes involved in FGFR4 ligand binding and activation |
| 0.2 | 13.6 | REACTOME MEIOTIC SYNAPSIS | Genes involved in Meiotic Synapsis |
| 0.2 | 7.1 | REACTOME PRE NOTCH PROCESSING IN GOLGI | Genes involved in Pre-NOTCH Processing in Golgi |
| 0.2 | 2.7 | REACTOME GLUCAGON TYPE LIGAND RECEPTORS | Genes involved in Glucagon-type ligand receptors |
| 0.2 | 7.5 | REACTOME INSULIN RECEPTOR RECYCLING | Genes involved in Insulin receptor recycling |
| 0.2 | 43.2 | REACTOME PEPTIDE LIGAND BINDING RECEPTORS | Genes involved in Peptide ligand-binding receptors |
| 0.2 | 13.3 | REACTOME NCAM1 INTERACTIONS | Genes involved in NCAM1 interactions |
| 0.2 | 5.2 | REACTOME PURINE SALVAGE | Genes involved in Purine salvage |
| 0.2 | 2.4 | REACTOME RETROGRADE NEUROTROPHIN SIGNALLING | Genes involved in Retrograde neurotrophin signalling |
| 0.2 | 35.9 | REACTOME NGF SIGNALLING VIA TRKA FROM THE PLASMA MEMBRANE | Genes involved in NGF signalling via TRKA from the plasma membrane |
| 0.1 | 12.3 | REACTOME NRAGE SIGNALS DEATH THROUGH JNK | Genes involved in NRAGE signals death through JNK |
| 0.1 | 7.8 | REACTOME P75 NTR RECEPTOR MEDIATED SIGNALLING | Genes involved in p75 NTR receptor-mediated signalling |
| 0.1 | 5.1 | REACTOME MYOGENESIS | Genes involved in Myogenesis |
| 0.1 | 3.1 | REACTOME INHIBITION OF VOLTAGE GATED CA2 CHANNELS VIA GBETA GAMMA SUBUNITS | Genes involved in Inhibition of voltage gated Ca2+ channels via Gbeta/gamma subunits |
| 0.1 | 12.2 | REACTOME REGULATION OF INSULIN SECRETION | Genes involved in Regulation of Insulin Secretion |
| 0.1 | 2.6 | REACTOME OTHER SEMAPHORIN INTERACTIONS | Genes involved in Other semaphorin interactions |
| 0.1 | 3.0 | REACTOME N GLYCAN ANTENNAE ELONGATION IN THE MEDIAL TRANS GOLGI | Genes involved in N-glycan antennae elongation in the medial/trans-Golgi |
| 0.1 | 2.6 | REACTOME INTEGRATION OF ENERGY METABOLISM | Genes involved in Integration of energy metabolism |
| 0.1 | 0.5 | REACTOME PLC BETA MEDIATED EVENTS | Genes involved in PLC beta mediated events |
| 0.1 | 8.4 | REACTOME SIGNALING BY RHO GTPASES | Genes involved in Signaling by Rho GTPases |
| 0.1 | 1.7 | REACTOME AMINO ACID SYNTHESIS AND INTERCONVERSION TRANSAMINATION | Genes involved in Amino acid synthesis and interconversion (transamination) |
| 0.0 | 1.0 | REACTOME NUCLEOTIDE LIKE PURINERGIC RECEPTORS | Genes involved in Nucleotide-like (purinergic) receptors |
| 0.0 | 1.3 | REACTOME ACTIVATION OF CHAPERONE GENES BY XBP1S | Genes involved in Activation of Chaperone Genes by XBP1(S) |
| 0.0 | 0.5 | REACTOME POTASSIUM CHANNELS | Genes involved in Potassium Channels |
| 0.0 | 0.5 | REACTOME TERMINATION OF O GLYCAN BIOSYNTHESIS | Genes involved in Termination of O-glycan biosynthesis |
| 0.0 | 0.8 | REACTOME MITOCHONDRIAL PROTEIN IMPORT | Genes involved in Mitochondrial Protein Import |
| 0.0 | 1.3 | REACTOME NUCLEAR RECEPTOR TRANSCRIPTION PATHWAY | Genes involved in Nuclear Receptor transcription pathway |
| 0.0 | 0.3 | REACTOME METABOLISM OF PORPHYRINS | Genes involved in Metabolism of porphyrins |