Project
PRJNA375882: Comprehensive Mouse Transcriptomic BodyMap
Navigation
Downloads
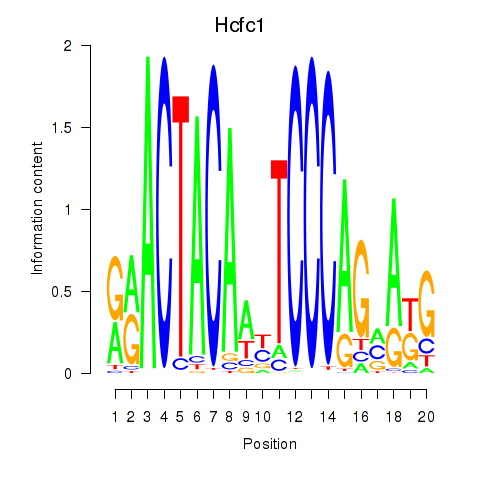
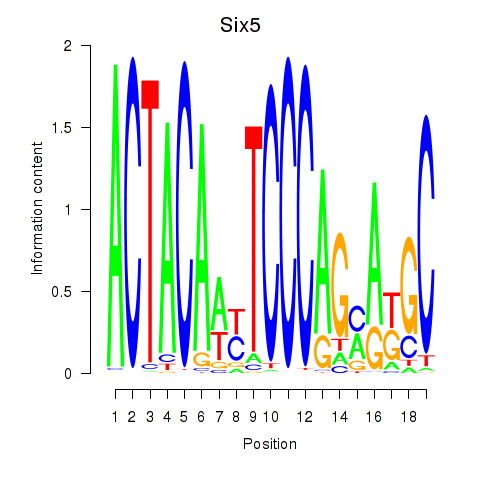
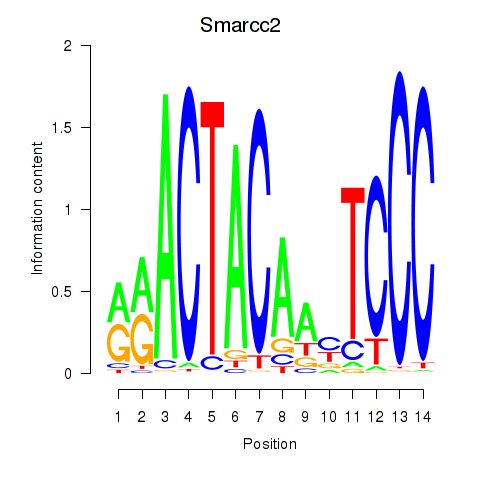
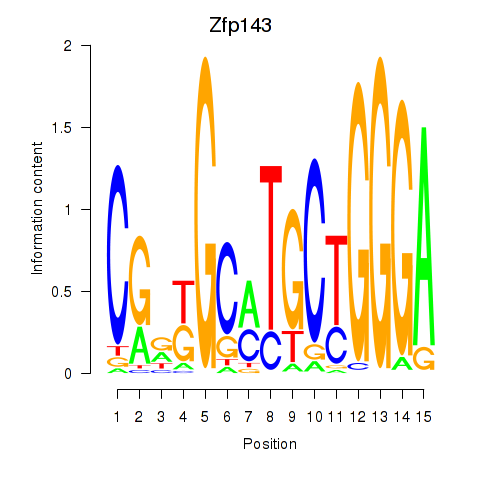
Results for Hcfc1_Six5_Smarcc2_Zfp143
Z-value: 3.95
Motif logo
Transcription factors associated with Hcfc1_Six5_Smarcc2_Zfp143
| Gene Symbol | Gene ID | Gene Info |
|---|---|---|
|
Hcfc1
|
ENSMUSG00000031386.15 | Hcfc1 |
|
Six5
|
ENSMUSG00000040841.6 | Six5 |
|
Smarcc2
|
ENSMUSG00000025369.16 | Smarcc2 |
|
Zfp143
|
ENSMUSG00000061079.15 | Zfp143 |
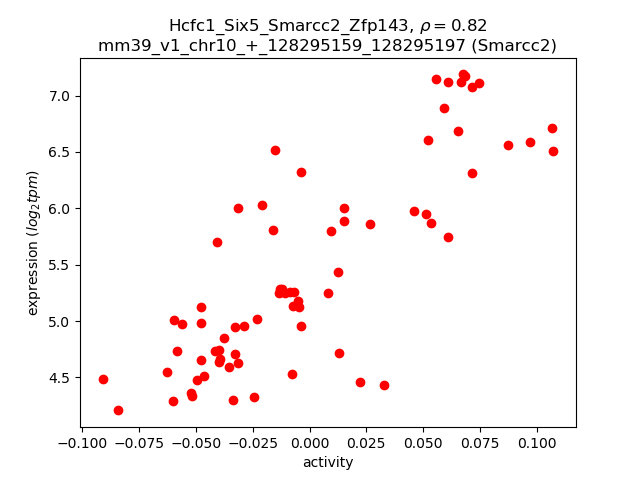
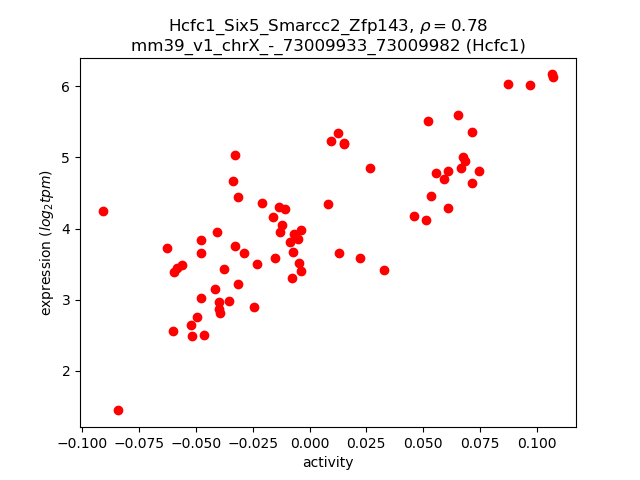
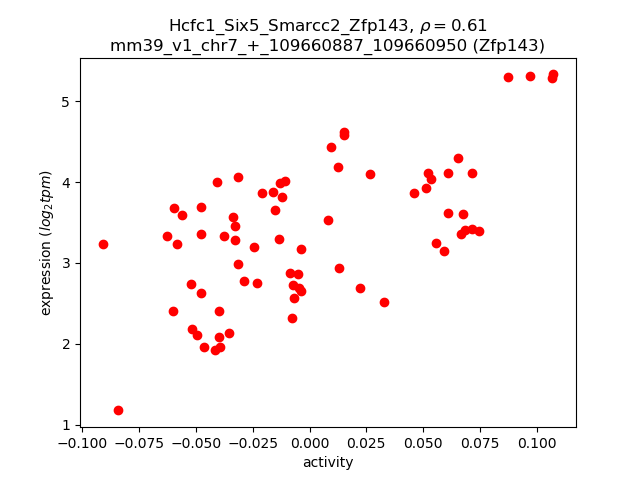
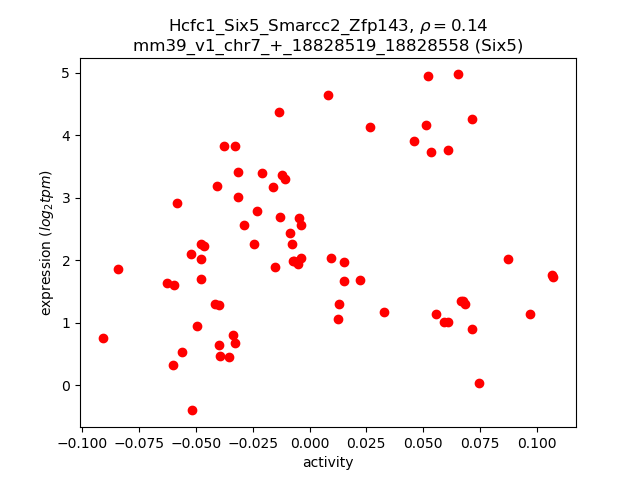
Activity-expression correlation:
| Gene | Promoter | Pearson corr. coef. | P-value | Plot |
|---|---|---|---|---|
| Smarcc2 | mm39_v1_chr10_+_128295159_128295197 | 0.82 | 2.6e-18 | Click! |
| Hcfc1 | mm39_v1_chrX_-_73009933_73009982 | 0.78 | 9.5e-16 | Click! |
| Zfp143 | mm39_v1_chr7_+_109660887_109660950 | 0.61 | 1.7e-08 | Click! |
| Six5 | mm39_v1_chr7_+_18828519_18828558 | 0.14 | 2.4e-01 | Click! |
Activity profile of Hcfc1_Six5_Smarcc2_Zfp143 motif
Sorted Z-values of Hcfc1_Six5_Smarcc2_Zfp143 motif
Network of associatons between targets according to the STRING database.

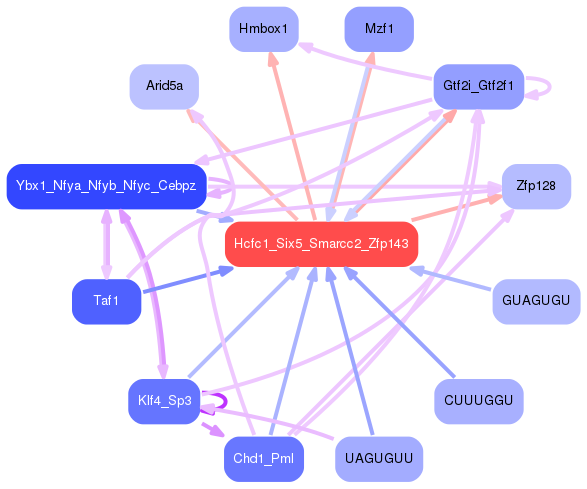
First level regulatory network of Hcfc1_Six5_Smarcc2_Zfp143
Gene Ontology Analysis
Gene overrepresentation in biological process category:
| Log-likelihood per target | Total log-likelihood | Term | Description |
|---|---|---|---|
| 4.6 | 18.3 | GO:0042245 | RNA repair(GO:0042245) |
| 4.1 | 12.4 | GO:0036079 | GDP-fucose transport(GO:0015783) purine nucleotide-sugar transport(GO:0036079) pyrimidine nucleotide-sugar transmembrane transport(GO:0090481) |
| 4.0 | 16.0 | GO:1905053 | regulation of base-excision repair(GO:1905051) positive regulation of base-excision repair(GO:1905053) |
| 3.2 | 12.8 | GO:0030974 | thiamine pyrophosphate transport(GO:0030974) |
| 3.2 | 9.6 | GO:1900063 | mitochondrial membrane fission(GO:0090149) regulation of peroxisome organization(GO:1900063) |
| 3.1 | 9.2 | GO:1902277 | negative regulation of pancreatic amylase secretion(GO:1902277) |
| 2.5 | 27.9 | GO:2000582 | regulation of ATP-dependent microtubule motor activity, plus-end-directed(GO:2000580) positive regulation of ATP-dependent microtubule motor activity, plus-end-directed(GO:2000582) |
| 2.4 | 12.1 | GO:0051562 | negative regulation of mitochondrial calcium ion concentration(GO:0051562) |
| 2.4 | 40.9 | GO:1902018 | negative regulation of cilium assembly(GO:1902018) |
| 2.4 | 16.7 | GO:0000733 | DNA strand renaturation(GO:0000733) |
| 2.2 | 22.0 | GO:0051388 | positive regulation of neurotrophin TRK receptor signaling pathway(GO:0051388) |
| 2.2 | 13.1 | GO:0016185 | synaptic vesicle budding from presynaptic endocytic zone membrane(GO:0016185) |
| 2.0 | 10.0 | GO:0014886 | transition between slow and fast fiber(GO:0014886) |
| 2.0 | 9.9 | GO:0098886 | modification of dendritic spine(GO:0098886) |
| 1.9 | 11.5 | GO:0072386 | plus-end-directed vesicle transport along microtubule(GO:0072383) plus-end-directed organelle transport along microtubule(GO:0072386) |
| 1.8 | 5.4 | GO:0099526 | presynaptic signal transduction(GO:0098928) presynapse to nucleus signaling pathway(GO:0099526) |
| 1.7 | 17.2 | GO:0050882 | voluntary musculoskeletal movement(GO:0050882) |
| 1.7 | 6.7 | GO:1902774 | late endosome to lysosome transport(GO:1902774) |
| 1.7 | 5.0 | GO:0019918 | peptidyl-arginine methylation, to symmetrical-dimethyl arginine(GO:0019918) |
| 1.7 | 6.7 | GO:1903422 | negative regulation of synaptic vesicle recycling(GO:1903422) |
| 1.6 | 4.9 | GO:0000349 | generation of catalytic spliceosome for first transesterification step(GO:0000349) |
| 1.6 | 4.7 | GO:0048239 | negative regulation of DNA recombination at telomere(GO:0048239) regulation of DNA recombination at telomere(GO:0072695) |
| 1.5 | 6.2 | GO:1903215 | negative regulation of protein targeting to mitochondrion(GO:1903215) |
| 1.5 | 15.3 | GO:0032074 | negative regulation of nuclease activity(GO:0032074) |
| 1.5 | 18.3 | GO:0010807 | regulation of synaptic vesicle priming(GO:0010807) |
| 1.5 | 6.0 | GO:0018197 | peptidyl-aspartic acid modification(GO:0018197) cellular response to manganese ion(GO:0071287) |
| 1.5 | 4.5 | GO:0006429 | leucyl-tRNA aminoacylation(GO:0006429) |
| 1.4 | 15.5 | GO:0046826 | negative regulation of protein export from nucleus(GO:0046826) |
| 1.3 | 5.3 | GO:0098961 | dendritic transport of ribonucleoprotein complex(GO:0098961) dendritic transport of messenger ribonucleoprotein complex(GO:0098963) anterograde dendritic transport of messenger ribonucleoprotein complex(GO:0098964) |
| 1.3 | 12.8 | GO:0002098 | tRNA wobble uridine modification(GO:0002098) |
| 1.3 | 16.5 | GO:0000463 | maturation of LSU-rRNA from tricistronic rRNA transcript (SSU-rRNA, 5.8S rRNA, LSU-rRNA)(GO:0000463) |
| 1.2 | 2.4 | GO:0061357 | positive regulation of Wnt protein secretion(GO:0061357) |
| 1.2 | 4.9 | GO:0072385 | minus-end-directed organelle transport along microtubule(GO:0072385) |
| 1.2 | 6.1 | GO:0051754 | meiotic sister chromatid cohesion, centromeric(GO:0051754) |
| 1.2 | 4.8 | GO:0042539 | hypotonic salinity response(GO:0042539) cellular hypotonic salinity response(GO:0071477) |
| 1.2 | 5.9 | GO:0060971 | embryonic heart tube left/right pattern formation(GO:0060971) |
| 1.1 | 1.1 | GO:0071169 | establishment of protein localization to chromatin(GO:0071169) |
| 1.1 | 4.4 | GO:2000312 | regulation of kainate selective glutamate receptor activity(GO:2000312) |
| 1.1 | 6.6 | GO:0009235 | cobalamin metabolic process(GO:0009235) |
| 1.1 | 13.2 | GO:0009301 | snRNA transcription(GO:0009301) |
| 1.1 | 4.3 | GO:0017126 | nucleologenesis(GO:0017126) |
| 1.1 | 4.2 | GO:1904046 | negative regulation of vascular endothelial growth factor production(GO:1904046) |
| 1.0 | 5.2 | GO:0048478 | replication fork protection(GO:0048478) |
| 1.0 | 6.1 | GO:1990481 | mRNA pseudouridine synthesis(GO:1990481) |
| 1.0 | 4.9 | GO:0018343 | protein farnesylation(GO:0018343) |
| 1.0 | 2.9 | GO:2000554 | regulation of T-helper 1 cell cytokine production(GO:2000554) positive regulation of T-helper 1 cell cytokine production(GO:2000556) |
| 1.0 | 12.6 | GO:0051694 | pointed-end actin filament capping(GO:0051694) |
| 0.9 | 3.8 | GO:0072355 | histone H3-T3 phosphorylation(GO:0072355) |
| 0.9 | 3.8 | GO:0055048 | regulation of spindle elongation(GO:0032887) regulation of mitotic spindle elongation(GO:0032888) anastral spindle assembly(GO:0055048) protein localization to spindle pole body(GO:0071988) regulation of protein localization to spindle pole body(GO:1902363) positive regulation of protein localization to spindle pole body(GO:1902365) positive regulation of mitotic spindle elongation(GO:1902846) |
| 0.9 | 2.8 | GO:0000454 | snoRNA guided rRNA pseudouridine synthesis(GO:0000454) |
| 0.9 | 22.9 | GO:1990126 | retrograde transport, endosome to plasma membrane(GO:1990126) |
| 0.9 | 3.6 | GO:2000872 | positive regulation of progesterone secretion(GO:2000872) |
| 0.9 | 2.6 | GO:0071929 | alpha-tubulin acetylation(GO:0071929) |
| 0.9 | 4.4 | GO:1902775 | mitochondrial large ribosomal subunit assembly(GO:1902775) |
| 0.9 | 8.6 | GO:0036481 | intrinsic apoptotic signaling pathway in response to hydrogen peroxide(GO:0036481) |
| 0.9 | 2.6 | GO:2000813 | negative regulation of barbed-end actin filament capping(GO:2000813) |
| 0.8 | 2.5 | GO:0021837 | motogenic signaling involved in postnatal olfactory bulb interneuron migration(GO:0021837) positive regulation of mitotic cell cycle DNA replication(GO:1903465) |
| 0.8 | 3.4 | GO:0071043 | CUT catabolic process(GO:0071034) CUT metabolic process(GO:0071043) |
| 0.8 | 3.4 | GO:0031938 | regulation of chromatin silencing at telomere(GO:0031938) |
| 0.8 | 5.8 | GO:0051105 | regulation of DNA ligation(GO:0051105) positive regulation of DNA ligation(GO:0051106) |
| 0.8 | 0.8 | GO:0030997 | regulation of centriole-centriole cohesion(GO:0030997) |
| 0.8 | 7.1 | GO:0016480 | negative regulation of transcription from RNA polymerase III promoter(GO:0016480) |
| 0.8 | 8.6 | GO:0001682 | tRNA 5'-leader removal(GO:0001682) |
| 0.8 | 7.8 | GO:0017185 | peptidyl-lysine hydroxylation(GO:0017185) |
| 0.8 | 9.3 | GO:0002051 | osteoblast fate commitment(GO:0002051) |
| 0.8 | 6.2 | GO:0033314 | mitotic DNA replication checkpoint(GO:0033314) |
| 0.8 | 2.3 | GO:0008214 | protein demethylation(GO:0006482) protein dealkylation(GO:0008214) |
| 0.8 | 5.3 | GO:0032380 | regulation of intracellular lipid transport(GO:0032377) regulation of intracellular sterol transport(GO:0032380) regulation of intracellular cholesterol transport(GO:0032383) |
| 0.7 | 1.5 | GO:1900275 | negative regulation of phospholipase C activity(GO:1900275) |
| 0.7 | 2.2 | GO:0034970 | histone H3-R2 methylation(GO:0034970) |
| 0.7 | 5.1 | GO:0035735 | intraciliary transport involved in cilium morphogenesis(GO:0035735) |
| 0.7 | 3.5 | GO:0031118 | rRNA pseudouridine synthesis(GO:0031118) |
| 0.7 | 13.1 | GO:0015937 | coenzyme A biosynthetic process(GO:0015937) |
| 0.7 | 4.1 | GO:0098838 | reduced folate transmembrane transport(GO:0098838) |
| 0.7 | 2.0 | GO:0000350 | generation of catalytic spliceosome for second transesterification step(GO:0000350) |
| 0.7 | 2.0 | GO:1990166 | protein localization to site of double-strand break(GO:1990166) |
| 0.7 | 2.6 | GO:0021933 | radial glia guided migration of cerebellar granule cell(GO:0021933) negative regulation of cerebellar granule cell precursor proliferation(GO:0021941) |
| 0.6 | 3.9 | GO:0061511 | centriole elongation(GO:0061511) |
| 0.6 | 5.1 | GO:0033567 | DNA replication, Okazaki fragment processing(GO:0033567) |
| 0.6 | 1.9 | GO:0007439 | ectodermal digestive tract development(GO:0007439) embryonic ectodermal digestive tract development(GO:0048611) |
| 0.6 | 4.3 | GO:0016255 | attachment of GPI anchor to protein(GO:0016255) |
| 0.6 | 4.2 | GO:0051013 | microtubule severing(GO:0051013) |
| 0.6 | 10.7 | GO:1902857 | positive regulation of nonmotile primary cilium assembly(GO:1902857) |
| 0.6 | 11.8 | GO:0070816 | phosphorylation of RNA polymerase II C-terminal domain(GO:0070816) |
| 0.6 | 1.2 | GO:0000389 | mRNA 3'-splice site recognition(GO:0000389) |
| 0.6 | 1.1 | GO:1904023 | regulation of NAD metabolic process(GO:1902688) regulation of glucose catabolic process to lactate via pyruvate(GO:1904023) |
| 0.6 | 2.8 | GO:0015746 | tricarboxylic acid transport(GO:0006842) citrate transport(GO:0015746) |
| 0.6 | 0.6 | GO:0032986 | nucleosome disassembly(GO:0006337) protein-DNA complex disassembly(GO:0032986) |
| 0.6 | 2.8 | GO:0010747 | positive regulation of plasma membrane long-chain fatty acid transport(GO:0010747) |
| 0.6 | 1.7 | GO:0061428 | negative regulation of transcription from RNA polymerase II promoter in response to hypoxia(GO:0061428) positive regulation of oocyte maturation(GO:1900195) positive regulation of proteasomal ubiquitin-dependent protein catabolic process involved in cellular response to hypoxia(GO:2000777) |
| 0.5 | 1.6 | GO:0019264 | glycine biosynthetic process from serine(GO:0019264) |
| 0.5 | 4.7 | GO:0043553 | negative regulation of phosphatidylinositol 3-kinase activity(GO:0043553) |
| 0.5 | 5.8 | GO:2000051 | negative regulation of non-canonical Wnt signaling pathway(GO:2000051) |
| 0.5 | 2.1 | GO:2000049 | positive regulation of cell-cell adhesion mediated by cadherin(GO:2000049) |
| 0.5 | 2.1 | GO:0042138 | meiotic DNA double-strand break formation(GO:0042138) |
| 0.5 | 8.7 | GO:0045724 | positive regulation of cilium assembly(GO:0045724) |
| 0.5 | 2.5 | GO:0023016 | signal transduction by trans-phosphorylation(GO:0023016) |
| 0.5 | 7.5 | GO:0034501 | protein localization to kinetochore(GO:0034501) |
| 0.5 | 9.0 | GO:1902916 | positive regulation of protein polyubiquitination(GO:1902916) |
| 0.5 | 3.4 | GO:1903265 | positive regulation of tumor necrosis factor-mediated signaling pathway(GO:1903265) |
| 0.5 | 6.8 | GO:0006390 | transcription from mitochondrial promoter(GO:0006390) |
| 0.5 | 1.9 | GO:0071596 | ubiquitin-dependent protein catabolic process via the N-end rule pathway(GO:0071596) |
| 0.5 | 1.9 | GO:0006269 | DNA replication, synthesis of RNA primer(GO:0006269) |
| 0.5 | 1.4 | GO:0018008 | N-terminal peptidyl-glycine N-myristoylation(GO:0018008) |
| 0.5 | 1.4 | GO:0090611 | ubiquitin-independent protein catabolic process via the multivesicular body sorting pathway(GO:0090611) |
| 0.5 | 4.7 | GO:0046784 | viral mRNA export from host cell nucleus(GO:0046784) |
| 0.5 | 4.7 | GO:0000185 | activation of MAPKKK activity(GO:0000185) |
| 0.5 | 1.4 | GO:0002182 | cytoplasmic translational elongation(GO:0002182) regulation of cytoplasmic translational elongation(GO:1900247) negative regulation of cytoplasmic translational elongation(GO:1900248) |
| 0.4 | 8.1 | GO:0035090 | maintenance of apical/basal cell polarity(GO:0035090) |
| 0.4 | 1.8 | GO:0002036 | regulation of L-glutamate transport(GO:0002036) |
| 0.4 | 1.3 | GO:0031990 | RNA import into nucleus(GO:0006404) mRNA export from nucleus in response to heat stress(GO:0031990) |
| 0.4 | 4.6 | GO:0048341 | paraxial mesoderm formation(GO:0048341) |
| 0.4 | 3.3 | GO:0007000 | nucleolus organization(GO:0007000) |
| 0.4 | 5.7 | GO:0080009 | mRNA methylation(GO:0080009) |
| 0.4 | 2.0 | GO:0035405 | histone-threonine phosphorylation(GO:0035405) |
| 0.4 | 1.2 | GO:0052572 | interleukin-15 production(GO:0032618) response to immune response of other organism involved in symbiotic interaction(GO:0052564) response to host immune response(GO:0052572) |
| 0.4 | 5.6 | GO:0030953 | astral microtubule organization(GO:0030953) |
| 0.4 | 2.8 | GO:0070495 | regulation of thrombin receptor signaling pathway(GO:0070494) negative regulation of thrombin receptor signaling pathway(GO:0070495) |
| 0.4 | 3.5 | GO:2001279 | regulation of prostaglandin biosynthetic process(GO:0031392) regulation of unsaturated fatty acid biosynthetic process(GO:2001279) |
| 0.4 | 2.4 | GO:0034968 | histone lysine methylation(GO:0034968) |
| 0.4 | 8.3 | GO:0033327 | Leydig cell differentiation(GO:0033327) |
| 0.4 | 2.0 | GO:0006481 | C-terminal protein methylation(GO:0006481) |
| 0.4 | 2.3 | GO:1904749 | regulation of protein localization to nucleolus(GO:1904749) |
| 0.4 | 14.4 | GO:0008608 | attachment of spindle microtubules to kinetochore(GO:0008608) |
| 0.4 | 1.2 | GO:0090168 | Golgi reassembly(GO:0090168) |
| 0.4 | 7.1 | GO:0033234 | negative regulation of protein sumoylation(GO:0033234) |
| 0.4 | 1.9 | GO:0007290 | spermatid nucleus elongation(GO:0007290) |
| 0.4 | 3.7 | GO:0000055 | ribosomal large subunit export from nucleus(GO:0000055) |
| 0.4 | 1.8 | GO:1903378 | positive regulation of oxidative stress-induced neuron intrinsic apoptotic signaling pathway(GO:1903378) |
| 0.4 | 1.4 | GO:0016062 | adaptation of rhodopsin mediated signaling(GO:0016062) light adaption(GO:0036367) |
| 0.4 | 2.2 | GO:0035246 | peptidyl-arginine N-methylation(GO:0035246) |
| 0.4 | 1.8 | GO:0061622 | glycolytic process through glucose-1-phosphate(GO:0061622) |
| 0.4 | 12.8 | GO:2000369 | regulation of clathrin-mediated endocytosis(GO:2000369) |
| 0.4 | 2.5 | GO:0019262 | N-acetylneuraminate catabolic process(GO:0019262) |
| 0.4 | 5.0 | GO:0051292 | nuclear pore complex assembly(GO:0051292) |
| 0.4 | 2.1 | GO:0098937 | dendritic transport(GO:0098935) anterograde dendritic transport(GO:0098937) |
| 0.4 | 0.7 | GO:1902805 | positive regulation of synaptic vesicle transport(GO:1902805) |
| 0.4 | 2.8 | GO:2000766 | negative regulation of cytoplasmic translation(GO:2000766) |
| 0.3 | 2.4 | GO:0090521 | glomerular visceral epithelial cell migration(GO:0090521) |
| 0.3 | 4.1 | GO:0035269 | protein O-linked mannosylation(GO:0035269) |
| 0.3 | 4.4 | GO:0034086 | maintenance of sister chromatid cohesion(GO:0034086) maintenance of mitotic sister chromatid cohesion(GO:0034088) |
| 0.3 | 1.4 | GO:0010793 | regulation of mRNA export from nucleus(GO:0010793) |
| 0.3 | 0.7 | GO:0030174 | regulation of DNA-dependent DNA replication initiation(GO:0030174) |
| 0.3 | 19.4 | GO:0007257 | activation of JUN kinase activity(GO:0007257) |
| 0.3 | 1.9 | GO:0042695 | thelarche(GO:0042695) mammary gland branching involved in thelarche(GO:0060744) |
| 0.3 | 1.6 | GO:0050902 | leukocyte adhesive activation(GO:0050902) |
| 0.3 | 3.9 | GO:0051770 | positive regulation of nitric-oxide synthase biosynthetic process(GO:0051770) |
| 0.3 | 1.6 | GO:0044861 | protein transport into plasma membrane raft(GO:0044861) |
| 0.3 | 1.5 | GO:2000620 | positive regulation of histone H4-K16 acetylation(GO:2000620) |
| 0.3 | 1.5 | GO:0061086 | negative regulation of histone H3-K27 methylation(GO:0061086) |
| 0.3 | 1.5 | GO:0036015 | response to interleukin-3(GO:0036015) cellular response to interleukin-3(GO:0036016) positive regulation of adrenergic receptor signaling pathway(GO:0071879) |
| 0.3 | 0.9 | GO:0043686 | co-translational protein modification(GO:0043686) |
| 0.3 | 1.2 | GO:1902037 | negative regulation of hematopoietic stem cell differentiation(GO:1902037) |
| 0.3 | 3.8 | GO:0051984 | positive regulation of chromosome segregation(GO:0051984) |
| 0.3 | 2.3 | GO:0014029 | neural crest formation(GO:0014029) |
| 0.3 | 1.2 | GO:0015801 | aromatic amino acid transport(GO:0015801) tryptophan transport(GO:0015827) |
| 0.3 | 2.9 | GO:0039536 | negative regulation of RIG-I signaling pathway(GO:0039536) |
| 0.3 | 1.4 | GO:0044313 | protein K6-linked deubiquitination(GO:0044313) |
| 0.3 | 1.4 | GO:0016081 | synaptic vesicle docking(GO:0016081) |
| 0.3 | 2.5 | GO:0060633 | negative regulation of transcription initiation from RNA polymerase II promoter(GO:0060633) |
| 0.3 | 5.0 | GO:0006622 | protein targeting to lysosome(GO:0006622) |
| 0.3 | 1.1 | GO:0033159 | negative regulation of protein import into nucleus, translocation(GO:0033159) |
| 0.3 | 6.2 | GO:0015858 | nucleoside transport(GO:0015858) |
| 0.3 | 0.8 | GO:1902990 | leading strand elongation(GO:0006272) mitotic telomere maintenance via semi-conservative replication(GO:1902990) |
| 0.3 | 1.8 | GO:1902416 | positive regulation of mRNA binding(GO:1902416) |
| 0.3 | 0.8 | GO:0061723 | glycophagy(GO:0061723) |
| 0.3 | 1.3 | GO:0071955 | recycling endosome to Golgi transport(GO:0071955) |
| 0.3 | 2.0 | GO:0071442 | positive regulation of histone H3-K14 acetylation(GO:0071442) |
| 0.3 | 2.3 | GO:0018344 | protein geranylgeranylation(GO:0018344) |
| 0.2 | 1.0 | GO:0006370 | 7-methylguanosine mRNA capping(GO:0006370) |
| 0.2 | 8.7 | GO:0071108 | protein K48-linked deubiquitination(GO:0071108) |
| 0.2 | 2.5 | GO:0018095 | protein polyglutamylation(GO:0018095) |
| 0.2 | 2.2 | GO:0006449 | regulation of translational termination(GO:0006449) |
| 0.2 | 2.0 | GO:0002681 | somatic diversification of T cell receptor genes(GO:0002568) somatic recombination of T cell receptor gene segments(GO:0002681) T cell receptor V(D)J recombination(GO:0033153) |
| 0.2 | 3.9 | GO:0031340 | positive regulation of vesicle fusion(GO:0031340) |
| 0.2 | 0.5 | GO:0010643 | cell communication by chemical coupling(GO:0010643) negative regulation of locomotion involved in locomotory behavior(GO:0090327) |
| 0.2 | 2.9 | GO:0035457 | cellular response to interferon-alpha(GO:0035457) |
| 0.2 | 1.0 | GO:1904708 | granulosa cell apoptotic process(GO:1904700) regulation of granulosa cell apoptotic process(GO:1904708) |
| 0.2 | 1.7 | GO:0045163 | clustering of voltage-gated potassium channels(GO:0045163) |
| 0.2 | 7.8 | GO:0008033 | tRNA processing(GO:0008033) |
| 0.2 | 1.2 | GO:0017183 | peptidyl-diphthamide metabolic process(GO:0017182) peptidyl-diphthamide biosynthetic process from peptidyl-histidine(GO:0017183) peptidyl-histidine modification(GO:0018202) |
| 0.2 | 0.7 | GO:1990414 | positive regulation of double-strand break repair via homologous recombination(GO:1905168) replication-born double-strand break repair via sister chromatid exchange(GO:1990414) |
| 0.2 | 1.2 | GO:0000212 | meiotic spindle organization(GO:0000212) |
| 0.2 | 1.9 | GO:0032202 | telomere assembly(GO:0032202) |
| 0.2 | 1.6 | GO:0045743 | positive regulation of fibroblast growth factor receptor signaling pathway(GO:0045743) |
| 0.2 | 4.4 | GO:0006085 | acetyl-CoA biosynthetic process(GO:0006085) |
| 0.2 | 4.6 | GO:0030049 | muscle filament sliding(GO:0030049) |
| 0.2 | 1.4 | GO:0035585 | calcium-mediated signaling using extracellular calcium source(GO:0035585) |
| 0.2 | 1.6 | GO:0006659 | phosphatidylserine biosynthetic process(GO:0006659) |
| 0.2 | 0.9 | GO:0031860 | telomeric 3' overhang formation(GO:0031860) |
| 0.2 | 6.0 | GO:0000154 | rRNA modification(GO:0000154) |
| 0.2 | 0.4 | GO:0006550 | isoleucine catabolic process(GO:0006550) |
| 0.2 | 0.7 | GO:0016598 | protein arginylation(GO:0016598) |
| 0.2 | 13.0 | GO:0018279 | peptidyl-asparagine modification(GO:0018196) protein N-linked glycosylation via asparagine(GO:0018279) |
| 0.2 | 11.0 | GO:0031648 | protein destabilization(GO:0031648) |
| 0.2 | 1.7 | GO:0031053 | primary miRNA processing(GO:0031053) |
| 0.2 | 1.1 | GO:0044849 | estrous cycle(GO:0044849) |
| 0.2 | 1.3 | GO:0006384 | transcription initiation from RNA polymerase III promoter(GO:0006384) |
| 0.2 | 4.4 | GO:0035563 | positive regulation of chromatin binding(GO:0035563) |
| 0.2 | 5.0 | GO:0043584 | nose development(GO:0043584) |
| 0.2 | 0.2 | GO:0044407 | biofilm formation(GO:0042710) single-species biofilm formation(GO:0044010) single-species biofilm formation in or on host organism(GO:0044407) regulation of single-species biofilm formation(GO:1900190) negative regulation of single-species biofilm formation(GO:1900191) regulation of single-species biofilm formation in or on host organism(GO:1900228) negative regulation of single-species biofilm formation in or on host organism(GO:1900229) |
| 0.2 | 1.2 | GO:0016191 | synaptic vesicle uncoating(GO:0016191) |
| 0.2 | 0.6 | GO:0035037 | sperm entry(GO:0035037) |
| 0.2 | 0.8 | GO:0021750 | cerebellar molecular layer development(GO:0021679) vestibular nucleus development(GO:0021750) |
| 0.2 | 1.0 | GO:0038032 | termination of G-protein coupled receptor signaling pathway(GO:0038032) |
| 0.2 | 2.0 | GO:0090503 | RNA phosphodiester bond hydrolysis, exonucleolytic(GO:0090503) |
| 0.2 | 1.2 | GO:0034975 | protein folding in endoplasmic reticulum(GO:0034975) |
| 0.2 | 1.8 | GO:0000920 | cell separation after cytokinesis(GO:0000920) |
| 0.2 | 2.2 | GO:0000244 | spliceosomal tri-snRNP complex assembly(GO:0000244) |
| 0.2 | 2.7 | GO:0006995 | cellular response to nitrogen starvation(GO:0006995) cellular response to nitrogen levels(GO:0043562) |
| 0.2 | 5.4 | GO:0043968 | histone H2A acetylation(GO:0043968) |
| 0.2 | 0.8 | GO:0061187 | histone H4-K20 demethylation(GO:0035574) regulation of chromatin silencing at rDNA(GO:0061187) negative regulation of chromatin silencing at rDNA(GO:0061188) |
| 0.2 | 8.3 | GO:0090162 | establishment of epithelial cell polarity(GO:0090162) |
| 0.2 | 1.3 | GO:0072344 | rescue of stalled ribosome(GO:0072344) |
| 0.2 | 0.6 | GO:0036245 | cellular response to menadione(GO:0036245) |
| 0.2 | 3.2 | GO:0051001 | negative regulation of nitric-oxide synthase activity(GO:0051001) |
| 0.2 | 4.7 | GO:0045948 | positive regulation of translational initiation(GO:0045948) |
| 0.2 | 11.2 | GO:0042771 | intrinsic apoptotic signaling pathway in response to DNA damage by p53 class mediator(GO:0042771) |
| 0.2 | 1.4 | GO:0006868 | glutamine transport(GO:0006868) |
| 0.2 | 0.9 | GO:0046909 | intermembrane transport(GO:0046909) protein transport from ciliary membrane to plasma membrane(GO:1903445) |
| 0.2 | 3.4 | GO:0006878 | cellular copper ion homeostasis(GO:0006878) |
| 0.2 | 0.7 | GO:0060447 | bud outgrowth involved in lung branching(GO:0060447) |
| 0.2 | 2.0 | GO:1901522 | positive regulation of transcription from RNA polymerase II promoter involved in cellular response to chemical stimulus(GO:1901522) |
| 0.2 | 0.7 | GO:0016584 | nucleosome positioning(GO:0016584) |
| 0.2 | 0.5 | GO:1905169 | protein localization to phagocytic vesicle(GO:1905161) regulation of protein localization to phagocytic vesicle(GO:1905169) positive regulation of protein localization to phagocytic vesicle(GO:1905171) |
| 0.2 | 8.5 | GO:0006400 | tRNA modification(GO:0006400) |
| 0.2 | 1.3 | GO:0097211 | response to gonadotropin-releasing hormone(GO:0097210) cellular response to gonadotropin-releasing hormone(GO:0097211) |
| 0.2 | 1.6 | GO:1903551 | regulation of extracellular exosome assembly(GO:1903551) |
| 0.2 | 0.7 | GO:0006297 | nucleotide-excision repair, DNA gap filling(GO:0006297) |
| 0.2 | 0.5 | GO:0046168 | glycerol-3-phosphate catabolic process(GO:0046168) |
| 0.2 | 3.1 | GO:1904754 | positive regulation of vascular associated smooth muscle cell migration(GO:1904754) |
| 0.2 | 0.6 | GO:0035089 | establishment of apical/basal cell polarity(GO:0035089) |
| 0.2 | 3.5 | GO:0010832 | negative regulation of myotube differentiation(GO:0010832) |
| 0.2 | 4.1 | GO:0007175 | negative regulation of epidermal growth factor-activated receptor activity(GO:0007175) |
| 0.2 | 2.2 | GO:0070072 | vacuolar proton-transporting V-type ATPase complex assembly(GO:0070072) |
| 0.2 | 0.9 | GO:0006172 | ADP biosynthetic process(GO:0006172) |
| 0.2 | 1.8 | GO:0019372 | lipoxygenase pathway(GO:0019372) |
| 0.2 | 0.5 | GO:0006335 | DNA replication-dependent nucleosome assembly(GO:0006335) DNA replication-dependent nucleosome organization(GO:0034723) |
| 0.1 | 12.0 | GO:0016575 | histone deacetylation(GO:0016575) |
| 0.1 | 1.3 | GO:1990440 | positive regulation of transcription from RNA polymerase II promoter in response to endoplasmic reticulum stress(GO:1990440) |
| 0.1 | 2.8 | GO:0060972 | left/right pattern formation(GO:0060972) |
| 0.1 | 0.6 | GO:0010269 | response to selenium ion(GO:0010269) |
| 0.1 | 12.3 | GO:0072384 | organelle transport along microtubule(GO:0072384) |
| 0.1 | 0.7 | GO:0070935 | 3'-UTR-mediated mRNA stabilization(GO:0070935) |
| 0.1 | 10.9 | GO:0048286 | lung alveolus development(GO:0048286) |
| 0.1 | 1.1 | GO:0007217 | tachykinin receptor signaling pathway(GO:0007217) |
| 0.1 | 6.6 | GO:0010501 | RNA secondary structure unwinding(GO:0010501) |
| 0.1 | 5.2 | GO:0006284 | base-excision repair(GO:0006284) |
| 0.1 | 2.7 | GO:1902230 | negative regulation of intrinsic apoptotic signaling pathway in response to DNA damage(GO:1902230) |
| 0.1 | 4.7 | GO:0048820 | hair follicle maturation(GO:0048820) |
| 0.1 | 0.7 | GO:0006999 | nuclear pore organization(GO:0006999) |
| 0.1 | 2.6 | GO:1901185 | negative regulation of ERBB signaling pathway(GO:1901185) |
| 0.1 | 0.6 | GO:0070245 | positive regulation of thymocyte apoptotic process(GO:0070245) |
| 0.1 | 1.7 | GO:0036158 | outer dynein arm assembly(GO:0036158) |
| 0.1 | 1.0 | GO:0002903 | negative regulation of B cell apoptotic process(GO:0002903) |
| 0.1 | 1.2 | GO:0000395 | mRNA 5'-splice site recognition(GO:0000395) |
| 0.1 | 1.8 | GO:0045899 | positive regulation of RNA polymerase II transcriptional preinitiation complex assembly(GO:0045899) |
| 0.1 | 4.0 | GO:0072673 | lamellipodium morphogenesis(GO:0072673) |
| 0.1 | 2.6 | GO:1904030 | negative regulation of cyclin-dependent protein serine/threonine kinase activity(GO:0045736) negative regulation of cyclin-dependent protein kinase activity(GO:1904030) |
| 0.1 | 0.9 | GO:0008655 | pyrimidine-containing compound salvage(GO:0008655) pyrimidine nucleoside salvage(GO:0043097) |
| 0.1 | 3.4 | GO:0060236 | regulation of mitotic spindle organization(GO:0060236) |
| 0.1 | 4.7 | GO:0007602 | phototransduction(GO:0007602) |
| 0.1 | 2.1 | GO:0051457 | maintenance of protein location in nucleus(GO:0051457) |
| 0.1 | 17.6 | GO:0030518 | intracellular steroid hormone receptor signaling pathway(GO:0030518) |
| 0.1 | 4.1 | GO:0006471 | protein ADP-ribosylation(GO:0006471) |
| 0.1 | 1.4 | GO:0016446 | somatic hypermutation of immunoglobulin genes(GO:0016446) |
| 0.1 | 16.1 | GO:0035308 | negative regulation of protein dephosphorylation(GO:0035308) |
| 0.1 | 8.5 | GO:0000245 | spliceosomal complex assembly(GO:0000245) |
| 0.1 | 5.7 | GO:0043550 | regulation of lipid kinase activity(GO:0043550) |
| 0.1 | 7.1 | GO:0003333 | amino acid transmembrane transport(GO:0003333) |
| 0.1 | 1.0 | GO:0002315 | marginal zone B cell differentiation(GO:0002315) |
| 0.1 | 0.6 | GO:0000480 | endonucleolytic cleavage in 5'-ETS of tricistronic rRNA transcript (SSU-rRNA, 5.8S rRNA, LSU-rRNA)(GO:0000480) |
| 0.1 | 0.4 | GO:0002276 | basophil activation involved in immune response(GO:0002276) |
| 0.1 | 2.9 | GO:0022011 | myelination in peripheral nervous system(GO:0022011) peripheral nervous system axon ensheathment(GO:0032292) |
| 0.1 | 0.4 | GO:0052422 | modulation by symbiont of host molecular function(GO:0052055) modulation of catalytic activity in other organism involved in symbiotic interaction(GO:0052203) modulation by host of symbiont catalytic activity(GO:0052422) |
| 0.1 | 1.5 | GO:0051045 | negative regulation of membrane protein ectodomain proteolysis(GO:0051045) |
| 0.1 | 1.9 | GO:0006488 | dolichol-linked oligosaccharide biosynthetic process(GO:0006488) |
| 0.1 | 3.5 | GO:0030512 | negative regulation of transforming growth factor beta receptor signaling pathway(GO:0030512) negative regulation of cellular response to transforming growth factor beta stimulus(GO:1903845) |
| 0.1 | 2.2 | GO:0014883 | transition between fast and slow fiber(GO:0014883) |
| 0.1 | 3.0 | GO:0048488 | synaptic vesicle endocytosis(GO:0048488) |
| 0.1 | 7.1 | GO:0034605 | cellular response to heat(GO:0034605) |
| 0.1 | 0.7 | GO:2001032 | regulation of double-strand break repair via nonhomologous end joining(GO:2001032) |
| 0.1 | 0.9 | GO:1901844 | regulation of cell communication by electrical coupling involved in cardiac conduction(GO:1901844) |
| 0.1 | 1.2 | GO:0070536 | protein K63-linked deubiquitination(GO:0070536) |
| 0.1 | 4.5 | GO:0032456 | endocytic recycling(GO:0032456) |
| 0.1 | 4.7 | GO:0034198 | cellular response to amino acid starvation(GO:0034198) |
| 0.1 | 0.2 | GO:0035720 | intraciliary anterograde transport(GO:0035720) |
| 0.1 | 0.3 | GO:2000676 | positive regulation of type B pancreatic cell apoptotic process(GO:2000676) |
| 0.1 | 2.8 | GO:0000413 | protein peptidyl-prolyl isomerization(GO:0000413) |
| 0.1 | 4.6 | GO:0006904 | vesicle docking involved in exocytosis(GO:0006904) |
| 0.1 | 0.7 | GO:0036315 | cellular response to sterol(GO:0036315) cellular response to cholesterol(GO:0071397) |
| 0.1 | 8.0 | GO:0051225 | spindle assembly(GO:0051225) |
| 0.1 | 11.3 | GO:0019882 | antigen processing and presentation(GO:0019882) |
| 0.1 | 3.4 | GO:0030865 | cortical cytoskeleton organization(GO:0030865) |
| 0.1 | 1.1 | GO:0035987 | endodermal cell differentiation(GO:0035987) |
| 0.1 | 0.8 | GO:0061588 | calcium activated phospholipid scrambling(GO:0061588) calcium activated phosphatidylcholine scrambling(GO:0061590) calcium activated galactosylceramide scrambling(GO:0061591) |
| 0.1 | 0.5 | GO:0001706 | endoderm formation(GO:0001706) |
| 0.1 | 0.3 | GO:0010606 | positive regulation of cytoplasmic mRNA processing body assembly(GO:0010606) |
| 0.1 | 1.5 | GO:0051443 | positive regulation of ubiquitin-protein transferase activity(GO:0051443) |
| 0.1 | 17.4 | GO:0000398 | RNA splicing, via transesterification reactions with bulged adenosine as nucleophile(GO:0000377) mRNA splicing, via spliceosome(GO:0000398) |
| 0.1 | 1.7 | GO:0000338 | protein deneddylation(GO:0000338) |
| 0.1 | 4.2 | GO:0000266 | mitochondrial fission(GO:0000266) |
| 0.1 | 0.5 | GO:0010825 | positive regulation of centrosome duplication(GO:0010825) |
| 0.1 | 1.2 | GO:0042407 | cristae formation(GO:0042407) |
| 0.1 | 0.9 | GO:0045663 | positive regulation of myoblast differentiation(GO:0045663) |
| 0.1 | 1.0 | GO:0097150 | neuronal stem cell population maintenance(GO:0097150) |
| 0.1 | 0.3 | GO:0090076 | relaxation of skeletal muscle(GO:0090076) |
| 0.1 | 0.6 | GO:0043922 | negative regulation by host of viral transcription(GO:0043922) |
| 0.1 | 1.8 | GO:0006383 | transcription from RNA polymerase III promoter(GO:0006383) |
| 0.1 | 0.5 | GO:0036066 | protein O-linked fucosylation(GO:0036066) |
| 0.1 | 0.7 | GO:0032967 | positive regulation of collagen biosynthetic process(GO:0032967) |
| 0.1 | 0.9 | GO:0098787 | mRNA cleavage involved in mRNA processing(GO:0098787) pre-mRNA cleavage required for polyadenylation(GO:0098789) |
| 0.1 | 0.5 | GO:0010992 | ubiquitin homeostasis(GO:0010992) |
| 0.1 | 0.4 | GO:0060837 | blood vessel endothelial cell differentiation(GO:0060837) |
| 0.1 | 2.5 | GO:0000027 | ribosomal large subunit assembly(GO:0000027) |
| 0.1 | 1.4 | GO:0051967 | negative regulation of synaptic transmission, glutamatergic(GO:0051967) |
| 0.1 | 3.5 | GO:0043392 | negative regulation of DNA binding(GO:0043392) |
| 0.1 | 0.4 | GO:0097501 | stress response to metal ion(GO:0097501) |
| 0.1 | 0.2 | GO:0090245 | axis elongation involved in somitogenesis(GO:0090245) |
| 0.1 | 0.3 | GO:0033615 | mitochondrial proton-transporting ATP synthase complex assembly(GO:0033615) |
| 0.1 | 1.9 | GO:0008088 | axo-dendritic transport(GO:0008088) |
| 0.1 | 0.7 | GO:0048312 | intracellular distribution of mitochondria(GO:0048312) |
| 0.1 | 1.9 | GO:0006744 | ubiquinone biosynthetic process(GO:0006744) |
| 0.1 | 2.2 | GO:0007530 | sex determination(GO:0007530) |
| 0.1 | 1.0 | GO:1904851 | positive regulation of establishment of protein localization to telomere(GO:1904851) |
| 0.1 | 0.5 | GO:0035455 | response to interferon-alpha(GO:0035455) |
| 0.1 | 0.7 | GO:2000270 | negative regulation of fibroblast apoptotic process(GO:2000270) |
| 0.1 | 0.9 | GO:1902254 | negative regulation of intrinsic apoptotic signaling pathway by p53 class mediator(GO:1902254) |
| 0.1 | 0.8 | GO:0010764 | negative regulation of fibroblast migration(GO:0010764) |
| 0.1 | 3.2 | GO:0007098 | centrosome cycle(GO:0007098) |
| 0.1 | 1.0 | GO:0071361 | cellular response to ethanol(GO:0071361) |
| 0.1 | 0.8 | GO:0010667 | negative regulation of cardiac muscle cell apoptotic process(GO:0010667) |
| 0.1 | 0.5 | GO:2000774 | positive regulation of cellular senescence(GO:2000774) |
| 0.1 | 0.7 | GO:0006610 | ribosomal protein import into nucleus(GO:0006610) |
| 0.1 | 0.4 | GO:0042985 | negative regulation of amyloid precursor protein biosynthetic process(GO:0042985) |
| 0.1 | 0.7 | GO:0050961 | detection of temperature stimulus involved in sensory perception(GO:0050961) detection of temperature stimulus involved in sensory perception of pain(GO:0050965) |
| 0.1 | 0.6 | GO:0046959 | habituation(GO:0046959) |
| 0.1 | 0.1 | GO:0050955 | thermoception(GO:0050955) |
| 0.1 | 2.4 | GO:0042273 | ribosomal large subunit biogenesis(GO:0042273) |
| 0.1 | 7.5 | GO:0008380 | RNA splicing(GO:0008380) |
| 0.1 | 0.3 | GO:1900226 | negative regulation of NLRP3 inflammasome complex assembly(GO:1900226) |
| 0.1 | 1.4 | GO:0010165 | response to X-ray(GO:0010165) |
| 0.1 | 0.5 | GO:0090161 | Golgi ribbon formation(GO:0090161) |
| 0.1 | 3.7 | GO:0045494 | photoreceptor cell maintenance(GO:0045494) |
| 0.1 | 0.6 | GO:0070914 | UV-damage excision repair(GO:0070914) |
| 0.1 | 0.4 | GO:0006646 | phosphatidylethanolamine biosynthetic process(GO:0006646) |
| 0.1 | 0.3 | GO:2000809 | postsynaptic membrane assembly(GO:0097104) neuroligin clustering involved in postsynaptic membrane assembly(GO:0097118) positive regulation of presynaptic membrane organization(GO:1901631) positive regulation of synaptic vesicle clustering(GO:2000809) |
| 0.1 | 246.5 | GO:0006355 | regulation of transcription, DNA-templated(GO:0006355) |
| 0.1 | 1.0 | GO:0035767 | endothelial cell chemotaxis(GO:0035767) |
| 0.1 | 2.9 | GO:0009268 | response to pH(GO:0009268) |
| 0.1 | 0.9 | GO:0031297 | replication fork processing(GO:0031297) DNA-dependent DNA replication maintenance of fidelity(GO:0045005) |
| 0.1 | 0.6 | GO:2000637 | positive regulation of gene silencing by miRNA(GO:2000637) |
| 0.1 | 0.4 | GO:0032402 | melanosome transport(GO:0032402) |
| 0.1 | 0.3 | GO:2000772 | regulation of cell aging(GO:0090342) regulation of cellular senescence(GO:2000772) |
| 0.1 | 1.3 | GO:0097320 | membrane tubulation(GO:0097320) |
| 0.1 | 5.6 | GO:0007613 | memory(GO:0007613) |
| 0.1 | 0.2 | GO:0006772 | thiamine metabolic process(GO:0006772) thiamine-containing compound metabolic process(GO:0042723) |
| 0.1 | 0.5 | GO:0000301 | retrograde transport, vesicle recycling within Golgi(GO:0000301) |
| 0.1 | 0.2 | GO:0033299 | secretion of lysosomal enzymes(GO:0033299) |
| 0.1 | 2.1 | GO:0090263 | positive regulation of canonical Wnt signaling pathway(GO:0090263) |
| 0.1 | 0.2 | GO:0044208 | 'de novo' AMP biosynthetic process(GO:0044208) |
| 0.1 | 0.7 | GO:1904659 | glucose transmembrane transport(GO:1904659) |
| 0.1 | 6.9 | GO:0042787 | protein ubiquitination involved in ubiquitin-dependent protein catabolic process(GO:0042787) |
| 0.1 | 2.6 | GO:0007368 | determination of left/right symmetry(GO:0007368) |
| 0.0 | 5.3 | GO:0002244 | hematopoietic progenitor cell differentiation(GO:0002244) |
| 0.0 | 0.3 | GO:0046642 | negative regulation of alpha-beta T cell proliferation(GO:0046642) |
| 0.0 | 1.2 | GO:0033141 | positive regulation of peptidyl-serine phosphorylation of STAT protein(GO:0033141) |
| 0.0 | 0.1 | GO:0072402 | response to cell cycle checkpoint signaling(GO:0072396) response to DNA integrity checkpoint signaling(GO:0072402) response to DNA damage checkpoint signaling(GO:0072423) |
| 0.0 | 2.7 | GO:0050729 | positive regulation of inflammatory response(GO:0050729) |
| 0.0 | 0.4 | GO:0021978 | cerebral cortex regionalization(GO:0021796) telencephalon regionalization(GO:0021978) |
| 0.0 | 0.2 | GO:0034080 | CENP-A containing nucleosome assembly(GO:0034080) CENP-A containing chromatin organization(GO:0061641) |
| 0.0 | 0.7 | GO:0048169 | regulation of long-term neuronal synaptic plasticity(GO:0048169) |
| 0.0 | 12.1 | GO:0006887 | exocytosis(GO:0006887) |
| 0.0 | 2.0 | GO:0043407 | negative regulation of MAP kinase activity(GO:0043407) |
| 0.0 | 0.7 | GO:0097484 | dendrite extension(GO:0097484) |
| 0.0 | 0.3 | GO:0007080 | mitotic metaphase plate congression(GO:0007080) |
| 0.0 | 0.4 | GO:0060052 | neurofilament cytoskeleton organization(GO:0060052) |
| 0.0 | 0.3 | GO:1900262 | regulation of DNA-directed DNA polymerase activity(GO:1900262) positive regulation of DNA-directed DNA polymerase activity(GO:1900264) |
| 0.0 | 0.5 | GO:0031116 | positive regulation of microtubule polymerization(GO:0031116) |
| 0.0 | 0.8 | GO:0030150 | protein import into mitochondrial matrix(GO:0030150) |
| 0.0 | 0.3 | GO:0060352 | cell adhesion molecule production(GO:0060352) |
| 0.0 | 1.3 | GO:0006270 | DNA replication initiation(GO:0006270) |
| 0.0 | 3.9 | GO:0001666 | response to hypoxia(GO:0001666) |
| 0.0 | 1.2 | GO:0008299 | isoprenoid biosynthetic process(GO:0008299) |
| 0.0 | 3.0 | GO:0000910 | cytokinesis(GO:0000910) |
| 0.0 | 0.6 | GO:0031113 | regulation of microtubule polymerization(GO:0031113) |
| 0.0 | 0.9 | GO:0032204 | regulation of telomere maintenance(GO:0032204) |
| 0.0 | 1.4 | GO:2000649 | regulation of sodium ion transmembrane transporter activity(GO:2000649) |
| 0.0 | 0.4 | GO:0045747 | positive regulation of Notch signaling pathway(GO:0045747) |
| 0.0 | 0.1 | GO:0000290 | deadenylation-dependent decapping of nuclear-transcribed mRNA(GO:0000290) |
| 0.0 | 1.6 | GO:0097194 | execution phase of apoptosis(GO:0097194) |
| 0.0 | 0.8 | GO:0051703 | social behavior(GO:0035176) intraspecies interaction between organisms(GO:0051703) |
| 0.0 | 1.0 | GO:0018345 | protein palmitoylation(GO:0018345) |
| 0.0 | 0.4 | GO:0006379 | mRNA cleavage(GO:0006379) |
| 0.0 | 0.1 | GO:0046038 | GMP catabolic process(GO:0046038) |
| 0.0 | 0.8 | GO:0045600 | positive regulation of fat cell differentiation(GO:0045600) |
| 0.0 | 0.5 | GO:0046475 | glycerophospholipid catabolic process(GO:0046475) |
| 0.0 | 0.7 | GO:0048873 | homeostasis of number of cells within a tissue(GO:0048873) |
| 0.0 | 0.3 | GO:0046827 | positive regulation of protein export from nucleus(GO:0046827) |
| 0.0 | 2.7 | GO:0030534 | adult behavior(GO:0030534) |
| 0.0 | 1.1 | GO:0032526 | response to retinoic acid(GO:0032526) |
| 0.0 | 0.5 | GO:0002026 | regulation of the force of heart contraction(GO:0002026) |
| 0.0 | 1.5 | GO:0045444 | fat cell differentiation(GO:0045444) |
| 0.0 | 0.5 | GO:0001541 | ovarian follicle development(GO:0001541) |
| 0.0 | 0.1 | GO:0060340 | positive regulation of type I interferon-mediated signaling pathway(GO:0060340) |
| 0.0 | 2.1 | GO:0032869 | cellular response to insulin stimulus(GO:0032869) |
| 0.0 | 1.1 | GO:0070206 | protein trimerization(GO:0070206) |
| 0.0 | 0.6 | GO:0006513 | protein monoubiquitination(GO:0006513) |
| 0.0 | 0.8 | GO:0030490 | maturation of SSU-rRNA(GO:0030490) |
| 0.0 | 0.5 | GO:0006261 | DNA-dependent DNA replication(GO:0006261) |
| 0.0 | 0.2 | GO:0016973 | poly(A)+ mRNA export from nucleus(GO:0016973) |
| 0.0 | 0.2 | GO:0031581 | hemidesmosome assembly(GO:0031581) |
| 0.0 | 1.2 | GO:0019722 | calcium-mediated signaling(GO:0019722) |
| 0.0 | 0.1 | GO:1904294 | positive regulation of ERAD pathway(GO:1904294) |
| 0.0 | 0.1 | GO:2000179 | positive regulation of neural precursor cell proliferation(GO:2000179) |
Gene overrepresentation in cellular component category:
| Log-likelihood per target | Total log-likelihood | Term | Description |
|---|---|---|---|
| 4.3 | 17.2 | GO:0031088 | platelet dense granule membrane(GO:0031088) |
| 3.2 | 12.6 | GO:0016533 | cyclin-dependent protein kinase 5 holoenzyme complex(GO:0016533) |
| 3.1 | 18.7 | GO:0070044 | synaptobrevin 2-SNAP-25-syntaxin-1a complex(GO:0070044) |
| 3.1 | 12.4 | GO:1990298 | mitotic checkpoint complex(GO:0033597) bub1-bub3 complex(GO:1990298) |
| 3.0 | 12.1 | GO:0000438 | core TFIIH complex portion of holo TFIIH complex(GO:0000438) |
| 2.1 | 10.3 | GO:0098560 | cytoplasmic side of late endosome membrane(GO:0098560) |
| 1.8 | 16.5 | GO:0070545 | PeBoW complex(GO:0070545) |
| 1.8 | 5.4 | GO:0044317 | rod spherule(GO:0044317) |
| 1.8 | 9.0 | GO:1990745 | EARP complex(GO:1990745) |
| 1.6 | 4.9 | GO:0005965 | protein farnesyltransferase complex(GO:0005965) |
| 1.5 | 5.9 | GO:0097543 | ciliary inversin compartment(GO:0097543) |
| 1.4 | 5.6 | GO:0005879 | axonemal microtubule(GO:0005879) |
| 1.4 | 23.5 | GO:0005662 | DNA replication factor A complex(GO:0005662) |
| 1.2 | 6.0 | GO:0031166 | integral component of vacuolar membrane(GO:0031166) intrinsic component of vacuolar membrane(GO:0031310) |
| 1.2 | 16.2 | GO:0071598 | neuronal ribonucleoprotein granule(GO:0071598) |
| 1.1 | 3.4 | GO:0005863 | striated muscle myosin thick filament(GO:0005863) |
| 1.1 | 14.6 | GO:0071439 | clathrin complex(GO:0071439) |
| 1.1 | 16.6 | GO:0031209 | SCAR complex(GO:0031209) |
| 1.0 | 33.6 | GO:0005868 | cytoplasmic dynein complex(GO:0005868) |
| 1.0 | 7.0 | GO:0005655 | nucleolar ribonuclease P complex(GO:0005655) |
| 1.0 | 5.9 | GO:0034709 | methylosome(GO:0034709) |
| 1.0 | 2.9 | GO:0036501 | UFD1-NPL4 complex(GO:0036501) |
| 0.9 | 5.6 | GO:0030870 | Mre11 complex(GO:0030870) |
| 0.9 | 2.7 | GO:1990423 | RZZ complex(GO:1990423) |
| 0.9 | 4.4 | GO:0035363 | histone locus body(GO:0035363) |
| 0.9 | 14.7 | GO:0035748 | myelin sheath abaxonal region(GO:0035748) |
| 0.8 | 3.8 | GO:0061673 | mitotic spindle astral microtubule(GO:0061673) |
| 0.7 | 2.2 | GO:0043291 | RAVE complex(GO:0043291) |
| 0.7 | 2.2 | GO:0030905 | retromer, tubulation complex(GO:0030905) |
| 0.7 | 2.8 | GO:0090661 | box H/ACA telomerase RNP complex(GO:0090661) |
| 0.7 | 2.0 | GO:0005656 | nuclear pre-replicative complex(GO:0005656) pre-replicative complex(GO:0036387) |
| 0.7 | 2.0 | GO:0071001 | U4/U6 snRNP(GO:0071001) |
| 0.6 | 1.9 | GO:0055087 | Ski complex(GO:0055087) |
| 0.6 | 1.8 | GO:0097361 | CIA complex(GO:0097361) |
| 0.6 | 4.9 | GO:0031313 | extrinsic component of endosome membrane(GO:0031313) |
| 0.6 | 4.3 | GO:0042765 | GPI-anchor transamidase complex(GO:0042765) |
| 0.6 | 1.2 | GO:0097255 | R2TP complex(GO:0097255) |
| 0.6 | 8.8 | GO:0071203 | WASH complex(GO:0071203) |
| 0.6 | 10.6 | GO:0097539 | ciliary transition fiber(GO:0097539) |
| 0.6 | 2.9 | GO:0044614 | nuclear pore cytoplasmic filaments(GO:0044614) |
| 0.6 | 1.7 | GO:0070877 | microprocessor complex(GO:0070877) ribonuclease III complex(GO:1903095) |
| 0.6 | 7.9 | GO:0005736 | DNA-directed RNA polymerase I complex(GO:0005736) |
| 0.6 | 4.0 | GO:0044611 | nuclear pore inner ring(GO:0044611) |
| 0.5 | 18.6 | GO:0034451 | centriolar satellite(GO:0034451) |
| 0.5 | 2.7 | GO:1990130 | Iml1 complex(GO:1990130) |
| 0.5 | 4.9 | GO:0070652 | HAUS complex(GO:0070652) |
| 0.5 | 6.4 | GO:0001940 | male pronucleus(GO:0001940) |
| 0.5 | 16.4 | GO:0005689 | U12-type spliceosomal complex(GO:0005689) |
| 0.5 | 4.7 | GO:0000445 | THO complex(GO:0000347) THO complex part of transcription export complex(GO:0000445) |
| 0.5 | 11.1 | GO:0031011 | Ino80 complex(GO:0031011) |
| 0.5 | 5.0 | GO:0000776 | kinetochore(GO:0000776) |
| 0.5 | 0.5 | GO:1902737 | dendritic filopodium(GO:1902737) |
| 0.5 | 6.7 | GO:0000778 | condensed nuclear chromosome kinetochore(GO:0000778) |
| 0.5 | 1.9 | GO:0005687 | U4 snRNP(GO:0005687) |
| 0.5 | 5.3 | GO:0032541 | cortical endoplasmic reticulum(GO:0032541) |
| 0.5 | 4.7 | GO:0061700 | Seh1-associated complex(GO:0035859) GATOR2 complex(GO:0061700) |
| 0.4 | 6.7 | GO:0048787 | presynaptic active zone membrane(GO:0048787) |
| 0.4 | 3.9 | GO:0045298 | tubulin complex(GO:0045298) |
| 0.4 | 0.4 | GO:0005683 | U7 snRNP(GO:0005683) |
| 0.4 | 5.0 | GO:0031464 | Cul4A-RING E3 ubiquitin ligase complex(GO:0031464) |
| 0.4 | 3.4 | GO:0005818 | aster(GO:0005818) |
| 0.4 | 5.8 | GO:0071006 | U2-type catalytic step 1 spliceosome(GO:0071006) |
| 0.4 | 1.6 | GO:0033596 | TSC1-TSC2 complex(GO:0033596) |
| 0.4 | 13.5 | GO:0031307 | integral component of mitochondrial outer membrane(GO:0031307) |
| 0.4 | 1.5 | GO:0070531 | BRCA1-A complex(GO:0070531) |
| 0.4 | 9.3 | GO:0070822 | Sin3-type complex(GO:0070822) |
| 0.4 | 4.2 | GO:0044613 | nuclear pore central transport channel(GO:0044613) |
| 0.4 | 2.3 | GO:0005968 | Rab-protein geranylgeranyltransferase complex(GO:0005968) |
| 0.4 | 3.8 | GO:0000812 | Swr1 complex(GO:0000812) INO80-type complex(GO:0097346) |
| 0.4 | 1.9 | GO:0002142 | stereocilia ankle link complex(GO:0002142) |
| 0.4 | 1.8 | GO:0097025 | MPP7-DLG1-LIN7 complex(GO:0097025) |
| 0.4 | 1.1 | GO:0044302 | dentate gyrus mossy fiber(GO:0044302) |
| 0.4 | 7.3 | GO:0005682 | U5 snRNP(GO:0005682) |
| 0.4 | 4.7 | GO:0000788 | nuclear nucleosome(GO:0000788) |
| 0.4 | 5.4 | GO:0071004 | U2-type prespliceosome(GO:0071004) |
| 0.4 | 1.4 | GO:0089701 | U2AF(GO:0089701) |
| 0.4 | 1.8 | GO:0005945 | 6-phosphofructokinase complex(GO:0005945) |
| 0.4 | 7.4 | GO:0005697 | telomerase holoenzyme complex(GO:0005697) |
| 0.3 | 9.7 | GO:0071565 | nBAF complex(GO:0071565) |
| 0.3 | 1.9 | GO:0005658 | alpha DNA polymerase:primase complex(GO:0005658) |
| 0.3 | 4.8 | GO:0017101 | aminoacyl-tRNA synthetase multienzyme complex(GO:0017101) |
| 0.3 | 8.1 | GO:0043196 | varicosity(GO:0043196) |
| 0.3 | 3.5 | GO:0000176 | nuclear exosome (RNase complex)(GO:0000176) |
| 0.3 | 4.6 | GO:0016461 | unconventional myosin complex(GO:0016461) |
| 0.3 | 7.2 | GO:0035253 | ciliary rootlet(GO:0035253) |
| 0.3 | 8.5 | GO:0035869 | ciliary transition zone(GO:0035869) |
| 0.3 | 2.8 | GO:0070552 | BRISC complex(GO:0070552) |
| 0.3 | 6.9 | GO:0030867 | rough endoplasmic reticulum membrane(GO:0030867) |
| 0.3 | 2.5 | GO:0031933 | telomeric heterochromatin(GO:0031933) |
| 0.3 | 2.5 | GO:0070436 | Grb2-EGFR complex(GO:0070436) |
| 0.3 | 15.9 | GO:0036379 | striated muscle thin filament(GO:0005865) myofilament(GO:0036379) |
| 0.3 | 11.2 | GO:0035861 | site of double-strand break(GO:0035861) |
| 0.3 | 1.6 | GO:0005947 | mitochondrial alpha-ketoglutarate dehydrogenase complex(GO:0005947) |
| 0.3 | 1.6 | GO:0070876 | SOSS complex(GO:0070876) |
| 0.3 | 1.9 | GO:0002081 | outer acrosomal membrane(GO:0002081) |
| 0.3 | 24.3 | GO:0031463 | Cul3-RING ubiquitin ligase complex(GO:0031463) |
| 0.3 | 2.6 | GO:0044354 | pinosome(GO:0044352) macropinosome(GO:0044354) |
| 0.3 | 2.6 | GO:0071014 | post-mRNA release spliceosomal complex(GO:0071014) |
| 0.3 | 1.3 | GO:0097550 | transcriptional preinitiation complex(GO:0097550) |
| 0.3 | 6.1 | GO:0043596 | nuclear replication fork(GO:0043596) |
| 0.3 | 1.8 | GO:0005638 | lamin filament(GO:0005638) |
| 0.2 | 2.2 | GO:0031428 | box C/D snoRNP complex(GO:0031428) |
| 0.2 | 1.7 | GO:0036157 | outer dynein arm(GO:0036157) |
| 0.2 | 5.5 | GO:0005721 | pericentric heterochromatin(GO:0005721) |
| 0.2 | 11.2 | GO:0030173 | integral component of Golgi membrane(GO:0030173) |
| 0.2 | 4.1 | GO:0000145 | exocyst(GO:0000145) |
| 0.2 | 0.2 | GO:0000346 | transcription export complex(GO:0000346) |
| 0.2 | 10.4 | GO:0048786 | presynaptic active zone(GO:0048786) |
| 0.2 | 20.1 | GO:0005814 | centriole(GO:0005814) |
| 0.2 | 1.4 | GO:0031095 | platelet dense tubular network membrane(GO:0031095) |
| 0.2 | 2.5 | GO:0005666 | DNA-directed RNA polymerase III complex(GO:0005666) |
| 0.2 | 6.1 | GO:0000159 | protein phosphatase type 2A complex(GO:0000159) |
| 0.2 | 15.3 | GO:0000784 | nuclear chromosome, telomeric region(GO:0000784) |
| 0.2 | 1.4 | GO:0032983 | kainate selective glutamate receptor complex(GO:0032983) |
| 0.2 | 3.5 | GO:0033276 | transcription factor TFTC complex(GO:0033276) |
| 0.2 | 5.3 | GO:0030992 | intraciliary transport particle B(GO:0030992) |
| 0.2 | 3.0 | GO:0080008 | Cul4-RING E3 ubiquitin ligase complex(GO:0080008) |
| 0.2 | 2.9 | GO:0043240 | Fanconi anaemia nuclear complex(GO:0043240) |
| 0.2 | 0.5 | GO:0034455 | t-UTP complex(GO:0034455) |
| 0.1 | 1.0 | GO:0035102 | PRC1 complex(GO:0035102) |
| 0.1 | 0.7 | GO:0044530 | supraspliceosomal complex(GO:0044530) |
| 0.1 | 0.9 | GO:0005971 | ribonucleoside-diphosphate reductase complex(GO:0005971) |
| 0.1 | 13.1 | GO:0001750 | photoreceptor outer segment(GO:0001750) |
| 0.1 | 1.8 | GO:0072546 | ER membrane protein complex(GO:0072546) |
| 0.1 | 1.4 | GO:0005642 | annulate lamellae(GO:0005642) |
| 0.1 | 2.5 | GO:0031083 | BLOC-1 complex(GO:0031083) |
| 0.1 | 1.4 | GO:0044300 | cerebellar mossy fiber(GO:0044300) |
| 0.1 | 2.8 | GO:0005844 | polysome(GO:0005844) |
| 0.1 | 12.6 | GO:0005905 | clathrin-coated pit(GO:0005905) |
| 0.1 | 1.3 | GO:0071541 | eukaryotic translation initiation factor 3 complex, eIF3m(GO:0071541) |
| 0.1 | 1.4 | GO:0000815 | ESCRT III complex(GO:0000815) |
| 0.1 | 58.8 | GO:0005813 | centrosome(GO:0005813) |
| 0.1 | 0.8 | GO:0031080 | nuclear pore outer ring(GO:0031080) |
| 0.1 | 8.9 | GO:0071013 | catalytic step 2 spliceosome(GO:0071013) |
| 0.1 | 0.8 | GO:0005685 | U1 snRNP(GO:0005685) |
| 0.1 | 0.8 | GO:1990316 | ATG1/ULK1 kinase complex(GO:1990316) |
| 0.1 | 0.5 | GO:0009331 | glycerol-3-phosphate dehydrogenase complex(GO:0009331) |
| 0.1 | 0.8 | GO:0005744 | mitochondrial inner membrane presequence translocase complex(GO:0005744) |
| 0.1 | 0.7 | GO:0016593 | Cdc73/Paf1 complex(GO:0016593) |
| 0.1 | 0.6 | GO:0032299 | ribonuclease H2 complex(GO:0032299) |
| 0.1 | 4.2 | GO:0005776 | autophagosome(GO:0005776) |
| 0.1 | 1.7 | GO:0044447 | axoneme part(GO:0044447) |
| 0.1 | 1.2 | GO:0008540 | proteasome regulatory particle, base subcomplex(GO:0008540) |
| 0.1 | 0.3 | GO:0031597 | cytosolic proteasome complex(GO:0031597) |
| 0.1 | 1.2 | GO:1990124 | messenger ribonucleoprotein complex(GO:1990124) |
| 0.1 | 1.1 | GO:0005845 | mRNA cap binding complex(GO:0005845) RNA cap binding complex(GO:0034518) |
| 0.1 | 2.1 | GO:0032839 | dendrite cytoplasm(GO:0032839) |
| 0.1 | 32.7 | GO:0005874 | microtubule(GO:0005874) |
| 0.1 | 5.6 | GO:0031672 | A band(GO:0031672) |
| 0.1 | 0.7 | GO:0005786 | signal recognition particle, endoplasmic reticulum targeting(GO:0005786) signal recognition particle(GO:0048500) |
| 0.1 | 1.9 | GO:0030008 | TRAPP complex(GO:0030008) |
| 0.1 | 13.8 | GO:0010008 | endosome membrane(GO:0010008) |
| 0.1 | 0.9 | GO:0044295 | axonal growth cone(GO:0044295) |
| 0.1 | 18.4 | GO:0008021 | synaptic vesicle(GO:0008021) |
| 0.1 | 0.7 | GO:0071986 | Ragulator complex(GO:0071986) |
| 0.1 | 2.9 | GO:0005771 | multivesicular body(GO:0005771) |
| 0.1 | 7.0 | GO:0055037 | recycling endosome(GO:0055037) |
| 0.1 | 7.3 | GO:0017053 | transcriptional repressor complex(GO:0017053) |
| 0.1 | 3.4 | GO:0009295 | nucleoid(GO:0009295) mitochondrial nucleoid(GO:0042645) |
| 0.1 | 0.5 | GO:0043527 | tRNA methyltransferase complex(GO:0043527) |
| 0.1 | 7.1 | GO:0032587 | ruffle membrane(GO:0032587) |
| 0.1 | 3.0 | GO:0000118 | histone deacetylase complex(GO:0000118) |
| 0.1 | 28.4 | GO:0000790 | nuclear chromatin(GO:0000790) |
| 0.1 | 4.9 | GO:0005769 | early endosome(GO:0005769) |
| 0.1 | 2.9 | GO:0045171 | intercellular bridge(GO:0045171) |
| 0.1 | 2.8 | GO:0016592 | mediator complex(GO:0016592) |
| 0.1 | 5.5 | GO:0000428 | DNA-directed RNA polymerase complex(GO:0000428) |
| 0.1 | 0.4 | GO:0030897 | HOPS complex(GO:0030897) CORVET complex(GO:0033263) |
| 0.1 | 19.9 | GO:0031965 | nuclear membrane(GO:0031965) |
| 0.1 | 42.2 | GO:0048471 | perinuclear region of cytoplasm(GO:0048471) |
| 0.1 | 0.4 | GO:0033588 | Elongator holoenzyme complex(GO:0033588) |
| 0.1 | 1.2 | GO:0015030 | Cajal body(GO:0015030) |
| 0.1 | 3.0 | GO:0043195 | terminal bouton(GO:0043195) |
| 0.1 | 0.3 | GO:0031251 | PAN complex(GO:0031251) |
| 0.1 | 0.4 | GO:0030689 | Noc complex(GO:0030689) |
| 0.1 | 0.9 | GO:0005847 | mRNA cleavage and polyadenylation specificity factor complex(GO:0005847) |
| 0.1 | 1.3 | GO:0001891 | phagocytic cup(GO:0001891) |
| 0.1 | 11.1 | GO:0000139 | Golgi membrane(GO:0000139) |
| 0.1 | 46.8 | GO:0005730 | nucleolus(GO:0005730) |
| 0.1 | 0.3 | GO:0032279 | asymmetric synapse(GO:0032279) |
| 0.0 | 0.4 | GO:0019773 | proteasome core complex, alpha-subunit complex(GO:0019773) |
| 0.0 | 1.4 | GO:0000314 | organellar small ribosomal subunit(GO:0000314) mitochondrial small ribosomal subunit(GO:0005763) |
| 0.0 | 11.5 | GO:0045211 | postsynaptic membrane(GO:0045211) |
| 0.0 | 11.7 | GO:0016607 | nuclear speck(GO:0016607) |
| 0.0 | 1.6 | GO:0031305 | integral component of mitochondrial inner membrane(GO:0031305) |
| 0.0 | 0.7 | GO:0031235 | intrinsic component of the cytoplasmic side of the plasma membrane(GO:0031235) |
| 0.0 | 0.4 | GO:0097451 | glial limiting end-foot(GO:0097451) |
| 0.0 | 1.7 | GO:0008180 | COP9 signalosome(GO:0008180) |
| 0.0 | 0.5 | GO:0017119 | Golgi transport complex(GO:0017119) |
| 0.0 | 8.4 | GO:0030016 | myofibril(GO:0030016) |
| 0.0 | 5.9 | GO:0005774 | vacuolar membrane(GO:0005774) |
| 0.0 | 0.3 | GO:0031390 | Ctf18 RFC-like complex(GO:0031390) |
| 0.0 | 1.0 | GO:0008074 | guanylate cyclase complex, soluble(GO:0008074) |
| 0.0 | 0.3 | GO:0032592 | integral component of mitochondrial membrane(GO:0032592) |
| 0.0 | 14.7 | GO:0045177 | apical part of cell(GO:0045177) |
| 0.0 | 1.0 | GO:0030139 | endocytic vesicle(GO:0030139) |
| 0.0 | 1.5 | GO:0005681 | spliceosomal complex(GO:0005681) |
| 0.0 | 0.1 | GO:1902560 | GMP reductase complex(GO:1902560) |
| 0.0 | 0.3 | GO:0016012 | dystroglycan complex(GO:0016011) sarcoglycan complex(GO:0016012) |
| 0.0 | 0.2 | GO:0031201 | SNARE complex(GO:0031201) |
| 0.0 | 11.8 | GO:0005773 | vacuole(GO:0005773) |
| 0.0 | 2.5 | GO:0031968 | outer membrane(GO:0019867) organelle outer membrane(GO:0031968) |
| 0.0 | 1.0 | GO:0005834 | heterotrimeric G-protein complex(GO:0005834) |
| 0.0 | 0.3 | GO:0090665 | dystrophin-associated glycoprotein complex(GO:0016010) glycoprotein complex(GO:0090665) |
| 0.0 | 0.6 | GO:0015935 | small ribosomal subunit(GO:0015935) cytosolic small ribosomal subunit(GO:0022627) |
| 0.0 | 2.0 | GO:0008076 | voltage-gated potassium channel complex(GO:0008076) |
| 0.0 | 128.2 | GO:0005634 | nucleus(GO:0005634) |
| 0.0 | 0.5 | GO:0070971 | endoplasmic reticulum exit site(GO:0070971) |
| 0.0 | 1.7 | GO:0043209 | myelin sheath(GO:0043209) |
| 0.0 | 0.8 | GO:0043204 | perikaryon(GO:0043204) |
| 0.0 | 0.0 | GO:0002177 | manchette(GO:0002177) |
| 0.0 | 1.4 | GO:0019898 | extrinsic component of membrane(GO:0019898) |
Gene overrepresentation in molecular function category:
| Log-likelihood per target | Total log-likelihood | Term | Description |
|---|---|---|---|
| 6.1 | 18.3 | GO:0035516 | oxidative DNA demethylase activity(GO:0035516) RNA N6-methyladenosine dioxygenase activity(GO:1990931) |
| 4.1 | 12.4 | GO:0005457 | GDP-fucose transmembrane transporter activity(GO:0005457) purine nucleotide-sugar transmembrane transporter activity(GO:0036080) |
| 3.7 | 18.7 | GO:0005483 | soluble NSF attachment protein activity(GO:0005483) |
| 3.4 | 17.2 | GO:0005220 | inositol 1,4,5-trisphosphate-sensitive calcium-release channel activity(GO:0005220) |
| 3.4 | 20.6 | GO:0004706 | JUN kinase kinase kinase activity(GO:0004706) |
| 3.2 | 31.7 | GO:0045504 | dynein heavy chain binding(GO:0045504) |
| 2.1 | 8.6 | GO:0017150 | tRNA dihydrouridine synthase activity(GO:0017150) |
| 1.9 | 20.5 | GO:0036310 | annealing helicase activity(GO:0036310) |
| 1.9 | 13.0 | GO:0000403 | Y-form DNA binding(GO:0000403) |
| 1.8 | 12.8 | GO:0015234 | thiamine transmembrane transporter activity(GO:0015234) |
| 1.8 | 10.9 | GO:0016300 | tRNA (uracil) methyltransferase activity(GO:0016300) |
| 1.8 | 12.6 | GO:0030549 | acetylcholine receptor activator activity(GO:0030549) |
| 1.6 | 4.9 | GO:0004660 | protein farnesyltransferase activity(GO:0004660) |
| 1.6 | 4.8 | GO:0001042 | RNA polymerase I core binding(GO:0001042) |
| 1.6 | 9.4 | GO:0044020 | histone methyltransferase activity (H4-R3 specific)(GO:0044020) |
| 1.5 | 4.5 | GO:0004819 | glutamine-tRNA ligase activity(GO:0004819) leucine-tRNA ligase activity(GO:0004823) |
| 1.4 | 13.0 | GO:0003836 | beta-galactoside (CMP) alpha-2,3-sialyltransferase activity(GO:0003836) |
| 1.4 | 7.1 | GO:0001032 | RNA polymerase III type 3 promoter DNA binding(GO:0001032) |
| 1.4 | 7.0 | GO:0000700 | mismatch base pair DNA N-glycosylase activity(GO:0000700) |
| 1.3 | 3.8 | GO:0008988 | rRNA (adenine-N6,N6-)-dimethyltransferase activity(GO:0000179) rRNA (adenine-N6-)-methyltransferase activity(GO:0008988) |
| 1.3 | 3.8 | GO:0035175 | histone kinase activity (H3-S10 specific)(GO:0035175) |
| 1.2 | 4.8 | GO:0035827 | rubidium ion transmembrane transporter activity(GO:0035827) |
| 1.2 | 6.9 | GO:0004594 | pantothenate kinase activity(GO:0004594) |
| 1.1 | 4.4 | GO:0004711 | ribosomal protein S6 kinase activity(GO:0004711) |
| 1.1 | 3.3 | GO:0052658 | inositol-1,4,5-trisphosphate 5-phosphatase activity(GO:0052658) |
| 1.0 | 6.3 | GO:0010997 | anaphase-promoting complex binding(GO:0010997) |
| 1.0 | 2.0 | GO:0009019 | tRNA (guanine-N1-)-methyltransferase activity(GO:0009019) |
| 1.0 | 9.8 | GO:0003720 | telomerase activity(GO:0003720) RNA-directed DNA polymerase activity(GO:0003964) |
| 1.0 | 5.8 | GO:0004614 | phosphoglucomutase activity(GO:0004614) |
| 0.9 | 20.6 | GO:0070016 | armadillo repeat domain binding(GO:0070016) |
| 0.9 | 3.5 | GO:0005136 | interleukin-4 receptor binding(GO:0005136) |
| 0.9 | 5.3 | GO:0034190 | apolipoprotein receptor binding(GO:0034190) |
| 0.8 | 4.2 | GO:0030621 | U4 snRNA binding(GO:0030621) |
| 0.8 | 2.4 | GO:0004140 | dephospho-CoA kinase activity(GO:0004140) |
| 0.8 | 2.3 | GO:0000171 | ribonuclease MRP activity(GO:0000171) |
| 0.8 | 6.9 | GO:0008479 | queuine tRNA-ribosyltransferase activity(GO:0008479) |
| 0.8 | 5.3 | GO:0005095 | GTPase inhibitor activity(GO:0005095) |
| 0.8 | 8.3 | GO:0031749 | D2 dopamine receptor binding(GO:0031749) |
| 0.7 | 3.6 | GO:0004839 | ubiquitin activating enzyme activity(GO:0004839) |
| 0.7 | 2.8 | GO:0030144 | alpha-1,6-mannosylglycoprotein 6-beta-N-acetylglucosaminyltransferase activity(GO:0030144) |
| 0.7 | 4.2 | GO:0008568 | microtubule-severing ATPase activity(GO:0008568) |
| 0.7 | 4.1 | GO:0008518 | reduced folate carrier activity(GO:0008518) |
| 0.7 | 4.7 | GO:0004526 | ribonuclease P activity(GO:0004526) |
| 0.7 | 6.6 | GO:0008174 | mRNA methyltransferase activity(GO:0008174) |
| 0.6 | 6.4 | GO:0019104 | DNA N-glycosylase activity(GO:0019104) |
| 0.6 | 8.3 | GO:0097157 | pre-mRNA intronic binding(GO:0097157) |
| 0.6 | 1.9 | GO:0003896 | DNA primase activity(GO:0003896) |
| 0.6 | 4.4 | GO:0046912 | transferase activity, transferring acyl groups, acyl groups converted into alkyl on transfer(GO:0046912) |
| 0.6 | 2.5 | GO:0016833 | oxo-acid-lyase activity(GO:0016833) |
| 0.6 | 4.3 | GO:0003923 | GPI-anchor transamidase activity(GO:0003923) |
| 0.6 | 7.9 | GO:0001054 | RNA polymerase I activity(GO:0001054) |
| 0.6 | 6.6 | GO:0031419 | cobalamin binding(GO:0031419) |
| 0.6 | 9.6 | GO:0009982 | pseudouridine synthase activity(GO:0009982) |
| 0.6 | 4.0 | GO:0048256 | flap endonuclease activity(GO:0048256) |
| 0.6 | 2.8 | GO:0015137 | citrate transmembrane transporter activity(GO:0015137) tricarboxylic acid transmembrane transporter activity(GO:0015142) |
| 0.6 | 2.8 | GO:0034513 | box H/ACA snoRNA binding(GO:0034513) |
| 0.6 | 2.2 | GO:0031544 | peptidyl-proline 3-dioxygenase activity(GO:0031544) |
| 0.5 | 2.2 | GO:1990460 | leptin receptor binding(GO:1990460) |
| 0.5 | 8.1 | GO:0034450 | ubiquitin-ubiquitin ligase activity(GO:0034450) |
| 0.5 | 1.6 | GO:0004372 | glycine hydroxymethyltransferase activity(GO:0004372) |
| 0.5 | 2.6 | GO:0010484 | H3 histone acetyltransferase activity(GO:0010484) |
| 0.5 | 14.8 | GO:0097602 | cullin family protein binding(GO:0097602) |
| 0.5 | 3.2 | GO:0070728 | leucine binding(GO:0070728) |
| 0.5 | 9.3 | GO:1990226 | histone methyltransferase binding(GO:1990226) |
| 0.5 | 21.0 | GO:0030742 | GTP-dependent protein binding(GO:0030742) |
| 0.5 | 3.1 | GO:0005047 | signal recognition particle binding(GO:0005047) |
| 0.5 | 12.6 | GO:0005523 | tropomyosin binding(GO:0005523) |
| 0.5 | 5.4 | GO:0000774 | adenyl-nucleotide exchange factor activity(GO:0000774) |
| 0.5 | 10.3 | GO:0035612 | AP-2 adaptor complex binding(GO:0035612) |
| 0.5 | 1.4 | GO:0004379 | glycylpeptide N-tetradecanoyltransferase activity(GO:0004379) myristoyltransferase activity(GO:0019107) |
| 0.5 | 2.8 | GO:1990715 | mRNA CDS binding(GO:1990715) |
| 0.5 | 5.6 | GO:0003906 | DNA-(apurinic or apyrimidinic site) lyase activity(GO:0003906) |
| 0.4 | 1.3 | GO:0032129 | histone deacetylase activity (H3-K9 specific)(GO:0032129) NAD-dependent histone deacetylase activity (H3-K9 specific)(GO:0046969) |
| 0.4 | 4.3 | GO:0050733 | RS domain binding(GO:0050733) |
| 0.4 | 6.4 | GO:0070403 | NAD+ binding(GO:0070403) |
| 0.4 | 3.0 | GO:0015186 | L-glutamine transmembrane transporter activity(GO:0015186) |
| 0.4 | 16.2 | GO:0044183 | protein binding involved in protein folding(GO:0044183) |
| 0.4 | 35.9 | GO:0048365 | Rac GTPase binding(GO:0048365) |
| 0.4 | 6.7 | GO:0005522 | profilin binding(GO:0005522) |
| 0.4 | 2.0 | GO:0003880 | protein C-terminal carboxyl O-methyltransferase activity(GO:0003880) |
| 0.4 | 3.7 | GO:0005078 | MAP-kinase scaffold activity(GO:0005078) |
| 0.4 | 1.1 | GO:0036004 | GAF domain binding(GO:0036004) |
| 0.4 | 2.5 | GO:0061665 | SUMO ligase activity(GO:0061665) |
| 0.4 | 0.4 | GO:0030620 | U2 snRNA binding(GO:0030620) |
| 0.4 | 1.8 | GO:0003872 | 6-phosphofructokinase activity(GO:0003872) |
| 0.4 | 13.0 | GO:0004003 | ATP-dependent DNA helicase activity(GO:0004003) |
| 0.3 | 9.7 | GO:0034062 | DNA-directed RNA polymerase activity(GO:0003899) RNA polymerase activity(GO:0034062) |
| 0.3 | 16.7 | GO:0050750 | low-density lipoprotein particle receptor binding(GO:0050750) |
| 0.3 | 1.7 | GO:0032296 | ribonuclease III activity(GO:0004525) double-stranded RNA-specific ribonuclease activity(GO:0032296) |
| 0.3 | 1.0 | GO:0033829 | O-fucosylpeptide 3-beta-N-acetylglucosaminyltransferase activity(GO:0033829) |
| 0.3 | 2.0 | GO:0043138 | 3'-5' DNA helicase activity(GO:0043138) |
| 0.3 | 1.7 | GO:0005250 | A-type (transient outward) potassium channel activity(GO:0005250) |
| 0.3 | 2.5 | GO:0019869 | chloride channel inhibitor activity(GO:0019869) |
| 0.3 | 1.2 | GO:0004052 | arachidonate 12-lipoxygenase activity(GO:0004052) |
| 0.3 | 1.2 | GO:0004337 | dimethylallyltranstransferase activity(GO:0004161) geranyltranstransferase activity(GO:0004337) |
| 0.3 | 4.7 | GO:0008349 | MAP kinase kinase kinase kinase activity(GO:0008349) |
| 0.3 | 2.3 | GO:0034452 | dynactin binding(GO:0034452) |
| 0.3 | 2.9 | GO:0016427 | tRNA (cytosine) methyltransferase activity(GO:0016427) |
| 0.3 | 12.0 | GO:0033558 | histone deacetylase activity(GO:0004407) protein deacetylase activity(GO:0033558) |
| 0.3 | 1.9 | GO:0000182 | rDNA binding(GO:0000182) |
| 0.3 | 3.3 | GO:0001135 | transcription factor activity, RNA polymerase II transcription factor recruiting(GO:0001135) |
| 0.3 | 6.0 | GO:0070300 | phosphatidic acid binding(GO:0070300) |
| 0.3 | 1.8 | GO:0097016 | L27 domain binding(GO:0097016) |
| 0.3 | 7.0 | GO:0032794 | GTPase activating protein binding(GO:0032794) |
| 0.3 | 5.8 | GO:0005487 | nucleocytoplasmic transporter activity(GO:0005487) |
| 0.2 | 20.6 | GO:0019894 | kinesin binding(GO:0019894) |
| 0.2 | 2.9 | GO:0036435 | K48-linked polyubiquitin binding(GO:0036435) |
| 0.2 | 2.1 | GO:0000990 | transcription factor activity, core RNA polymerase binding(GO:0000990) |
| 0.2 | 1.4 | GO:0015277 | kainate selective glutamate receptor activity(GO:0015277) |
| 0.2 | 3.5 | GO:0042577 | lipid phosphatase activity(GO:0042577) |
| 0.2 | 2.5 | GO:0005007 | fibroblast growth factor-activated receptor activity(GO:0005007) |
| 0.2 | 1.2 | GO:0015173 | aromatic amino acid transmembrane transporter activity(GO:0015173) |
| 0.2 | 4.6 | GO:0017160 | Ral GTPase binding(GO:0017160) |
| 0.2 | 1.1 | GO:0047696 | beta-adrenergic receptor kinase activity(GO:0047696) |
| 0.2 | 2.5 | GO:0070739 | protein-glutamic acid ligase activity(GO:0070739) |
| 0.2 | 0.7 | GO:0070699 | type II activin receptor binding(GO:0070699) |
| 0.2 | 3.8 | GO:0051011 | microtubule minus-end binding(GO:0051011) |
| 0.2 | 11.7 | GO:0050699 | WW domain binding(GO:0050699) |
| 0.2 | 36.5 | GO:0000149 | SNARE binding(GO:0000149) |
| 0.2 | 0.6 | GO:0032767 | copper-dependent protein binding(GO:0032767) |
| 0.2 | 0.2 | GO:0070540 | stearic acid binding(GO:0070540) |
| 0.2 | 1.4 | GO:0052650 | NADP-retinol dehydrogenase activity(GO:0052650) |
| 0.2 | 1.4 | GO:0030628 | pre-mRNA 3'-splice site binding(GO:0030628) |
| 0.2 | 6.2 | GO:0005337 | nucleoside transmembrane transporter activity(GO:0005337) |
| 0.2 | 3.9 | GO:0004708 | MAP kinase kinase activity(GO:0004708) |
| 0.2 | 5.6 | GO:0017056 | structural constituent of nuclear pore(GO:0017056) |
| 0.2 | 1.2 | GO:0004523 | RNA-DNA hybrid ribonuclease activity(GO:0004523) |
| 0.2 | 1.0 | GO:0031493 | nucleosomal histone binding(GO:0031493) |
| 0.2 | 0.8 | GO:0035575 | histone demethylase activity (H4-K20 specific)(GO:0035575) |
| 0.2 | 2.3 | GO:0097322 | 7SK snRNA binding(GO:0097322) |
| 0.2 | 0.5 | GO:0016005 | phospholipase A2 activator activity(GO:0016005) |
| 0.2 | 3.7 | GO:0035613 | RNA stem-loop binding(GO:0035613) |
| 0.2 | 0.7 | GO:0030942 | endoplasmic reticulum signal peptide binding(GO:0030942) |
| 0.2 | 0.7 | GO:0071208 | histone pre-mRNA DCP binding(GO:0071208) U7 snRNA binding(GO:0071209) |
| 0.2 | 1.9 | GO:0070034 | telomerase RNA binding(GO:0070034) |
| 0.2 | 0.8 | GO:0004719 | protein-L-isoaspartate (D-aspartate) O-methyltransferase activity(GO:0004719) |
| 0.2 | 3.5 | GO:0030544 | Hsp70 protein binding(GO:0030544) |
| 0.2 | 0.8 | GO:0004305 | ethanolamine kinase activity(GO:0004305) |
| 0.2 | 1.6 | GO:1990825 | sequence-specific mRNA binding(GO:1990825) |
| 0.2 | 8.7 | GO:0032266 | phosphatidylinositol-3-phosphate binding(GO:0032266) |
| 0.2 | 0.5 | GO:0016426 | tRNA (adenine) methyltransferase activity(GO:0016426) |
| 0.2 | 1.2 | GO:0005166 | neurotrophin p75 receptor binding(GO:0005166) |
| 0.1 | 6.1 | GO:0043015 | gamma-tubulin binding(GO:0043015) |
| 0.1 | 2.1 | GO:0004385 | guanylate kinase activity(GO:0004385) |
| 0.1 | 0.9 | GO:0004748 | ribonucleoside-diphosphate reductase activity, thioredoxin disulfide as acceptor(GO:0004748) oxidoreductase activity, acting on CH or CH2 groups, disulfide as acceptor(GO:0016728) ribonucleoside-diphosphate reductase activity(GO:0061731) |
| 0.1 | 0.7 | GO:0043812 | phosphatidylinositol-4-phosphate phosphatase activity(GO:0043812) |
| 0.1 | 2.8 | GO:0102391 | decanoate--CoA ligase activity(GO:0102391) |
| 0.1 | 1.4 | GO:0003909 | DNA ligase activity(GO:0003909) DNA ligase (ATP) activity(GO:0003910) |
| 0.1 | 6.1 | GO:1990841 | promoter-specific chromatin binding(GO:1990841) |
| 0.1 | 0.9 | GO:0004849 | uridine kinase activity(GO:0004849) |
| 0.1 | 0.5 | GO:0030375 | thyroid hormone receptor coactivator activity(GO:0030375) |
| 0.1 | 2.9 | GO:0005247 | voltage-gated chloride channel activity(GO:0005247) |
| 0.1 | 1.7 | GO:0000900 | translation repressor activity, nucleic acid binding(GO:0000900) |
| 0.1 | 4.5 | GO:0000175 | 3'-5'-exoribonuclease activity(GO:0000175) |
| 0.1 | 2.0 | GO:0042809 | vitamin D receptor binding(GO:0042809) |
| 0.1 | 6.9 | GO:0017112 | Rab guanyl-nucleotide exchange factor activity(GO:0017112) |
| 0.1 | 10.1 | GO:0001104 | RNA polymerase II transcription cofactor activity(GO:0001104) |
| 0.1 | 216.7 | GO:0001071 | nucleic acid binding transcription factor activity(GO:0001071) transcription factor activity, sequence-specific DNA binding(GO:0003700) |
| 0.1 | 2.3 | GO:0005092 | GDP-dissociation inhibitor activity(GO:0005092) |
| 0.1 | 33.7 | GO:0008514 | organic anion transmembrane transporter activity(GO:0008514) |
| 0.1 | 0.4 | GO:0098808 | mRNA cap binding(GO:0098808) |
| 0.1 | 4.7 | GO:0035255 | ionotropic glutamate receptor binding(GO:0035255) |
| 0.1 | 1.5 | GO:0050321 | tau-protein kinase activity(GO:0050321) |
| 0.1 | 2.4 | GO:0018024 | histone-lysine N-methyltransferase activity(GO:0018024) |
| 0.1 | 1.1 | GO:0071855 | neuropeptide receptor binding(GO:0071855) |
| 0.1 | 0.7 | GO:0000340 | RNA 7-methylguanosine cap binding(GO:0000340) |
| 0.1 | 6.5 | GO:0008026 | ATP-dependent helicase activity(GO:0008026) purine NTP-dependent helicase activity(GO:0070035) |
| 0.1 | 1.5 | GO:0035259 | glucocorticoid receptor binding(GO:0035259) |
| 0.1 | 0.5 | GO:0004367 | glycerol-3-phosphate dehydrogenase [NAD+] activity(GO:0004367) |
| 0.1 | 2.1 | GO:0008191 | metalloendopeptidase inhibitor activity(GO:0008191) |
| 0.1 | 0.7 | GO:0089720 | caspase binding(GO:0089720) |
| 0.1 | 0.5 | GO:0019961 | interferon binding(GO:0019961) |
| 0.1 | 1.6 | GO:0030296 | protein tyrosine kinase activator activity(GO:0030296) |
| 0.1 | 2.7 | GO:0030247 | pattern binding(GO:0001871) polysaccharide binding(GO:0030247) |
| 0.1 | 1.1 | GO:0017169 | CDP-alcohol phosphatidyltransferase activity(GO:0017169) |
| 0.1 | 0.5 | GO:0035184 | histone threonine kinase activity(GO:0035184) |
| 0.1 | 1.2 | GO:0008327 | methyl-CpG binding(GO:0008327) |
| 0.1 | 1.0 | GO:0003688 | DNA replication origin binding(GO:0003688) |
| 0.1 | 2.0 | GO:0005159 | insulin-like growth factor receptor binding(GO:0005159) |
| 0.1 | 1.0 | GO:0004016 | adenylate cyclase activity(GO:0004016) |
| 0.1 | 2.5 | GO:0045503 | dynein light chain binding(GO:0045503) |
| 0.1 | 0.7 | GO:0001103 | RNA polymerase II repressing transcription factor binding(GO:0001103) |
| 0.1 | 0.2 | GO:0032453 | histone demethylase activity (H3-K4 specific)(GO:0032453) |
| 0.1 | 1.4 | GO:0008484 | sulfuric ester hydrolase activity(GO:0008484) |
| 0.1 | 1.8 | GO:0017025 | TBP-class protein binding(GO:0017025) |
| 0.1 | 0.5 | GO:0004865 | protein serine/threonine phosphatase inhibitor activity(GO:0004865) |
| 0.1 | 4.6 | GO:0002039 | p53 binding(GO:0002039) |
| 0.1 | 0.9 | GO:0004017 | adenylate kinase activity(GO:0004017) |
| 0.1 | 4.1 | GO:0004222 | metalloendopeptidase activity(GO:0004222) |
| 0.1 | 3.3 | GO:0004693 | cyclin-dependent protein serine/threonine kinase activity(GO:0004693) |
| 0.1 | 0.2 | GO:0004019 | adenylosuccinate synthase activity(GO:0004019) |
| 0.1 | 2.0 | GO:0004190 | aspartic-type endopeptidase activity(GO:0004190) |
| 0.1 | 8.0 | GO:0043130 | ubiquitin binding(GO:0043130) |
| 0.1 | 1.9 | GO:0043325 | phosphatidylinositol-3,4-bisphosphate binding(GO:0043325) |
| 0.1 | 1.6 | GO:0042162 | telomeric DNA binding(GO:0042162) |
| 0.1 | 1.7 | GO:0004622 | lysophospholipase activity(GO:0004622) |
| 0.1 | 2.2 | GO:0035326 | enhancer binding(GO:0035326) |
| 0.1 | 6.8 | GO:0019888 | protein phosphatase regulator activity(GO:0019888) |
| 0.1 | 0.4 | GO:0097027 | ubiquitin-protein transferase activator activity(GO:0097027) |
| 0.1 | 3.4 | GO:0016831 | carboxy-lyase activity(GO:0016831) |
| 0.1 | 6.0 | GO:0045309 | protein phosphorylated amino acid binding(GO:0045309) |
| 0.1 | 0.7 | GO:0005412 | glucose:sodium symporter activity(GO:0005412) |
| 0.1 | 1.8 | GO:0004198 | calcium-dependent cysteine-type endopeptidase activity(GO:0004198) |
| 0.1 | 1.0 | GO:0017017 | MAP kinase tyrosine/serine/threonine phosphatase activity(GO:0017017) |
| 0.1 | 1.1 | GO:0051010 | microtubule plus-end binding(GO:0051010) |
| 0.1 | 0.3 | GO:1990247 | N6-methyladenosine-containing RNA binding(GO:1990247) |
| 0.1 | 0.4 | GO:0052654 | branched-chain-amino-acid transaminase activity(GO:0004084) L-leucine transaminase activity(GO:0052654) L-valine transaminase activity(GO:0052655) L-isoleucine transaminase activity(GO:0052656) |
| 0.1 | 3.6 | GO:0008307 | structural constituent of muscle(GO:0008307) |
| 0.1 | 0.3 | GO:0004809 | tRNA (guanine-N2-)-methyltransferase activity(GO:0004809) |
| 0.1 | 0.3 | GO:0046976 | histone methyltransferase activity (H3-K27 specific)(GO:0046976) |
| 0.1 | 1.2 | GO:0005132 | type I interferon receptor binding(GO:0005132) |
| 0.1 | 1.6 | GO:0003684 | damaged DNA binding(GO:0003684) |
| 0.1 | 0.3 | GO:0003829 | beta-1,3-galactosyl-O-glycosyl-glycoprotein beta-1,6-N-acetylglucosaminyltransferase activity(GO:0003829) |
| 0.1 | 0.1 | GO:0034046 | poly(G) binding(GO:0034046) |
| 0.0 | 0.9 | GO:0043014 | alpha-tubulin binding(GO:0043014) |
| 0.0 | 0.3 | GO:0043199 | sulfate binding(GO:0043199) |
| 0.0 | 1.8 | GO:0004712 | protein serine/threonine/tyrosine kinase activity(GO:0004712) |
| 0.0 | 0.5 | GO:0043142 | single-stranded DNA-dependent ATPase activity(GO:0043142) |
| 0.0 | 3.9 | GO:0003714 | transcription corepressor activity(GO:0003714) |
| 0.0 | 0.6 | GO:0031386 | protein tag(GO:0031386) |
| 0.0 | 3.6 | GO:0051213 | dioxygenase activity(GO:0051213) |
| 0.0 | 2.7 | GO:0019003 | GDP binding(GO:0019003) |
| 0.0 | 1.4 | GO:0001099 | basal transcription machinery binding(GO:0001098) basal RNA polymerase II transcription machinery binding(GO:0001099) |
| 0.0 | 0.2 | GO:0004652 | polynucleotide adenylyltransferase activity(GO:0004652) |
| 0.0 | 7.7 | GO:0044822 | mRNA binding(GO:0003729) poly(A) RNA binding(GO:0044822) |
| 0.0 | 0.5 | GO:0008417 | fucosyltransferase activity(GO:0008417) |
| 0.0 | 0.4 | GO:0070181 | small ribosomal subunit rRNA binding(GO:0070181) |
| 0.0 | 1.0 | GO:0051400 | BH domain binding(GO:0051400) |
| 0.0 | 0.8 | GO:0017128 | phospholipid scramblase activity(GO:0017128) |
| 0.0 | 0.6 | GO:0051059 | NF-kappaB binding(GO:0051059) |
| 0.0 | 1.6 | GO:0008009 | chemokine activity(GO:0008009) |
| 0.0 | 0.6 | GO:0008574 | ATP-dependent microtubule motor activity, plus-end-directed(GO:0008574) |
| 0.0 | 0.7 | GO:0050072 | m7G(5')pppN diphosphatase activity(GO:0050072) |
| 0.0 | 0.2 | GO:1990932 | 5.8S rRNA binding(GO:1990932) |
| 0.0 | 1.3 | GO:0005035 | tumor necrosis factor-activated receptor activity(GO:0005031) death receptor activity(GO:0005035) |
| 0.0 | 0.3 | GO:0061133 | endopeptidase activator activity(GO:0061133) |
| 0.0 | 0.7 | GO:0034061 | DNA polymerase activity(GO:0034061) |
| 0.0 | 22.6 | GO:0008270 | zinc ion binding(GO:0008270) |
| 0.0 | 0.1 | GO:0001729 | ceramide kinase activity(GO:0001729) |
| 0.0 | 1.5 | GO:0004527 | exonuclease activity(GO:0004527) |
| 0.0 | 0.5 | GO:0046527 | glucosyltransferase activity(GO:0046527) |
| 0.0 | 0.3 | GO:0042285 | xylosyltransferase activity(GO:0042285) |
| 0.0 | 1.9 | GO:0004402 | histone acetyltransferase activity(GO:0004402) |
| 0.0 | 0.1 | GO:0004938 | alpha2-adrenergic receptor activity(GO:0004938) norepinephrine binding(GO:0051380) |
| 0.0 | 35.6 | GO:0003677 | DNA binding(GO:0003677) |
| 0.0 | 0.7 | GO:0015095 | magnesium ion transmembrane transporter activity(GO:0015095) |
| 0.0 | 0.1 | GO:0036033 | mediator complex binding(GO:0036033) |
| 0.0 | 0.1 | GO:0003920 | GMP reductase activity(GO:0003920) oxidoreductase activity, acting on NAD(P)H, nitrogenous group as acceptor(GO:0016657) |
| 0.0 | 0.8 | GO:0017134 | fibroblast growth factor binding(GO:0017134) |
| 0.0 | 1.8 | GO:0017022 | myosin binding(GO:0017022) |
| 0.0 | 1.6 | GO:0017080 | sodium channel regulator activity(GO:0017080) |
| 0.0 | 6.6 | GO:0008017 | microtubule binding(GO:0008017) |
| 0.0 | 1.7 | GO:0001540 | beta-amyloid binding(GO:0001540) |
| 0.0 | 5.3 | GO:0008022 | protein C-terminus binding(GO:0008022) |
| 0.0 | 0.3 | GO:0004565 | beta-galactosidase activity(GO:0004565) |
| 0.0 | 11.7 | GO:0004842 | ubiquitin-protein transferase activity(GO:0004842) |
| 0.0 | 14.7 | GO:0003779 | actin binding(GO:0003779) |
| 0.0 | 0.5 | GO:0051879 | Hsp90 protein binding(GO:0051879) |
| 0.0 | 0.9 | GO:0004115 | 3',5'-cyclic-AMP phosphodiesterase activity(GO:0004115) |
| 0.0 | 1.3 | GO:0047485 | protein N-terminus binding(GO:0047485) |
| 0.0 | 0.8 | GO:0017048 | Rho GTPase binding(GO:0017048) |
| 0.0 | 0.3 | GO:0086008 | voltage-gated potassium channel activity involved in cardiac muscle cell action potential repolarization(GO:0086008) |
| 0.0 | 0.0 | GO:0034186 | apolipoprotein A-I binding(GO:0034186) |
| 0.0 | 31.2 | GO:0003676 | nucleic acid binding(GO:0003676) |
| 0.0 | 2.1 | GO:0005516 | calmodulin binding(GO:0005516) |
| 0.0 | 0.3 | GO:0035256 | type 5 metabotropic glutamate receptor binding(GO:0031802) G-protein coupled glutamate receptor binding(GO:0035256) |
| 0.0 | 3.4 | GO:0001664 | G-protein coupled receptor binding(GO:0001664) |
| 0.0 | 9.2 | GO:0004674 | protein serine/threonine kinase activity(GO:0004674) |
| 0.0 | 1.5 | GO:0008375 | acetylglucosaminyltransferase activity(GO:0008375) |
| 0.0 | 1.3 | GO:0016811 | hydrolase activity, acting on carbon-nitrogen (but not peptide) bonds, in linear amides(GO:0016811) |
| 0.0 | 0.3 | GO:0030955 | potassium ion binding(GO:0030955) |
| 0.0 | 0.4 | GO:0003774 | motor activity(GO:0003774) |
| 0.0 | 2.6 | GO:0005179 | hormone activity(GO:0005179) |
| 0.0 | 6.8 | GO:0019901 | protein kinase binding(GO:0019901) |
| 0.0 | 0.5 | GO:0005057 | receptor signaling protein activity(GO:0005057) |
| 0.0 | 0.4 | GO:0070003 | threonine-type endopeptidase activity(GO:0004298) threonine-type peptidase activity(GO:0070003) |
| 0.0 | 0.8 | GO:0019900 | kinase binding(GO:0019900) |
| 0.0 | 0.6 | GO:0050840 | extracellular matrix binding(GO:0050840) |
| 0.0 | 0.9 | GO:0005178 | integrin binding(GO:0005178) |
| 0.0 | 0.1 | GO:0003956 | NAD(P)+-protein-arginine ADP-ribosyltransferase activity(GO:0003956) |
| 0.0 | 0.3 | GO:0019706 | protein-cysteine S-palmitoyltransferase activity(GO:0019706) protein-cysteine S-acyltransferase activity(GO:0019707) |
| 0.0 | 0.4 | GO:0004012 | phospholipid-translocating ATPase activity(GO:0004012) |
Gene overrepresentation in curated gene sets: canonical pathways category:
| Log-likelihood per target | Total log-likelihood | Term | Description |
|---|---|---|---|
| 0.6 | 21.9 | ST WNT CA2 CYCLIC GMP PATHWAY | Wnt/Ca2+/cyclic GMP signaling. |
| 0.6 | 24.8 | PID P38 MKK3 6PATHWAY | p38 MAPK signaling pathway |
| 0.4 | 6.2 | PID P38 GAMMA DELTA PATHWAY | Signaling mediated by p38-gamma and p38-delta |
| 0.4 | 2.7 | SA FAS SIGNALING | The TNF-type receptor Fas induces apoptosis on ligand binding. |
| 0.4 | 20.5 | PID ATR PATHWAY | ATR signaling pathway |
| 0.3 | 15.1 | PID LIS1 PATHWAY | Lissencephaly gene (LIS1) in neuronal migration and development |
| 0.3 | 31.0 | PID E2F PATHWAY | E2F transcription factor network |
| 0.2 | 6.7 | SA CASPASE CASCADE | Apoptosis is mediated by caspases, cysteine proteases arranged in a proteolytic cascade. |
| 0.2 | 6.2 | PID FANCONI PATHWAY | Fanconi anemia pathway |
| 0.2 | 3.4 | PID ATM PATHWAY | ATM pathway |
| 0.2 | 5.3 | PID ARF 3PATHWAY | Arf1 pathway |
| 0.2 | 12.8 | PID CASPASE PATHWAY | Caspase cascade in apoptosis |
| 0.2 | 16.3 | PID ERBB1 INTERNALIZATION PATHWAY | Internalization of ErbB1 |
| 0.2 | 10.8 | PID PLK1 PATHWAY | PLK1 signaling events |
| 0.2 | 5.0 | PID P38 MK2 PATHWAY | p38 signaling mediated by MAPKAP kinases |
| 0.2 | 13.8 | PID P73PATHWAY | p73 transcription factor network |
| 0.2 | 2.9 | PID RANBP2 PATHWAY | Sumoylation by RanBP2 regulates transcriptional repression |
| 0.1 | 3.8 | PID FOXM1 PATHWAY | FOXM1 transcription factor network |
| 0.1 | 8.3 | PID PI3KCI PATHWAY | Class I PI3K signaling events |
| 0.1 | 3.3 | PID AURORA A PATHWAY | Aurora A signaling |
| 0.1 | 12.3 | PID ERA GENOMIC PATHWAY | Validated nuclear estrogen receptor alpha network |
| 0.1 | 3.6 | PID FRA PATHWAY | Validated transcriptional targets of AP1 family members Fra1 and Fra2 |
| 0.1 | 3.3 | PID SYNDECAN 4 PATHWAY | Syndecan-4-mediated signaling events |
| 0.1 | 1.9 | PID SMAD2 3NUCLEAR PATHWAY | Regulation of nuclear SMAD2/3 signaling |
| 0.1 | 0.5 | PID ECADHERIN NASCENT AJ PATHWAY | E-cadherin signaling in the nascent adherens junction |
| 0.1 | 2.3 | PID CDC42 PATHWAY | CDC42 signaling events |
| 0.1 | 3.9 | PID ARF6 TRAFFICKING PATHWAY | Arf6 trafficking events |
| 0.1 | 2.1 | SIG INSULIN RECEPTOR PATHWAY IN CARDIAC MYOCYTES | Genes related to the insulin receptor pathway |
| 0.1 | 1.7 | ST TUMOR NECROSIS FACTOR PATHWAY | Tumor Necrosis Factor Pathway. |
| 0.1 | 1.7 | PID RHOA PATHWAY | RhoA signaling pathway |
| 0.1 | 6.5 | PID P53 DOWNSTREAM PATHWAY | Direct p53 effectors |
| 0.0 | 1.0 | PID LPA4 PATHWAY | LPA4-mediated signaling events |
| 0.0 | 0.6 | PID INSULIN GLUCOSE PATHWAY | Insulin-mediated glucose transport |
| 0.0 | 6.6 | PID PDGFRB PATHWAY | PDGFR-beta signaling pathway |
| 0.0 | 3.4 | PID MYC ACTIV PATHWAY | Validated targets of C-MYC transcriptional activation |
| 0.0 | 0.4 | PID BARD1 PATHWAY | BARD1 signaling events |
| 0.0 | 2.2 | PID AJDISS 2PATHWAY | Posttranslational regulation of adherens junction stability and dissassembly |
| 0.0 | 3.6 | PID AR PATHWAY | Coregulation of Androgen receptor activity |
| 0.0 | 0.9 | PID HEDGEHOG 2PATHWAY | Signaling events mediated by the Hedgehog family |
| 0.0 | 2.4 | PID NFAT TFPATHWAY | Calcineurin-regulated NFAT-dependent transcription in lymphocytes |
| 0.0 | 1.0 | PID TAP63 PATHWAY | Validated transcriptional targets of TAp63 isoforms |
| 0.0 | 0.7 | PID IL2 1PATHWAY | IL2-mediated signaling events |
| 0.0 | 2.7 | PID RHOA REG PATHWAY | Regulation of RhoA activity |
| 0.0 | 7.3 | NABA ECM REGULATORS | Genes encoding enzymes and their regulators involved in the remodeling of the extracellular matrix |
| 0.0 | 0.7 | PID HNF3A PATHWAY | FOXA1 transcription factor network |
| 0.0 | 0.5 | ST G ALPHA I PATHWAY | G alpha i Pathway |
| 0.0 | 0.7 | PID RAS PATHWAY | Regulation of Ras family activation |
| 0.0 | 0.5 | PID CD8 TCR DOWNSTREAM PATHWAY | Downstream signaling in naïve CD8+ T cells |
| 0.0 | 0.8 | PID HEDGEHOG GLI PATHWAY | Hedgehog signaling events mediated by Gli proteins |
| 0.0 | 0.1 | ST PHOSPHOINOSITIDE 3 KINASE PATHWAY | PI3K Pathway |
| 0.0 | 0.2 | PID CXCR4 PATHWAY | CXCR4-mediated signaling events |
Gene overrepresentation in curated gene sets: REACTOME pathways category:
| Log-likelihood per target | Total log-likelihood | Term | Description |
|---|---|---|---|
| 1.6 | 29.0 | REACTOME HYALURONAN METABOLISM | Genes involved in Hyaluronan metabolism |
| 0.9 | 22.2 | REACTOME INHIBITION OF THE PROTEOLYTIC ACTIVITY OF APC C REQUIRED FOR THE ONSET OF ANAPHASE BY MITOTIC SPINDLE CHECKPOINT COMPONENTS | Genes involved in Inhibition of the proteolytic activity of APC/C required for the onset of anaphase by mitotic spindle checkpoint components |
| 0.7 | 4.7 | REACTOME PACKAGING OF TELOMERE ENDS | Genes involved in Packaging Of Telomere Ends |
| 0.7 | 13.1 | REACTOME GAP JUNCTION DEGRADATION | Genes involved in Gap junction degradation |
| 0.6 | 18.8 | REACTOME RNA POL I TRANSCRIPTION TERMINATION | Genes involved in RNA Polymerase I Transcription Termination |
| 0.6 | 10.7 | REACTOME VITAMIN B5 PANTOTHENATE METABOLISM | Genes involved in Vitamin B5 (pantothenate) metabolism |
| 0.6 | 19.1 | REACTOME KINESINS | Genes involved in Kinesins |
| 0.5 | 47.2 | REACTOME LOSS OF NLP FROM MITOTIC CENTROSOMES | Genes involved in Loss of Nlp from mitotic centrosomes |
| 0.5 | 13.0 | REACTOME CRMPS IN SEMA3A SIGNALING | Genes involved in CRMPs in Sema3A signaling |
| 0.5 | 6.1 | REACTOME BASE FREE SUGAR PHOSPHATE REMOVAL VIA THE SINGLE NUCLEOTIDE REPLACEMENT PATHWAY | Genes involved in Base-free sugar-phosphate removal via the single-nucleotide replacement pathway |
| 0.5 | 13.0 | REACTOME TERMINATION OF O GLYCAN BIOSYNTHESIS | Genes involved in Termination of O-glycan biosynthesis |
| 0.5 | 6.3 | REACTOME APOPTOSIS INDUCED DNA FRAGMENTATION | Genes involved in Apoptosis induced DNA fragmentation |
| 0.5 | 11.7 | REACTOME RNA POL III TRANSCRIPTION INITIATION FROM TYPE 3 PROMOTER | Genes involved in RNA Polymerase III Transcription Initiation From Type 3 Promoter |
| 0.4 | 0.9 | REACTOME MRNA CAPPING | Genes involved in mRNA Capping |
| 0.4 | 4.8 | REACTOME RESOLUTION OF AP SITES VIA THE MULTIPLE NUCLEOTIDE PATCH REPLACEMENT PATHWAY | Genes involved in Resolution of AP sites via the multiple-nucleotide patch replacement pathway |
| 0.4 | 4.0 | REACTOME MRNA DECAY BY 3 TO 5 EXORIBONUCLEASE | Genes involved in mRNA Decay by 3' to 5' Exoribonuclease |
| 0.3 | 9.2 | REACTOME G0 AND EARLY G1 | Genes involved in G0 and Early G1 |
| 0.3 | 5.0 | REACTOME METABOLISM OF NON CODING RNA | Genes involved in Metabolism of non-coding RNA |
| 0.3 | 10.2 | REACTOME RNA POL I RNA POL III AND MITOCHONDRIAL TRANSCRIPTION | Genes involved in RNA Polymerase I, RNA Polymerase III, and Mitochondrial Transcription |
| 0.3 | 4.7 | REACTOME NOTCH HLH TRANSCRIPTION PATHWAY | Genes involved in Notch-HLH transcription pathway |
| 0.3 | 1.9 | REACTOME INHIBITION OF REPLICATION INITIATION OF DAMAGED DNA BY RB1 E2F1 | Genes involved in Inhibition of replication initiation of damaged DNA by RB1/E2F1 |
| 0.3 | 3.8 | REACTOME RECRUITMENT OF NUMA TO MITOTIC CENTROSOMES | Genes involved in Recruitment of NuMA to mitotic centrosomes |
| 0.3 | 4.8 | REACTOME PROTEOLYTIC CLEAVAGE OF SNARE COMPLEX PROTEINS | Genes involved in Proteolytic cleavage of SNARE complex proteins |
| 0.2 | 9.0 | REACTOME TRANSPORT OF RIBONUCLEOPROTEINS INTO THE HOST NUCLEUS | Genes involved in Transport of Ribonucleoproteins into the Host Nucleus |
| 0.2 | 6.9 | REACTOME FANCONI ANEMIA PATHWAY | Genes involved in Fanconi Anemia pathway |
| 0.2 | 11.0 | REACTOME MRNA SPLICING MINOR PATHWAY | Genes involved in mRNA Splicing - Minor Pathway |
| 0.2 | 4.6 | REACTOME INSULIN SYNTHESIS AND PROCESSING | Genes involved in Insulin Synthesis and Processing |
| 0.2 | 5.1 | REACTOME CTNNB1 PHOSPHORYLATION CASCADE | Genes involved in Beta-catenin phosphorylation cascade |
| 0.2 | 10.9 | REACTOME TRANSPORT OF VITAMINS NUCLEOSIDES AND RELATED MOLECULES | Genes involved in Transport of vitamins, nucleosides, and related molecules |
| 0.2 | 48.7 | REACTOME GENERIC TRANSCRIPTION PATHWAY | Genes involved in Generic Transcription Pathway |
| 0.2 | 6.0 | REACTOME PROLACTIN RECEPTOR SIGNALING | Genes involved in Prolactin receptor signaling |
| 0.2 | 2.0 | REACTOME G1 S SPECIFIC TRANSCRIPTION | Genes involved in G1/S-Specific Transcription |
| 0.2 | 2.6 | REACTOME TRAFFICKING AND PROCESSING OF ENDOSOMAL TLR | Genes involved in Trafficking and processing of endosomal TLR |
| 0.2 | 6.6 | REACTOME FATTY ACYL COA BIOSYNTHESIS | Genes involved in Fatty Acyl-CoA Biosynthesis |
| 0.2 | 4.9 | REACTOME CYTOSOLIC TRNA AMINOACYLATION | Genes involved in Cytosolic tRNA aminoacylation |
| 0.2 | 1.4 | REACTOME THE ACTIVATION OF ARYLSULFATASES | Genes involved in The activation of arylsulfatases |
| 0.1 | 3.9 | REACTOME ACTIVATED TAK1 MEDIATES P38 MAPK ACTIVATION | Genes involved in activated TAK1 mediates p38 MAPK activation |
| 0.1 | 5.5 | REACTOME NOTCH1 INTRACELLULAR DOMAIN REGULATES TRANSCRIPTION | Genes involved in NOTCH1 Intracellular Domain Regulates Transcription |
| 0.1 | 3.0 | REACTOME ENDOSOMAL SORTING COMPLEX REQUIRED FOR TRANSPORT ESCRT | Genes involved in Endosomal Sorting Complex Required For Transport (ESCRT) |
| 0.1 | 2.6 | REACTOME IONOTROPIC ACTIVITY OF KAINATE RECEPTORS | Genes involved in Ionotropic activity of Kainate Receptors |
| 0.1 | 3.2 | REACTOME ENOS ACTIVATION AND REGULATION | Genes involved in eNOS activation and regulation |
| 0.1 | 1.6 | REACTOME REGULATION OF RHEB GTPASE ACTIVITY BY AMPK | Genes involved in Regulation of Rheb GTPase activity by AMPK |
| 0.1 | 5.6 | REACTOME LATE PHASE OF HIV LIFE CYCLE | Genes involved in Late Phase of HIV Life Cycle |
| 0.1 | 1.0 | REACTOME ERKS ARE INACTIVATED | Genes involved in ERKs are inactivated |
| 0.1 | 8.6 | REACTOME APOPTOTIC EXECUTION PHASE | Genes involved in Apoptotic execution phase |
| 0.1 | 2.5 | REACTOME SIGNALING BY ACTIVATED POINT MUTANTS OF FGFR1 | Genes involved in Signaling by activated point mutants of FGFR1 |
| 0.1 | 1.9 | REACTOME TELOMERE MAINTENANCE | Genes involved in Telomere Maintenance |
| 0.1 | 3.7 | REACTOME G1 PHASE | Genes involved in G1 Phase |
| 0.1 | 3.8 | REACTOME POST TRANSLATIONAL MODIFICATION SYNTHESIS OF GPI ANCHORED PROTEINS | Genes involved in Post-translational modification: synthesis of GPI-anchored proteins |
| 0.1 | 1.1 | REACTOME HOMOLOGOUS RECOMBINATION REPAIR OF REPLICATION INDEPENDENT DOUBLE STRAND BREAKS | Genes involved in Homologous recombination repair of replication-independent double-strand breaks |
| 0.1 | 0.4 | REACTOME SLBP DEPENDENT PROCESSING OF REPLICATION DEPENDENT HISTONE PRE MRNAS | Genes involved in SLBP Dependent Processing of Replication-Dependent Histone Pre-mRNAs |
| 0.1 | 2.8 | REACTOME TRANSPORT OF MATURE TRANSCRIPT TO CYTOPLASM | Genes involved in Transport of Mature Transcript to Cytoplasm |
| 0.1 | 3.2 | REACTOME BASIGIN INTERACTIONS | Genes involved in Basigin interactions |
| 0.1 | 16.9 | REACTOME SIGNALING BY RHO GTPASES | Genes involved in Signaling by Rho GTPases |
| 0.1 | 0.6 | REACTOME P75NTR RECRUITS SIGNALLING COMPLEXES | Genes involved in p75NTR recruits signalling complexes |
| 0.1 | 4.9 | REACTOME MITOTIC PROMETAPHASE | Genes involved in Mitotic Prometaphase |
| 0.1 | 0.5 | REACTOME PRE NOTCH TRANSCRIPTION AND TRANSLATION | Genes involved in Pre-NOTCH Transcription and Translation |
| 0.1 | 1.2 | REACTOME NUCLEAR SIGNALING BY ERBB4 | Genes involved in Nuclear signaling by ERBB4 |
| 0.1 | 0.8 | REACTOME UNWINDING OF DNA | Genes involved in Unwinding of DNA |
| 0.1 | 1.0 | REACTOME ADENYLATE CYCLASE ACTIVATING PATHWAY | Genes involved in Adenylate cyclase activating pathway |
| 0.1 | 0.4 | REACTOME ASSOCIATION OF LICENSING FACTORS WITH THE PRE REPLICATIVE COMPLEX | Genes involved in Association of licensing factors with the pre-replicative complex |
| 0.0 | 3.1 | REACTOME STRIATED MUSCLE CONTRACTION | Genes involved in Striated Muscle Contraction |
| 0.0 | 2.4 | REACTOME ASSOCIATION OF TRIC CCT WITH TARGET PROTEINS DURING BIOSYNTHESIS | Genes involved in Association of TriC/CCT with target proteins during biosynthesis |
| 0.0 | 5.9 | REACTOME TRANSPORT OF INORGANIC CATIONS ANIONS AND AMINO ACIDS OLIGOPEPTIDES | Genes involved in Transport of inorganic cations/anions and amino acids/oligopeptides |
| 0.0 | 0.8 | REACTOME SYNTHESIS OF PE | Genes involved in Synthesis of PE |
| 0.0 | 2.4 | REACTOME MYOGENESIS | Genes involved in Myogenesis |
| 0.0 | 1.8 | REACTOME GLYCOLYSIS | Genes involved in Glycolysis |
| 0.0 | 1.2 | REACTOME CHOLESTEROL BIOSYNTHESIS | Genes involved in Cholesterol biosynthesis |
| 0.0 | 1.1 | REACTOME CGMP EFFECTS | Genes involved in cGMP effects |
| 0.0 | 1.7 | REACTOME TRANSCRIPTIONAL REGULATION OF WHITE ADIPOCYTE DIFFERENTIATION | Genes involved in Transcriptional Regulation of White Adipocyte Differentiation |
| 0.0 | 1.5 | REACTOME MHC CLASS II ANTIGEN PRESENTATION | Genes involved in MHC class II antigen presentation |
| 0.0 | 1.7 | REACTOME ION TRANSPORT BY P TYPE ATPASES | Genes involved in Ion transport by P-type ATPases |
| 0.0 | 1.4 | REACTOME METABOLISM OF STEROID HORMONES AND VITAMINS A AND D | Genes involved in Metabolism of steroid hormones and vitamins A and D |
| 0.0 | 0.9 | REACTOME DARPP 32 EVENTS | Genes involved in DARPP-32 events |
| 0.0 | 0.6 | REACTOME ACYL CHAIN REMODELLING OF PG | Genes involved in Acyl chain remodelling of PG |
| 0.0 | 6.5 | REACTOME ANTIGEN PROCESSING UBIQUITINATION PROTEASOME DEGRADATION | Genes involved in Antigen processing: Ubiquitination & Proteasome degradation |
| 0.0 | 0.5 | REACTOME REGULATION OF IFNA SIGNALING | Genes involved in Regulation of IFNA signaling |
| 0.0 | 0.7 | REACTOME SMOOTH MUSCLE CONTRACTION | Genes involved in Smooth Muscle Contraction |
| 0.0 | 0.2 | REACTOME ROLE OF SECOND MESSENGERS IN NETRIN1 SIGNALING | Genes involved in Role of second messengers in netrin-1 signaling |
| 0.0 | 1.1 | REACTOME CHEMOKINE RECEPTORS BIND CHEMOKINES | Genes involved in Chemokine receptors bind chemokines |
| 0.0 | 0.6 | REACTOME EFFECTS OF PIP2 HYDROLYSIS | Genes involved in Effects of PIP2 hydrolysis |
| 0.0 | 0.5 | REACTOME PIP3 ACTIVATES AKT SIGNALING | Genes involved in PIP3 activates AKT signaling |
| 0.0 | 0.3 | REACTOME GABA B RECEPTOR ACTIVATION | Genes involved in GABA B receptor activation |
| 0.0 | 0.2 | REACTOME PURINE RIBONUCLEOSIDE MONOPHOSPHATE BIOSYNTHESIS | Genes involved in Purine ribonucleoside monophosphate biosynthesis |
| 0.0 | 0.3 | REACTOME NUCLEOTIDE LIKE PURINERGIC RECEPTORS | Genes involved in Nucleotide-like (purinergic) receptors |