Project
PRJNA375882: Comprehensive Mouse Transcriptomic BodyMap
Navigation
Downloads
Results for Rfx3_Rfx1_Rfx4
Z-value: 7.81
Motif logo
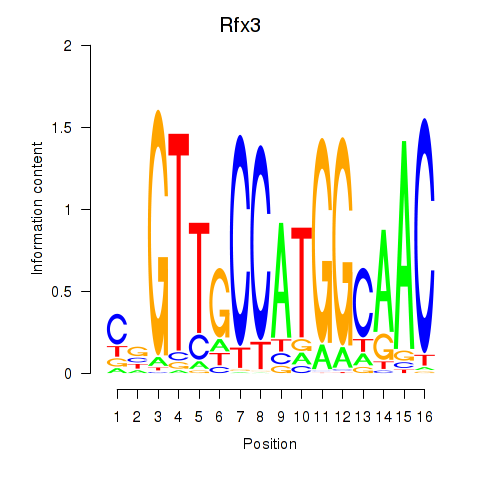
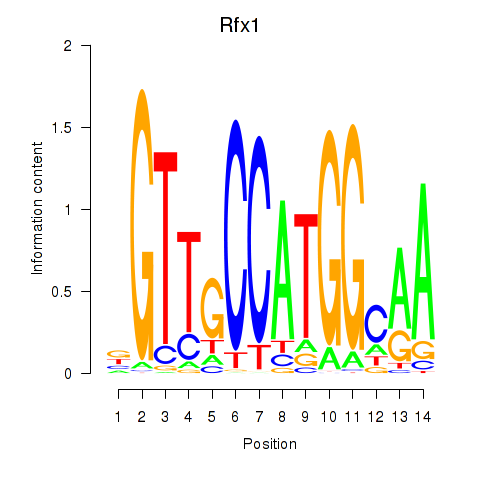
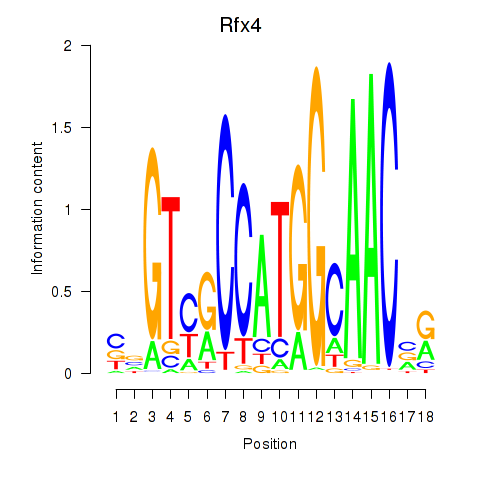
Transcription factors associated with Rfx3_Rfx1_Rfx4
| Gene Symbol | Gene ID | Gene Info |
|---|---|---|
|
Rfx3
|
ENSMUSG00000040929.18 | Rfx3 |
|
Rfx1
|
ENSMUSG00000031706.8 | Rfx1 |
|
Rfx4
|
ENSMUSG00000020037.16 | Rfx4 |
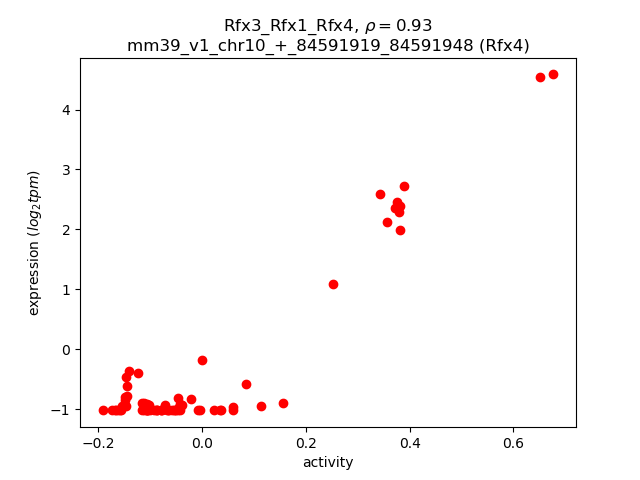
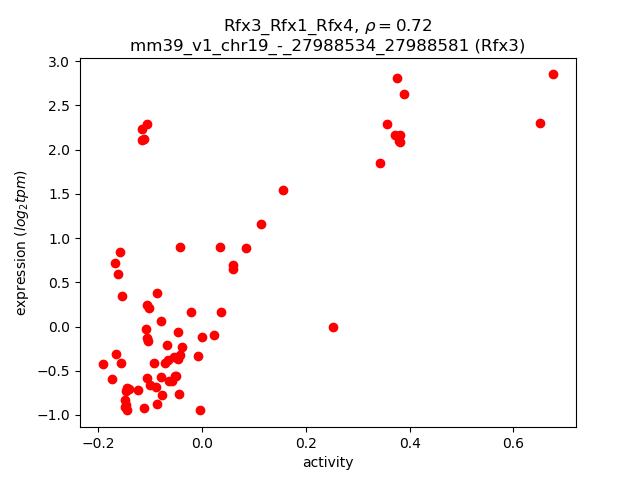
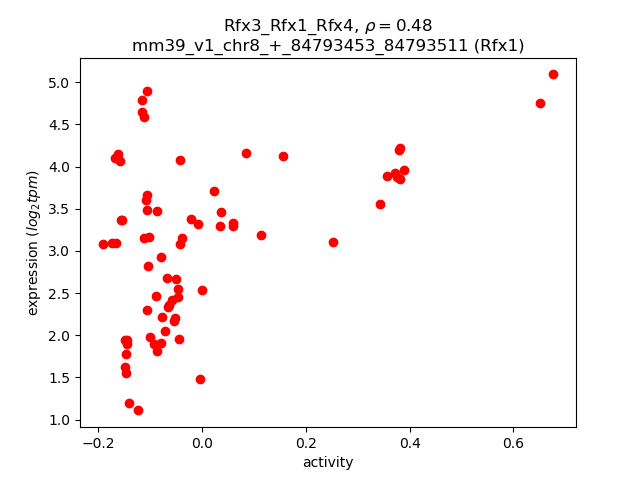
Activity-expression correlation:
| Gene | Promoter | Pearson corr. coef. | P-value | Plot |
|---|---|---|---|---|
| Rfx4 | mm39_v1_chr10_+_84591919_84591948 | 0.93 | 1.2e-31 | Click! |
| Rfx3 | mm39_v1_chr19_-_27988534_27988581 | 0.72 | 1.2e-12 | Click! |
| Rfx1 | mm39_v1_chr8_+_84793453_84793511 | 0.48 | 1.8e-05 | Click! |
Activity profile of Rfx3_Rfx1_Rfx4 motif
Sorted Z-values of Rfx3_Rfx1_Rfx4 motif
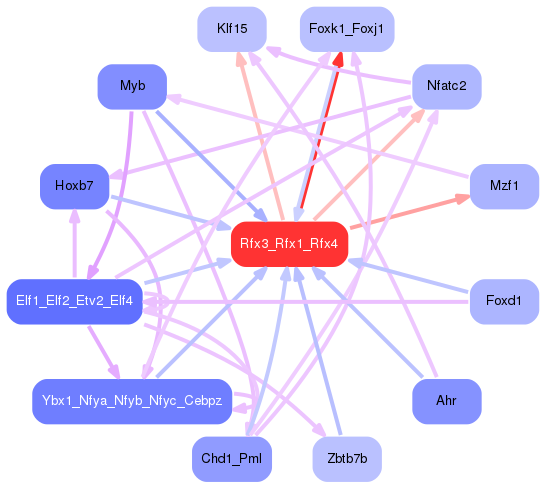
Network of associatons between targets according to the STRING database.

First level regulatory network of Rfx3_Rfx1_Rfx4
Gene Ontology Analysis
Gene overrepresentation in biological process category:
| Log-likelihood per target | Total log-likelihood | Term | Description |
|---|---|---|---|
| 17.8 | 89.1 | GO:0035609 | C-terminal protein deglutamylation(GO:0035609) |
| 15.3 | 61.2 | GO:0008594 | photoreceptor cell morphogenesis(GO:0008594) |
| 14.8 | 44.4 | GO:0002514 | B cell tolerance induction(GO:0002514) regulation of B cell tolerance induction(GO:0002661) positive regulation of B cell tolerance induction(GO:0002663) |
| 13.0 | 181.7 | GO:0098953 | receptor diffusion trapping(GO:0098953) postsynaptic neurotransmitter receptor diffusion trapping(GO:0098970) neurotransmitter receptor diffusion trapping(GO:0099628) |
| 12.5 | 62.5 | GO:0030382 | sperm mitochondrion organization(GO:0030382) |
| 11.7 | 35.2 | GO:1903348 | positive regulation of bicellular tight junction assembly(GO:1903348) |
| 11.3 | 33.9 | GO:2000771 | regulation of establishment or maintenance of cell polarity regulating cell shape(GO:2000769) positive regulation of establishment or maintenance of cell polarity regulating cell shape(GO:2000771) |
| 11.2 | 56.2 | GO:1904491 | protein localization to ciliary transition zone(GO:1904491) |
| 10.2 | 30.7 | GO:0016598 | protein arginylation(GO:0016598) |
| 9.5 | 75.8 | GO:0098532 | histone H3-K27 trimethylation(GO:0098532) |
| 9.3 | 232.1 | GO:0044458 | motile cilium assembly(GO:0044458) |
| 8.9 | 53.2 | GO:0032423 | regulation of mismatch repair(GO:0032423) |
| 8.7 | 26.2 | GO:0035610 | protein side chain deglutamylation(GO:0035610) |
| 8.1 | 32.3 | GO:1902269 | positive regulation of polyamine transmembrane transport(GO:1902269) |
| 8.0 | 24.0 | GO:0001539 | cilium or flagellum-dependent cell motility(GO:0001539) cilium-dependent cell motility(GO:0060285) |
| 7.6 | 45.5 | GO:2000325 | regulation of ligand-dependent nuclear receptor transcription coactivator activity(GO:2000325) positive regulation of ligand-dependent nuclear receptor transcription coactivator activity(GO:2000327) |
| 7.5 | 30.1 | GO:0038108 | negative regulation of appetite by leptin-mediated signaling pathway(GO:0038108) |
| 6.7 | 26.8 | GO:0018317 | protein C-linked glycosylation(GO:0018103) peptidyl-tryptophan modification(GO:0018211) protein C-linked glycosylation via tryptophan(GO:0018317) protein C-linked glycosylation via 2'-alpha-mannosyl-L-tryptophan(GO:0018406) |
| 6.7 | 26.8 | GO:0006532 | aspartate biosynthetic process(GO:0006532) |
| 6.6 | 46.5 | GO:2000481 | positive regulation of cAMP-dependent protein kinase activity(GO:2000481) |
| 6.6 | 19.9 | GO:1903251 | multi-ciliated epithelial cell differentiation(GO:1903251) |
| 6.5 | 25.9 | GO:1904425 | negative regulation of GTP binding(GO:1904425) |
| 6.4 | 90.2 | GO:0031914 | negative regulation of synaptic plasticity(GO:0031914) |
| 6.4 | 32.2 | GO:1903445 | intermembrane transport(GO:0046909) protein transport from ciliary membrane to plasma membrane(GO:1903445) |
| 6.4 | 25.7 | GO:0060830 | ciliary receptor clustering involved in smoothened signaling pathway(GO:0060830) |
| 6.4 | 25.4 | GO:1904158 | axonemal central apparatus assembly(GO:1904158) |
| 6.1 | 36.4 | GO:0050758 | thymidylate synthase biosynthetic process(GO:0050757) regulation of thymidylate synthase biosynthetic process(GO:0050758) negative regulation of thymidylate synthase biosynthetic process(GO:0050760) |
| 6.0 | 41.9 | GO:0007258 | JUN phosphorylation(GO:0007258) |
| 5.9 | 23.5 | GO:0009826 | unidimensional cell growth(GO:0009826) susceptibility to natural killer cell mediated cytotoxicity(GO:0042271) |
| 5.4 | 48.4 | GO:0036371 | protein localization to M-band(GO:0036309) protein localization to T-tubule(GO:0036371) |
| 5.3 | 15.8 | GO:0021508 | floor plate formation(GO:0021508) |
| 4.9 | 19.4 | GO:1903033 | regulation of microtubule plus-end binding(GO:1903031) positive regulation of microtubule plus-end binding(GO:1903033) |
| 4.6 | 31.9 | GO:0007256 | activation of JNKK activity(GO:0007256) negative regulation of defense response to bacterium(GO:1900425) |
| 4.5 | 85.3 | GO:0007288 | sperm axoneme assembly(GO:0007288) |
| 4.2 | 12.7 | GO:2000686 | regulation of rubidium ion transmembrane transporter activity(GO:2000686) |
| 4.2 | 113.9 | GO:0016486 | peptide hormone processing(GO:0016486) |
| 4.1 | 12.3 | GO:0030860 | regulation of polarized epithelial cell differentiation(GO:0030860) |
| 3.8 | 53.3 | GO:0060294 | cilium movement involved in cell motility(GO:0060294) |
| 3.8 | 57.1 | GO:1900028 | negative regulation of ruffle assembly(GO:1900028) |
| 3.8 | 37.8 | GO:0035721 | intraciliary retrograde transport(GO:0035721) |
| 3.6 | 128.8 | GO:0035082 | axoneme assembly(GO:0035082) |
| 3.5 | 56.3 | GO:0035970 | peptidyl-threonine dephosphorylation(GO:0035970) |
| 3.5 | 21.1 | GO:0035585 | calcium-mediated signaling using extracellular calcium source(GO:0035585) |
| 3.3 | 23.0 | GO:0051013 | microtubule severing(GO:0051013) |
| 3.2 | 32.4 | GO:1902412 | regulation of mitotic cytokinesis(GO:1902412) |
| 3.2 | 19.2 | GO:0003351 | epithelial cilium movement(GO:0003351) |
| 3.1 | 15.6 | GO:0050902 | leukocyte adhesive activation(GO:0050902) |
| 3.0 | 109.4 | GO:0048268 | clathrin coat assembly(GO:0048268) |
| 2.9 | 41.0 | GO:0021869 | forebrain ventricular zone progenitor cell division(GO:0021869) |
| 2.8 | 50.3 | GO:0051823 | regulation of synapse structural plasticity(GO:0051823) |
| 2.7 | 16.4 | GO:0006172 | ADP biosynthetic process(GO:0006172) |
| 2.7 | 13.4 | GO:1902775 | mitochondrial large ribosomal subunit assembly(GO:1902775) |
| 2.5 | 22.8 | GO:0030321 | transepithelial chloride transport(GO:0030321) |
| 2.5 | 61.9 | GO:0099514 | anterograde synaptic vesicle transport(GO:0048490) synaptic vesicle cytoskeletal transport(GO:0099514) synaptic vesicle transport along microtubule(GO:0099517) |
| 2.3 | 4.5 | GO:1900126 | negative regulation of hyaluronan biosynthetic process(GO:1900126) |
| 2.3 | 6.8 | GO:0048611 | ectodermal digestive tract development(GO:0007439) embryonic ectodermal digestive tract development(GO:0048611) |
| 2.1 | 38.4 | GO:0035414 | negative regulation of catenin import into nucleus(GO:0035414) |
| 2.0 | 24.1 | GO:0003341 | cilium movement(GO:0003341) |
| 2.0 | 2.0 | GO:0072248 | metanephric glomerular visceral epithelial cell differentiation(GO:0072248) metanephric glomerular visceral epithelial cell development(GO:0072249) metanephric glomerular epithelial cell differentiation(GO:0072312) metanephric glomerular epithelial cell development(GO:0072313) |
| 2.0 | 6.0 | GO:0042822 | pyridoxal phosphate metabolic process(GO:0042822) |
| 1.9 | 23.3 | GO:0047484 | regulation of response to osmotic stress(GO:0047484) |
| 1.9 | 28.9 | GO:0021684 | cerebellar granular layer formation(GO:0021684) cerebellar granule cell differentiation(GO:0021707) |
| 1.8 | 7.4 | GO:0046066 | purine deoxyribonucleoside diphosphate metabolic process(GO:0009182) purine deoxyribonucleoside triphosphate biosynthetic process(GO:0009216) dGDP metabolic process(GO:0046066) |
| 1.8 | 5.4 | GO:1900062 | regulation of replicative cell aging(GO:1900062) |
| 1.8 | 57.8 | GO:0071625 | vocalization behavior(GO:0071625) |
| 1.7 | 41.9 | GO:0048642 | negative regulation of skeletal muscle tissue development(GO:0048642) |
| 1.7 | 88.9 | GO:0010107 | potassium ion import(GO:0010107) |
| 1.7 | 7.0 | GO:0001579 | medium-chain fatty acid transport(GO:0001579) |
| 1.7 | 12.1 | GO:0034983 | peptidyl-lysine deacetylation(GO:0034983) |
| 1.7 | 5.2 | GO:1901856 | negative regulation of cellular respiration(GO:1901856) |
| 1.7 | 39.2 | GO:0051457 | maintenance of protein location in nucleus(GO:0051457) |
| 1.7 | 5.0 | GO:0019918 | peptidyl-arginine methylation, to symmetrical-dimethyl arginine(GO:0019918) |
| 1.7 | 98.8 | GO:0048013 | ephrin receptor signaling pathway(GO:0048013) |
| 1.6 | 8.2 | GO:0072531 | pyrimidine-containing compound transmembrane transport(GO:0072531) |
| 1.6 | 43.5 | GO:0071801 | regulation of podosome assembly(GO:0071801) |
| 1.6 | 54.6 | GO:0042073 | intraciliary transport(GO:0042073) |
| 1.5 | 77.4 | GO:0007026 | negative regulation of microtubule depolymerization(GO:0007026) |
| 1.5 | 4.6 | GO:0070973 | protein localization to endoplasmic reticulum exit site(GO:0070973) |
| 1.5 | 1.5 | GO:0034092 | negative regulation of maintenance of sister chromatid cohesion(GO:0034092) negative regulation of maintenance of mitotic sister chromatid cohesion(GO:0034183) maintenance of mitotic sister chromatid cohesion, telomeric(GO:0099403) mitotic sister chromatid cohesion, telomeric(GO:0099404) regulation of maintenance of mitotic sister chromatid cohesion, telomeric(GO:1904907) negative regulation of maintenance of mitotic sister chromatid cohesion, telomeric(GO:1904908) |
| 1.5 | 52.2 | GO:0060074 | synapse maturation(GO:0060074) |
| 1.5 | 28.3 | GO:0070995 | NADPH oxidation(GO:0070995) |
| 1.5 | 53.1 | GO:0032011 | ARF protein signal transduction(GO:0032011) regulation of ARF protein signal transduction(GO:0032012) |
| 1.4 | 65.1 | GO:0071158 | positive regulation of cell cycle arrest(GO:0071158) |
| 1.4 | 118.2 | GO:0000381 | regulation of alternative mRNA splicing, via spliceosome(GO:0000381) |
| 1.4 | 7.1 | GO:1904457 | positive regulation of neuronal action potential(GO:1904457) |
| 1.4 | 15.3 | GO:2000042 | negative regulation of double-strand break repair via homologous recombination(GO:2000042) |
| 1.4 | 13.9 | GO:0034393 | positive regulation of smooth muscle cell apoptotic process(GO:0034393) negative regulation of motor neuron apoptotic process(GO:2000672) |
| 1.3 | 5.3 | GO:0099542 | diacylglycerol catabolic process(GO:0046340) trans-synaptic signaling by lipid(GO:0099541) trans-synaptic signaling by endocannabinoid(GO:0099542) |
| 1.3 | 9.0 | GO:0045218 | zonula adherens maintenance(GO:0045218) |
| 1.3 | 25.7 | GO:0002862 | negative regulation of inflammatory response to antigenic stimulus(GO:0002862) |
| 1.2 | 17.4 | GO:0006654 | phosphatidic acid biosynthetic process(GO:0006654) |
| 1.2 | 7.4 | GO:0034975 | protein folding in endoplasmic reticulum(GO:0034975) |
| 1.2 | 35.8 | GO:0097320 | membrane tubulation(GO:0097320) |
| 1.2 | 9.8 | GO:0002318 | myeloid progenitor cell differentiation(GO:0002318) |
| 1.2 | 239.1 | GO:0060271 | cilium morphogenesis(GO:0060271) |
| 1.2 | 7.2 | GO:0099590 | neurotransmitter receptor internalization(GO:0099590) |
| 1.2 | 9.4 | GO:0071494 | cellular response to UV-C(GO:0071494) |
| 1.2 | 5.8 | GO:0006420 | arginyl-tRNA aminoacylation(GO:0006420) |
| 1.2 | 2.3 | GO:0010387 | COP9 signalosome assembly(GO:0010387) |
| 1.1 | 43.3 | GO:0071480 | cellular response to gamma radiation(GO:0071480) |
| 1.1 | 42.5 | GO:2000171 | negative regulation of dendrite development(GO:2000171) |
| 1.1 | 6.4 | GO:0031392 | regulation of prostaglandin biosynthetic process(GO:0031392) regulation of unsaturated fatty acid biosynthetic process(GO:2001279) |
| 1.1 | 43.8 | GO:0010738 | regulation of protein kinase A signaling(GO:0010738) |
| 1.1 | 3.2 | GO:0032618 | interleukin-15 production(GO:0032618) response to immune response of other organism involved in symbiotic interaction(GO:0052564) response to host immune response(GO:0052572) |
| 1.1 | 4.2 | GO:1903070 | negative regulation of ER-associated ubiquitin-dependent protein catabolic process(GO:1903070) |
| 1.0 | 14.4 | GO:0097500 | receptor localization to nonmotile primary cilium(GO:0097500) |
| 1.0 | 2.0 | GO:0071034 | CUT catabolic process(GO:0071034) CUT metabolic process(GO:0071043) |
| 1.0 | 4.1 | GO:0097106 | postsynaptic density organization(GO:0097106) |
| 1.0 | 31.5 | GO:0000413 | protein peptidyl-prolyl isomerization(GO:0000413) |
| 1.0 | 13.0 | GO:0048672 | positive regulation of collateral sprouting(GO:0048672) |
| 1.0 | 108.3 | GO:1903955 | positive regulation of protein targeting to mitochondrion(GO:1903955) |
| 1.0 | 3.0 | GO:0051661 | maintenance of centrosome location(GO:0051661) |
| 1.0 | 2.0 | GO:0071500 | cellular response to nitrosative stress(GO:0071500) |
| 1.0 | 4.9 | GO:0035616 | histone H2B conserved C-terminal lysine deubiquitination(GO:0035616) |
| 1.0 | 18.5 | GO:0046855 | inositol phosphate dephosphorylation(GO:0046855) intracellular distribution of mitochondria(GO:0048312) |
| 0.9 | 6.5 | GO:1903862 | positive regulation of oxidative phosphorylation(GO:1903862) |
| 0.9 | 32.6 | GO:0021591 | ventricular system development(GO:0021591) |
| 0.9 | 22.2 | GO:0090073 | positive regulation of protein homodimerization activity(GO:0090073) |
| 0.9 | 27.3 | GO:0018345 | protein palmitoylation(GO:0018345) |
| 0.9 | 27.3 | GO:1902043 | positive regulation of extrinsic apoptotic signaling pathway via death domain receptors(GO:1902043) |
| 0.9 | 5.4 | GO:0010968 | regulation of microtubule nucleation(GO:0010968) |
| 0.9 | 8.1 | GO:0031087 | deadenylation-independent decapping of nuclear-transcribed mRNA(GO:0031087) |
| 0.9 | 18.8 | GO:1900017 | positive regulation of cytokine production involved in inflammatory response(GO:1900017) |
| 0.9 | 7.1 | GO:0006685 | sphingomyelin catabolic process(GO:0006685) |
| 0.9 | 9.6 | GO:0006335 | DNA replication-dependent nucleosome assembly(GO:0006335) DNA replication-dependent nucleosome organization(GO:0034723) |
| 0.9 | 6.9 | GO:0034316 | negative regulation of Arp2/3 complex-mediated actin nucleation(GO:0034316) |
| 0.9 | 5.1 | GO:0035694 | mitochondrial protein catabolic process(GO:0035694) |
| 0.9 | 10.3 | GO:0090503 | RNA phosphodiester bond hydrolysis, exonucleolytic(GO:0090503) |
| 0.9 | 6.8 | GO:1901621 | negative regulation of smoothened signaling pathway involved in dorsal/ventral neural tube patterning(GO:1901621) |
| 0.8 | 2.5 | GO:0006478 | peptidyl-tyrosine sulfation(GO:0006478) |
| 0.8 | 5.0 | GO:0000160 | phosphorelay signal transduction system(GO:0000160) |
| 0.8 | 6.7 | GO:0032510 | endosome to lysosome transport via multivesicular body sorting pathway(GO:0032510) |
| 0.8 | 2.5 | GO:0006788 | heme oxidation(GO:0006788) |
| 0.8 | 25.4 | GO:0050775 | positive regulation of dendrite morphogenesis(GO:0050775) |
| 0.8 | 15.7 | GO:0021819 | layer formation in cerebral cortex(GO:0021819) |
| 0.8 | 21.2 | GO:0097120 | receptor localization to synapse(GO:0097120) |
| 0.7 | 14.9 | GO:2000480 | negative regulation of cAMP-dependent protein kinase activity(GO:2000480) |
| 0.7 | 26.0 | GO:0046839 | phospholipid dephosphorylation(GO:0046839) |
| 0.7 | 55.6 | GO:0045454 | cell redox homeostasis(GO:0045454) |
| 0.7 | 42.1 | GO:0031122 | cytoplasmic microtubule organization(GO:0031122) |
| 0.7 | 33.4 | GO:0060997 | dendritic spine morphogenesis(GO:0060997) |
| 0.7 | 31.1 | GO:0048665 | neuron fate specification(GO:0048665) |
| 0.7 | 2.1 | GO:0002355 | detection of tumor cell(GO:0002355) |
| 0.7 | 2.8 | GO:0034499 | late endosome to Golgi transport(GO:0034499) |
| 0.7 | 5.4 | GO:0017198 | N-terminal peptidyl-serine acetylation(GO:0017198) N-terminal peptidyl-glutamic acid acetylation(GO:0018002) peptidyl-serine acetylation(GO:0030920) |
| 0.7 | 1.3 | GO:0010724 | regulation of definitive erythrocyte differentiation(GO:0010724) |
| 0.7 | 1.3 | GO:0090071 | negative regulation of ribosome biogenesis(GO:0090071) |
| 0.7 | 2.0 | GO:0032417 | positive regulation of sodium:proton antiporter activity(GO:0032417) |
| 0.6 | 2.5 | GO:0070649 | formin-nucleated actin cable assembly(GO:0070649) |
| 0.6 | 13.1 | GO:0071539 | protein localization to centrosome(GO:0071539) |
| 0.6 | 5.0 | GO:0070236 | negative regulation of activation-induced cell death of T cells(GO:0070236) |
| 0.6 | 27.0 | GO:0021795 | cerebral cortex cell migration(GO:0021795) |
| 0.6 | 6.0 | GO:0002553 | histamine production involved in inflammatory response(GO:0002349) histamine secretion involved in inflammatory response(GO:0002441) histamine secretion by mast cell(GO:0002553) |
| 0.6 | 2.4 | GO:0072553 | terminal button organization(GO:0072553) |
| 0.6 | 2.3 | GO:2000304 | positive regulation of sphingolipid biosynthetic process(GO:0090154) positive regulation of ceramide biosynthetic process(GO:2000304) |
| 0.6 | 37.0 | GO:0071300 | cellular response to retinoic acid(GO:0071300) |
| 0.6 | 2.8 | GO:0034080 | CENP-A containing nucleosome assembly(GO:0034080) CENP-A containing chromatin organization(GO:0061641) |
| 0.5 | 5.9 | GO:0070525 | tRNA threonylcarbamoyladenosine metabolic process(GO:0070525) |
| 0.5 | 35.2 | GO:0006334 | nucleosome assembly(GO:0006334) |
| 0.5 | 19.9 | GO:0002437 | inflammatory response to antigenic stimulus(GO:0002437) |
| 0.5 | 4.2 | GO:0003011 | involuntary skeletal muscle contraction(GO:0003011) |
| 0.5 | 5.2 | GO:0032264 | IMP salvage(GO:0032264) |
| 0.5 | 8.1 | GO:0039532 | negative regulation of viral-induced cytoplasmic pattern recognition receptor signaling pathway(GO:0039532) |
| 0.5 | 4.0 | GO:1990253 | cellular response to leucine starvation(GO:1990253) |
| 0.5 | 296.4 | GO:0007283 | spermatogenesis(GO:0007283) |
| 0.5 | 6.9 | GO:0070072 | vacuolar proton-transporting V-type ATPase complex assembly(GO:0070072) |
| 0.5 | 2.9 | GO:0035542 | regulation of SNARE complex assembly(GO:0035542) |
| 0.5 | 4.2 | GO:0000395 | mRNA 5'-splice site recognition(GO:0000395) |
| 0.5 | 22.8 | GO:0048791 | calcium ion-regulated exocytosis of neurotransmitter(GO:0048791) |
| 0.4 | 42.8 | GO:0010923 | negative regulation of phosphatase activity(GO:0010923) |
| 0.4 | 2.6 | GO:0042796 | snRNA transcription from RNA polymerase III promoter(GO:0042796) |
| 0.4 | 11.2 | GO:1902260 | negative regulation of delayed rectifier potassium channel activity(GO:1902260) |
| 0.4 | 5.4 | GO:0007097 | nuclear migration(GO:0007097) establishment of nucleus localization(GO:0040023) |
| 0.4 | 1.6 | GO:0032439 | endosome localization(GO:0032439) |
| 0.4 | 7.5 | GO:0060080 | inhibitory postsynaptic potential(GO:0060080) |
| 0.4 | 40.6 | GO:0019226 | transmission of nerve impulse(GO:0019226) |
| 0.4 | 5.3 | GO:0031573 | intra-S DNA damage checkpoint(GO:0031573) |
| 0.4 | 73.2 | GO:0030509 | BMP signaling pathway(GO:0030509) |
| 0.4 | 18.6 | GO:0003298 | physiological muscle hypertrophy(GO:0003298) physiological cardiac muscle hypertrophy(GO:0003301) cell growth involved in cardiac muscle cell development(GO:0061049) |
| 0.4 | 11.3 | GO:0050482 | arachidonic acid secretion(GO:0050482) arachidonate transport(GO:1903963) |
| 0.4 | 10.1 | GO:0002115 | store-operated calcium entry(GO:0002115) |
| 0.3 | 3.1 | GO:0006283 | transcription-coupled nucleotide-excision repair(GO:0006283) |
| 0.3 | 9.9 | GO:0035640 | exploration behavior(GO:0035640) |
| 0.3 | 2.0 | GO:0006287 | base-excision repair, gap-filling(GO:0006287) |
| 0.3 | 16.8 | GO:0045668 | negative regulation of osteoblast differentiation(GO:0045668) |
| 0.3 | 25.3 | GO:1901379 | regulation of potassium ion transmembrane transport(GO:1901379) |
| 0.3 | 10.1 | GO:0007340 | acrosome reaction(GO:0007340) |
| 0.3 | 42.5 | GO:0016579 | protein deubiquitination(GO:0016579) |
| 0.3 | 1.3 | GO:0006627 | protein processing involved in protein targeting to mitochondrion(GO:0006627) |
| 0.3 | 25.6 | GO:0051965 | positive regulation of synapse assembly(GO:0051965) |
| 0.3 | 21.5 | GO:0007368 | determination of left/right symmetry(GO:0007368) |
| 0.3 | 8.6 | GO:0045648 | positive regulation of erythrocyte differentiation(GO:0045648) |
| 0.3 | 1.8 | GO:0090400 | stress-induced premature senescence(GO:0090400) |
| 0.3 | 3.9 | GO:0061469 | regulation of type B pancreatic cell proliferation(GO:0061469) |
| 0.3 | 3.9 | GO:0061635 | regulation of protein complex stability(GO:0061635) |
| 0.3 | 25.8 | GO:0090090 | negative regulation of canonical Wnt signaling pathway(GO:0090090) |
| 0.3 | 9.6 | GO:1901984 | negative regulation of protein acetylation(GO:1901984) negative regulation of peptidyl-lysine acetylation(GO:2000757) |
| 0.3 | 4.5 | GO:0001553 | luteinization(GO:0001553) |
| 0.3 | 3.2 | GO:0006002 | fructose 6-phosphate metabolic process(GO:0006002) |
| 0.3 | 27.1 | GO:0051453 | regulation of intracellular pH(GO:0051453) |
| 0.3 | 40.5 | GO:0007411 | axon guidance(GO:0007411) |
| 0.2 | 1.7 | GO:0045583 | regulation of cytotoxic T cell differentiation(GO:0045583) positive regulation of cytotoxic T cell differentiation(GO:0045585) |
| 0.2 | 10.4 | GO:0060135 | maternal process involved in female pregnancy(GO:0060135) |
| 0.2 | 4.0 | GO:1901741 | positive regulation of myoblast fusion(GO:1901741) |
| 0.2 | 17.7 | GO:0030042 | actin filament depolymerization(GO:0030042) |
| 0.2 | 2.0 | GO:0010793 | regulation of mRNA export from nucleus(GO:0010793) |
| 0.2 | 2.2 | GO:0010838 | positive regulation of keratinocyte proliferation(GO:0010838) |
| 0.2 | 2.0 | GO:0006020 | inositol metabolic process(GO:0006020) |
| 0.2 | 2.7 | GO:0006622 | protein targeting to lysosome(GO:0006622) |
| 0.2 | 8.1 | GO:0048168 | regulation of neuronal synaptic plasticity(GO:0048168) |
| 0.2 | 26.1 | GO:0018107 | peptidyl-threonine phosphorylation(GO:0018107) |
| 0.2 | 18.1 | GO:0043149 | contractile actin filament bundle assembly(GO:0030038) stress fiber assembly(GO:0043149) |
| 0.2 | 18.4 | GO:0090630 | activation of GTPase activity(GO:0090630) |
| 0.2 | 1.7 | GO:0030388 | fructose 1,6-bisphosphate metabolic process(GO:0030388) |
| 0.2 | 0.8 | GO:0048333 | mesodermal cell differentiation(GO:0048333) |
| 0.2 | 8.2 | GO:0007339 | binding of sperm to zona pellucida(GO:0007339) |
| 0.2 | 1.5 | GO:0060313 | negative regulation of neutrophil degranulation(GO:0043314) negative regulation of blood vessel remodeling(GO:0060313) |
| 0.2 | 2.3 | GO:0072501 | cellular phosphate ion homeostasis(GO:0030643) cellular divalent inorganic anion homeostasis(GO:0072501) cellular trivalent inorganic anion homeostasis(GO:0072502) |
| 0.2 | 1.9 | GO:0000132 | establishment of mitotic spindle orientation(GO:0000132) |
| 0.2 | 3.5 | GO:0007095 | mitotic G2 DNA damage checkpoint(GO:0007095) |
| 0.2 | 6.8 | GO:2000649 | regulation of sodium ion transmembrane transporter activity(GO:2000649) |
| 0.2 | 7.0 | GO:0007338 | single fertilization(GO:0007338) |
| 0.1 | 12.4 | GO:0022900 | electron transport chain(GO:0022900) |
| 0.1 | 0.3 | GO:0070317 | negative regulation of G0 to G1 transition(GO:0070317) |
| 0.1 | 0.8 | GO:1901314 | negative regulation of histone ubiquitination(GO:0033183) regulation of histone H2A K63-linked ubiquitination(GO:1901314) negative regulation of histone H2A K63-linked ubiquitination(GO:1901315) |
| 0.1 | 4.4 | GO:0034308 | primary alcohol metabolic process(GO:0034308) |
| 0.1 | 4.7 | GO:0000387 | spliceosomal snRNP assembly(GO:0000387) |
| 0.1 | 10.0 | GO:0071426 | ribonucleoprotein complex localization(GO:0071166) ribonucleoprotein complex export from nucleus(GO:0071426) |
| 0.1 | 1.0 | GO:0070345 | negative regulation of fat cell proliferation(GO:0070345) |
| 0.1 | 1.3 | GO:0000722 | telomere maintenance via recombination(GO:0000722) |
| 0.1 | 4.0 | GO:0046854 | phosphatidylinositol phosphorylation(GO:0046854) |
| 0.1 | 1.6 | GO:0021522 | spinal cord motor neuron differentiation(GO:0021522) |
| 0.1 | 2.5 | GO:0051489 | regulation of filopodium assembly(GO:0051489) |
| 0.1 | 1.7 | GO:0050966 | detection of mechanical stimulus involved in sensory perception of pain(GO:0050966) |
| 0.1 | 0.7 | GO:0035330 | regulation of hippo signaling(GO:0035330) |
| 0.1 | 2.6 | GO:0007520 | myoblast fusion(GO:0007520) |
| 0.1 | 4.2 | GO:0032355 | response to estradiol(GO:0032355) |
| 0.1 | 2.5 | GO:0017158 | regulation of calcium ion-dependent exocytosis(GO:0017158) |
| 0.1 | 6.0 | GO:0007193 | adenylate cyclase-inhibiting G-protein coupled receptor signaling pathway(GO:0007193) |
| 0.1 | 8.1 | GO:0007613 | memory(GO:0007613) |
| 0.1 | 9.4 | GO:0007631 | feeding behavior(GO:0007631) |
| 0.1 | 1.6 | GO:0015813 | L-glutamate transport(GO:0015813) |
| 0.1 | 0.8 | GO:0008298 | intracellular mRNA localization(GO:0008298) |
| 0.1 | 0.6 | GO:0006265 | DNA topological change(GO:0006265) |
| 0.1 | 7.3 | GO:0050821 | protein stabilization(GO:0050821) |
| 0.1 | 2.4 | GO:0006360 | transcription from RNA polymerase I promoter(GO:0006360) |
| 0.1 | 3.6 | GO:0030490 | maturation of SSU-rRNA(GO:0030490) |
| 0.1 | 10.7 | GO:0007219 | Notch signaling pathway(GO:0007219) |
| 0.1 | 0.5 | GO:0006616 | SRP-dependent cotranslational protein targeting to membrane, translocation(GO:0006616) |
| 0.1 | 0.5 | GO:0043129 | surfactant homeostasis(GO:0043129) |
| 0.0 | 2.4 | GO:0001825 | blastocyst formation(GO:0001825) |
| 0.0 | 0.7 | GO:0033169 | histone H3-K9 demethylation(GO:0033169) |
| 0.0 | 2.1 | GO:0042991 | transcription factor import into nucleus(GO:0042991) |
| 0.0 | 1.8 | GO:0035773 | insulin secretion involved in cellular response to glucose stimulus(GO:0035773) |
| 0.0 | 1.8 | GO:0032091 | negative regulation of protein binding(GO:0032091) |
| 0.0 | 0.2 | GO:0009313 | oligosaccharide catabolic process(GO:0009313) |
| 0.0 | 2.2 | GO:0010977 | negative regulation of neuron projection development(GO:0010977) |
| 0.0 | 0.7 | GO:2000134 | negative regulation of G1/S transition of mitotic cell cycle(GO:2000134) |
Gene overrepresentation in cellular component category:
| Log-likelihood per target | Total log-likelihood | Term | Description |
|---|---|---|---|
| 29.6 | 118.2 | GO:0099573 | glutamatergic postsynaptic density(GO:0099573) |
| 18.5 | 73.8 | GO:1990716 | axonemal central apparatus(GO:1990716) |
| 15.0 | 60.2 | GO:0097123 | cyclin A1-CDK2 complex(GO:0097123) |
| 11.3 | 33.9 | GO:0016939 | kinesin II complex(GO:0016939) |
| 9.4 | 28.3 | GO:1990031 | pinceau fiber(GO:1990031) |
| 8.5 | 34.0 | GO:1990769 | proximal neuron projection(GO:1990769) |
| 8.2 | 106.3 | GO:0034464 | BBSome(GO:0034464) |
| 7.9 | 23.7 | GO:0097224 | sperm connecting piece(GO:0097224) |
| 7.6 | 105.7 | GO:0001520 | outer dense fiber(GO:0001520) |
| 7.1 | 127.8 | GO:0036038 | MKS complex(GO:0036038) |
| 6.9 | 27.6 | GO:0014701 | junctional sarcoplasmic reticulum membrane(GO:0014701) |
| 5.6 | 244.7 | GO:0097546 | ciliary base(GO:0097546) |
| 5.2 | 135.2 | GO:0030992 | intraciliary transport particle B(GO:0030992) |
| 5.0 | 35.3 | GO:0031314 | extrinsic component of mitochondrial inner membrane(GO:0031314) |
| 5.0 | 44.8 | GO:0097442 | CA3 pyramidal cell dendrite(GO:0097442) |
| 4.9 | 147.9 | GO:0034451 | centriolar satellite(GO:0034451) |
| 4.7 | 14.2 | GO:0043291 | RAVE complex(GO:0043291) |
| 4.7 | 46.6 | GO:0002177 | manchette(GO:0002177) |
| 4.0 | 83.6 | GO:0044300 | cerebellar mossy fiber(GO:0044300) |
| 3.3 | 36.4 | GO:1990761 | growth cone lamellipodium(GO:1990761) growth cone filopodium(GO:1990812) |
| 3.2 | 32.4 | GO:0000235 | astral microtubule(GO:0000235) |
| 3.2 | 32.3 | GO:0033116 | endoplasmic reticulum-Golgi intermediate compartment membrane(GO:0033116) |
| 3.1 | 53.0 | GO:0035869 | ciliary transition zone(GO:0035869) |
| 3.1 | 58.2 | GO:0097539 | ciliary transition fiber(GO:0097539) |
| 3.0 | 122.7 | GO:0097228 | sperm principal piece(GO:0097228) |
| 3.0 | 35.5 | GO:0001739 | sex chromatin(GO:0001739) |
| 2.8 | 77.8 | GO:0016581 | NuRD complex(GO:0016581) CHD-type complex(GO:0090545) |
| 2.7 | 46.0 | GO:0031258 | lamellipodium membrane(GO:0031258) |
| 2.5 | 17.2 | GO:0098536 | deuterosome(GO:0098536) |
| 2.3 | 6.9 | GO:0098842 | postsynaptic early endosome(GO:0098842) |
| 2.2 | 15.3 | GO:0031095 | platelet dense tubular network membrane(GO:0031095) |
| 1.8 | 12.7 | GO:0033010 | paranodal junction(GO:0033010) |
| 1.7 | 36.7 | GO:1904115 | axon cytoplasm(GO:1904115) |
| 1.7 | 164.7 | GO:0005814 | centriole(GO:0005814) |
| 1.6 | 43.4 | GO:0010369 | chromocenter(GO:0010369) |
| 1.6 | 17.3 | GO:0097451 | glial limiting end-foot(GO:0097451) |
| 1.6 | 55.9 | GO:0001741 | XY body(GO:0001741) |
| 1.5 | 4.5 | GO:0098830 | presynaptic endosome(GO:0098830) |
| 1.4 | 28.9 | GO:0032045 | guanyl-nucleotide exchange factor complex(GO:0032045) |
| 1.4 | 143.8 | GO:0097014 | ciliary plasm(GO:0097014) |
| 1.4 | 7.1 | GO:0044316 | cone cell pedicle(GO:0044316) |
| 1.4 | 18.5 | GO:0031315 | extrinsic component of mitochondrial outer membrane(GO:0031315) |
| 1.4 | 6.8 | GO:0000938 | GARP complex(GO:0000938) EARP complex(GO:1990745) |
| 1.3 | 28.9 | GO:0097431 | mitotic spindle pole(GO:0097431) |
| 1.3 | 23.5 | GO:0070852 | cell body fiber(GO:0070852) |
| 1.2 | 17.0 | GO:0005883 | neurofilament(GO:0005883) |
| 1.1 | 487.1 | GO:0005929 | cilium(GO:0005929) |
| 1.0 | 6.2 | GO:0000120 | RNA polymerase I transcription factor complex(GO:0000120) |
| 1.0 | 9.2 | GO:0005952 | cAMP-dependent protein kinase complex(GO:0005952) |
| 0.9 | 48.4 | GO:0031430 | M band(GO:0031430) |
| 0.9 | 27.7 | GO:0035371 | microtubule plus-end(GO:0035371) |
| 0.9 | 17.3 | GO:0036056 | filtration diaphragm(GO:0036056) slit diaphragm(GO:0036057) |
| 0.9 | 10.0 | GO:0044613 | nuclear pore central transport channel(GO:0044613) |
| 0.9 | 39.3 | GO:0016235 | aggresome(GO:0016235) |
| 0.9 | 36.9 | GO:0032281 | AMPA glutamate receptor complex(GO:0032281) |
| 0.8 | 25.1 | GO:0032839 | dendrite cytoplasm(GO:0032839) |
| 0.8 | 4.9 | GO:0070449 | elongin complex(GO:0070449) |
| 0.8 | 4.0 | GO:1990131 | Gtr1-Gtr2 GTPase complex(GO:1990131) |
| 0.8 | 94.2 | GO:0032587 | ruffle membrane(GO:0032587) |
| 0.8 | 2.4 | GO:0034456 | CURI complex(GO:0032545) UTP-C complex(GO:0034456) |
| 0.8 | 28.8 | GO:0097440 | apical dendrite(GO:0097440) |
| 0.7 | 12.5 | GO:0002199 | zona pellucida receptor complex(GO:0002199) |
| 0.7 | 8.7 | GO:0030131 | clathrin adaptor complex(GO:0030131) |
| 0.7 | 14.6 | GO:0032426 | stereocilium tip(GO:0032426) |
| 0.7 | 10.3 | GO:0000177 | cytoplasmic exosome (RNase complex)(GO:0000177) |
| 0.7 | 6.1 | GO:0005871 | kinesin complex(GO:0005871) |
| 0.7 | 10.7 | GO:0017101 | aminoacyl-tRNA synthetase multienzyme complex(GO:0017101) |
| 0.7 | 25.0 | GO:0060077 | inhibitory synapse(GO:0060077) |
| 0.6 | 10.4 | GO:0030061 | mitochondrial crista(GO:0030061) |
| 0.6 | 253.9 | GO:0005874 | microtubule(GO:0005874) |
| 0.6 | 1.8 | GO:0032156 | septin cytoskeleton(GO:0032156) |
| 0.6 | 27.9 | GO:0032809 | neuronal cell body membrane(GO:0032809) |
| 0.6 | 5.9 | GO:0000408 | EKC/KEOPS complex(GO:0000408) |
| 0.6 | 8.4 | GO:0017119 | Golgi transport complex(GO:0017119) |
| 0.5 | 41.5 | GO:0005776 | autophagosome(GO:0005776) |
| 0.5 | 45.4 | GO:0008076 | voltage-gated potassium channel complex(GO:0008076) |
| 0.5 | 84.6 | GO:0043679 | axon terminus(GO:0043679) |
| 0.5 | 2.0 | GO:0000176 | nuclear exosome (RNase complex)(GO:0000176) |
| 0.5 | 2.0 | GO:0005608 | laminin-3 complex(GO:0005608) |
| 0.5 | 172.0 | GO:0060076 | excitatory synapse(GO:0060076) |
| 0.5 | 5.4 | GO:0031415 | NatA complex(GO:0031415) |
| 0.4 | 26.0 | GO:0005801 | cis-Golgi network(GO:0005801) |
| 0.4 | 3.0 | GO:0031616 | spindle pole centrosome(GO:0031616) |
| 0.4 | 4.2 | GO:0042382 | paraspeckles(GO:0042382) |
| 0.4 | 2.9 | GO:0033263 | HOPS complex(GO:0030897) CORVET complex(GO:0033263) |
| 0.4 | 5.3 | GO:0043196 | varicosity(GO:0043196) |
| 0.4 | 4.7 | GO:0032797 | SMN complex(GO:0032797) |
| 0.4 | 14.2 | GO:0045095 | keratin filament(GO:0045095) |
| 0.3 | 73.9 | GO:0005802 | trans-Golgi network(GO:0005802) |
| 0.3 | 4.5 | GO:0005688 | U6 snRNP(GO:0005688) |
| 0.3 | 1.3 | GO:0035061 | interchromatin granule(GO:0035061) |
| 0.3 | 15.5 | GO:1990391 | DNA repair complex(GO:1990391) |
| 0.3 | 3.8 | GO:0072546 | ER membrane protein complex(GO:0072546) |
| 0.3 | 2.8 | GO:0044214 | spanning component of plasma membrane(GO:0044214) spanning component of membrane(GO:0089717) |
| 0.3 | 2.3 | GO:0000137 | Golgi cis cisterna(GO:0000137) |
| 0.3 | 33.6 | GO:0001669 | acrosomal vesicle(GO:0001669) |
| 0.2 | 23.5 | GO:0055037 | recycling endosome(GO:0055037) |
| 0.2 | 1.6 | GO:0044352 | pinosome(GO:0044352) macropinosome(GO:0044354) |
| 0.2 | 8.4 | GO:0005637 | nuclear inner membrane(GO:0005637) |
| 0.2 | 89.6 | GO:0016607 | nuclear speck(GO:0016607) |
| 0.2 | 1.7 | GO:0008328 | ionotropic glutamate receptor complex(GO:0008328) neurotransmitter receptor complex(GO:0098878) |
| 0.2 | 20.2 | GO:0070382 | exocytic vesicle(GO:0070382) |
| 0.2 | 6.7 | GO:0031901 | early endosome membrane(GO:0031901) |
| 0.2 | 0.5 | GO:0005785 | signal recognition particle receptor complex(GO:0005785) |
| 0.1 | 11.9 | GO:0030496 | midbody(GO:0030496) |
| 0.1 | 63.5 | GO:0030425 | dendrite(GO:0030425) |
| 0.1 | 7.8 | GO:0042645 | nucleoid(GO:0009295) mitochondrial nucleoid(GO:0042645) |
| 0.1 | 0.3 | GO:0000812 | Swr1 complex(GO:0000812) |
| 0.1 | 21.3 | GO:0005769 | early endosome(GO:0005769) |
| 0.1 | 2.8 | GO:0048770 | melanosome(GO:0042470) pigment granule(GO:0048770) |
| 0.1 | 65.5 | GO:0005768 | endosome(GO:0005768) |
| 0.1 | 43.6 | GO:0005813 | centrosome(GO:0005813) |
| 0.1 | 3.5 | GO:0000159 | protein phosphatase type 2A complex(GO:0000159) |
| 0.1 | 6.6 | GO:0005815 | microtubule organizing center(GO:0005815) |
| 0.1 | 1.8 | GO:0005847 | mRNA cleavage and polyadenylation specificity factor complex(GO:0005847) |
| 0.1 | 2.3 | GO:0043189 | NuA4 histone acetyltransferase complex(GO:0035267) H4/H2A histone acetyltransferase complex(GO:0043189) H4 histone acetyltransferase complex(GO:1902562) |
| 0.1 | 1.3 | GO:0030008 | TRAPP complex(GO:0030008) |
| 0.1 | 6.4 | GO:0000932 | cytoplasmic mRNA processing body(GO:0000932) |
| 0.1 | 13.8 | GO:0036477 | somatodendritic compartment(GO:0036477) |
| 0.0 | 0.4 | GO:0000015 | phosphopyruvate hydratase complex(GO:0000015) |
| 0.0 | 0.3 | GO:0005664 | origin recognition complex(GO:0000808) nuclear origin of replication recognition complex(GO:0005664) |
| 0.0 | 2.4 | GO:0031463 | Cul3-RING ubiquitin ligase complex(GO:0031463) |
| 0.0 | 1.8 | GO:0005643 | nuclear pore(GO:0005643) |
| 0.0 | 0.3 | GO:0035327 | transcriptionally active chromatin(GO:0035327) |
| 0.0 | 2.0 | GO:0000313 | organellar ribosome(GO:0000313) mitochondrial ribosome(GO:0005761) |
| 0.0 | 7.1 | GO:0016604 | nuclear body(GO:0016604) |
| 0.0 | 1.8 | GO:0005759 | mitochondrial matrix(GO:0005759) |
Gene overrepresentation in molecular function category:
| Log-likelihood per target | Total log-likelihood | Term | Description |
|---|---|---|---|
| 29.6 | 29.6 | GO:0005119 | smoothened binding(GO:0005119) |
| 19.0 | 75.8 | GO:0061628 | H3K27me3 modified histone binding(GO:0061628) |
| 17.7 | 53.2 | GO:0004698 | calcium-dependent protein kinase C activity(GO:0004698) |
| 15.6 | 93.6 | GO:0008568 | microtubule-severing ATPase activity(GO:0008568) |
| 9.9 | 88.9 | GO:0015467 | G-protein activated inward rectifier potassium channel activity(GO:0015467) |
| 9.3 | 37.3 | GO:0030156 | benzodiazepine receptor binding(GO:0030156) |
| 9.1 | 109.5 | GO:0032051 | clathrin light chain binding(GO:0032051) |
| 9.1 | 63.5 | GO:0031812 | G-protein coupled nucleotide receptor binding(GO:0031811) P2Y1 nucleotide receptor binding(GO:0031812) |
| 9.0 | 117.3 | GO:0009931 | calcium-dependent protein serine/threonine kinase activity(GO:0009931) |
| 8.4 | 41.9 | GO:0004705 | JUN kinase activity(GO:0004705) SAP kinase activity(GO:0016909) |
| 8.1 | 32.6 | GO:0004127 | cytidylate kinase activity(GO:0004127) |
| 8.1 | 32.3 | GO:0042978 | ornithine decarboxylase activator activity(GO:0042978) |
| 7.8 | 23.4 | GO:0022865 | transmembrane electron transfer carrier(GO:0022865) |
| 7.2 | 28.8 | GO:0045183 | translation factor activity, non-nucleic acid binding(GO:0045183) |
| 6.7 | 26.8 | GO:0004069 | L-aspartate:2-oxoglutarate aminotransferase activity(GO:0004069) |
| 5.5 | 49.8 | GO:0034452 | dynactin binding(GO:0034452) |
| 5.0 | 60.6 | GO:0097322 | 7SK snRNA binding(GO:0097322) |
| 5.0 | 49.8 | GO:0045504 | dynein heavy chain binding(GO:0045504) |
| 5.0 | 44.8 | GO:0005519 | cytoskeletal regulatory protein binding(GO:0005519) |
| 4.4 | 30.8 | GO:0008158 | hedgehog receptor activity(GO:0008158) |
| 3.7 | 115.3 | GO:0004181 | metallocarboxypeptidase activity(GO:0004181) |
| 3.6 | 10.9 | GO:0005026 | transforming growth factor beta receptor activity, type II(GO:0005026) |
| 3.6 | 10.7 | GO:0004819 | glutamine-tRNA ligase activity(GO:0004819) |
| 3.4 | 13.7 | GO:0031800 | type 3 metabotropic glutamate receptor binding(GO:0031800) |
| 3.1 | 15.3 | GO:0061649 | ubiquitinated histone binding(GO:0061649) |
| 2.8 | 8.3 | GO:0004802 | transketolase activity(GO:0004802) |
| 2.7 | 38.3 | GO:0030235 | nitric-oxide synthase regulator activity(GO:0030235) |
| 2.6 | 23.8 | GO:0032795 | heterotrimeric G-protein binding(GO:0032795) |
| 2.5 | 7.4 | GO:0050145 | nucleoside phosphate kinase activity(GO:0050145) |
| 2.5 | 56.4 | GO:0003756 | protein disulfide isomerase activity(GO:0003756) intramolecular oxidoreductase activity, transposing S-S bonds(GO:0016864) |
| 2.3 | 13.9 | GO:0008545 | JUN kinase kinase activity(GO:0008545) |
| 2.1 | 35.3 | GO:0017017 | MAP kinase tyrosine/serine/threonine phosphatase activity(GO:0017017) |
| 2.0 | 29.3 | GO:0015279 | store-operated calcium channel activity(GO:0015279) |
| 1.9 | 31.1 | GO:0050897 | cobalt ion binding(GO:0050897) |
| 1.9 | 108.7 | GO:0004693 | cyclin-dependent protein serine/threonine kinase activity(GO:0004693) |
| 1.7 | 26.0 | GO:0042577 | lipid phosphatase activity(GO:0042577) |
| 1.6 | 6.6 | GO:0050816 | phosphothreonine binding(GO:0050816) |
| 1.6 | 16.2 | GO:0070008 | serine-type exopeptidase activity(GO:0070008) |
| 1.6 | 6.4 | GO:0005136 | interleukin-4 receptor binding(GO:0005136) |
| 1.6 | 42.3 | GO:0030332 | cyclin binding(GO:0030332) |
| 1.5 | 6.0 | GO:0033883 | pyridoxal phosphatase activity(GO:0033883) |
| 1.5 | 10.4 | GO:0047179 | platelet-activating factor acetyltransferase activity(GO:0047179) |
| 1.5 | 4.4 | GO:0003963 | RNA-3'-phosphate cyclase activity(GO:0003963) |
| 1.5 | 39.5 | GO:0004033 | aldo-keto reductase (NADP) activity(GO:0004033) |
| 1.4 | 18.5 | GO:0004439 | phosphatidylinositol-4,5-bisphosphate 5-phosphatase activity(GO:0004439) |
| 1.4 | 117.8 | GO:0030374 | ligand-dependent nuclear receptor transcription coactivator activity(GO:0030374) |
| 1.4 | 15.3 | GO:0004691 | cAMP-dependent protein kinase activity(GO:0004691) |
| 1.4 | 16.4 | GO:0004017 | adenylate kinase activity(GO:0004017) |
| 1.4 | 55.8 | GO:0005086 | ARF guanyl-nucleotide exchange factor activity(GO:0005086) |
| 1.3 | 89.2 | GO:0046875 | ephrin receptor binding(GO:0046875) |
| 1.3 | 99.4 | GO:0051018 | protein kinase A binding(GO:0051018) |
| 1.3 | 27.9 | GO:0008510 | sodium:bicarbonate symporter activity(GO:0008510) |
| 1.3 | 30.4 | GO:0003841 | 1-acylglycerol-3-phosphate O-acyltransferase activity(GO:0003841) |
| 1.3 | 11.3 | GO:0047498 | calcium-dependent phospholipase A2 activity(GO:0047498) |
| 1.2 | 105.7 | GO:0030507 | spectrin binding(GO:0030507) |
| 1.2 | 4.8 | GO:0016316 | phosphatidylinositol-3,4-bisphosphate 4-phosphatase activity(GO:0016316) phosphatidylinositol-4,5-bisphosphate 4-phosphatase activity(GO:0034597) |
| 1.2 | 41.0 | GO:0031435 | mitogen-activated protein kinase kinase kinase binding(GO:0031435) |
| 1.2 | 3.6 | GO:0008107 | galactoside 2-alpha-L-fucosyltransferase activity(GO:0008107) alpha-(1,2)-fucosyltransferase activity(GO:0031127) |
| 1.2 | 38.7 | GO:0019707 | protein-cysteine S-palmitoyltransferase activity(GO:0019706) protein-cysteine S-acyltransferase activity(GO:0019707) |
| 1.2 | 5.8 | GO:0004814 | arginine-tRNA ligase activity(GO:0004814) |
| 1.2 | 18.6 | GO:0008190 | eukaryotic initiation factor 4E binding(GO:0008190) |
| 1.1 | 57.1 | GO:0003785 | actin monomer binding(GO:0003785) |
| 1.1 | 36.4 | GO:0070064 | proline-rich region binding(GO:0070064) |
| 1.1 | 7.8 | GO:0030160 | GKAP/Homer scaffold activity(GO:0030160) |
| 1.0 | 6.2 | GO:0003828 | alpha-N-acetylneuraminate alpha-2,8-sialyltransferase activity(GO:0003828) |
| 1.0 | 5.0 | GO:0035243 | protein-arginine omega-N symmetric methyltransferase activity(GO:0035243) |
| 1.0 | 27.3 | GO:0017160 | Ral GTPase binding(GO:0017160) |
| 0.9 | 21.6 | GO:0030159 | receptor signaling complex scaffold activity(GO:0030159) |
| 0.9 | 7.3 | GO:0031821 | G-protein coupled serotonin receptor binding(GO:0031821) |
| 0.9 | 12.7 | GO:0019869 | chloride channel inhibitor activity(GO:0019869) |
| 0.9 | 23.6 | GO:0000030 | mannosyltransferase activity(GO:0000030) |
| 0.9 | 19.8 | GO:0004653 | polypeptide N-acetylgalactosaminyltransferase activity(GO:0004653) |
| 0.9 | 11.5 | GO:0070840 | dynein complex binding(GO:0070840) |
| 0.9 | 44.2 | GO:0001103 | RNA polymerase II repressing transcription factor binding(GO:0001103) |
| 0.8 | 4.2 | GO:1904288 | BAT3 complex binding(GO:1904288) |
| 0.8 | 2.5 | GO:0008476 | protein-tyrosine sulfotransferase activity(GO:0008476) |
| 0.8 | 5.0 | GO:0000155 | phosphorelay sensor kinase activity(GO:0000155) |
| 0.8 | 2.5 | GO:0004392 | heme oxygenase (decyclizing) activity(GO:0004392) |
| 0.8 | 282.9 | GO:0008017 | microtubule binding(GO:0008017) |
| 0.8 | 9.2 | GO:0005391 | sodium:potassium-exchanging ATPase activity(GO:0005391) |
| 0.8 | 5.3 | GO:0032027 | myosin light chain binding(GO:0032027) |
| 0.7 | 7.5 | GO:0022851 | GABA-gated chloride ion channel activity(GO:0022851) |
| 0.7 | 23.3 | GO:0043015 | gamma-tubulin binding(GO:0043015) |
| 0.7 | 5.4 | GO:1990190 | peptide-glutamate-N-acetyltransferase activity(GO:1990190) |
| 0.7 | 2.7 | GO:0097506 | uracil DNA N-glycosylase activity(GO:0004844) deaminated base DNA N-glycosylase activity(GO:0097506) |
| 0.7 | 16.8 | GO:0097602 | cullin family protein binding(GO:0097602) |
| 0.7 | 12.1 | GO:0032041 | histone deacetylase activity (H3-K14 specific)(GO:0031078) NAD-dependent histone deacetylase activity (H3-K14 specific)(GO:0032041) |
| 0.6 | 3.2 | GO:0070548 | L-glutamine aminotransferase activity(GO:0070548) |
| 0.6 | 31.5 | GO:0003755 | peptidyl-prolyl cis-trans isomerase activity(GO:0003755) |
| 0.6 | 4.2 | GO:0044547 | DNA topoisomerase binding(GO:0044547) |
| 0.6 | 3.6 | GO:0008321 | Ral guanyl-nucleotide exchange factor activity(GO:0008321) |
| 0.6 | 26.5 | GO:0008138 | protein tyrosine/serine/threonine phosphatase activity(GO:0008138) |
| 0.6 | 6.9 | GO:0071933 | Arp2/3 complex binding(GO:0071933) |
| 0.6 | 2.3 | GO:0000822 | inositol hexakisphosphate binding(GO:0000822) |
| 0.6 | 15.1 | GO:0070491 | repressing transcription factor binding(GO:0070491) |
| 0.5 | 5.4 | GO:0001609 | G-protein coupled adenosine receptor activity(GO:0001609) |
| 0.5 | 36.9 | GO:0005245 | voltage-gated calcium channel activity(GO:0005245) |
| 0.5 | 1.6 | GO:1990955 | G-rich single-stranded DNA binding(GO:1990955) |
| 0.5 | 88.2 | GO:0004867 | serine-type endopeptidase inhibitor activity(GO:0004867) |
| 0.5 | 5.2 | GO:0003876 | AMP deaminase activity(GO:0003876) adenosine-phosphate deaminase activity(GO:0047623) |
| 0.5 | 18.9 | GO:0048020 | CCR chemokine receptor binding(GO:0048020) |
| 0.5 | 2.8 | GO:0070628 | proteasome binding(GO:0070628) |
| 0.5 | 7.0 | GO:0031957 | very long-chain fatty acid-CoA ligase activity(GO:0031957) |
| 0.4 | 195.5 | GO:0030695 | GTPase regulator activity(GO:0030695) |
| 0.4 | 5.7 | GO:0004862 | cAMP-dependent protein kinase inhibitor activity(GO:0004862) |
| 0.4 | 2.6 | GO:0000832 | inositol hexakisphosphate kinase activity(GO:0000828) inositol hexakisphosphate 5-kinase activity(GO:0000832) inositol hexakisphosphate 1-kinase activity(GO:0052723) inositol hexakisphosphate 3-kinase activity(GO:0052724) |
| 0.4 | 4.4 | GO:0008889 | glycerophosphodiester phosphodiesterase activity(GO:0008889) |
| 0.4 | 18.4 | GO:0016814 | hydrolase activity, acting on carbon-nitrogen (but not peptide) bonds, in cyclic amidines(GO:0016814) |
| 0.4 | 16.8 | GO:0051019 | mitogen-activated protein kinase binding(GO:0051019) |
| 0.4 | 30.1 | GO:0004722 | protein serine/threonine phosphatase activity(GO:0004722) |
| 0.4 | 8.9 | GO:0051787 | misfolded protein binding(GO:0051787) |
| 0.4 | 31.7 | GO:0015459 | potassium channel regulator activity(GO:0015459) |
| 0.4 | 45.6 | GO:0036459 | thiol-dependent ubiquitinyl hydrolase activity(GO:0036459) ubiquitinyl hydrolase activity(GO:0101005) |
| 0.4 | 22.8 | GO:0005544 | calcium-dependent phospholipid binding(GO:0005544) |
| 0.4 | 10.0 | GO:0017056 | structural constituent of nuclear pore(GO:0017056) |
| 0.4 | 17.0 | GO:0035255 | ionotropic glutamate receptor binding(GO:0035255) |
| 0.4 | 10.2 | GO:0051721 | protein phosphatase 2A binding(GO:0051721) |
| 0.3 | 3.1 | GO:0008479 | queuine tRNA-ribosyltransferase activity(GO:0008479) |
| 0.3 | 1.4 | GO:0070052 | collagen V binding(GO:0070052) |
| 0.3 | 2.0 | GO:0051575 | 5'-deoxyribose-5-phosphate lyase activity(GO:0051575) |
| 0.3 | 1.3 | GO:0070137 | ubiquitin-like protein-specific endopeptidase activity(GO:0070137) SUMO-specific endopeptidase activity(GO:0070139) |
| 0.3 | 28.8 | GO:0048306 | calcium-dependent protein binding(GO:0048306) |
| 0.3 | 14.0 | GO:0003777 | microtubule motor activity(GO:0003777) |
| 0.3 | 12.1 | GO:0071949 | FAD binding(GO:0071949) |
| 0.3 | 4.2 | GO:0004707 | MAP kinase activity(GO:0004707) |
| 0.3 | 12.3 | GO:0000175 | 3'-5'-exoribonuclease activity(GO:0000175) |
| 0.3 | 15.8 | GO:0050699 | WW domain binding(GO:0050699) |
| 0.3 | 62.9 | GO:0005516 | calmodulin binding(GO:0005516) |
| 0.3 | 23.2 | GO:0005546 | phosphatidylinositol-4,5-bisphosphate binding(GO:0005546) |
| 0.3 | 8.9 | GO:0008139 | nuclear localization sequence binding(GO:0008139) |
| 0.3 | 9.2 | GO:0051059 | NF-kappaB binding(GO:0051059) |
| 0.3 | 3.8 | GO:0005225 | volume-sensitive anion channel activity(GO:0005225) |
| 0.3 | 7.1 | GO:0030552 | cAMP binding(GO:0030552) |
| 0.3 | 109.0 | GO:0005525 | GTP binding(GO:0005525) |
| 0.3 | 5.1 | GO:0016595 | glutamate binding(GO:0016595) |
| 0.3 | 1.3 | GO:0030346 | protein phosphatase 2B binding(GO:0030346) |
| 0.3 | 1.8 | GO:0004111 | creatine kinase activity(GO:0004111) |
| 0.3 | 2.0 | GO:0004550 | nucleoside diphosphate kinase activity(GO:0004550) |
| 0.2 | 25.1 | GO:0008565 | protein transporter activity(GO:0008565) |
| 0.2 | 25.4 | GO:0017137 | Rab GTPase binding(GO:0017137) |
| 0.2 | 20.7 | GO:0004860 | protein kinase inhibitor activity(GO:0004860) |
| 0.2 | 1.9 | GO:0031681 | G-protein beta-subunit binding(GO:0031681) |
| 0.2 | 6.0 | GO:0003887 | DNA-directed DNA polymerase activity(GO:0003887) |
| 0.2 | 43.5 | GO:0016874 | ligase activity(GO:0016874) |
| 0.2 | 6.0 | GO:0015215 | nucleotide transmembrane transporter activity(GO:0015215) |
| 0.2 | 1.0 | GO:0004060 | arylamine N-acetyltransferase activity(GO:0004060) |
| 0.2 | 1.7 | GO:0004332 | fructose-bisphosphate aldolase activity(GO:0004332) |
| 0.2 | 6.4 | GO:0048365 | Rac GTPase binding(GO:0048365) |
| 0.2 | 3.8 | GO:0070003 | threonine-type endopeptidase activity(GO:0004298) threonine-type peptidase activity(GO:0070003) |
| 0.1 | 13.4 | GO:0003725 | double-stranded RNA binding(GO:0003725) |
| 0.1 | 17.0 | GO:0004222 | metalloendopeptidase activity(GO:0004222) |
| 0.1 | 0.5 | GO:0005047 | signal recognition particle binding(GO:0005047) |
| 0.1 | 4.2 | GO:0004012 | phospholipid-translocating ATPase activity(GO:0004012) |
| 0.1 | 0.7 | GO:0038051 | glucocorticoid receptor activity(GO:0004883) transcription factor activity, ligand-activated RNA polymerase II transcription factor binding(GO:0038049) glucocorticoid-activated RNA polymerase II transcription factor binding transcription factor activity(GO:0038051) |
| 0.1 | 13.5 | GO:0043130 | ubiquitin binding(GO:0043130) |
| 0.1 | 6.0 | GO:0019212 | phosphatase inhibitor activity(GO:0019212) |
| 0.1 | 0.8 | GO:0071558 | histone demethylase activity (H3-K27 specific)(GO:0071558) |
| 0.1 | 5.4 | GO:0030145 | manganese ion binding(GO:0030145) |
| 0.1 | 0.9 | GO:0034711 | inhibin binding(GO:0034711) |
| 0.1 | 0.6 | GO:0003917 | DNA topoisomerase type I activity(GO:0003917) |
| 0.1 | 10.1 | GO:0005254 | chloride channel activity(GO:0005254) |
| 0.1 | 2.6 | GO:0042974 | retinoic acid receptor binding(GO:0042974) |
| 0.1 | 5.9 | GO:0002039 | p53 binding(GO:0002039) |
| 0.1 | 2.0 | GO:0070577 | lysine-acetylated histone binding(GO:0070577) |
| 0.1 | 1.6 | GO:0005313 | L-glutamate transmembrane transporter activity(GO:0005313) |
| 0.1 | 3.3 | GO:0051393 | alpha-actinin binding(GO:0051393) |
| 0.1 | 1.8 | GO:0000062 | fatty-acyl-CoA binding(GO:0000062) |
| 0.1 | 9.1 | GO:0002020 | protease binding(GO:0002020) |
| 0.1 | 1.8 | GO:0070412 | R-SMAD binding(GO:0070412) |
| 0.1 | 0.7 | GO:0042809 | vitamin D receptor binding(GO:0042809) |
| 0.1 | 0.8 | GO:0008526 | phosphatidylinositol transporter activity(GO:0008526) |
| 0.1 | 1.5 | GO:0003950 | NAD+ ADP-ribosyltransferase activity(GO:0003950) |
| 0.1 | 0.9 | GO:0005547 | phosphatidylinositol-3,4,5-trisphosphate binding(GO:0005547) |
| 0.1 | 3.3 | GO:0043022 | ribosome binding(GO:0043022) |
| 0.0 | 2.8 | GO:0004197 | cysteine-type endopeptidase activity(GO:0004197) |
| 0.0 | 7.9 | GO:0008168 | methyltransferase activity(GO:0008168) |
| 0.0 | 23.4 | GO:0008270 | zinc ion binding(GO:0008270) |
| 0.0 | 19.4 | GO:0004930 | G-protein coupled receptor activity(GO:0004930) |
| 0.0 | 0.4 | GO:0004634 | phosphopyruvate hydratase activity(GO:0004634) |
| 0.0 | 2.8 | GO:0005089 | Rho guanyl-nucleotide exchange factor activity(GO:0005089) |
| 0.0 | 2.3 | GO:0051117 | ATPase binding(GO:0051117) |
| 0.0 | 13.0 | GO:0005509 | calcium ion binding(GO:0005509) |
| 0.0 | 1.2 | GO:0005088 | Ras guanyl-nucleotide exchange factor activity(GO:0005088) |
| 0.0 | 0.2 | GO:0004568 | chitinase activity(GO:0004568) |
| 0.0 | 0.6 | GO:0035035 | histone acetyltransferase binding(GO:0035035) |
| 0.0 | 1.6 | GO:0044325 | ion channel binding(GO:0044325) |
Gene overrepresentation in curated gene sets: canonical pathways category:
| Log-likelihood per target | Total log-likelihood | Term | Description |
|---|---|---|---|
| 3.5 | 152.4 | ST MYOCYTE AD PATHWAY | Myocyte Adrenergic Pathway is a specific case of the generalized Adrenergic Pathway. |
| 3.2 | 118.2 | ST WNT CA2 CYCLIC GMP PATHWAY | Wnt/Ca2+/cyclic GMP signaling. |
| 1.9 | 35.6 | SA REG CASCADE OF CYCLIN EXPR | Expression of cyclins regulates progression through the cell cycle by activating cyclin-dependent kinases. |
| 1.7 | 15.2 | SA G1 AND S PHASES | Cdk2, 4, and 6 bind cyclin D in G1, while cdk2/cyclin E promotes the G1/S transition. |
| 1.3 | 37.8 | ST GRANULE CELL SURVIVAL PATHWAY | Granule Cell Survival Pathway is a specific case of more general PAC1 Receptor Pathway. |
| 1.2 | 53.2 | PID IL8 CXCR1 PATHWAY | IL8- and CXCR1-mediated signaling events |
| 1.2 | 60.5 | PID RAS PATHWAY | Regulation of Ras family activation |
| 1.0 | 90.2 | PID RAC1 REG PATHWAY | Regulation of RAC1 activity |
| 1.0 | 57.0 | SIG REGULATION OF THE ACTIN CYTOSKELETON BY RHO GTPASES | Genes related to regulation of the actin cytoskeleton |
| 0.8 | 10.9 | PID ALK2 PATHWAY | ALK2 signaling events |
| 0.8 | 57.2 | PID HEDGEHOG GLI PATHWAY | Hedgehog signaling events mediated by Gli proteins |
| 0.4 | 17.3 | PID THROMBIN PAR1 PATHWAY | PAR1-mediated thrombin signaling events |
| 0.4 | 23.3 | PID PLK1 PATHWAY | PLK1 signaling events |
| 0.4 | 54.6 | PID BETA CATENIN NUC PATHWAY | Regulation of nuclear beta catenin signaling and target gene transcription |
| 0.4 | 12.7 | PID INTEGRIN2 PATHWAY | Beta2 integrin cell surface interactions |
| 0.4 | 12.1 | PID HDAC CLASSIII PATHWAY | Signaling events mediated by HDAC Class III |
| 0.3 | 33.4 | WNT SIGNALING | Genes related to Wnt-mediated signal transduction |
| 0.3 | 13.6 | PID INTEGRIN A4B1 PATHWAY | Alpha4 beta1 integrin signaling events |
| 0.3 | 6.6 | PID MYC PATHWAY | C-MYC pathway |
| 0.3 | 31.0 | PID ERA GENOMIC PATHWAY | Validated nuclear estrogen receptor alpha network |
| 0.2 | 10.4 | PID LIS1 PATHWAY | Lissencephaly gene (LIS1) in neuronal migration and development |
| 0.2 | 4.0 | PID WNT NONCANONICAL PATHWAY | Noncanonical Wnt signaling pathway |
| 0.2 | 4.5 | PID ARF 3PATHWAY | Arf1 pathway |
| 0.1 | 5.0 | PID RET PATHWAY | Signaling events regulated by Ret tyrosine kinase |
| 0.1 | 5.2 | PID CDC42 REG PATHWAY | Regulation of CDC42 activity |
| 0.1 | 1.9 | PID S1P S1P2 PATHWAY | S1P2 pathway |
| 0.1 | 2.8 | ST INTEGRIN SIGNALING PATHWAY | Integrin Signaling Pathway |
| 0.1 | 2.0 | PID INTEGRIN4 PATHWAY | Alpha6 beta4 integrin-ligand interactions |
| 0.1 | 1.7 | PID VEGFR1 PATHWAY | VEGFR1 specific signals |
| 0.1 | 2.2 | PID INSULIN GLUCOSE PATHWAY | Insulin-mediated glucose transport |
| 0.1 | 3.4 | PID ARF6 PATHWAY | Arf6 signaling events |
| 0.1 | 2.5 | PID NETRIN PATHWAY | Netrin-mediated signaling events |
| 0.1 | 13.0 | PID P53 DOWNSTREAM PATHWAY | Direct p53 effectors |
| 0.1 | 4.1 | PID E2F PATHWAY | E2F transcription factor network |
| 0.1 | 2.3 | PID CERAMIDE PATHWAY | Ceramide signaling pathway |
| 0.1 | 1.8 | SIG CD40PATHWAYMAP | Genes related to CD40 signaling |
| 0.1 | 2.7 | PID ERBB1 INTERNALIZATION PATHWAY | Internalization of ErbB1 |
| 0.0 | 0.7 | PID HDAC CLASSII PATHWAY | Signaling events mediated by HDAC Class II |
| 0.0 | 2.4 | PID TELOMERASE PATHWAY | Regulation of Telomerase |
| 0.0 | 2.7 | PID P73PATHWAY | p73 transcription factor network |
| 0.0 | 2.0 | PID RB 1PATHWAY | Regulation of retinoblastoma protein |
| 0.0 | 1.6 | PID TCR CALCIUM PATHWAY | Calcium signaling in the CD4+ TCR pathway |
| 0.0 | 1.3 | PID TGFBR PATHWAY | TGF-beta receptor signaling |
| 0.0 | 0.5 | PID IL3 PATHWAY | IL3-mediated signaling events |
| 0.0 | 0.5 | PID ERBB2 ERBB3 PATHWAY | ErbB2/ErbB3 signaling events |
| 0.0 | 1.0 | PID HDAC CLASSI PATHWAY | Signaling events mediated by HDAC Class I |
| 0.0 | 0.3 | PID NCADHERIN PATHWAY | N-cadherin signaling events |
Gene overrepresentation in curated gene sets: REACTOME pathways category:
| Log-likelihood per target | Total log-likelihood | Term | Description |
|---|---|---|---|
| 4.4 | 224.0 | REACTOME TRAFFICKING OF AMPA RECEPTORS | Genes involved in Trafficking of AMPA receptors |
| 3.0 | 60.2 | REACTOME CYCLIN A B1 ASSOCIATED EVENTS DURING G2 M TRANSITION | Genes involved in Cyclin A/B1 associated events during G2/M transition |
| 2.1 | 55.8 | REACTOME JNK C JUN KINASES PHOSPHORYLATION AND ACTIVATION MEDIATED BY ACTIVATED HUMAN TAK1 | Genes involved in JNK (c-Jun kinases) phosphorylation and activation mediated by activated human TAK1 |
| 1.7 | 17.3 | REACTOME ELEVATION OF CYTOSOLIC CA2 LEVELS | Genes involved in Elevation of cytosolic Ca2+ levels |
| 1.4 | 25.7 | REACTOME P2Y RECEPTORS | Genes involved in P2Y receptors |
| 1.3 | 33.3 | REACTOME CRMPS IN SEMA3A SIGNALING | Genes involved in CRMPs in Sema3A signaling |
| 1.3 | 63.4 | REACTOME SIGNALING BY ROBO RECEPTOR | Genes involved in Signaling by Robo receptor |
| 1.2 | 48.9 | REACTOME RAP1 SIGNALLING | Genes involved in Rap1 signalling |
| 0.8 | 46.2 | REACTOME INHIBITION OF VOLTAGE GATED CA2 CHANNELS VIA GBETA GAMMA SUBUNITS | Genes involved in Inhibition of voltage gated Ca2+ channels via Gbeta/gamma subunits |
| 0.8 | 13.7 | REACTOME IONOTROPIC ACTIVITY OF KAINATE RECEPTORS | Genes involved in Ionotropic activity of Kainate Receptors |
| 0.7 | 44.6 | REACTOME VOLTAGE GATED POTASSIUM CHANNELS | Genes involved in Voltage gated Potassium channels |
| 0.7 | 5.4 | REACTOME NUCLEOTIDE LIKE PURINERGIC RECEPTORS | Genes involved in Nucleotide-like (purinergic) receptors |
| 0.7 | 15.2 | REACTOME SYNTHESIS OF PIPS AT THE GOLGI MEMBRANE | Genes involved in Synthesis of PIPs at the Golgi membrane |
| 0.7 | 23.5 | REACTOME ADHERENS JUNCTIONS INTERACTIONS | Genes involved in Adherens junctions interactions |
| 0.6 | 29.5 | REACTOME SYNTHESIS OF PA | Genes involved in Synthesis of PA |
| 0.6 | 12.6 | REACTOME MRNA DECAY BY 5 TO 3 EXORIBONUCLEASE | Genes involved in mRNA Decay by 5' to 3' Exoribonuclease |
| 0.6 | 28.3 | REACTOME REGULATION OF WATER BALANCE BY RENAL AQUAPORINS | Genes involved in Regulation of Water Balance by Renal Aquaporins |
| 0.6 | 7.3 | REACTOME G PROTEIN ACTIVATION | Genes involved in G-protein activation |
| 0.6 | 2.8 | REACTOME NRIF SIGNALS CELL DEATH FROM THE NUCLEUS | Genes involved in NRIF signals cell death from the nucleus |
| 0.5 | 16.4 | REACTOME SYNTHESIS AND INTERCONVERSION OF NUCLEOTIDE DI AND TRIPHOSPHATES | Genes involved in Synthesis and interconversion of nucleotide di- and triphosphates |
| 0.5 | 11.7 | REACTOME ACTIVATION OF BH3 ONLY PROTEINS | Genes involved in Activation of BH3-only proteins |
| 0.4 | 9.0 | REACTOME MITOCHONDRIAL TRNA AMINOACYLATION | Genes involved in Mitochondrial tRNA aminoacylation |
| 0.4 | 18.1 | REACTOME SYNTHESIS OF PIPS AT THE PLASMA MEMBRANE | Genes involved in Synthesis of PIPs at the plasma membrane |
| 0.4 | 81.6 | REACTOME SIGNALING BY RHO GTPASES | Genes involved in Signaling by Rho GTPases |
| 0.3 | 7.5 | REACTOME GABA A RECEPTOR ACTIVATION | Genes involved in GABA A receptor activation |
| 0.3 | 1.6 | REACTOME TRANSCRIPTION COUPLED NER TC NER | Genes involved in Transcription-coupled NER (TC-NER) |
| 0.3 | 20.2 | REACTOME MHC CLASS II ANTIGEN PRESENTATION | Genes involved in MHC class II antigen presentation |
| 0.2 | 7.9 | REACTOME SIGNALING BY HIPPO | Genes involved in Signaling by Hippo |
| 0.2 | 13.1 | REACTOME CHEMOKINE RECEPTORS BIND CHEMOKINES | Genes involved in Chemokine receptors bind chemokines |
| 0.2 | 10.7 | REACTOME ACTIVATED NOTCH1 TRANSMITS SIGNAL TO THE NUCLEUS | Genes involved in Activated NOTCH1 Transmits Signal to the Nucleus |
| 0.2 | 13.4 | REACTOME ION TRANSPORT BY P TYPE ATPASES | Genes involved in Ion transport by P-type ATPases |
| 0.2 | 5.3 | REACTOME EFFECTS OF PIP2 HYDROLYSIS | Genes involved in Effects of PIP2 hydrolysis |
| 0.2 | 2.0 | REACTOME MRNA DECAY BY 3 TO 5 EXORIBONUCLEASE | Genes involved in mRNA Decay by 3' to 5' Exoribonuclease |
| 0.2 | 29.5 | REACTOME TRANSPORT OF INORGANIC CATIONS ANIONS AND AMINO ACIDS OLIGOPEPTIDES | Genes involved in Transport of inorganic cations/anions and amino acids/oligopeptides |
| 0.2 | 2.8 | REACTOME UNBLOCKING OF NMDA RECEPTOR GLUTAMATE BINDING AND ACTIVATION | Genes involved in Unblocking of NMDA receptor, glutamate binding and activation |
| 0.2 | 3.2 | REACTOME POST CHAPERONIN TUBULIN FOLDING PATHWAY | Genes involved in Post-chaperonin tubulin folding pathway |
| 0.2 | 1.7 | REACTOME SEMA3A PAK DEPENDENT AXON REPULSION | Genes involved in Sema3A PAK dependent Axon repulsion |
| 0.1 | 11.8 | REACTOME INTEGRIN CELL SURFACE INTERACTIONS | Genes involved in Integrin cell surface interactions |
| 0.1 | 1.3 | REACTOME CDC6 ASSOCIATION WITH THE ORC ORIGIN COMPLEX | Genes involved in CDC6 association with the ORC:origin complex |
| 0.1 | 1.9 | REACTOME CGMP EFFECTS | Genes involved in cGMP effects |
| 0.1 | 19.0 | REACTOME ANTIGEN PROCESSING UBIQUITINATION PROTEASOME DEGRADATION | Genes involved in Antigen processing: Ubiquitination & Proteasome degradation |
| 0.1 | 1.3 | REACTOME CHONDROITIN SULFATE BIOSYNTHESIS | Genes involved in Chondroitin sulfate biosynthesis |
| 0.0 | 1.3 | REACTOME DOWNREGULATION OF TGF BETA RECEPTOR SIGNALING | Genes involved in Downregulation of TGF-beta receptor signaling |
| 0.0 | 2.5 | REACTOME IRON UPTAKE AND TRANSPORT | Genes involved in Iron uptake and transport |
| 0.0 | 1.7 | REACTOME GLYCOLYSIS | Genes involved in Glycolysis |
| 0.0 | 1.9 | REACTOME ERK MAPK TARGETS | Genes involved in ERK/MAPK targets |
| 0.0 | 2.6 | REACTOME SIGNALING BY NOTCH1 | Genes involved in Signaling by NOTCH1 |
| 0.0 | 1.2 | REACTOME ASSOCIATION OF TRIC CCT WITH TARGET PROTEINS DURING BIOSYNTHESIS | Genes involved in Association of TriC/CCT with target proteins during biosynthesis |
| 0.0 | 0.8 | REACTOME NEGATIVE REGULATORS OF RIG I MDA5 SIGNALING | Genes involved in Negative regulators of RIG-I/MDA5 signaling |
| 0.0 | 0.7 | REACTOME BMAL1 CLOCK NPAS2 ACTIVATES CIRCADIAN EXPRESSION | Genes involved in BMAL1:CLOCK/NPAS2 Activates Circadian Expression |
| 0.0 | 0.5 | REACTOME POTASSIUM CHANNELS | Genes involved in Potassium Channels |