Project
PRJNA375882: Comprehensive Mouse Transcriptomic BodyMap
Navigation
Downloads
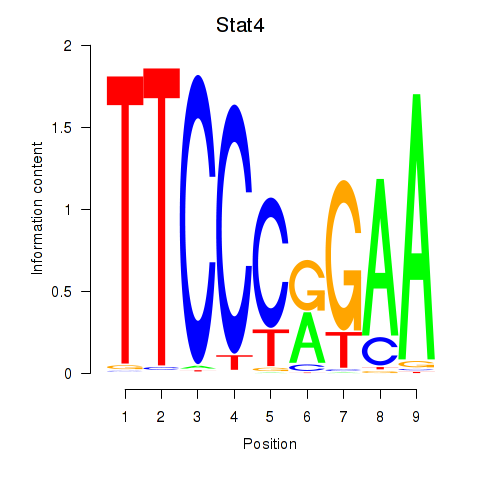
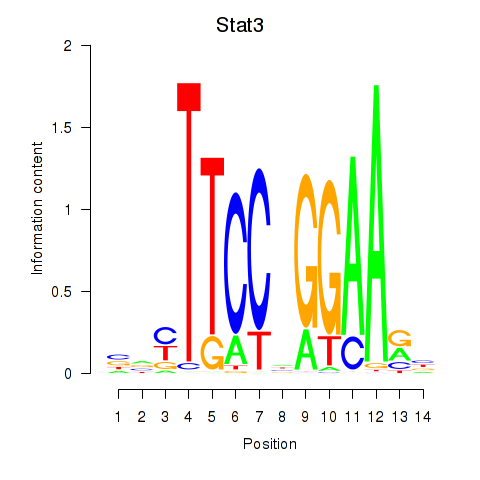
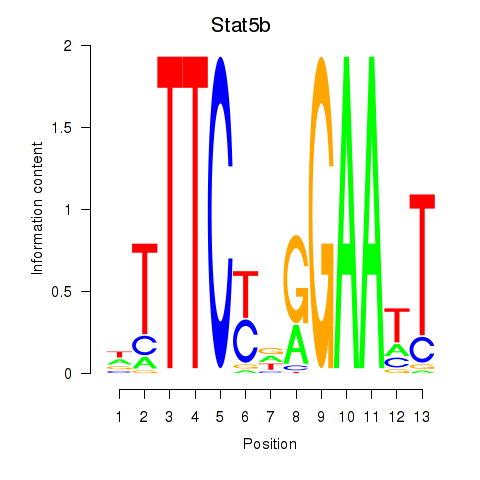
Results for Stat4_Stat3_Stat5b
Z-value: 1.50
Motif logo
Transcription factors associated with Stat4_Stat3_Stat5b
| Gene Symbol | Gene ID | Gene Info |
|---|---|---|
|
Stat4
|
ENSMUSG00000062939.12 | Stat4 |
|
Stat3
|
ENSMUSG00000004040.17 | Stat3 |
|
Stat5b
|
ENSMUSG00000020919.12 | Stat5b |
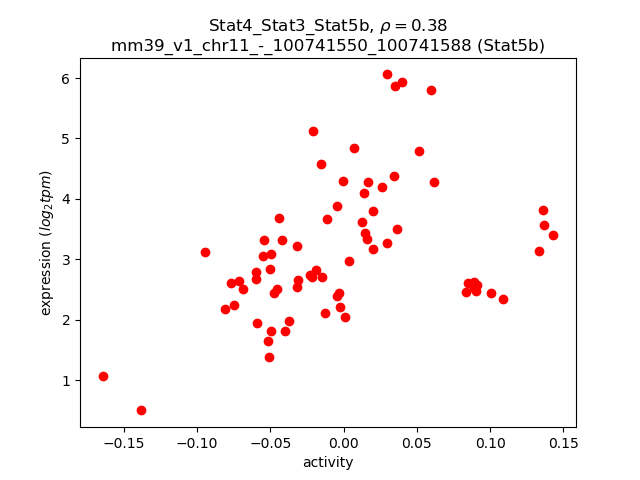
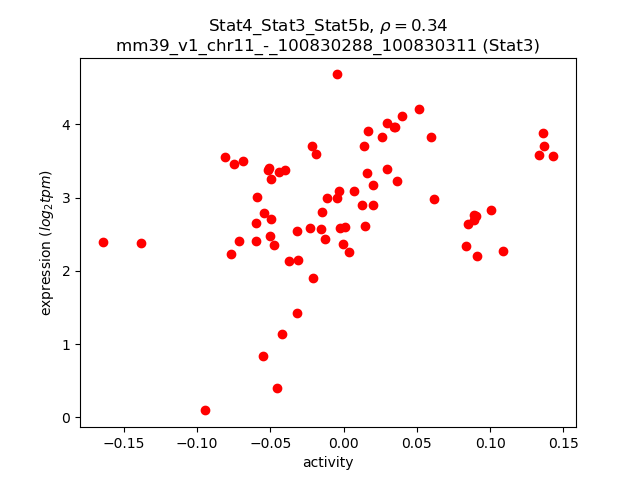
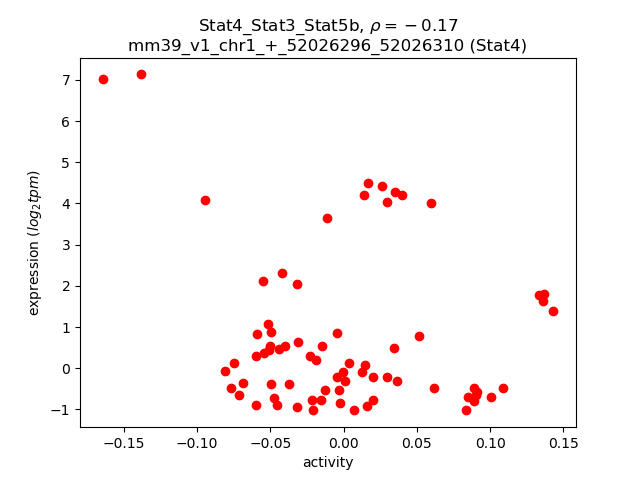
Activity-expression correlation:
| Gene | Promoter | Pearson corr. coef. | P-value | Plot |
|---|---|---|---|---|
| Stat5b | mm39_v1_chr11_-_100741550_100741588 | 0.38 | 8.6e-04 | Click! |
| Stat3 | mm39_v1_chr11_-_100830288_100830311 | 0.34 | 3.1e-03 | Click! |
| Stat4 | mm39_v1_chr1_+_52026296_52026310 | -0.17 | 1.5e-01 | Click! |
Activity profile of Stat4_Stat3_Stat5b motif
Sorted Z-values of Stat4_Stat3_Stat5b motif
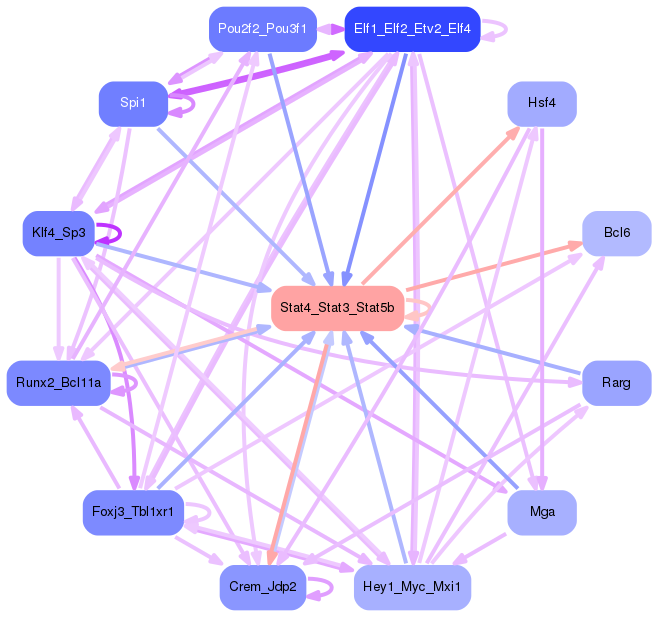
Network of associatons between targets according to the STRING database.

First level regulatory network of Stat4_Stat3_Stat5b
| Promoter | Score | Transcript | Gene | Gene Info |
|---|---|---|---|---|
| chr14_+_30608433 | 29.94 |
ENSMUST00000120269.11
ENSMUST00000078490.14 ENSMUST00000006703.15 |
Itih4
|
inter alpha-trypsin inhibitor, heavy chain 4 |
| chr14_+_30608478 | 25.21 |
ENSMUST00000168782.4
|
Itih4
|
inter alpha-trypsin inhibitor, heavy chain 4 |
| chr4_+_148686985 | 14.35 |
ENSMUST00000105701.9
ENSMUST00000052060.7 |
Masp2
|
mannan-binding lectin serine peptidase 2 |
| chr7_-_30643444 | 13.39 |
ENSMUST00000062620.9
|
Hamp
|
hepcidin antimicrobial peptide |
| chr9_+_20927271 | 12.46 |
ENSMUST00000086399.6
|
Icam1
|
intercellular adhesion molecule 1 |
| chr11_+_78389913 | 11.74 |
ENSMUST00000017488.5
|
Vtn
|
vitronectin |
| chr3_+_82915031 | 10.79 |
ENSMUST00000048486.13
ENSMUST00000194175.2 |
Fgg
|
fibrinogen gamma chain |
| chr10_-_95252712 | 9.01 |
ENSMUST00000020215.16
|
Socs2
|
suppressor of cytokine signaling 2 |
| chr9_+_107174081 | 8.89 |
ENSMUST00000167072.2
|
Cish
|
cytokine inducible SH2-containing protein |
| chr6_+_129374260 | 8.27 |
ENSMUST00000032262.14
|
Clec1b
|
C-type lectin domain family 1, member b |
| chr7_+_107166653 | 7.96 |
ENSMUST00000120990.2
|
Olfml1
|
olfactomedin-like 1 |
| chr10_-_95253042 | 7.69 |
ENSMUST00000135822.8
|
Socs2
|
suppressor of cytokine signaling 2 |
| chr1_-_172722589 | 7.61 |
ENSMUST00000027824.7
|
Apcs
|
serum amyloid P-component |
| chr3_+_20011201 | 7.57 |
ENSMUST00000091309.12
ENSMUST00000108329.8 ENSMUST00000003714.13 |
Cp
|
ceruloplasmin |
| chr11_+_69945157 | 7.46 |
ENSMUST00000108585.9
ENSMUST00000018699.13 |
Asgr1
|
asialoglycoprotein receptor 1 |
| chrX_+_59044796 | 7.40 |
ENSMUST00000033477.5
|
F9
|
coagulation factor IX |
| chr12_-_103956176 | 7.22 |
ENSMUST00000151709.3
ENSMUST00000176246.3 ENSMUST00000074693.13 ENSMUST00000120251.9 |
Serpina11
|
serine (or cysteine) peptidase inhibitor, clade A (alpha-1 antiproteinase, antitrypsin), member 11 |
| chr9_+_107173907 | 7.19 |
ENSMUST00000168260.2
|
Cish
|
cytokine inducible SH2-containing protein |
| chr11_-_117859997 | 7.15 |
ENSMUST00000054002.4
|
Socs3
|
suppressor of cytokine signaling 3 |
| chr3_+_20011251 | 7.03 |
ENSMUST00000108328.8
|
Cp
|
ceruloplasmin |
| chr17_-_56428968 | 6.73 |
ENSMUST00000041357.9
|
Lrg1
|
leucine-rich alpha-2-glycoprotein 1 |
| chr3_+_20011405 | 6.69 |
ENSMUST00000108325.9
|
Cp
|
ceruloplasmin |
| chr19_+_40078132 | 6.69 |
ENSMUST00000068094.13
ENSMUST00000080171.3 |
Cyp2c50
|
cytochrome P450, family 2, subfamily c, polypeptide 50 |
| chr16_+_91169671 | 6.32 |
ENSMUST00000023693.14
ENSMUST00000134491.9 ENSMUST00000117836.8 |
Ifnar2
|
interferon (alpha and beta) receptor 2 |
| chr6_+_129374441 | 6.20 |
ENSMUST00000112081.9
ENSMUST00000112079.3 |
Clec1b
|
C-type lectin domain family 1, member b |
| chr11_+_48977888 | 6.16 |
ENSMUST00000214804.2
|
Ifi47
|
interferon gamma inducible protein 47 |
| chr11_+_48977852 | 6.10 |
ENSMUST00000046704.7
ENSMUST00000203810.3 ENSMUST00000203149.3 |
Ifi47
Olfr56
|
interferon gamma inducible protein 47 olfactory receptor 56 |
| chr14_-_55950939 | 6.10 |
ENSMUST00000168729.8
ENSMUST00000228123.2 ENSMUST00000178034.9 |
Tgm1
|
transglutaminase 1, K polypeptide |
| chr2_-_84605764 | 6.09 |
ENSMUST00000111641.2
|
Serping1
|
serine (or cysteine) peptidase inhibitor, clade G, member 1 |
| chr5_+_8010445 | 6.01 |
ENSMUST00000115421.3
|
Steap4
|
STEAP family member 4 |
| chr7_+_107166925 | 5.98 |
ENSMUST00000239087.2
|
Olfml1
|
olfactomedin-like 1 |
| chr16_+_91169770 | 5.70 |
ENSMUST00000089042.7
|
Ifnar2
|
interferon (alpha and beta) receptor 2 |
| chr3_-_82957104 | 5.58 |
ENSMUST00000048246.5
|
Fgb
|
fibrinogen beta chain |
| chr4_-_129472328 | 5.44 |
ENSMUST00000052835.9
|
Fam167b
|
family with sequence similarity 167, member B |
| chr1_+_134109888 | 5.35 |
ENSMUST00000156873.8
|
Chil1
|
chitinase-like 1 |
| chr10_-_126906123 | 5.31 |
ENSMUST00000060991.6
|
Tspan31
|
tetraspanin 31 |
| chr1_+_134110142 | 5.10 |
ENSMUST00000082060.10
ENSMUST00000153856.8 ENSMUST00000133701.8 ENSMUST00000132873.8 |
Chil1
|
chitinase-like 1 |
| chr7_-_44785480 | 4.94 |
ENSMUST00000211246.2
ENSMUST00000210197.2 |
Flt3l
|
FMS-like tyrosine kinase 3 ligand |
| chr11_+_81926394 | 4.85 |
ENSMUST00000000193.6
|
Ccl2
|
chemokine (C-C motif) ligand 2 |
| chr12_-_103597663 | 4.77 |
ENSMUST00000121625.2
ENSMUST00000044231.12 |
Serpina10
|
serine (or cysteine) peptidase inhibitor, clade A (alpha-1 antiproteinase, antitrypsin), member 10 |
| chr5_+_137568982 | 4.75 |
ENSMUST00000196471.5
ENSMUST00000198783.5 |
Tfr2
|
transferrin receptor 2 |
| chr18_-_3281089 | 4.69 |
ENSMUST00000139537.2
ENSMUST00000124747.8 |
Crem
|
cAMP responsive element modulator |
| chr16_-_23807602 | 4.55 |
ENSMUST00000023151.6
|
Bcl6
|
B cell leukemia/lymphoma 6 |
| chr7_-_105249308 | 4.50 |
ENSMUST00000210531.2
ENSMUST00000033185.10 |
Hpx
|
hemopexin |
| chr9_-_22042930 | 4.40 |
ENSMUST00000213815.2
|
Acp5
|
acid phosphatase 5, tartrate resistant |
| chr7_+_141056305 | 4.24 |
ENSMUST00000117634.2
|
Tspan4
|
tetraspanin 4 |
| chr16_+_90535212 | 4.12 |
ENSMUST00000038197.3
|
Mrap
|
melanocortin 2 receptor accessory protein |
| chr11_+_120421496 | 4.08 |
ENSMUST00000026119.8
|
Gcgr
|
glucagon receptor |
| chr8_+_105996469 | 4.02 |
ENSMUST00000172525.8
ENSMUST00000174837.8 ENSMUST00000173859.2 |
Hsf4
|
heat shock transcription factor 4 |
| chr16_-_30086317 | 4.00 |
ENSMUST00000064856.9
|
Cpn2
|
carboxypeptidase N, polypeptide 2 |
| chr16_+_62674661 | 3.81 |
ENSMUST00000023629.9
|
Pros1
|
protein S (alpha) |
| chr7_+_127399789 | 3.74 |
ENSMUST00000125188.8
|
Hsd3b7
|
hydroxy-delta-5-steroid dehydrogenase, 3 beta- and steroid delta-isomerase 7 |
| chr7_-_30623592 | 3.66 |
ENSMUST00000217812.2
ENSMUST00000074671.9 |
Hamp2
|
hepcidin antimicrobial peptide 2 |
| chr6_+_138118565 | 3.66 |
ENSMUST00000118091.8
|
Mgst1
|
microsomal glutathione S-transferase 1 |
| chr7_+_127399776 | 3.65 |
ENSMUST00000046863.12
ENSMUST00000206674.2 ENSMUST00000106272.8 |
Hsd3b7
|
hydroxy-delta-5-steroid dehydrogenase, 3 beta- and steroid delta-isomerase 7 |
| chr18_+_32087883 | 3.64 |
ENSMUST00000223753.2
|
Lims2
|
LIM and senescent cell antigen like domains 2 |
| chr2_-_84605732 | 3.64 |
ENSMUST00000023994.10
|
Serping1
|
serine (or cysteine) peptidase inhibitor, clade G, member 1 |
| chr17_+_34816826 | 3.57 |
ENSMUST00000015596.10
ENSMUST00000174496.9 ENSMUST00000173992.8 |
Ager
|
advanced glycosylation end product-specific receptor |
| chr15_+_102011415 | 3.52 |
ENSMUST00000046144.10
|
Tns2
|
tensin 2 |
| chr3_-_27950491 | 3.52 |
ENSMUST00000058077.4
|
Tmem212
|
transmembrane protein 212 |
| chr7_-_44785815 | 3.50 |
ENSMUST00000146760.7
|
Flt3l
|
FMS-like tyrosine kinase 3 ligand |
| chr5_-_104125192 | 3.49 |
ENSMUST00000120320.8
|
Hsd17b13
|
hydroxysteroid (17-beta) dehydrogenase 13 |
| chr5_-_104125270 | 3.48 |
ENSMUST00000112803.3
|
Hsd17b13
|
hydroxysteroid (17-beta) dehydrogenase 13 |
| chr15_+_102011352 | 3.44 |
ENSMUST00000169627.9
|
Tns2
|
tensin 2 |
| chr16_-_35691914 | 3.43 |
ENSMUST00000042665.9
|
Parp14
|
poly (ADP-ribose) polymerase family, member 14 |
| chr10_-_127190280 | 3.33 |
ENSMUST00000059718.6
|
Inhbe
|
inhibin beta-E |
| chr15_-_97729341 | 3.32 |
ENSMUST00000079838.14
ENSMUST00000118294.8 |
Hdac7
|
histone deacetylase 7 |
| chr10_-_53951825 | 3.23 |
ENSMUST00000003843.16
|
Man1a
|
mannosidase 1, alpha |
| chr7_+_127400016 | 3.22 |
ENSMUST00000106271.2
ENSMUST00000138432.2 |
Hsd3b7
|
hydroxy-delta-5-steroid dehydrogenase, 3 beta- and steroid delta-isomerase 7 |
| chr17_-_79292856 | 3.16 |
ENSMUST00000118991.2
|
Prkd3
|
protein kinase D3 |
| chr15_-_60793115 | 3.16 |
ENSMUST00000096418.5
|
A1bg
|
alpha-1-B glycoprotein |
| chr6_+_129385816 | 3.13 |
ENSMUST00000058352.15
ENSMUST00000088075.8 |
Clec9a
|
C-type lectin domain family 9, member a |
| chr5_-_104125226 | 3.10 |
ENSMUST00000048118.15
|
Hsd17b13
|
hydroxysteroid (17-beta) dehydrogenase 13 |
| chr18_-_33596468 | 3.10 |
ENSMUST00000171533.9
|
Nrep
|
neuronal regeneration related protein |
| chr17_+_25097199 | 3.09 |
ENSMUST00000050714.8
|
Igfals
|
insulin-like growth factor binding protein, acid labile subunit |
| chr3_+_60380463 | 2.98 |
ENSMUST00000195077.6
ENSMUST00000193647.6 ENSMUST00000195001.2 ENSMUST00000192807.6 |
Mbnl1
|
muscleblind like splicing factor 1 |
| chr6_+_28475099 | 2.96 |
ENSMUST00000168362.2
|
Snd1
|
staphylococcal nuclease and tudor domain containing 1 |
| chr3_+_94600863 | 2.90 |
ENSMUST00000090848.10
ENSMUST00000173981.8 ENSMUST00000173849.8 ENSMUST00000174223.2 |
Selenbp2
|
selenium binding protein 2 |
| chr15_+_25933632 | 2.86 |
ENSMUST00000228327.2
|
Retreg1
|
reticulophagy regulator 1 |
| chr18_-_33596890 | 2.85 |
ENSMUST00000237066.2
|
Nrep
|
neuronal regeneration related protein |
| chr7_+_127399848 | 2.83 |
ENSMUST00000139068.8
|
Hsd3b7
|
hydroxy-delta-5-steroid dehydrogenase, 3 beta- and steroid delta-isomerase 7 |
| chr6_+_34575435 | 2.80 |
ENSMUST00000079391.10
ENSMUST00000142512.8 ENSMUST00000115027.8 ENSMUST00000115026.8 |
Cald1
|
caldesmon 1 |
| chr9_-_103107495 | 2.80 |
ENSMUST00000035158.16
|
Trf
|
transferrin |
| chr18_-_33596792 | 2.80 |
ENSMUST00000051087.16
|
Nrep
|
neuronal regeneration related protein |
| chr15_-_5093222 | 2.77 |
ENSMUST00000110689.5
|
C7
|
complement component 7 |
| chr17_-_34406193 | 2.75 |
ENSMUST00000173831.3
|
Psmb9
|
proteasome (prosome, macropain) subunit, beta type 9 (large multifunctional peptidase 2) |
| chr12_-_70278188 | 2.75 |
ENSMUST00000161083.2
|
Pygl
|
liver glycogen phosphorylase |
| chr5_+_90708962 | 2.74 |
ENSMUST00000094615.8
ENSMUST00000200765.2 |
Albfm1
|
albumin superfamily member 1 |
| chr17_+_43978377 | 2.74 |
ENSMUST00000233627.2
ENSMUST00000233437.2 |
Cyp39a1
|
cytochrome P450, family 39, subfamily a, polypeptide 1 |
| chr3_+_60380243 | 2.68 |
ENSMUST00000195724.6
|
Mbnl1
|
muscleblind like splicing factor 1 |
| chr19_-_9065309 | 2.67 |
ENSMUST00000025554.3
|
Scgb1a1
|
secretoglobin, family 1A, member 1 (uteroglobin) |
| chr17_-_32639936 | 2.65 |
ENSMUST00000170392.9
ENSMUST00000237165.2 ENSMUST00000235892.2 ENSMUST00000114455.3 |
Pglyrp2
|
peptidoglycan recognition protein 2 |
| chr1_-_155688635 | 2.65 |
ENSMUST00000035325.15
|
Qsox1
|
quiescin Q6 sulfhydryl oxidase 1 |
| chr10_-_59277570 | 2.65 |
ENSMUST00000009798.5
|
Oit3
|
oncoprotein induced transcript 3 |
| chr1_-_155688551 | 2.63 |
ENSMUST00000194632.2
ENSMUST00000111764.8 |
Qsox1
|
quiescin Q6 sulfhydryl oxidase 1 |
| chr10_-_53951796 | 2.58 |
ENSMUST00000105470.9
|
Man1a
|
mannosidase 1, alpha |
| chr3_-_107145968 | 2.56 |
ENSMUST00000197758.5
|
Prok1
|
prokineticin 1 |
| chr11_-_52165682 | 2.56 |
ENSMUST00000238914.2
|
Tcf7
|
transcription factor 7, T cell specific |
| chr17_+_43978280 | 2.47 |
ENSMUST00000170988.2
|
Cyp39a1
|
cytochrome P450, family 39, subfamily a, polypeptide 1 |
| chr4_+_32238950 | 2.47 |
ENSMUST00000037416.13
|
Bach2
|
BTB and CNC homology, basic leucine zipper transcription factor 2 |
| chr9_-_99599312 | 2.46 |
ENSMUST00000112882.9
ENSMUST00000131922.2 |
Cldn18
|
claudin 18 |
| chr14_-_45767232 | 2.44 |
ENSMUST00000149723.2
|
Fermt2
|
fermitin family member 2 |
| chrX_-_51702813 | 2.43 |
ENSMUST00000114857.2
|
Gpc3
|
glypican 3 |
| chr7_-_44785709 | 2.41 |
ENSMUST00000211429.2
|
Flt3l
|
FMS-like tyrosine kinase 3 ligand |
| chr11_+_4186391 | 2.35 |
ENSMUST00000075221.3
|
Osm
|
oncostatin M |
| chr6_-_129428869 | 2.31 |
ENSMUST00000203162.3
|
Clec1a
|
C-type lectin domain family 1, member a |
| chr10_+_67815508 | 2.27 |
ENSMUST00000117086.2
|
Rtkn2
|
rhotekin 2 |
| chr18_-_3280999 | 2.26 |
ENSMUST00000049942.13
|
Crem
|
cAMP responsive element modulator |
| chr11_-_83421333 | 2.25 |
ENSMUST00000035938.3
|
Ccl5
|
chemokine (C-C motif) ligand 5 |
| chr4_-_126096112 | 2.23 |
ENSMUST00000142125.2
ENSMUST00000106141.3 |
Thrap3
|
thyroid hormone receptor associated protein 3 |
| chr4_+_118285275 | 2.20 |
ENSMUST00000006557.13
ENSMUST00000167636.8 ENSMUST00000102673.11 |
Elovl1
|
elongation of very long chain fatty acids (FEN1/Elo2, SUR4/Elo3, yeast)-like 1 |
| chr7_-_25112256 | 2.16 |
ENSMUST00000200880.4
ENSMUST00000074040.4 |
Cxcl17
|
chemokine (C-X-C motif) ligand 17 |
| chr6_+_129385893 | 2.12 |
ENSMUST00000204860.3
ENSMUST00000164513.8 |
Clec9a
|
C-type lectin domain family 9, member a |
| chr6_+_121323577 | 2.11 |
ENSMUST00000032200.16
|
Slc6a12
|
solute carrier family 6 (neurotransmitter transporter, betaine/GABA), member 12 |
| chr11_-_59937302 | 2.08 |
ENSMUST00000000310.14
ENSMUST00000102693.9 ENSMUST00000148512.2 |
Pemt
|
phosphatidylethanolamine N-methyltransferase |
| chr1_+_40504830 | 2.08 |
ENSMUST00000193391.6
|
Il18r1
|
interleukin 18 receptor 1 |
| chr1_+_40505126 | 2.03 |
ENSMUST00000193793.6
|
Il18r1
|
interleukin 18 receptor 1 |
| chr17_-_35424281 | 2.03 |
ENSMUST00000025266.6
|
Lta
|
lymphotoxin A |
| chr7_-_101667346 | 2.02 |
ENSMUST00000209844.2
ENSMUST00000211502.2 ENSMUST00000094134.5 |
Il18bp
|
interleukin 18 binding protein |
| chrX_-_51702790 | 2.00 |
ENSMUST00000069360.14
|
Gpc3
|
glypican 3 |
| chr1_+_171594690 | 2.00 |
ENSMUST00000015460.5
|
Slamf1
|
signaling lymphocytic activation molecule family member 1 |
| chr9_+_74769166 | 2.00 |
ENSMUST00000056006.11
|
Onecut1
|
one cut domain, family member 1 |
| chr17_+_75772475 | 1.98 |
ENSMUST00000095204.6
|
Rasgrp3
|
RAS, guanyl releasing protein 3 |
| chr4_-_129534752 | 1.96 |
ENSMUST00000132217.8
ENSMUST00000130017.2 ENSMUST00000154105.8 |
Txlna
|
taxilin alpha |
| chr11_-_48762170 | 1.96 |
ENSMUST00000049519.4
ENSMUST00000097271.4 |
Irgm1
|
immunity-related GTPase family M member 1 |
| chr3_-_57202546 | 1.95 |
ENSMUST00000196506.2
|
Tm4sf1
|
transmembrane 4 superfamily member 1 |
| chr16_+_21613068 | 1.94 |
ENSMUST00000211443.2
ENSMUST00000231300.2 ENSMUST00000209449.2 ENSMUST00000181780.9 ENSMUST00000209728.2 ENSMUST00000181960.3 ENSMUST00000209429.2 ENSMUST00000180830.3 ENSMUST00000231988.2 |
1300002E11Rik
Map3k13
|
RIKEN cDNA 1300002E11 gene mitogen-activated protein kinase kinase kinase 13 |
| chr18_+_89195089 | 1.92 |
ENSMUST00000236644.2
ENSMUST00000236828.2 |
Cd226
|
CD226 antigen |
| chr14_-_55204092 | 1.91 |
ENSMUST00000081857.14
|
Myh6
|
myosin, heavy polypeptide 6, cardiac muscle, alpha |
| chr1_+_40504712 | 1.89 |
ENSMUST00000167723.8
|
Il18r1
|
interleukin 18 receptor 1 |
| chr4_-_126096376 | 1.89 |
ENSMUST00000106142.8
ENSMUST00000169403.8 ENSMUST00000130334.2 |
Thrap3
|
thyroid hormone receptor associated protein 3 |
| chr11_-_48884999 | 1.88 |
ENSMUST00000146439.8
|
Tgtp1
|
T cell specific GTPase 1 |
| chr9_-_107556823 | 1.88 |
ENSMUST00000010205.9
|
Gnat1
|
guanine nucleotide binding protein, alpha transducing 1 |
| chrX_-_72974357 | 1.87 |
ENSMUST00000155597.2
ENSMUST00000114379.8 |
Renbp
|
renin binding protein |
| chr3_-_57202301 | 1.87 |
ENSMUST00000171384.8
|
Tm4sf1
|
transmembrane 4 superfamily member 1 |
| chr7_-_81356653 | 1.85 |
ENSMUST00000026922.15
|
Homer2
|
homer scaffolding protein 2 |
| chr2_+_164245114 | 1.84 |
ENSMUST00000017151.2
|
Rbpjl
|
recombination signal binding protein for immunoglobulin kappa J region-like |
| chr9_+_59614877 | 1.77 |
ENSMUST00000128944.8
ENSMUST00000098661.10 |
Gramd2
|
GRAM domain containing 2 |
| chr7_+_43086432 | 1.76 |
ENSMUST00000070518.4
|
Nkg7
|
natural killer cell group 7 sequence |
| chr1_+_171041583 | 1.76 |
ENSMUST00000111328.8
|
Nr1i3
|
nuclear receptor subfamily 1, group I, member 3 |
| chr15_+_79231720 | 1.75 |
ENSMUST00000096350.11
|
Maff
|
v-maf musculoaponeurotic fibrosarcoma oncogene family, protein F (avian) |
| chr1_+_40505136 | 1.75 |
ENSMUST00000087983.8
ENSMUST00000195684.6 ENSMUST00000108044.4 |
Il18r1
|
interleukin 18 receptor 1 |
| chr4_+_114916703 | 1.73 |
ENSMUST00000162489.2
|
Tal1
|
T cell acute lymphocytic leukemia 1 |
| chrX_-_72974440 | 1.72 |
ENSMUST00000116578.8
|
Renbp
|
renin binding protein |
| chr15_+_100202642 | 1.70 |
ENSMUST00000067752.5
ENSMUST00000229588.2 |
Mettl7a1
|
methyltransferase like 7A1 |
| chr5_+_35198853 | 1.69 |
ENSMUST00000030985.10
ENSMUST00000202573.2 |
Hgfac
|
hepatocyte growth factor activator |
| chr15_-_93417380 | 1.69 |
ENSMUST00000109255.3
|
Prickle1
|
prickle planar cell polarity protein 1 |
| chr1_-_170803680 | 1.67 |
ENSMUST00000027966.14
ENSMUST00000081103.12 ENSMUST00000159688.2 |
Fcgr2b
|
Fc receptor, IgG, low affinity IIb |
| chr14_-_55204054 | 1.66 |
ENSMUST00000226297.2
|
Myh6
|
myosin, heavy polypeptide 6, cardiac muscle, alpha |
| chr7_+_29607917 | 1.64 |
ENSMUST00000186475.2
|
Zfp383
|
zinc finger protein 383 |
| chr3_+_142202642 | 1.64 |
ENSMUST00000090127.7
|
Gbp5
|
guanylate binding protein 5 |
| chr7_-_81356557 | 1.63 |
ENSMUST00000207983.2
|
Homer2
|
homer scaffolding protein 2 |
| chr17_+_28910393 | 1.62 |
ENSMUST00000124886.9
ENSMUST00000114758.9 |
Mapk14
|
mitogen-activated protein kinase 14 |
| chr14_-_55204383 | 1.61 |
ENSMUST00000111456.2
|
Myh6
|
myosin, heavy polypeptide 6, cardiac muscle, alpha |
| chr19_+_46611826 | 1.60 |
ENSMUST00000111855.5
|
Wbp1l
|
WW domain binding protein 1 like |
| chrX_-_94070277 | 1.57 |
ENSMUST00000096367.5
|
Spin4
|
spindlin family, member 4 |
| chr1_+_171041539 | 1.56 |
ENSMUST00000005820.11
ENSMUST00000075469.12 ENSMUST00000155126.8 |
Nr1i3
|
nuclear receptor subfamily 1, group I, member 3 |
| chr7_+_29794575 | 1.56 |
ENSMUST00000130526.2
ENSMUST00000108200.2 |
Zfp260
|
zinc finger protein 260 |
| chr9_-_71070506 | 1.56 |
ENSMUST00000074465.9
|
Aqp9
|
aquaporin 9 |
| chr17_+_34364206 | 1.55 |
ENSMUST00000041982.9
ENSMUST00000171231.8 |
H2-DMb2
|
histocompatibility 2, class II, locus Mb2 |
| chr17_+_34406523 | 1.55 |
ENSMUST00000170086.8
|
Tap1
|
transporter 1, ATP-binding cassette, sub-family B (MDR/TAP) |
| chr13_+_112600604 | 1.54 |
ENSMUST00000183663.8
ENSMUST00000184311.8 ENSMUST00000183886.8 |
Il6st
|
interleukin 6 signal transducer |
| chr15_+_78209920 | 1.53 |
ENSMUST00000230264.3
|
Csf2rb
|
colony stimulating factor 2 receptor, beta, low-affinity (granulocyte-macrophage) |
| chr13_+_34186346 | 1.53 |
ENSMUST00000021844.15
|
Ripk1
|
receptor (TNFRSF)-interacting serine-threonine kinase 1 |
| chr1_+_173501215 | 1.52 |
ENSMUST00000085876.12
|
Ifi208
|
interferon activated gene 208 |
| chr16_-_56984137 | 1.52 |
ENSMUST00000231733.2
|
Nit2
|
nitrilase family, member 2 |
| chr6_-_48817675 | 1.52 |
ENSMUST00000203265.3
ENSMUST00000205159.3 |
Tmem176b
|
transmembrane protein 176B |
| chr3_-_95646856 | 1.51 |
ENSMUST00000153026.8
ENSMUST00000123143.8 ENSMUST00000137912.8 ENSMUST00000029753.14 ENSMUST00000131376.8 ENSMUST00000117507.10 ENSMUST00000128885.8 ENSMUST00000147217.2 |
Ecm1
|
extracellular matrix protein 1 |
| chr15_+_88960327 | 1.51 |
ENSMUST00000165690.2
|
Trabd
|
TraB domain containing |
| chr9_+_119168714 | 1.50 |
ENSMUST00000176351.8
|
Acaa1a
|
acetyl-Coenzyme A acyltransferase 1A |
| chr15_-_77129706 | 1.50 |
ENSMUST00000228361.2
|
Rbfox2
|
RNA binding protein, fox-1 homolog (C. elegans) 2 |
| chr11_+_70861007 | 1.50 |
ENSMUST00000018593.10
|
Rpain
|
RPA interacting protein |
| chr11_+_53660834 | 1.50 |
ENSMUST00000108920.10
ENSMUST00000140866.9 ENSMUST00000108922.9 |
Irf1
|
interferon regulatory factor 1 |
| chr2_+_27567246 | 1.48 |
ENSMUST00000166775.8
|
Rxra
|
retinoid X receptor alpha |
| chr15_-_77129786 | 1.47 |
ENSMUST00000228558.2
|
Rbfox2
|
RNA binding protein, fox-1 homolog (C. elegans) 2 |
| chr8_+_105652867 | 1.47 |
ENSMUST00000034355.11
ENSMUST00000109410.4 |
Ces2e
|
carboxylesterase 2E |
| chr9_+_38629560 | 1.47 |
ENSMUST00000001544.12
ENSMUST00000118144.8 |
Vwa5a
|
von Willebrand factor A domain containing 5A |
| chr11_-_69786324 | 1.46 |
ENSMUST00000001631.7
|
Acap1
|
ArfGAP with coiled-coil, ankyrin repeat and PH domains 1 |
| chr18_-_33597060 | 1.46 |
ENSMUST00000168890.2
|
Nrep
|
neuronal regeneration related protein |
| chr11_+_70861292 | 1.45 |
ENSMUST00000178822.8
ENSMUST00000108529.10 ENSMUST00000169965.8 ENSMUST00000167509.2 |
Rpain
|
RPA interacting protein |
| chr12_-_112824506 | 1.44 |
ENSMUST00000021729.9
|
Gpr132
|
G protein-coupled receptor 132 |
| chr8_+_36054919 | 1.43 |
ENSMUST00000037666.6
|
Mfhas1
|
malignant fibrous histiocytoma amplified sequence 1 |
| chr1_+_159871943 | 1.42 |
ENSMUST00000163892.8
|
4930523C07Rik
|
RIKEN cDNA 4930523C07 gene |
| chr18_-_60860594 | 1.42 |
ENSMUST00000235795.2
|
Ndst1
|
N-deacetylase/N-sulfotransferase (heparan glucosaminyl) 1 |
| chr15_+_78210242 | 1.41 |
ENSMUST00000229678.2
ENSMUST00000231888.2 |
Csf2rb
|
colony stimulating factor 2 receptor, beta, low-affinity (granulocyte-macrophage) |
| chr14_+_61844899 | 1.41 |
ENSMUST00000225582.2
ENSMUST00000051184.10 |
Kcnrg
|
potassium channel regulator |
| chr1_-_170804116 | 1.40 |
ENSMUST00000159969.8
|
Fcgr2b
|
Fc receptor, IgG, low affinity IIb |
| chr3_-_106454898 | 1.40 |
ENSMUST00000121231.8
ENSMUST00000141525.2 |
Cept1
|
choline/ethanolaminephosphotransferase 1 |
| chr8_+_47192911 | 1.40 |
ENSMUST00000208433.2
|
Irf2
|
interferon regulatory factor 2 |
| chr15_-_89263448 | 1.39 |
ENSMUST00000049968.9
|
Odf3b
|
outer dense fiber of sperm tails 3B |
| chr10_-_119948890 | 1.38 |
ENSMUST00000020449.12
|
Helb
|
helicase (DNA) B |
| chr11_+_100751272 | 1.37 |
ENSMUST00000107357.4
|
Stat5a
|
signal transducer and activator of transcription 5A |
| chr15_+_10224052 | 1.37 |
ENSMUST00000128450.8
ENSMUST00000148257.8 ENSMUST00000128921.8 |
Prlr
|
prolactin receptor |
| chr9_-_75466885 | 1.37 |
ENSMUST00000072232.9
|
Tmod3
|
tropomodulin 3 |
| chr2_-_104324035 | 1.36 |
ENSMUST00000111124.8
|
Hipk3
|
homeodomain interacting protein kinase 3 |
| chr9_-_44437694 | 1.31 |
ENSMUST00000062215.8
|
Cxcr5
|
chemokine (C-X-C motif) receptor 5 |
| chr10_+_59239466 | 1.31 |
ENSMUST00000009790.14
|
Pla2g12b
|
phospholipase A2, group XIIB |
| chr6_+_40868154 | 1.31 |
ENSMUST00000103262.3
|
Trbv1
|
T cell receptor beta, variable 1 |
| chr15_+_78210190 | 1.31 |
ENSMUST00000229034.2
ENSMUST00000096355.4 |
Csf2rb
|
colony stimulating factor 2 receptor, beta, low-affinity (granulocyte-macrophage) |
| chr9_-_44920899 | 1.31 |
ENSMUST00000102832.3
|
Cd3e
|
CD3 antigen, epsilon polypeptide |
Gene Ontology Analysis
Gene overrepresentation in biological process category:
| Log-likelihood per target | Total log-likelihood | Term | Description |
|---|---|---|---|
| 4.3 | 17.1 | GO:0034760 | negative regulation of iron ion transport(GO:0034757) negative regulation of iron ion transmembrane transport(GO:0034760) |
| 3.2 | 9.7 | GO:0001868 | regulation of complement activation, lectin pathway(GO:0001868) negative regulation of complement activation, lectin pathway(GO:0001869) |
| 2.5 | 7.6 | GO:0052203 | modulation by symbiont of host molecular function(GO:0052055) modulation of catalytic activity in other organism involved in symbiotic interaction(GO:0052203) modulation by host of symbiont catalytic activity(GO:0052422) |
| 2.2 | 10.8 | GO:0090290 | positive regulation of osteoclast proliferation(GO:0090290) |
| 2.1 | 12.5 | GO:0046813 | receptor-mediated virion attachment to host cell(GO:0046813) |
| 2.0 | 6.0 | GO:2001200 | positive regulation of dendritic cell differentiation(GO:2001200) |
| 1.7 | 5.2 | GO:0030573 | bile acid catabolic process(GO:0030573) |
| 1.6 | 4.9 | GO:0090264 | immune complex clearance by monocytes and macrophages(GO:0002436) monocyte homeostasis(GO:0035702) regulation of immune complex clearance by monocytes and macrophages(GO:0090264) positive regulation of immune complex clearance by monocytes and macrophages(GO:0090265) |
| 1.6 | 6.2 | GO:0007522 | visceral muscle development(GO:0007522) |
| 1.5 | 3.1 | GO:0002434 | immune complex clearance(GO:0002434) |
| 1.4 | 14.4 | GO:0001867 | complement activation, lectin pathway(GO:0001867) |
| 1.4 | 5.6 | GO:0043152 | induction of bacterial agglutination(GO:0043152) |
| 1.3 | 13.4 | GO:0035754 | B cell chemotaxis(GO:0035754) |
| 1.2 | 56.2 | GO:0030212 | hyaluronan metabolic process(GO:0030212) |
| 1.2 | 7.2 | GO:0060708 | spongiotrophoblast differentiation(GO:0060708) |
| 1.1 | 4.6 | GO:0043380 | regulation of memory T cell differentiation(GO:0043380) |
| 1.0 | 12.2 | GO:0072378 | blood coagulation, fibrin clot formation(GO:0072378) |
| 1.0 | 7.1 | GO:0060332 | positive regulation of response to interferon-gamma(GO:0060332) positive regulation of interferon-gamma-mediated signaling pathway(GO:0060335) |
| 0.9 | 3.7 | GO:0071449 | cellular response to lipid hydroperoxide(GO:0071449) |
| 0.9 | 2.7 | GO:0046967 | cytosol to ER transport(GO:0046967) |
| 0.9 | 11.7 | GO:0061302 | smooth muscle cell-matrix adhesion(GO:0061302) liver regeneration(GO:0097421) |
| 0.9 | 4.4 | GO:0072138 | mesenchymal cell proliferation involved in ureteric bud development(GO:0072138) |
| 0.9 | 3.4 | GO:0070212 | protein poly-ADP-ribosylation(GO:0070212) |
| 0.8 | 28.0 | GO:0006825 | copper ion transport(GO:0006825) |
| 0.8 | 8.4 | GO:0035655 | interleukin-18-mediated signaling pathway(GO:0035655) |
| 0.7 | 2.2 | GO:2000503 | CD8-positive, alpha-beta T cell extravasation(GO:0035697) positive regulation of natural killer cell chemotaxis(GO:2000503) |
| 0.7 | 0.7 | GO:0021762 | substantia nigra development(GO:0021762) |
| 0.7 | 2.8 | GO:0045590 | CD8-positive, alpha-beta T cell proliferation(GO:0035740) negative regulation of regulatory T cell differentiation(GO:0045590) regulation of CD8-positive, alpha-beta T cell proliferation(GO:2000564) |
| 0.7 | 2.7 | GO:0006015 | 5-phosphoribose 1-diphosphate biosynthetic process(GO:0006015) 5-phosphoribose 1-diphosphate metabolic process(GO:0046391) |
| 0.7 | 7.5 | GO:0097460 | ferrous iron import(GO:0070627) ferrous iron import into cell(GO:0097460) ferrous iron import across plasma membrane(GO:0098707) |
| 0.7 | 2.0 | GO:0002874 | regulation of chronic inflammatory response to antigenic stimulus(GO:0002874) |
| 0.7 | 2.7 | GO:0032696 | negative regulation of interleukin-13 production(GO:0032696) |
| 0.7 | 2.0 | GO:0002277 | myeloid dendritic cell activation involved in immune response(GO:0002277) T-helper 1 cell cytokine production(GO:0035744) |
| 0.7 | 2.6 | GO:0006447 | regulation of translational initiation by iron(GO:0006447) positive regulation of translational initiation by iron(GO:0045994) |
| 0.6 | 3.2 | GO:0089700 | protein kinase D signaling(GO:0089700) |
| 0.6 | 3.6 | GO:1902847 | regulation of neuronal signal transduction(GO:1902847) positive regulation of neurofibrillary tangle assembly(GO:1902998) |
| 0.6 | 7.1 | GO:2001199 | negative regulation of dendritic cell differentiation(GO:2001199) |
| 0.6 | 20.0 | GO:0060749 | mammary gland alveolus development(GO:0060749) mammary gland lobule development(GO:0061377) |
| 0.6 | 1.7 | GO:0060217 | hemangioblast cell differentiation(GO:0060217) |
| 0.6 | 2.3 | GO:0034552 | respiratory chain complex II assembly(GO:0034552) mitochondrial respiratory chain complex II assembly(GO:0034553) mitochondrial respiratory chain complex II biogenesis(GO:0097032) |
| 0.6 | 1.7 | GO:0051892 | negative regulation of cardioblast differentiation(GO:0051892) |
| 0.6 | 6.7 | GO:0043651 | linoleic acid metabolic process(GO:0043651) |
| 0.6 | 3.9 | GO:0038165 | oncostatin-M-mediated signaling pathway(GO:0038165) |
| 0.5 | 4.4 | GO:0032929 | negative regulation of superoxide anion generation(GO:0032929) |
| 0.5 | 1.6 | GO:0006429 | leucyl-tRNA aminoacylation(GO:0006429) |
| 0.5 | 15.1 | GO:0035455 | response to interferon-alpha(GO:0035455) |
| 0.5 | 5.8 | GO:0010838 | positive regulation of keratinocyte proliferation(GO:0010838) |
| 0.5 | 3.6 | GO:0019262 | N-acetylneuraminate catabolic process(GO:0019262) |
| 0.5 | 1.5 | GO:0032242 | regulation of nucleoside transport(GO:0032242) |
| 0.5 | 3.9 | GO:0033762 | response to glucagon(GO:0033762) |
| 0.5 | 11.1 | GO:0007250 | activation of NF-kappaB-inducing kinase activity(GO:0007250) |
| 0.5 | 2.8 | GO:0032827 | negative regulation of natural killer cell differentiation(GO:0032824) negative regulation of natural killer cell differentiation involved in immune response(GO:0032827) |
| 0.4 | 2.5 | GO:0071847 | TNFSF11-mediated signaling pathway(GO:0071847) |
| 0.4 | 0.4 | GO:0038163 | thrombopoietin-mediated signaling pathway(GO:0038163) |
| 0.4 | 1.6 | GO:0015855 | nucleobase transport(GO:0015851) pyrimidine nucleobase transport(GO:0015855) |
| 0.4 | 1.5 | GO:0022007 | neural plate elongation(GO:0014022) convergent extension involved in neural plate elongation(GO:0022007) |
| 0.4 | 1.1 | GO:0007509 | mesoderm migration involved in gastrulation(GO:0007509) |
| 0.4 | 0.7 | GO:0061209 | cell proliferation involved in mesonephros development(GO:0061209) |
| 0.4 | 3.0 | GO:2001184 | positive regulation of interleukin-12 secretion(GO:2001184) |
| 0.4 | 15.0 | GO:0007205 | protein kinase C-activating G-protein coupled receptor signaling pathway(GO:0007205) |
| 0.4 | 1.1 | GO:2000321 | positive regulation of T-helper 17 cell differentiation(GO:2000321) |
| 0.4 | 2.1 | GO:0009992 | cellular water homeostasis(GO:0009992) |
| 0.3 | 1.4 | GO:0060376 | positive regulation of mast cell differentiation(GO:0060376) |
| 0.3 | 7.1 | GO:0014850 | response to muscle activity(GO:0014850) |
| 0.3 | 2.0 | GO:0097473 | cellular response to light intensity(GO:0071484) cellular response to high light intensity(GO:0071486) retinal rod cell apoptotic process(GO:0097473) |
| 0.3 | 3.6 | GO:2000346 | negative regulation of hepatocyte proliferation(GO:2000346) |
| 0.3 | 3.0 | GO:0010724 | regulation of definitive erythrocyte differentiation(GO:0010724) |
| 0.3 | 2.3 | GO:0050747 | positive regulation of lipoprotein metabolic process(GO:0050747) |
| 0.3 | 1.9 | GO:0002729 | positive regulation of natural killer cell cytokine production(GO:0002729) positive regulation of Fc receptor mediated stimulatory signaling pathway(GO:0060369) |
| 0.3 | 2.6 | GO:0033153 | somatic diversification of T cell receptor genes(GO:0002568) somatic recombination of T cell receptor gene segments(GO:0002681) T cell receptor V(D)J recombination(GO:0033153) |
| 0.3 | 2.9 | GO:0061709 | reticulophagy(GO:0061709) |
| 0.3 | 1.9 | GO:0050917 | sensory perception of umami taste(GO:0050917) regulation of cyclic-nucleotide phosphodiesterase activity(GO:0051342) |
| 0.3 | 3.3 | GO:0090050 | positive regulation of cell migration involved in sprouting angiogenesis(GO:0090050) |
| 0.3 | 13.9 | GO:0036344 | platelet morphogenesis(GO:0036344) |
| 0.3 | 2.1 | GO:0015862 | uridine transport(GO:0015862) |
| 0.3 | 0.8 | GO:0002305 | gamma-delta intraepithelial T cell differentiation(GO:0002304) CD8-positive, gamma-delta intraepithelial T cell differentiation(GO:0002305) |
| 0.3 | 1.7 | GO:0032483 | regulation of Rab protein signal transduction(GO:0032483) |
| 0.3 | 0.8 | GO:0001788 | antibody-dependent cellular cytotoxicity(GO:0001788) |
| 0.3 | 0.8 | GO:0010925 | regulation of inositol-polyphosphate 5-phosphatase activity(GO:0010924) positive regulation of inositol-polyphosphate 5-phosphatase activity(GO:0010925) phospholipase C-inhibiting G-protein coupled receptor signaling pathway(GO:0030845) regulation of cell diameter(GO:0060305) |
| 0.3 | 0.8 | GO:0000349 | generation of catalytic spliceosome for first transesterification step(GO:0000349) |
| 0.3 | 1.9 | GO:0061084 | queuosine biosynthetic process(GO:0008616) queuosine metabolic process(GO:0046116) negative regulation of protein refolding(GO:0061084) |
| 0.3 | 1.1 | GO:2000383 | regulation of ectoderm development(GO:2000383) negative regulation of ectoderm development(GO:2000384) |
| 0.3 | 1.6 | GO:0099527 | postsynapse to nucleus signaling pathway(GO:0099527) |
| 0.3 | 0.8 | GO:0021660 | rhombomere formation(GO:0021594) rhombomere 3 formation(GO:0021660) rhombomere 5 morphogenesis(GO:0021664) rhombomere 5 formation(GO:0021666) |
| 0.3 | 0.8 | GO:0046544 | development of secondary male sexual characteristics(GO:0046544) |
| 0.3 | 0.8 | GO:2000591 | cell migration involved in vasculogenesis(GO:0035441) positive regulation of metanephric mesenchymal cell migration by platelet-derived growth factor receptor-beta signaling pathway(GO:0035793) regulation of metanephric mesenchymal cell migration by platelet-derived growth factor receptor-beta signaling pathway(GO:1900238) positive regulation of metanephric mesenchymal cell migration(GO:2000591) |
| 0.3 | 12.3 | GO:0035458 | cellular response to interferon-beta(GO:0035458) |
| 0.2 | 0.7 | GO:0060825 | fibroblast growth factor receptor signaling pathway involved in neural plate anterior/posterior pattern formation(GO:0060825) regulation of fibroblast growth factor receptor signaling pathway involved in neural plate anterior/posterior pattern formation(GO:2000313) |
| 0.2 | 3.8 | GO:0042730 | fibrinolysis(GO:0042730) |
| 0.2 | 0.9 | GO:1900133 | AV node cell to bundle of His cell communication by electrical coupling(GO:0086053) regulation of renin secretion into blood stream(GO:1900133) |
| 0.2 | 1.6 | GO:0032621 | interleukin-18 production(GO:0032621) |
| 0.2 | 1.4 | GO:0032747 | positive regulation of interleukin-23 production(GO:0032747) |
| 0.2 | 6.9 | GO:0006491 | N-glycan processing(GO:0006491) |
| 0.2 | 0.7 | GO:0090285 | negative regulation of protein glycosylation in Golgi(GO:0090285) |
| 0.2 | 0.8 | GO:1903487 | regulation of lactation(GO:1903487) |
| 0.2 | 0.8 | GO:0017126 | nucleologenesis(GO:0017126) |
| 0.2 | 1.0 | GO:0042631 | cellular response to water deprivation(GO:0042631) |
| 0.2 | 1.0 | GO:2000860 | positive regulation of mineralocorticoid secretion(GO:2000857) positive regulation of aldosterone secretion(GO:2000860) |
| 0.2 | 1.2 | GO:2001180 | negative regulation of interleukin-10 secretion(GO:2001180) |
| 0.2 | 3.5 | GO:0048875 | chemical homeostasis within a tissue(GO:0048875) |
| 0.2 | 0.6 | GO:0060464 | lung lobe formation(GO:0060464) diaphragm morphogenesis(GO:0060540) cardiac muscle tissue regeneration(GO:0061026) |
| 0.2 | 2.5 | GO:0051694 | pointed-end actin filament capping(GO:0051694) |
| 0.2 | 0.7 | GO:1903976 | negative regulation of glial cell migration(GO:1903976) |
| 0.2 | 2.2 | GO:0034625 | fatty acid elongation, saturated fatty acid(GO:0019367) fatty acid elongation, unsaturated fatty acid(GO:0019368) fatty acid elongation, monounsaturated fatty acid(GO:0034625) fatty acid elongation, polyunsaturated fatty acid(GO:0034626) |
| 0.2 | 0.7 | GO:0006269 | DNA replication, synthesis of RNA primer(GO:0006269) |
| 0.2 | 1.1 | GO:1901842 | negative regulation of high voltage-gated calcium channel activity(GO:1901842) |
| 0.2 | 1.5 | GO:0006528 | asparagine metabolic process(GO:0006528) |
| 0.2 | 4.0 | GO:0033169 | histone H3-K9 demethylation(GO:0033169) |
| 0.2 | 0.6 | GO:0071596 | ubiquitin-dependent protein catabolic process via the N-end rule pathway(GO:0071596) |
| 0.2 | 0.8 | GO:0045917 | positive regulation of complement activation(GO:0045917) positive regulation of protein activation cascade(GO:2000259) |
| 0.2 | 0.5 | GO:1901165 | positive regulation of trophoblast cell migration(GO:1901165) |
| 0.2 | 1.4 | GO:0015014 | heparan sulfate proteoglycan biosynthetic process, polysaccharide chain biosynthetic process(GO:0015014) |
| 0.2 | 1.3 | GO:0097646 | calcitonin family receptor signaling pathway(GO:0097646) amylin receptor signaling pathway(GO:0097647) |
| 0.2 | 6.7 | GO:1903846 | positive regulation of transforming growth factor beta receptor signaling pathway(GO:0030511) positive regulation of cellular response to transforming growth factor beta stimulus(GO:1903846) |
| 0.2 | 11.3 | GO:0000381 | regulation of alternative mRNA splicing, via spliceosome(GO:0000381) |
| 0.2 | 0.8 | GO:0008626 | granzyme-mediated apoptotic signaling pathway(GO:0008626) |
| 0.1 | 1.0 | GO:0018171 | peptidyl-cysteine oxidation(GO:0018171) |
| 0.1 | 1.8 | GO:0055059 | asymmetric neuroblast division(GO:0055059) |
| 0.1 | 1.3 | GO:0034134 | toll-like receptor 2 signaling pathway(GO:0034134) |
| 0.1 | 0.9 | GO:0034638 | phosphatidylcholine catabolic process(GO:0034638) |
| 0.1 | 0.4 | GO:0031591 | wybutosine metabolic process(GO:0031590) wybutosine biosynthetic process(GO:0031591) |
| 0.1 | 0.6 | GO:0010510 | regulation of acetyl-CoA biosynthetic process from pyruvate(GO:0010510) |
| 0.1 | 0.7 | GO:0051562 | negative regulation of mitochondrial calcium ion concentration(GO:0051562) |
| 0.1 | 0.1 | GO:0071725 | response to triacyl bacterial lipopeptide(GO:0071725) cellular response to triacyl bacterial lipopeptide(GO:0071727) |
| 0.1 | 1.1 | GO:0006685 | sphingomyelin catabolic process(GO:0006685) termination of signal transduction(GO:0023021) |
| 0.1 | 0.1 | GO:1904017 | response to Thyroglobulin triiodothyronine(GO:1904016) cellular response to Thyroglobulin triiodothyronine(GO:1904017) |
| 0.1 | 0.4 | GO:1990859 | cellular response to endothelin(GO:1990859) |
| 0.1 | 0.3 | GO:0045657 | positive regulation of monocyte differentiation(GO:0045657) |
| 0.1 | 0.7 | GO:0032918 | polyamine acetylation(GO:0032917) spermidine acetylation(GO:0032918) |
| 0.1 | 0.8 | GO:0002528 | regulation of vascular permeability involved in acute inflammatory response(GO:0002528) |
| 0.1 | 1.3 | GO:0002913 | positive regulation of T cell anergy(GO:0002669) positive regulation of lymphocyte anergy(GO:0002913) |
| 0.1 | 0.3 | GO:1901857 | positive regulation of cellular respiration(GO:1901857) |
| 0.1 | 1.0 | GO:0031848 | protection from non-homologous end joining at telomere(GO:0031848) |
| 0.1 | 2.8 | GO:0006883 | cellular sodium ion homeostasis(GO:0006883) |
| 0.1 | 0.4 | GO:1904766 | negative regulation of macroautophagy by TORC1 signaling(GO:1904766) |
| 0.1 | 0.4 | GO:0032079 | positive regulation of endodeoxyribonuclease activity(GO:0032079) |
| 0.1 | 0.7 | GO:0030951 | establishment or maintenance of microtubule cytoskeleton polarity(GO:0030951) |
| 0.1 | 0.5 | GO:0071348 | cellular response to interleukin-11(GO:0071348) |
| 0.1 | 4.0 | GO:0016242 | negative regulation of macroautophagy(GO:0016242) |
| 0.1 | 0.6 | GO:0072530 | purine-containing compound transmembrane transport(GO:0072530) |
| 0.1 | 12.2 | GO:0017015 | regulation of transforming growth factor beta receptor signaling pathway(GO:0017015) |
| 0.1 | 0.6 | GO:0061056 | sclerotome development(GO:0061056) |
| 0.1 | 1.0 | GO:0006108 | malate metabolic process(GO:0006108) |
| 0.1 | 1.0 | GO:0060297 | regulation of sarcomere organization(GO:0060297) |
| 0.1 | 2.2 | GO:0090026 | positive regulation of monocyte chemotaxis(GO:0090026) |
| 0.1 | 0.9 | GO:0048539 | bone marrow development(GO:0048539) |
| 0.1 | 1.1 | GO:0048251 | elastic fiber assembly(GO:0048251) |
| 0.1 | 0.4 | GO:0071431 | tRNA export from nucleus(GO:0006409) tRNA-containing ribonucleoprotein complex export from nucleus(GO:0071431) |
| 0.1 | 0.6 | GO:0006172 | ADP biosynthetic process(GO:0006172) |
| 0.1 | 1.2 | GO:0031000 | response to caffeine(GO:0031000) |
| 0.1 | 0.5 | GO:1904721 | regulation of mRNA cleavage(GO:0031437) negative regulation of mRNA cleavage(GO:0031438) regulation of mRNA endonucleolytic cleavage involved in unfolded protein response(GO:1904720) negative regulation of mRNA endonucleolytic cleavage involved in unfolded protein response(GO:1904721) |
| 0.1 | 1.0 | GO:0030300 | regulation of intestinal cholesterol absorption(GO:0030300) |
| 0.1 | 2.1 | GO:0044247 | glycogen catabolic process(GO:0005980) glucan catabolic process(GO:0009251) cellular polysaccharide catabolic process(GO:0044247) |
| 0.1 | 0.1 | GO:2001271 | regulation of cysteine-type endopeptidase activity involved in execution phase of apoptosis(GO:2001270) negative regulation of cysteine-type endopeptidase activity involved in execution phase of apoptosis(GO:2001271) |
| 0.1 | 1.6 | GO:0019886 | antigen processing and presentation of exogenous peptide antigen via MHC class II(GO:0019886) |
| 0.1 | 0.1 | GO:2000501 | natural killer cell chemotaxis(GO:0035747) regulation of natural killer cell chemotaxis(GO:2000501) |
| 0.1 | 0.9 | GO:0045059 | positive thymic T cell selection(GO:0045059) |
| 0.1 | 0.8 | GO:0098907 | protein localization to M-band(GO:0036309) protein localization to T-tubule(GO:0036371) regulation of SA node cell action potential(GO:0098907) |
| 0.1 | 1.2 | GO:1903301 | positive regulation of glucokinase activity(GO:0033133) positive regulation of hexokinase activity(GO:1903301) |
| 0.1 | 1.1 | GO:0060040 | retinal bipolar neuron differentiation(GO:0060040) |
| 0.1 | 0.8 | GO:0032625 | interleukin-21 production(GO:0032625) interleukin-21 secretion(GO:0072619) |
| 0.1 | 8.5 | GO:0032922 | circadian regulation of gene expression(GO:0032922) |
| 0.1 | 1.4 | GO:0070734 | histone H3-K27 methylation(GO:0070734) |
| 0.1 | 0.9 | GO:0032494 | response to peptidoglycan(GO:0032494) |
| 0.1 | 0.9 | GO:0046641 | positive regulation of alpha-beta T cell proliferation(GO:0046641) |
| 0.1 | 0.5 | GO:0019348 | dolichol metabolic process(GO:0019348) |
| 0.1 | 0.3 | GO:1902037 | negative regulation of hematopoietic stem cell differentiation(GO:1902037) |
| 0.1 | 1.8 | GO:0030970 | retrograde protein transport, ER to cytosol(GO:0030970) |
| 0.1 | 0.3 | GO:0021526 | medial motor column neuron differentiation(GO:0021526) |
| 0.1 | 1.4 | GO:0043508 | negative regulation of JUN kinase activity(GO:0043508) |
| 0.1 | 0.5 | GO:2001045 | negative regulation of integrin-mediated signaling pathway(GO:2001045) |
| 0.1 | 0.4 | GO:0000414 | regulation of histone H3-K36 methylation(GO:0000414) |
| 0.1 | 0.2 | GO:0046882 | negative regulation of follicle-stimulating hormone secretion(GO:0046882) |
| 0.1 | 2.4 | GO:0033622 | integrin activation(GO:0033622) |
| 0.1 | 0.2 | GO:0021629 | olfactory nerve morphogenesis(GO:0021627) olfactory nerve structural organization(GO:0021629) |
| 0.1 | 2.4 | GO:0051560 | mitochondrial calcium ion homeostasis(GO:0051560) |
| 0.1 | 1.0 | GO:0035845 | photoreceptor cell outer segment organization(GO:0035845) |
| 0.1 | 0.3 | GO:1904428 | negative regulation of tubulin deacetylation(GO:1904428) |
| 0.1 | 0.5 | GO:0071492 | cellular response to UV-A(GO:0071492) |
| 0.1 | 0.2 | GO:0019087 | transformation of host cell by virus(GO:0019087) cellular response to cell-matrix adhesion(GO:0071460) |
| 0.1 | 2.8 | GO:0000186 | activation of MAPKK activity(GO:0000186) |
| 0.1 | 1.0 | GO:0032366 | intracellular sterol transport(GO:0032366) intracellular cholesterol transport(GO:0032367) |
| 0.1 | 1.0 | GO:0042448 | progesterone metabolic process(GO:0042448) |
| 0.1 | 0.4 | GO:1903300 | negative regulation of glucokinase activity(GO:0033132) negative regulation of hexokinase activity(GO:1903300) |
| 0.1 | 3.3 | GO:0010862 | positive regulation of pathway-restricted SMAD protein phosphorylation(GO:0010862) |
| 0.1 | 0.2 | GO:0048162 | preantral ovarian follicle growth(GO:0001546) multi-layer follicle stage(GO:0048162) |
| 0.1 | 1.2 | GO:0045780 | positive regulation of bone resorption(GO:0045780) positive regulation of bone remodeling(GO:0046852) |
| 0.1 | 0.5 | GO:0090383 | phagosome acidification(GO:0090383) |
| 0.1 | 1.1 | GO:0043983 | histone H4-K12 acetylation(GO:0043983) |
| 0.1 | 0.3 | GO:0046501 | protoporphyrinogen IX metabolic process(GO:0046501) |
| 0.1 | 0.3 | GO:0070625 | zymogen granule exocytosis(GO:0070625) |
| 0.1 | 0.3 | GO:0017183 | peptidyl-diphthamide metabolic process(GO:0017182) peptidyl-diphthamide biosynthetic process from peptidyl-histidine(GO:0017183) |
| 0.1 | 0.6 | GO:0032876 | negative regulation of DNA endoreduplication(GO:0032876) |
| 0.1 | 0.8 | GO:1904293 | negative regulation of ERAD pathway(GO:1904293) |
| 0.1 | 1.5 | GO:0030502 | negative regulation of bone mineralization(GO:0030502) negative regulation of biomineral tissue development(GO:0070168) |
| 0.1 | 0.5 | GO:0015919 | peroxisomal membrane transport(GO:0015919) protein import into peroxisome membrane(GO:0045046) |
| 0.1 | 0.7 | GO:0033299 | secretion of lysosomal enzymes(GO:0033299) |
| 0.1 | 0.4 | GO:0006707 | cholesterol catabolic process(GO:0006707) sterol catabolic process(GO:0016127) |
| 0.1 | 0.4 | GO:0090261 | positive regulation of inclusion body assembly(GO:0090261) |
| 0.1 | 1.2 | GO:0048535 | lymph node development(GO:0048535) |
| 0.1 | 0.6 | GO:0038063 | collagen-activated tyrosine kinase receptor signaling pathway(GO:0038063) |
| 0.1 | 0.3 | GO:0014886 | transition between slow and fast fiber(GO:0014886) |
| 0.1 | 0.1 | GO:2000825 | positive regulation of androgen receptor activity(GO:2000825) |
| 0.1 | 0.9 | GO:0043486 | histone exchange(GO:0043486) |
| 0.1 | 2.0 | GO:0042088 | T-helper 1 type immune response(GO:0042088) |
| 0.1 | 1.2 | GO:0008272 | sulfate transport(GO:0008272) |
| 0.1 | 0.2 | GO:0070682 | proteasome regulatory particle assembly(GO:0070682) |
| 0.1 | 0.6 | GO:0048245 | eosinophil chemotaxis(GO:0048245) |
| 0.1 | 1.5 | GO:0008206 | bile acid metabolic process(GO:0008206) |
| 0.1 | 4.2 | GO:0019882 | antigen processing and presentation(GO:0019882) |
| 0.1 | 0.2 | GO:0001180 | transcription initiation from RNA polymerase I promoter for nuclear large rRNA transcript(GO:0001180) |
| 0.0 | 0.7 | GO:0045351 | type I interferon biosynthetic process(GO:0045351) |
| 0.0 | 0.5 | GO:1901409 | positive regulation of phosphorylation of RNA polymerase II C-terminal domain(GO:1901409) |
| 0.0 | 0.6 | GO:0010606 | positive regulation of cytoplasmic mRNA processing body assembly(GO:0010606) |
| 0.0 | 0.8 | GO:0031034 | myosin filament assembly(GO:0031034) striated muscle myosin thick filament assembly(GO:0071688) |
| 0.0 | 0.2 | GO:0097309 | cap1 mRNA methylation(GO:0097309) |
| 0.0 | 0.4 | GO:0070417 | cellular response to cold(GO:0070417) |
| 0.0 | 0.1 | GO:0006419 | alanyl-tRNA aminoacylation(GO:0006419) |
| 0.0 | 2.7 | GO:0050873 | brown fat cell differentiation(GO:0050873) |
| 0.0 | 0.7 | GO:0001833 | inner cell mass cell proliferation(GO:0001833) |
| 0.0 | 0.4 | GO:0006741 | NADP biosynthetic process(GO:0006741) |
| 0.0 | 0.6 | GO:0035092 | sperm chromatin condensation(GO:0035092) |
| 0.0 | 0.3 | GO:1904749 | regulation of protein localization to nucleolus(GO:1904749) |
| 0.0 | 0.2 | GO:0010499 | proteasomal ubiquitin-independent protein catabolic process(GO:0010499) |
| 0.0 | 0.5 | GO:0071763 | nuclear membrane organization(GO:0071763) |
| 0.0 | 0.3 | GO:0043568 | positive regulation of insulin-like growth factor receptor signaling pathway(GO:0043568) |
| 0.0 | 0.3 | GO:0090038 | negative regulation of protein kinase C signaling(GO:0090038) |
| 0.0 | 1.3 | GO:0055090 | acylglycerol homeostasis(GO:0055090) triglyceride homeostasis(GO:0070328) |
| 0.0 | 0.2 | GO:0070895 | transposon integration(GO:0070893) regulation of transposon integration(GO:0070894) negative regulation of transposon integration(GO:0070895) |
| 0.0 | 0.4 | GO:0016139 | glycoside catabolic process(GO:0016139) |
| 0.0 | 1.8 | GO:0051642 | centrosome localization(GO:0051642) |
| 0.0 | 4.5 | GO:0050715 | positive regulation of cytokine secretion(GO:0050715) |
| 0.0 | 0.2 | GO:0046898 | suppression by virus of host apoptotic process(GO:0019050) modulation by virus of host apoptotic process(GO:0039526) response to cycloheximide(GO:0046898) |
| 0.0 | 0.7 | GO:0061179 | negative regulation of insulin secretion involved in cellular response to glucose stimulus(GO:0061179) |
| 0.0 | 0.1 | GO:1904425 | negative regulation of GTP binding(GO:1904425) |
| 0.0 | 0.3 | GO:0021562 | vestibulocochlear nerve development(GO:0021562) |
| 0.0 | 0.5 | GO:2000253 | positive regulation of feeding behavior(GO:2000253) |
| 0.0 | 1.1 | GO:0010172 | embryonic body morphogenesis(GO:0010172) |
| 0.0 | 2.0 | GO:1904893 | negative regulation of JAK-STAT cascade(GO:0046426) negative regulation of STAT cascade(GO:1904893) |
| 0.0 | 0.5 | GO:0046520 | sphingoid biosynthetic process(GO:0046520) |
| 0.0 | 3.1 | GO:0032092 | positive regulation of protein binding(GO:0032092) |
| 0.0 | 0.4 | GO:0043374 | CD8-positive, alpha-beta T cell activation(GO:0036037) CD8-positive, alpha-beta T cell differentiation(GO:0043374) |
| 0.0 | 0.8 | GO:0032438 | melanosome organization(GO:0032438) |
| 0.0 | 0.1 | GO:0090245 | axis elongation involved in somitogenesis(GO:0090245) |
| 0.0 | 1.0 | GO:0030488 | tRNA methylation(GO:0030488) |
| 0.0 | 0.4 | GO:0070166 | enamel mineralization(GO:0070166) |
| 0.0 | 0.1 | GO:0002051 | osteoblast fate commitment(GO:0002051) |
| 0.0 | 0.1 | GO:0006624 | vacuolar protein processing(GO:0006624) |
| 0.0 | 0.2 | GO:0009235 | cobalamin metabolic process(GO:0009235) |
| 0.0 | 0.3 | GO:0032049 | cardiolipin biosynthetic process(GO:0032049) |
| 0.0 | 3.0 | GO:0031638 | zymogen activation(GO:0031638) |
| 0.0 | 3.1 | GO:0046330 | positive regulation of JNK cascade(GO:0046330) |
| 0.0 | 0.2 | GO:0006265 | DNA topological change(GO:0006265) |
| 0.0 | 0.2 | GO:0045583 | regulation of cytotoxic T cell differentiation(GO:0045583) positive regulation of cytotoxic T cell differentiation(GO:0045585) |
| 0.0 | 0.6 | GO:0006743 | ubiquinone metabolic process(GO:0006743) ubiquinone biosynthetic process(GO:0006744) |
| 0.0 | 0.1 | GO:0060005 | vestibular reflex(GO:0060005) |
| 0.0 | 0.2 | GO:0046010 | positive regulation of circadian sleep/wake cycle, non-REM sleep(GO:0046010) |
| 0.0 | 0.1 | GO:0072137 | condensed mesenchymal cell proliferation(GO:0072137) |
| 0.0 | 2.3 | GO:0035914 | skeletal muscle cell differentiation(GO:0035914) |
| 0.0 | 2.1 | GO:0000187 | activation of MAPK activity(GO:0000187) |
| 0.0 | 0.3 | GO:0036120 | cellular response to platelet-derived growth factor stimulus(GO:0036120) |
| 0.0 | 0.2 | GO:0045218 | zonula adherens maintenance(GO:0045218) |
| 0.0 | 0.1 | GO:0070829 | heterochromatin maintenance(GO:0070829) |
| 0.0 | 0.3 | GO:0045162 | clustering of voltage-gated sodium channels(GO:0045162) |
| 0.0 | 0.2 | GO:0030242 | pexophagy(GO:0030242) |
| 0.0 | 0.6 | GO:2000144 | positive regulation of DNA-templated transcription, initiation(GO:2000144) |
| 0.0 | 0.5 | GO:0035024 | negative regulation of Rho protein signal transduction(GO:0035024) |
| 0.0 | 1.4 | GO:0007179 | transforming growth factor beta receptor signaling pathway(GO:0007179) |
| 0.0 | 0.4 | GO:0002862 | negative regulation of inflammatory response to antigenic stimulus(GO:0002862) |
| 0.0 | 0.2 | GO:0043922 | negative regulation by host of viral transcription(GO:0043922) |
| 0.0 | 0.3 | GO:0097011 | cellular response to granulocyte macrophage colony-stimulating factor stimulus(GO:0097011) response to granulocyte macrophage colony-stimulating factor(GO:0097012) |
| 0.0 | 0.4 | GO:0031507 | heterochromatin assembly(GO:0031507) |
| 0.0 | 0.2 | GO:0031145 | anaphase-promoting complex-dependent catabolic process(GO:0031145) |
| 0.0 | 0.4 | GO:0007096 | regulation of exit from mitosis(GO:0007096) |
| 0.0 | 0.1 | GO:0090310 | negative regulation of methylation-dependent chromatin silencing(GO:0090310) |
| 0.0 | 0.5 | GO:0014883 | transition between fast and slow fiber(GO:0014883) |
| 0.0 | 0.1 | GO:0070828 | heterochromatin organization(GO:0070828) |
| 0.0 | 0.1 | GO:0021555 | midbrain-hindbrain boundary morphogenesis(GO:0021555) |
| 0.0 | 0.2 | GO:0090557 | establishment of endothelial intestinal barrier(GO:0090557) |
| 0.0 | 0.1 | GO:0071236 | cellular response to antibiotic(GO:0071236) |
| 0.0 | 3.9 | GO:0019221 | cytokine-mediated signaling pathway(GO:0019221) |
| 0.0 | 0.2 | GO:0017062 | respiratory chain complex III assembly(GO:0017062) mitochondrial respiratory chain complex III assembly(GO:0034551) mitochondrial respiratory chain complex III biogenesis(GO:0097033) |
| 0.0 | 0.1 | GO:0044828 | negative regulation by host of viral genome replication(GO:0044828) |
| 0.0 | 0.7 | GO:0007530 | sex determination(GO:0007530) |
| 0.0 | 0.6 | GO:0007143 | female meiotic division(GO:0007143) |
| 0.0 | 0.2 | GO:0061092 | regulation of phospholipid translocation(GO:0061091) positive regulation of phospholipid translocation(GO:0061092) |
| 0.0 | 0.6 | GO:0030199 | collagen fibril organization(GO:0030199) |
| 0.0 | 0.8 | GO:0010972 | negative regulation of G2/M transition of mitotic cell cycle(GO:0010972) |
| 0.0 | 0.1 | GO:1990481 | mRNA pseudouridine synthesis(GO:1990481) |
| 0.0 | 0.2 | GO:0006610 | ribosomal protein import into nucleus(GO:0006610) |
| 0.0 | 0.3 | GO:0070584 | mitochondrion morphogenesis(GO:0070584) |
| 0.0 | 0.1 | GO:0031100 | organ regeneration(GO:0031100) |
| 0.0 | 1.0 | GO:0090263 | positive regulation of canonical Wnt signaling pathway(GO:0090263) |
| 0.0 | 0.2 | GO:0006607 | NLS-bearing protein import into nucleus(GO:0006607) |
| 0.0 | 0.2 | GO:0003334 | keratinocyte development(GO:0003334) |
| 0.0 | 0.1 | GO:0071051 | polyadenylation-dependent snoRNA 3'-end processing(GO:0071051) |
| 0.0 | 0.0 | GO:0019427 | acetate biosynthetic process(GO:0019413) acetyl-CoA biosynthetic process from acetate(GO:0019427) propionate metabolic process(GO:0019541) propionate biosynthetic process(GO:0019542) |
| 0.0 | 0.4 | GO:0006376 | mRNA splice site selection(GO:0006376) |
| 0.0 | 0.6 | GO:0010501 | RNA secondary structure unwinding(GO:0010501) |
| 0.0 | 0.1 | GO:0097428 | protein maturation by iron-sulfur cluster transfer(GO:0097428) |
| 0.0 | 0.1 | GO:1903361 | protein localization to basolateral plasma membrane(GO:1903361) |
| 0.0 | 0.2 | GO:0051026 | chiasma assembly(GO:0051026) |
| 0.0 | 0.3 | GO:0031987 | locomotion involved in locomotory behavior(GO:0031987) |
| 0.0 | 0.1 | GO:0034773 | histone H4-K20 trimethylation(GO:0034773) |
| 0.0 | 0.2 | GO:0035067 | negative regulation of histone acetylation(GO:0035067) |
| 0.0 | 0.1 | GO:0015791 | polyol transport(GO:0015791) |
| 0.0 | 0.1 | GO:0016554 | cytidine to uridine editing(GO:0016554) |
Gene overrepresentation in cellular component category:
| Log-likelihood per target | Total log-likelihood | Term | Description |
|---|---|---|---|
| 1.8 | 16.4 | GO:0005577 | fibrinogen complex(GO:0005577) |
| 1.7 | 11.7 | GO:0048237 | rough endoplasmic reticulum lumen(GO:0048237) |
| 0.6 | 4.9 | GO:0044299 | C-fiber(GO:0044299) |
| 0.6 | 7.5 | GO:1990712 | HFE-transferrin receptor complex(GO:1990712) |
| 0.6 | 1.7 | GO:0033193 | Lsd1/2 complex(GO:0033193) |
| 0.6 | 2.8 | GO:0005579 | membrane attack complex(GO:0005579) |
| 0.5 | 1.5 | GO:0005900 | oncostatin-M receptor complex(GO:0005900) |
| 0.5 | 3.0 | GO:0097433 | dense body(GO:0097433) |
| 0.5 | 2.8 | GO:1990111 | spermatoproteasome complex(GO:1990111) |
| 0.4 | 113.2 | GO:0072562 | blood microparticle(GO:0072562) |
| 0.4 | 2.8 | GO:0030478 | actin cap(GO:0030478) |
| 0.3 | 2.7 | GO:0042825 | TAP complex(GO:0042825) |
| 0.3 | 11.0 | GO:0031233 | intrinsic component of external side of plasma membrane(GO:0031233) |
| 0.3 | 1.0 | GO:1902636 | kinociliary basal body(GO:1902636) |
| 0.3 | 3.1 | GO:0042567 | insulin-like growth factor ternary complex(GO:0042567) |
| 0.3 | 7.0 | GO:0032982 | muscle myosin complex(GO:0005859) myosin filament(GO:0032982) |
| 0.2 | 0.2 | GO:0030690 | Noc1p-Noc2p complex(GO:0030690) |
| 0.2 | 13.3 | GO:0001772 | immunological synapse(GO:0001772) |
| 0.2 | 1.3 | GO:1903439 | calcitonin family receptor complex(GO:1903439) amylin receptor complex(GO:1903440) |
| 0.2 | 0.6 | GO:0071595 | Nem1-Spo7 phosphatase complex(GO:0071595) |
| 0.2 | 3.6 | GO:0032426 | stereocilium tip(GO:0032426) |
| 0.2 | 0.8 | GO:0017177 | glucosidase II complex(GO:0017177) |
| 0.2 | 0.8 | GO:0000839 | Hrd1p ubiquitin ligase ERAD-L complex(GO:0000839) |
| 0.2 | 0.9 | GO:1990604 | IRE1-TRAF2-ASK1 complex(GO:1990604) |
| 0.2 | 1.5 | GO:0097342 | ripoptosome(GO:0097342) |
| 0.2 | 1.1 | GO:0072559 | NLRP3 inflammasome complex(GO:0072559) |
| 0.2 | 2.0 | GO:0042612 | MHC class I protein complex(GO:0042612) |
| 0.2 | 3.0 | GO:0032045 | guanyl-nucleotide exchange factor complex(GO:0032045) |
| 0.2 | 0.8 | GO:0044194 | cytolytic granule(GO:0044194) |
| 0.1 | 1.9 | GO:0008385 | IkappaB kinase complex(GO:0008385) |
| 0.1 | 2.0 | GO:0044754 | autolysosome(GO:0044754) |
| 0.1 | 1.6 | GO:0042613 | MHC class II protein complex(GO:0042613) |
| 0.1 | 0.4 | GO:1990423 | Dsl1p complex(GO:0070939) RZZ complex(GO:1990423) |
| 0.1 | 0.4 | GO:0036020 | endolysosome membrane(GO:0036020) |
| 0.1 | 1.1 | GO:0045298 | tubulin complex(GO:0045298) |
| 0.1 | 4.2 | GO:0046658 | anchored component of plasma membrane(GO:0046658) |
| 0.1 | 0.3 | GO:0060187 | cell pole(GO:0060187) |
| 0.1 | 1.8 | GO:0005662 | DNA replication factor A complex(GO:0005662) |
| 0.1 | 2.0 | GO:0032593 | insulin-responsive compartment(GO:0032593) |
| 0.1 | 1.0 | GO:0000127 | transcription factor TFIIIC complex(GO:0000127) |
| 0.1 | 1.6 | GO:0017101 | aminoacyl-tRNA synthetase multienzyme complex(GO:0017101) |
| 0.1 | 0.8 | GO:0017071 | intracellular cyclic nucleotide activated cation channel complex(GO:0017071) |
| 0.1 | 3.8 | GO:0035145 | exon-exon junction complex(GO:0035145) |
| 0.1 | 0.7 | GO:0005638 | lamin filament(GO:0005638) |
| 0.1 | 10.5 | GO:0005811 | lipid particle(GO:0005811) |
| 0.1 | 0.6 | GO:0098642 | collagen type IV trimer(GO:0005587) network-forming collagen trimer(GO:0098642) collagen network(GO:0098645) basement membrane collagen trimer(GO:0098651) |
| 0.1 | 4.6 | GO:0030173 | integral component of Golgi membrane(GO:0030173) |
| 0.1 | 1.1 | GO:0005736 | DNA-directed RNA polymerase I complex(GO:0005736) |
| 0.1 | 0.9 | GO:0042105 | alpha-beta T cell receptor complex(GO:0042105) |
| 0.1 | 0.3 | GO:0033165 | interphotoreceptor matrix(GO:0033165) |
| 0.1 | 0.7 | GO:0000138 | Golgi trans cisterna(GO:0000138) |
| 0.1 | 0.8 | GO:0034663 | endoplasmic reticulum chaperone complex(GO:0034663) |
| 0.1 | 5.8 | GO:0005793 | endoplasmic reticulum-Golgi intermediate compartment(GO:0005793) |
| 0.1 | 3.7 | GO:0005801 | cis-Golgi network(GO:0005801) |
| 0.1 | 1.0 | GO:0070419 | nonhomologous end joining complex(GO:0070419) |
| 0.1 | 0.5 | GO:0036396 | MIS complex(GO:0036396) |
| 0.1 | 4.9 | GO:0031941 | filamentous actin(GO:0031941) |
| 0.1 | 0.3 | GO:0008623 | CHRAC(GO:0008623) |
| 0.1 | 1.1 | GO:0042599 | lamellar body(GO:0042599) |
| 0.1 | 0.8 | GO:0031315 | extrinsic component of mitochondrial outer membrane(GO:0031315) |
| 0.1 | 0.4 | GO:0031298 | replication fork protection complex(GO:0031298) |
| 0.1 | 0.2 | GO:0034272 | phosphatidylinositol 3-kinase complex, class III, type I(GO:0034271) phosphatidylinositol 3-kinase complex, class III, type II(GO:0034272) |
| 0.1 | 0.1 | GO:0030689 | Noc complex(GO:0030689) |
| 0.1 | 0.6 | GO:0030015 | CCR4-NOT core complex(GO:0030015) |
| 0.1 | 9.1 | GO:0005913 | cell-cell adherens junction(GO:0005913) |
| 0.0 | 0.4 | GO:0070652 | HAUS complex(GO:0070652) |
| 0.0 | 9.6 | GO:0001650 | fibrillar center(GO:0001650) |
| 0.0 | 0.6 | GO:0008540 | proteasome regulatory particle, base subcomplex(GO:0008540) |
| 0.0 | 0.4 | GO:0017059 | serine C-palmitoyltransferase complex(GO:0017059) endoplasmic reticulum palmitoyltransferase complex(GO:0031211) |
| 0.0 | 3.1 | GO:0045335 | phagocytic vesicle(GO:0045335) |
| 0.0 | 0.3 | GO:0000322 | storage vacuole(GO:0000322) |
| 0.0 | 0.5 | GO:0072546 | ER membrane protein complex(GO:0072546) |
| 0.0 | 0.7 | GO:0000124 | SAGA complex(GO:0000124) |
| 0.0 | 0.9 | GO:0005922 | connexon complex(GO:0005922) |
| 0.0 | 3.6 | GO:0031463 | Cul3-RING ubiquitin ligase complex(GO:0031463) |
| 0.0 | 0.8 | GO:0005665 | DNA-directed RNA polymerase II, core complex(GO:0005665) |
| 0.0 | 1.7 | GO:0030665 | clathrin-coated vesicle membrane(GO:0030665) |
| 0.0 | 0.4 | GO:0005677 | chromatin silencing complex(GO:0005677) |
| 0.0 | 69.5 | GO:0005615 | extracellular space(GO:0005615) |
| 0.0 | 3.1 | GO:0010494 | cytoplasmic stress granule(GO:0010494) |
| 0.0 | 0.6 | GO:0044300 | cerebellar mossy fiber(GO:0044300) |
| 0.0 | 2.1 | GO:0005657 | replication fork(GO:0005657) |
| 0.0 | 0.4 | GO:0019773 | proteasome core complex, alpha-subunit complex(GO:0019773) |
| 0.0 | 0.3 | GO:0005796 | Golgi lumen(GO:0005796) |
| 0.0 | 0.2 | GO:0097226 | sperm mitochondrial sheath(GO:0097226) |
| 0.0 | 3.3 | GO:0000118 | histone deacetylase complex(GO:0000118) |
| 0.0 | 14.7 | GO:0005789 | endoplasmic reticulum membrane(GO:0005789) |
| 0.0 | 1.0 | GO:0005788 | endoplasmic reticulum lumen(GO:0005788) |
| 0.0 | 0.8 | GO:0031430 | M band(GO:0031430) |
| 0.0 | 2.0 | GO:0005778 | peroxisomal membrane(GO:0005778) microbody membrane(GO:0031903) |
| 0.0 | 1.1 | GO:0051233 | spindle midzone(GO:0051233) |
| 0.0 | 6.1 | GO:0009897 | external side of plasma membrane(GO:0009897) |
| 0.0 | 2.1 | GO:0031526 | brush border membrane(GO:0031526) |
| 0.0 | 1.0 | GO:0032391 | photoreceptor connecting cilium(GO:0032391) |
| 0.0 | 0.7 | GO:0030904 | retromer complex(GO:0030904) |
| 0.0 | 0.4 | GO:0031235 | intrinsic component of the cytoplasmic side of the plasma membrane(GO:0031235) |
| 0.0 | 11.3 | GO:0005667 | transcription factor complex(GO:0005667) |
| 0.0 | 1.5 | GO:0016234 | inclusion body(GO:0016234) |
| 0.0 | 0.4 | GO:0071004 | U2-type prespliceosome(GO:0071004) |
| 0.0 | 9.4 | GO:0005925 | focal adhesion(GO:0005925) |
| 0.0 | 1.1 | GO:0000502 | proteasome complex(GO:0000502) |
| 0.0 | 0.1 | GO:0031251 | PAN complex(GO:0031251) |
| 0.0 | 0.2 | GO:0036057 | filtration diaphragm(GO:0036056) slit diaphragm(GO:0036057) |
| 0.0 | 0.3 | GO:1902711 | GABA-A receptor complex(GO:1902711) |
| 0.0 | 0.1 | GO:0072687 | microtubule minus-end(GO:0036449) meiotic spindle(GO:0072687) |
Gene overrepresentation in molecular function category:
| Log-likelihood per target | Total log-likelihood | Term | Description |
|---|---|---|---|
| 3.4 | 13.4 | GO:0047016 | cholest-5-ene-3-beta,7-alpha-diol 3-beta-dehydrogenase activity(GO:0047016) |
| 2.8 | 16.7 | GO:0008269 | JAK pathway signal transduction adaptor activity(GO:0008269) |
| 2.4 | 12.0 | GO:0004905 | interferon receptor activity(GO:0004904) type I interferon receptor activity(GO:0004905) type I interferon binding(GO:0019962) |
| 2.0 | 55.2 | GO:0005540 | hyaluronic acid binding(GO:0005540) |
| 1.9 | 7.8 | GO:0042008 | interleukin-18 receptor activity(GO:0042008) |
| 1.8 | 21.3 | GO:0004322 | ferroxidase activity(GO:0004322) oxidoreductase activity, oxidizing metal ions, oxygen as acceptor(GO:0016724) |
| 1.7 | 5.2 | GO:0008396 | oxysterol 7-alpha-hydroxylase activity(GO:0008396) |
| 1.7 | 6.7 | GO:0071614 | linoleic acid epoxygenase activity(GO:0071614) |
| 1.4 | 4.1 | GO:0004967 | glucagon receptor activity(GO:0004967) |
| 1.3 | 22.8 | GO:0001846 | opsonin binding(GO:0001846) |
| 1.2 | 4.9 | GO:0031727 | CCR2 chemokine receptor binding(GO:0031727) |
| 1.2 | 3.6 | GO:0050785 | advanced glycation end-product receptor activity(GO:0050785) |
| 1.1 | 5.3 | GO:0016971 | flavin-linked sulfhydryl oxidase activity(GO:0016971) |
| 0.9 | 4.7 | GO:0004998 | transferrin receptor activity(GO:0004998) |
| 0.9 | 2.7 | GO:0015433 | peptide antigen-transporting ATPase activity(GO:0015433) tapasin binding(GO:0046980) |
| 0.9 | 6.2 | GO:0030899 | calcium-dependent ATPase activity(GO:0030899) |
| 0.9 | 10.5 | GO:0008061 | chitin binding(GO:0008061) |
| 0.8 | 9.7 | GO:0001848 | complement binding(GO:0001848) |
| 0.8 | 6.0 | GO:0052851 | cupric reductase activity(GO:0008823) ferric-chelate reductase (NADPH) activity(GO:0052851) |
| 0.7 | 4.5 | GO:0015232 | heme transporter activity(GO:0015232) |
| 0.7 | 2.2 | GO:0030298 | receptor signaling protein tyrosine kinase activator activity(GO:0030298) CCR1 chemokine receptor binding(GO:0031726) |
| 0.7 | 5.2 | GO:0019770 | IgG receptor activity(GO:0019770) |
| 0.7 | 2.1 | GO:0004133 | glycogen debranching enzyme activity(GO:0004133) 4-alpha-glucanotransferase activity(GO:0004134) amylo-alpha-1,6-glucosidase activity(GO:0004135) |
| 0.7 | 2.7 | GO:0008184 | glycogen phosphorylase activity(GO:0008184) |
| 0.6 | 2.8 | GO:0015091 | ferric iron transmembrane transporter activity(GO:0015091) trivalent inorganic cation transmembrane transporter activity(GO:0072510) |
| 0.6 | 6.1 | GO:0003810 | protein-glutamine gamma-glutamyltransferase activity(GO:0003810) |
| 0.5 | 1.6 | GO:0004823 | glutamine-tRNA ligase activity(GO:0004819) leucine-tRNA ligase activity(GO:0004823) |
| 0.5 | 1.0 | GO:0016972 | thiol oxidase activity(GO:0016972) |
| 0.5 | 1.5 | GO:0019981 | interleukin-6 receptor activity(GO:0004915) interleukin-6 binding(GO:0019981) |
| 0.5 | 1.5 | GO:0008775 | acetate CoA-transferase activity(GO:0008775) |
| 0.5 | 3.5 | GO:0030160 | GKAP/Homer scaffold activity(GO:0030160) |
| 0.5 | 2.4 | GO:0004925 | prolactin receptor activity(GO:0004925) |
| 0.5 | 12.6 | GO:0030247 | pattern binding(GO:0001871) polysaccharide binding(GO:0030247) |
| 0.5 | 6.0 | GO:0004571 | mannosyl-oligosaccharide 1,2-alpha-mannosidase activity(GO:0004571) |
| 0.5 | 2.8 | GO:0016019 | N-acetylmuramoyl-L-alanine amidase activity(GO:0008745) peptidoglycan receptor activity(GO:0016019) |
| 0.4 | 5.7 | GO:0001069 | regulatory region RNA binding(GO:0001069) |
| 0.4 | 1.3 | GO:0005174 | CD40 receptor binding(GO:0005174) |
| 0.3 | 1.4 | GO:0004307 | ethanolaminephosphotransferase activity(GO:0004307) |
| 0.3 | 1.6 | GO:0005350 | purine nucleobase transmembrane transporter activity(GO:0005345) pyrimidine nucleobase transmembrane transporter activity(GO:0005350) nucleobase transmembrane transporter activity(GO:0015205) glycerol channel activity(GO:0015254) |
| 0.3 | 2.1 | GO:0005332 | gamma-aminobutyric acid:sodium symporter activity(GO:0005332) |
| 0.3 | 2.7 | GO:0019834 | phospholipase A2 inhibitor activity(GO:0019834) |
| 0.3 | 0.6 | GO:0001226 | RNA polymerase II transcription corepressor binding(GO:0001226) |
| 0.3 | 2.6 | GO:0004886 | 9-cis retinoic acid receptor activity(GO:0004886) |
| 0.3 | 0.8 | GO:0097100 | supercoiled DNA binding(GO:0097100) |
| 0.3 | 3.3 | GO:0004887 | thyroid hormone receptor activity(GO:0004887) |
| 0.3 | 0.8 | GO:0070996 | type 1 melanocortin receptor binding(GO:0070996) |
| 0.3 | 4.1 | GO:0044213 | intronic transcription regulatory region sequence-specific DNA binding(GO:0001161) intronic transcription regulatory region DNA binding(GO:0044213) |
| 0.2 | 1.0 | GO:0003985 | acetyl-CoA C-acetyltransferase activity(GO:0003985) C-acetyltransferase activity(GO:0016453) |
| 0.2 | 0.7 | GO:0015087 | cobalt ion transmembrane transporter activity(GO:0015087) |
| 0.2 | 0.7 | GO:0005157 | macrophage colony-stimulating factor receptor binding(GO:0005157) |
| 0.2 | 4.4 | GO:0003993 | acid phosphatase activity(GO:0003993) |
| 0.2 | 3.6 | GO:0001206 | transcriptional repressor activity, RNA polymerase II distal enhancer sequence-specific binding(GO:0001206) |
| 0.2 | 0.9 | GO:0086077 | gap junction channel activity involved in AV node cell-bundle of His cell electrical coupling(GO:0086077) |
| 0.2 | 1.4 | GO:0017116 | single-stranded DNA-dependent ATP-dependent DNA helicase activity(GO:0017116) |
| 0.2 | 2.0 | GO:0048019 | receptor antagonist activity(GO:0048019) |
| 0.2 | 1.3 | GO:0004614 | phosphoglucomutase activity(GO:0004614) |
| 0.2 | 3.6 | GO:0016857 | racemase and epimerase activity, acting on carbohydrates and derivatives(GO:0016857) |
| 0.2 | 1.3 | GO:0097643 | amylin receptor activity(GO:0097643) |
| 0.2 | 0.6 | GO:0046899 | nucleoside triphosphate adenylate kinase activity(GO:0046899) |
| 0.2 | 1.9 | GO:0008479 | queuine tRNA-ribosyltransferase activity(GO:0008479) |
| 0.2 | 1.4 | GO:0042328 | heparan sulfate N-acetylglucosaminyltransferase activity(GO:0042328) |
| 0.2 | 1.0 | GO:0030060 | L-malate dehydrogenase activity(GO:0030060) |
| 0.2 | 1.0 | GO:0002046 | opsin binding(GO:0002046) |
| 0.2 | 1.2 | GO:0005134 | interleukin-2 receptor binding(GO:0005134) |
| 0.2 | 2.9 | GO:0051525 | NFAT protein binding(GO:0051525) |
| 0.2 | 3.5 | GO:0008430 | selenium binding(GO:0008430) |
| 0.2 | 2.1 | GO:0008429 | phosphatidylethanolamine binding(GO:0008429) |
| 0.2 | 15.1 | GO:0005507 | copper ion binding(GO:0005507) |
| 0.2 | 2.2 | GO:0102337 | fatty acid elongase activity(GO:0009922) 3-oxo-arachidoyl-CoA synthase activity(GO:0102336) 3-oxo-cerotoyl-CoA synthase activity(GO:0102337) 3-oxo-lignoceronyl-CoA synthase activity(GO:0102338) |
| 0.2 | 3.4 | GO:0070403 | NAD+ binding(GO:0070403) |
| 0.2 | 3.9 | GO:0098641 | cadherin binding involved in cell-cell adhesion(GO:0098641) |
| 0.2 | 2.0 | GO:0016494 | C-X-C chemokine receptor activity(GO:0016494) |
| 0.2 | 0.3 | GO:0030350 | iron-responsive element binding(GO:0030350) |
| 0.2 | 0.7 | GO:0019809 | spermidine binding(GO:0019809) |
| 0.2 | 4.3 | GO:0005520 | insulin-like growth factor binding(GO:0005520) |
| 0.2 | 3.6 | GO:0051787 | misfolded protein binding(GO:0051787) |
| 0.2 | 0.5 | GO:0035375 | zymogen binding(GO:0035375) |
| 0.2 | 4.4 | GO:0043395 | heparan sulfate proteoglycan binding(GO:0043395) |
| 0.2 | 3.3 | GO:0032041 | NAD-dependent histone deacetylase activity(GO:0017136) histone deacetylase activity (H3-K14 specific)(GO:0031078) NAD-dependent histone deacetylase activity (H3-K14 specific)(GO:0032041) NAD-dependent protein deacetylase activity(GO:0034979) |
| 0.1 | 1.6 | GO:0043426 | MRF binding(GO:0043426) |
| 0.1 | 19.3 | GO:0004860 | protein kinase inhibitor activity(GO:0004860) |
| 0.1 | 9.8 | GO:0005160 | transforming growth factor beta receptor binding(GO:0005160) |
| 0.1 | 0.6 | GO:0047751 | 3-oxo-5-alpha-steroid 4-dehydrogenase activity(GO:0003865) cholestenone 5-alpha-reductase activity(GO:0047751) |
| 0.1 | 0.6 | GO:0004740 | pyruvate dehydrogenase (acetyl-transferring) kinase activity(GO:0004740) |
| 0.1 | 0.4 | GO:0050253 | sterol esterase activity(GO:0004771) retinyl-palmitate esterase activity(GO:0050253) |
| 0.1 | 0.4 | GO:0052692 | raffinose alpha-galactosidase activity(GO:0052692) |
| 0.1 | 0.8 | GO:0005222 | intracellular cAMP activated cation channel activity(GO:0005222) intracellular cGMP activated cation channel activity(GO:0005223) |
| 0.1 | 1.3 | GO:0050733 | RS domain binding(GO:0050733) |
| 0.1 | 1.2 | GO:0003873 | 6-phosphofructo-2-kinase activity(GO:0003873) |
| 0.1 | 0.3 | GO:0070976 | TIR domain binding(GO:0070976) |
| 0.1 | 1.0 | GO:0035312 | 5'-3' exodeoxyribonuclease activity(GO:0035312) |
| 0.1 | 0.5 | GO:0003976 | UDP-N-acetylglucosamine-lysosomal-enzyme N-acetylglucosaminephosphotransferase activity(GO:0003976) |
| 0.1 | 2.8 | GO:0070628 | proteasome binding(GO:0070628) |
| 0.1 | 0.8 | GO:0046404 | ATP-dependent polydeoxyribonucleotide 5'-hydroxyl-kinase activity(GO:0046404) polydeoxyribonucleotide kinase activity(GO:0051733) ATP-dependent polynucleotide kinase activity(GO:0051734) |
| 0.1 | 3.7 | GO:0004602 | glutathione peroxidase activity(GO:0004602) |
| 0.1 | 8.1 | GO:0038024 | cargo receptor activity(GO:0038024) |
| 0.1 | 0.6 | GO:0070728 | leucine binding(GO:0070728) |
| 0.1 | 2.7 | GO:0004697 | protein kinase C activity(GO:0004697) |
| 0.1 | 1.1 | GO:0046976 | histone methyltransferase activity (H3-K27 specific)(GO:0046976) |
| 0.1 | 18.8 | GO:0005178 | integrin binding(GO:0005178) |
| 0.1 | 10.2 | GO:0030971 | receptor tyrosine kinase binding(GO:0030971) |
| 0.1 | 0.8 | GO:0004865 | protein serine/threonine phosphatase inhibitor activity(GO:0004865) |
| 0.1 | 0.3 | GO:0051916 | granulocyte colony-stimulating factor binding(GO:0051916) |
| 0.1 | 1.0 | GO:0016427 | tRNA (cytosine) methyltransferase activity(GO:0016427) |
| 0.1 | 0.8 | GO:0047134 | protein-disulfide reductase activity(GO:0047134) |
| 0.1 | 3.1 | GO:0004709 | MAP kinase kinase kinase activity(GO:0004709) |
| 0.1 | 1.0 | GO:0004691 | cAMP-dependent protein kinase activity(GO:0004691) |
| 0.1 | 0.4 | GO:0003880 | protein C-terminal carboxyl O-methyltransferase activity(GO:0003880) |
| 0.1 | 0.8 | GO:0004687 | myosin light chain kinase activity(GO:0004687) |
| 0.1 | 1.1 | GO:0001054 | RNA polymerase I activity(GO:0001054) |
| 0.1 | 0.4 | GO:0034211 | GTP-dependent protein kinase activity(GO:0034211) |
| 0.1 | 0.8 | GO:0016812 | hydrolase activity, acting on carbon-nitrogen (but not peptide) bonds, in cyclic amides(GO:0016812) |
| 0.1 | 0.5 | GO:0060698 | endoribonuclease inhibitor activity(GO:0060698) |
| 0.1 | 0.4 | GO:0016454 | serine C-palmitoyltransferase activity(GO:0004758) C-palmitoyltransferase activity(GO:0016454) |
| 0.1 | 1.7 | GO:0070513 | death domain binding(GO:0070513) |
| 0.1 | 0.9 | GO:1990381 | ubiquitin-specific protease binding(GO:1990381) |
| 0.1 | 0.5 | GO:0004966 | galanin receptor activity(GO:0004966) |
| 0.1 | 0.8 | GO:0046790 | virion binding(GO:0046790) |
| 0.1 | 1.7 | GO:0023026 | MHC class II protein complex binding(GO:0023026) |
| 0.1 | 0.1 | GO:0071723 | lipopeptide binding(GO:0071723) |
| 0.1 | 1.0 | GO:0030881 | beta-2-microglobulin binding(GO:0030881) |
| 0.1 | 1.2 | GO:0019531 | oxalate transmembrane transporter activity(GO:0019531) |
| 0.1 | 2.2 | GO:0008009 | chemokine activity(GO:0008009) |
| 0.1 | 0.3 | GO:0001055 | RNA polymerase II activity(GO:0001055) |
| 0.1 | 2.5 | GO:0005164 | tumor necrosis factor receptor binding(GO:0005164) |
| 0.1 | 0.4 | GO:0036402 | proteasome-activating ATPase activity(GO:0036402) |
| 0.1 | 0.2 | GO:0004161 | dimethylallyltranstransferase activity(GO:0004161) geranyltranstransferase activity(GO:0004337) |
| 0.1 | 0.9 | GO:0034450 | ubiquitin-ubiquitin ligase activity(GO:0034450) |
| 0.1 | 12.9 | GO:0001046 | core promoter sequence-specific DNA binding(GO:0001046) |
| 0.1 | 1.5 | GO:0005337 | nucleoside transmembrane transporter activity(GO:0005337) |
| 0.1 | 0.8 | GO:0071837 | HMG box domain binding(GO:0071837) |
| 0.1 | 1.3 | GO:0042605 | peptide antigen binding(GO:0042605) |
| 0.1 | 5.5 | GO:0004896 | cytokine receptor activity(GO:0004896) |
| 0.1 | 4.3 | GO:0005080 | protein kinase C binding(GO:0005080) |
| 0.1 | 1.3 | GO:0070530 | K63-linked polyubiquitin binding(GO:0070530) |
| 0.1 | 18.8 | GO:0003924 | GTPase activity(GO:0003924) |
| 0.0 | 2.1 | GO:0016504 | peptidase activator activity(GO:0016504) |
| 0.0 | 10.4 | GO:0004252 | serine-type endopeptidase activity(GO:0004252) |
| 0.0 | 0.1 | GO:0004813 | alanine-tRNA ligase activity(GO:0004813) |
| 0.0 | 0.1 | GO:0010858 | calcium-dependent protein kinase regulator activity(GO:0010858) |
| 0.0 | 0.2 | GO:0003917 | DNA topoisomerase type I activity(GO:0003917) |
| 0.0 | 0.1 | GO:0004489 | methylenetetrahydrofolate reductase (NAD(P)H) activity(GO:0004489) |
| 0.0 | 0.2 | GO:0016608 | growth hormone-releasing hormone activity(GO:0016608) |
| 0.0 | 3.9 | GO:0051087 | chaperone binding(GO:0051087) |
| 0.0 | 6.5 | GO:0004867 | serine-type endopeptidase inhibitor activity(GO:0004867) |
| 0.0 | 0.7 | GO:0035325 | Toll-like receptor binding(GO:0035325) |
| 0.0 | 2.5 | GO:0005547 | phosphatidylinositol-3,4,5-trisphosphate binding(GO:0005547) |
| 0.0 | 2.0 | GO:0043425 | bHLH transcription factor binding(GO:0043425) |
| 0.0 | 3.3 | GO:0001047 | core promoter binding(GO:0001047) |
| 0.0 | 2.4 | GO:0030374 | ligand-dependent nuclear receptor transcription coactivator activity(GO:0030374) |
| 0.0 | 0.2 | GO:0004483 | mRNA (nucleoside-2'-O-)-methyltransferase activity(GO:0004483) |
| 0.0 | 1.4 | GO:0008139 | nuclear localization sequence binding(GO:0008139) |
| 0.0 | 1.7 | GO:0032266 | phosphatidylinositol-3-phosphate binding(GO:0032266) |
| 0.0 | 0.8 | GO:0032036 | myosin heavy chain binding(GO:0032036) structural molecule activity conferring elasticity(GO:0097493) |
| 0.0 | 0.4 | GO:0048531 | beta-1,3-galactosyltransferase activity(GO:0048531) |
| 0.0 | 0.1 | GO:0008113 | peptide-methionine (S)-S-oxide reductase activity(GO:0008113) |
| 0.0 | 4.3 | GO:0003705 | transcription factor activity, RNA polymerase II distal enhancer sequence-specific binding(GO:0003705) |
| 0.0 | 0.8 | GO:0002162 | dystroglycan binding(GO:0002162) |
| 0.0 | 0.5 | GO:0017166 | vinculin binding(GO:0017166) |
| 0.0 | 0.7 | GO:0005537 | mannose binding(GO:0005537) |
| 0.0 | 0.4 | GO:0047372 | acylglycerol lipase activity(GO:0047372) |
| 0.0 | 0.3 | GO:0008597 | calcium-dependent protein serine/threonine phosphatase regulator activity(GO:0008597) |
| 0.0 | 0.4 | GO:0005159 | insulin-like growth factor receptor binding(GO:0005159) |
| 0.0 | 1.4 | GO:0005109 | frizzled binding(GO:0005109) |
| 0.0 | 0.3 | GO:0086080 | protein binding involved in heterotypic cell-cell adhesion(GO:0086080) |
| 0.0 | 0.2 | GO:0031493 | nucleosomal histone binding(GO:0031493) |
| 0.0 | 2.6 | GO:0004843 | thiol-dependent ubiquitin-specific protease activity(GO:0004843) |
| 0.0 | 0.5 | GO:0042975 | peroxisome proliferator activated receptor binding(GO:0042975) |
| 0.0 | 7.3 | GO:0030246 | carbohydrate binding(GO:0030246) |
| 0.0 | 0.1 | GO:0005136 | interleukin-4 receptor binding(GO:0005136) |
| 0.0 | 0.1 | GO:0033149 | FFAT motif binding(GO:0033149) |
| 0.0 | 1.3 | GO:0050699 | WW domain binding(GO:0050699) |
| 0.0 | 0.5 | GO:0017049 | GTP-Rho binding(GO:0017049) |
| 0.0 | 0.8 | GO:0030331 | estrogen receptor binding(GO:0030331) |
| 0.0 | 1.5 | GO:0016811 | hydrolase activity, acting on carbon-nitrogen (but not peptide) bonds, in linear amides(GO:0016811) |
| 0.0 | 0.3 | GO:0015035 | protein disulfide oxidoreductase activity(GO:0015035) |
| 0.0 | 0.4 | GO:0001530 | lipopolysaccharide binding(GO:0001530) |
| 0.0 | 0.3 | GO:0015279 | store-operated calcium channel activity(GO:0015279) |
| 0.0 | 2.8 | GO:0008083 | growth factor activity(GO:0008083) |
| 0.0 | 0.5 | GO:0016538 | cyclin-dependent protein serine/threonine kinase regulator activity(GO:0016538) |
| 0.0 | 0.3 | GO:0019841 | retinol binding(GO:0019841) |
| 0.0 | 0.4 | GO:0043539 | protein serine/threonine kinase activator activity(GO:0043539) |
| 0.0 | 6.4 | GO:0005096 | GTPase activator activity(GO:0005096) |
| 0.0 | 0.1 | GO:0031811 | G-protein coupled nucleotide receptor binding(GO:0031811) P2Y1 nucleotide receptor binding(GO:0031812) |
| 0.0 | 0.3 | GO:0070577 | lysine-acetylated histone binding(GO:0070577) |
| 0.0 | 0.0 | GO:0005457 | GDP-fucose transmembrane transporter activity(GO:0005457) purine nucleotide-sugar transmembrane transporter activity(GO:0036080) |
| 0.0 | 4.0 | GO:0004721 | phosphoprotein phosphatase activity(GO:0004721) |
| 0.0 | 0.2 | GO:0008020 | G-protein coupled photoreceptor activity(GO:0008020) |
| 0.0 | 0.2 | GO:0050700 | CARD domain binding(GO:0050700) |
| 0.0 | 0.4 | GO:0003951 | NAD+ kinase activity(GO:0003951) |
| 0.0 | 0.3 | GO:0016780 | phosphotransferase activity, for other substituted phosphate groups(GO:0016780) |
| 0.0 | 1.4 | GO:0019905 | syntaxin binding(GO:0019905) |
| 0.0 | 1.3 | GO:0005179 | hormone activity(GO:0005179) |
| 0.0 | 1.3 | GO:0001085 | RNA polymerase II transcription factor binding(GO:0001085) |
| 0.0 | 0.1 | GO:0001594 | trace-amine receptor activity(GO:0001594) |
Gene overrepresentation in curated gene sets: canonical pathways category:
| Log-likelihood per target | Total log-likelihood | Term | Description |
|---|---|---|---|
| 1.1 | 16.1 | ST INTERFERON GAMMA PATHWAY | Interferon gamma pathway. |
| 0.9 | 30.3 | PID INTEGRIN2 PATHWAY | Beta2 integrin cell surface interactions |
| 0.5 | 11.3 | PID INTEGRIN5 PATHWAY | Beta5 beta6 beta7 and beta8 integrin cell surface interactions |
| 0.4 | 110.6 | NABA ECM REGULATORS | Genes encoding enzymes and their regulators involved in the remodeling of the extracellular matrix |
| 0.4 | 1.6 | PID PI3KCI AKT PATHWAY | Class I PI3K signaling events mediated by Akt |
| 0.4 | 4.3 | PID IL5 PATHWAY | IL5-mediated signaling events |
| 0.4 | 21.1 | PID IL23 PATHWAY | IL23-mediated signaling events |
| 0.3 | 1.0 | ST TYPE I INTERFERON PATHWAY | Type I Interferon (alpha/beta IFN) Pathway |
| 0.3 | 14.3 | PID CD8 TCR DOWNSTREAM PATHWAY | Downstream signaling in naïve CD8+ T cells |
| 0.3 | 3.6 | PID IL12 STAT4 PATHWAY | IL12 signaling mediated by STAT4 |
| 0.3 | 19.6 | PID IL2 1PATHWAY | IL2-mediated signaling events |
| 0.2 | 27.2 | PID HIF1 TFPATHWAY | HIF-1-alpha transcription factor network |
| 0.2 | 8.4 | PID TCR CALCIUM PATHWAY | Calcium signaling in the CD4+ TCR pathway |
| 0.2 | 2.3 | PID IL27 PATHWAY | IL27-mediated signaling events |
| 0.2 | 2.4 | PID GMCSF PATHWAY | GMCSF-mediated signaling events |
| 0.2 | 10.9 | PID IL4 2PATHWAY | IL4-mediated signaling events |
| 0.1 | 2.0 | ST INTERLEUKIN 4 PATHWAY | Interleukin 4 (IL-4) Pathway |
| 0.1 | 27.5 | NABA ECM AFFILIATED | Genes encoding proteins affiliated structurally or functionally to extracellular matrix proteins |
| 0.1 | 9.6 | PID ILK PATHWAY | Integrin-linked kinase signaling |
| 0.1 | 3.7 | PID AMB2 NEUTROPHILS PATHWAY | amb2 Integrin signaling |
| 0.1 | 1.1 | PID IL2 PI3K PATHWAY | IL2 signaling events mediated by PI3K |
| 0.1 | 2.3 | PID SYNDECAN 4 PATHWAY | Syndecan-4-mediated signaling events |
| 0.1 | 4.1 | PID PTP1B PATHWAY | Signaling events mediated by PTP1B |
| 0.1 | 3.0 | PID RAS PATHWAY | Regulation of Ras family activation |
| 0.1 | 2.9 | ST JNK MAPK PATHWAY | JNK MAPK Pathway |
| 0.1 | 1.2 | PID IL6 7 PATHWAY | IL6-mediated signaling events |
| 0.1 | 1.5 | PID P38 ALPHA BETA PATHWAY | Regulation of p38-alpha and p38-beta |
| 0.1 | 15.9 | NABA ECM GLYCOPROTEINS | Genes encoding structural ECM glycoproteins |
| 0.1 | 0.7 | PID INTEGRIN A9B1 PATHWAY | Alpha9 beta1 integrin signaling events |
| 0.1 | 3.3 | PID FCER1 PATHWAY | Fc-epsilon receptor I signaling in mast cells |
| 0.1 | 2.7 | PID HNF3A PATHWAY | FOXA1 transcription factor network |
| 0.1 | 1.9 | PID RHODOPSIN PATHWAY | Visual signal transduction: Rods |
| 0.1 | 1.2 | PID RET PATHWAY | Signaling events regulated by Ret tyrosine kinase |
| 0.0 | 0.7 | PID FGF PATHWAY | FGF signaling pathway |
| 0.0 | 1.9 | NABA PROTEOGLYCANS | Genes encoding proteoglycans |
| 0.0 | 1.0 | PID DNA PK PATHWAY | DNA-PK pathway in nonhomologous end joining |
| 0.0 | 0.5 | PID NECTIN PATHWAY | Nectin adhesion pathway |
| 0.0 | 1.3 | PID A6B1 A6B4 INTEGRIN PATHWAY | a6b1 and a6b4 Integrin signaling |
| 0.0 | 0.6 | PID INTEGRIN3 PATHWAY | Beta3 integrin cell surface interactions |
| 0.0 | 1.0 | PID THROMBIN PAR1 PATHWAY | PAR1-mediated thrombin signaling events |
| 0.0 | 1.2 | PID ARF6 PATHWAY | Arf6 signaling events |
| 0.0 | 0.6 | ST PHOSPHOINOSITIDE 3 KINASE PATHWAY | PI3K Pathway |
| 0.0 | 0.7 | PID KIT PATHWAY | Signaling events mediated by Stem cell factor receptor (c-Kit) |
| 0.0 | 1.4 | PID LYSOPHOSPHOLIPID PATHWAY | LPA receptor mediated events |
| 0.0 | 0.7 | PID FOXM1 PATHWAY | FOXM1 transcription factor network |
| 0.0 | 0.3 | PID CD8 TCR PATHWAY | TCR signaling in naïve CD8+ T cells |
| 0.0 | 1.5 | PID CASPASE PATHWAY | Caspase cascade in apoptosis |
| 0.0 | 1.2 | PID P53 REGULATION PATHWAY | p53 pathway |
| 0.0 | 0.4 | PID TOLL ENDOGENOUS PATHWAY | Endogenous TLR signaling |
| 0.0 | 0.5 | SIG INSULIN RECEPTOR PATHWAY IN CARDIAC MYOCYTES | Genes related to the insulin receptor pathway |
| 0.0 | 1.9 | WNT SIGNALING | Genes related to Wnt-mediated signal transduction |
Gene overrepresentation in curated gene sets: REACTOME pathways category:
| Log-likelihood per target | Total log-likelihood | Term | Description |
|---|---|---|---|
| 1.9 | 15.3 | REACTOME CREATION OF C4 AND C2 ACTIVATORS | Genes involved in Creation of C4 and C2 activators |
| 1.2 | 18.6 | REACTOME SYNTHESIS OF BILE ACIDS AND BILE SALTS VIA 24 HYDROXYCHOLESTEROL | Genes involved in Synthesis of bile acids and bile salts via 24-hydroxycholesterol |
| 1.2 | 20.2 | REACTOME COMMON PATHWAY | Genes involved in Common Pathway |
| 1.0 | 12.0 | REACTOME REGULATION OF IFNA SIGNALING | Genes involved in Regulation of IFNA signaling |
| 0.9 | 18.6 | REACTOME INTRINSIC PATHWAY | Genes involved in Intrinsic Pathway |
| 0.8 | 44.5 | REACTOME GROWTH HORMONE RECEPTOR SIGNALING | Genes involved in Growth hormone receptor signaling |
| 0.5 | 20.8 | REACTOME METAL ION SLC TRANSPORTERS | Genes involved in Metal ion SLC transporters |
| 0.3 | 20.5 | REACTOME IMMUNOREGULATORY INTERACTIONS BETWEEN A LYMPHOID AND A NON LYMPHOID CELL | Genes involved in Immunoregulatory interactions between a Lymphoid and a non-Lymphoid cell |
| 0.3 | 3.3 | REACTOME GLYCOPROTEIN HORMONES | Genes involved in Glycoprotein hormones |
| 0.3 | 7.6 | REACTOME AMYLOIDS | Genes involved in Amyloids |
| 0.3 | 4.5 | REACTOME ADVANCED GLYCOSYLATION ENDPRODUCT RECEPTOR SIGNALING | Genes involved in Advanced glycosylation endproduct receptor signaling |
| 0.3 | 1.5 | REACTOME IL 6 SIGNALING | Genes involved in Interleukin-6 signaling |
| 0.2 | 4.6 | REACTOME GLYCOGEN BREAKDOWN GLYCOGENOLYSIS | Genes involved in Glycogen breakdown (glycogenolysis) |
| 0.2 | 10.2 | REACTOME CHEMOKINE RECEPTORS BIND CHEMOKINES | Genes involved in Chemokine receptors bind chemokines |
| 0.2 | 4.4 | REACTOME HS GAG DEGRADATION | Genes involved in HS-GAG degradation |
| 0.2 | 2.6 | REACTOME NEGATIVE REGULATION OF THE PI3K AKT NETWORK | Genes involved in Negative regulation of the PI3K/AKT network |
| 0.2 | 4.8 | REACTOME TRAF6 MEDIATED IRF7 ACTIVATION | Genes involved in TRAF6 mediated IRF7 activation |
| 0.2 | 1.6 | REACTOME APOPTOSIS INDUCED DNA FRAGMENTATION | Genes involved in Apoptosis induced DNA fragmentation |
| 0.2 | 2.5 | REACTOME HYALURONAN METABOLISM | Genes involved in Hyaluronan metabolism |
| 0.2 | 2.9 | REACTOME ANTIGEN PRESENTATION FOLDING ASSEMBLY AND PEPTIDE LOADING OF CLASS I MHC | Genes involved in Antigen Presentation: Folding, assembly and peptide loading of class I MHC |
| 0.1 | 3.1 | REACTOME REGULATION OF INSULIN LIKE GROWTH FACTOR IGF ACTIVITY BY INSULIN LIKE GROWTH FACTOR BINDING PROTEINS IGFBPS | Genes involved in Regulation of Insulin-like Growth Factor (IGF) Activity by Insulin-like Growth Factor Binding Proteins (IGFBPs) |
| 0.1 | 1.5 | REACTOME NFKB ACTIVATION THROUGH FADD RIP1 PATHWAY MEDIATED BY CASPASE 8 AND10 | Genes involved in NF-kB activation through FADD/RIP-1 pathway mediated by caspase-8 and -10 |
| 0.1 | 2.8 | REACTOME COMPLEMENT CASCADE | Genes involved in Complement cascade |
| 0.1 | 1.2 | REACTOME DEFENSINS | Genes involved in Defensins |
| 0.1 | 1.7 | REACTOME ACTIVATION OF THE AP1 FAMILY OF TRANSCRIPTION FACTORS | Genes involved in Activation of the AP-1 family of transcription factors |
| 0.1 | 1.6 | REACTOME PASSIVE TRANSPORT BY AQUAPORINS | Genes involved in Passive Transport by Aquaporins |
| 0.1 | 4.2 | REACTOME YAP1 AND WWTR1 TAZ STIMULATED GENE EXPRESSION | Genes involved in YAP1- and WWTR1 (TAZ)-stimulated gene expression |
| 0.1 | 2.9 | REACTOME CELL EXTRACELLULAR MATRIX INTERACTIONS | Genes involved in Cell-extracellular matrix interactions |
| 0.1 | 0.8 | REACTOME ACTIVATION OF CHAPERONE GENES BY ATF6 ALPHA | Genes involved in Activation of Chaperone Genes by ATF6-alpha |
| 0.1 | 1.1 | REACTOME TRANSCRIPTIONAL REGULATION OF WHITE ADIPOCYTE DIFFERENTIATION | Genes involved in Transcriptional Regulation of White Adipocyte Differentiation |
| 0.1 | 4.0 | REACTOME IL RECEPTOR SHC SIGNALING | Genes involved in Interleukin receptor SHC signaling |
| 0.1 | 6.1 | REACTOME STRIATED MUSCLE CONTRACTION | Genes involved in Striated Muscle Contraction |
| 0.1 | 1.0 | REACTOME ANDROGEN BIOSYNTHESIS | Genes involved in Androgen biosynthesis |
| 0.1 | 2.1 | REACTOME NA CL DEPENDENT NEUROTRANSMITTER TRANSPORTERS | Genes involved in Na+/Cl- dependent neurotransmitter transporters |
| 0.1 | 8.7 | REACTOME INTEGRIN CELL SURFACE INTERACTIONS | Genes involved in Integrin cell surface interactions |
| 0.1 | 2.8 | REACTOME SMOOTH MUSCLE CONTRACTION | Genes involved in Smooth Muscle Contraction |
| 0.1 | 1.7 | REACTOME SIGNALING BY FGFR3 MUTANTS | Genes involved in Signaling by FGFR3 mutants |
| 0.1 | 1.1 | REACTOME THE NLRP3 INFLAMMASOME | Genes involved in The NLRP3 inflammasome |
| 0.1 | 2.4 | REACTOME SYNTHESIS OF PC | Genes involved in Synthesis of PC |
| 0.1 | 1.0 | REACTOME CD28 DEPENDENT VAV1 PATHWAY | Genes involved in CD28 dependent Vav1 pathway |
| 0.1 | 4.3 | REACTOME GLUCAGON TYPE LIGAND RECEPTORS | Genes involved in Glucagon-type ligand receptors |
| 0.1 | 3.3 | REACTOME CROSS PRESENTATION OF SOLUBLE EXOGENOUS ANTIGENS ENDOSOMES | Genes involved in Cross-presentation of soluble exogenous antigens (endosomes) |
| 0.1 | 1.4 | REACTOME HS GAG BIOSYNTHESIS | Genes involved in HS-GAG biosynthesis |
| 0.1 | 4.5 | REACTOME METABOLISM OF VITAMINS AND COFACTORS | Genes involved in Metabolism of vitamins and cofactors |
| 0.1 | 1.9 | REACTOME INTERFERON ALPHA BETA SIGNALING | Genes involved in Interferon alpha/beta signaling |
| 0.0 | 0.7 | REACTOME TRAFFICKING AND PROCESSING OF ENDOSOMAL TLR | Genes involved in Trafficking and processing of endosomal TLR |
| 0.0 | 1.0 | REACTOME RAP1 SIGNALLING | Genes involved in Rap1 signalling |
| 0.0 | 1.8 | REACTOME TIGHT JUNCTION INTERACTIONS | Genes involved in Tight junction interactions |
| 0.0 | 0.6 | REACTOME REGULATION OF PYRUVATE DEHYDROGENASE PDH COMPLEX | Genes involved in Regulation of pyruvate dehydrogenase (PDH) complex |
| 0.0 | 2.9 | REACTOME NOTCH1 INTRACELLULAR DOMAIN REGULATES TRANSCRIPTION | Genes involved in NOTCH1 Intracellular Domain Regulates Transcription |
| 0.0 | 1.5 | REACTOME BMAL1 CLOCK NPAS2 ACTIVATES CIRCADIAN EXPRESSION | Genes involved in BMAL1:CLOCK/NPAS2 Activates Circadian Expression |
| 0.0 | 1.7 | REACTOME REGULATION OF BETA CELL DEVELOPMENT | Genes involved in Regulation of beta-cell development |
| 0.0 | 1.1 | REACTOME RNA POL I TRANSCRIPTION TERMINATION | Genes involved in RNA Polymerase I Transcription Termination |
| 0.0 | 0.2 | REACTOME RNA POL I TRANSCRIPTION INITIATION | Genes involved in RNA Polymerase I Transcription Initiation |
| 0.0 | 0.7 | REACTOME METABOLISM OF POLYAMINES | Genes involved in Metabolism of polyamines |
| 0.0 | 0.3 | REACTOME TRAF6 MEDIATED IRF7 ACTIVATION IN TLR7 8 OR 9 SIGNALING | Genes involved in TRAF6 mediated IRF7 activation in TLR7/8 or 9 signaling |
| 0.0 | 1.0 | REACTOME IL1 SIGNALING | Genes involved in Interleukin-1 signaling |
| 0.0 | 1.9 | REACTOME PLC BETA MEDIATED EVENTS | Genes involved in PLC beta mediated events |
| 0.0 | 0.3 | REACTOME ELEVATION OF CYTOSOLIC CA2 LEVELS | Genes involved in Elevation of cytosolic Ca2+ levels |
| 0.0 | 0.6 | REACTOME SYNTHESIS SECRETION AND INACTIVATION OF GIP | Genes involved in Synthesis, Secretion, and Inactivation of Glucose-dependent Insulinotropic Polypeptide (GIP) |
| 0.0 | 0.6 | REACTOME DEADENYLATION OF MRNA | Genes involved in Deadenylation of mRNA |
| 0.0 | 0.9 | REACTOME NOD1 2 SIGNALING PATHWAY | Genes involved in NOD1/2 Signaling Pathway |
| 0.0 | 0.2 | REACTOME PLATELET AGGREGATION PLUG FORMATION | Genes involved in Platelet Aggregation (Plug Formation) |
| 0.0 | 1.4 | REACTOME GLUTATHIONE CONJUGATION | Genes involved in Glutathione conjugation |
| 0.0 | 0.7 | REACTOME MITOCHONDRIAL TRNA AMINOACYLATION | Genes involved in Mitochondrial tRNA aminoacylation |
| 0.0 | 0.3 | REACTOME GLUCURONIDATION | Genes involved in Glucuronidation |
| 0.0 | 1.6 | REACTOME COLLAGEN FORMATION | Genes involved in Collagen formation |
| 0.0 | 0.6 | REACTOME PROCESSING OF INTRONLESS PRE MRNAS | Genes involved in Processing of Intronless Pre-mRNAs |
| 0.0 | 0.2 | REACTOME CALNEXIN CALRETICULIN CYCLE | Genes involved in Calnexin/calreticulin cycle |
| 0.0 | 1.3 | REACTOME MEIOTIC SYNAPSIS | Genes involved in Meiotic Synapsis |
| 0.0 | 0.1 | REACTOME TRAF6 MEDIATED INDUCTION OF TAK1 COMPLEX | Genes involved in TRAF6 mediated induction of TAK1 complex |
| 0.0 | 1.1 | REACTOME TRANSPORT OF VITAMINS NUCLEOSIDES AND RELATED MOLECULES | Genes involved in Transport of vitamins, nucleosides, and related molecules |
| 0.0 | 0.2 | REACTOME NUCLEOTIDE BINDING DOMAIN LEUCINE RICH REPEAT CONTAINING RECEPTOR NLR SIGNALING PATHWAYS | Genes involved in Nucleotide-binding domain, leucine rich repeat containing receptor (NLR) signaling pathways |
| 0.0 | 0.3 | REACTOME VIRAL MESSENGER RNA SYNTHESIS | Genes involved in Viral Messenger RNA Synthesis |
| 0.0 | 0.3 | REACTOME SYNTHESIS OF PIPS AT THE LATE ENDOSOME MEMBRANE | Genes involved in Synthesis of PIPs at the late endosome membrane |
| 0.0 | 0.7 | REACTOME LYSOSOME VESICLE BIOGENESIS | Genes involved in Lysosome Vesicle Biogenesis |
| 0.0 | 0.8 | REACTOME GOLGI ASSOCIATED VESICLE BIOGENESIS | Genes involved in Golgi Associated Vesicle Biogenesis |
| 0.0 | 1.3 | REACTOME NUCLEAR RECEPTOR TRANSCRIPTION PATHWAY | Genes involved in Nuclear Receptor transcription pathway |
| 0.0 | 0.2 | REACTOME TETRAHYDROBIOPTERIN BH4 SYNTHESIS RECYCLING SALVAGE AND REGULATION | Genes involved in Tetrahydrobiopterin (BH4) synthesis, recycling, salvage and regulation |
| 0.0 | 0.3 | REACTOME METABOLISM OF PORPHYRINS | Genes involved in Metabolism of porphyrins |
| 0.0 | 0.5 | REACTOME NUCLEAR SIGNALING BY ERBB4 | Genes involved in Nuclear signaling by ERBB4 |
| 0.0 | 0.3 | REACTOME GAP JUNCTION ASSEMBLY | Genes involved in Gap junction assembly |
| 0.0 | 0.3 | REACTOME GABA A RECEPTOR ACTIVATION | Genes involved in GABA A receptor activation |
| 0.0 | 1.0 | REACTOME NRAGE SIGNALS DEATH THROUGH JNK | Genes involved in NRAGE signals death through JNK |
| 0.0 | 0.2 | REACTOME AUTODEGRADATION OF CDH1 BY CDH1 APC C | Genes involved in Autodegradation of Cdh1 by Cdh1:APC/C |
| 0.0 | 0.7 | REACTOME CLASS B 2 SECRETIN FAMILY RECEPTORS | Genes involved in Class B/2 (Secretin family receptors) |