Project
12D miR HR13_24
Navigation
Downloads
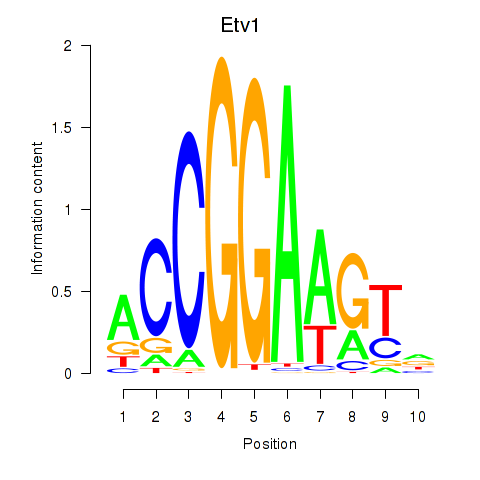
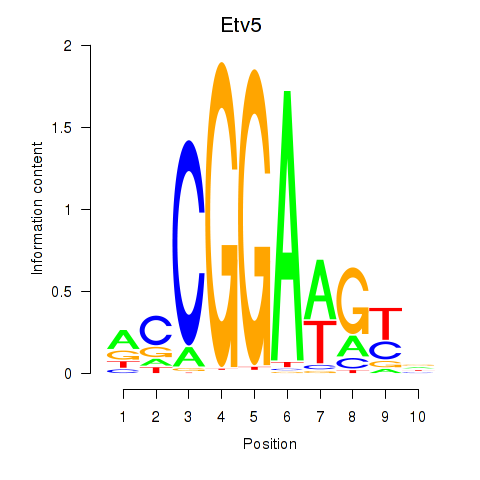
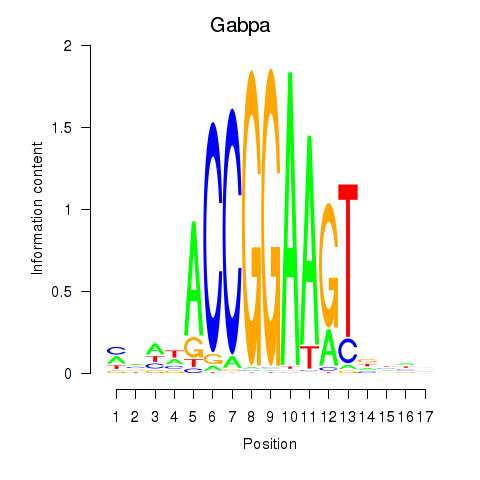
Results for Etv1_Etv5_Gabpa
Z-value: 3.31
Motif logo
Transcription factors associated with Etv1_Etv5_Gabpa
| Gene Symbol | Gene ID | Gene Info |
|---|---|---|
|
Etv1
|
ENSMUSG00000004151.10 | ets variant 1 |
|
Etv5
|
ENSMUSG00000013089.9 | ets variant 5 |
|
Gabpa
|
ENSMUSG00000008976.10 | GA repeat binding protein, alpha |
Activity-expression correlation:
| Gene | Promoter | Pearson corr. coef. | P-value | Plot |
|---|---|---|---|---|
| Gabpa | mm10_v2_chr16_+_84835070_84835124 | 0.96 | 2.7e-06 | Click! |
| Etv1 | mm10_v2_chr12_+_38783503_38783527 | 0.96 | 4.5e-06 | Click! |
| Etv5 | mm10_v2_chr16_-_22439719_22439733 | -0.90 | 1.4e-04 | Click! |
Activity profile of Etv1_Etv5_Gabpa motif
Sorted Z-values of Etv1_Etv5_Gabpa motif
| Promoter | Log-likelihood | Transcript | Gene | Gene Info |
|---|---|---|---|---|
| chr7_-_127042420 | 9.91 |
ENSMUST00000032915.6
|
Kif22
|
kinesin family member 22 |
| chr19_+_6084983 | 9.69 |
ENSMUST00000025704.2
|
Cdca5
|
cell division cycle associated 5 |
| chr7_-_122132844 | 9.24 |
ENSMUST00000106469.1
ENSMUST00000063587.6 ENSMUST00000106468.1 ENSMUST00000130149.1 ENSMUST00000098068.3 |
Palb2
|
partner and localizer of BRCA2 |
| chr18_+_36760214 | 8.93 |
ENSMUST00000049323.7
|
Wdr55
|
WD repeat domain 55 |
| chr2_+_118814195 | 8.61 |
ENSMUST00000110842.1
|
Knstrn
|
kinetochore-localized astrin/SPAG5 binding |
| chr17_-_33890584 | 8.48 |
ENSMUST00000114361.2
ENSMUST00000173492.1 |
Kifc1
|
kinesin family member C1 |
| chr2_+_152847961 | 8.27 |
ENSMUST00000164120.1
ENSMUST00000178997.1 ENSMUST00000109816.1 |
Tpx2
|
TPX2, microtubule-associated protein homolog (Xenopus laevis) |
| chr16_-_18811972 | 8.02 |
ENSMUST00000000028.7
ENSMUST00000115585.1 |
Cdc45
|
cell division cycle 45 |
| chr11_-_94653964 | 7.72 |
ENSMUST00000039949.4
|
Eme1
|
essential meiotic endonuclease 1 homolog 1 (S. pombe) |
| chr16_+_48994185 | 7.59 |
ENSMUST00000117994.1
ENSMUST00000048374.5 |
C330027C09Rik
|
RIKEN cDNA C330027C09 gene |
| chr6_-_8259098 | 7.50 |
ENSMUST00000012627.4
|
Rpa3
|
replication protein A3 |
| chr2_+_152847993 | 7.42 |
ENSMUST00000028969.8
|
Tpx2
|
TPX2, microtubule-associated protein homolog (Xenopus laevis) |
| chr2_+_118813995 | 7.39 |
ENSMUST00000134661.1
|
Knstrn
|
kinetochore-localized astrin/SPAG5 binding |
| chr15_-_102350692 | 7.31 |
ENSMUST00000041208.7
|
Aaas
|
achalasia, adrenocortical insufficiency, alacrimia |
| chr17_-_33890539 | 7.27 |
ENSMUST00000173386.1
|
Kifc1
|
kinesin family member C1 |
| chr7_-_62420139 | 6.78 |
ENSMUST00000094340.3
|
Mkrn3
|
makorin, ring finger protein, 3 |
| chr4_+_149485215 | 6.78 |
ENSMUST00000124413.1
ENSMUST00000141293.1 |
Lzic
|
leucine zipper and CTNNBIP1 domain containing |
| chr2_+_118814237 | 6.73 |
ENSMUST00000028803.7
ENSMUST00000126045.1 |
Knstrn
|
kinetochore-localized astrin/SPAG5 binding |
| chr10_-_88146867 | 6.68 |
ENSMUST00000164121.1
ENSMUST00000164803.1 ENSMUST00000168163.1 ENSMUST00000048518.9 |
Parpbp
|
PARP1 binding protein |
| chr17_-_33955658 | 6.56 |
ENSMUST00000174609.2
ENSMUST00000008812.7 |
Rps18
|
ribosomal protein S18 |
| chrX_+_100625737 | 6.43 |
ENSMUST00000048962.3
|
Kif4
|
kinesin family member 4 |
| chr2_-_73386396 | 6.14 |
ENSMUST00000112044.1
ENSMUST00000112043.1 ENSMUST00000076463.5 |
Gpr155
|
G protein-coupled receptor 155 |
| chr4_+_108847827 | 6.03 |
ENSMUST00000102738.2
|
Kti12
|
KTI12 homolog, chromatin associated (S. cerevisiae) |
| chr6_+_113531675 | 5.99 |
ENSMUST00000036340.5
ENSMUST00000101051.2 |
Fancd2
|
Fanconi anemia, complementation group D2 |
| chr17_-_29264115 | 5.90 |
ENSMUST00000024802.8
|
Ppil1
|
peptidylprolyl isomerase (cyclophilin)-like 1 |
| chr17_+_26917091 | 5.89 |
ENSMUST00000078961.4
|
Kifc5b
|
kinesin family member C5B |
| chr1_-_169531343 | 5.82 |
ENSMUST00000028000.7
|
Nuf2
|
NUF2, NDC80 kinetochore complex component, homolog (S. cerevisiae) |
| chr8_+_69808672 | 5.79 |
ENSMUST00000036074.8
ENSMUST00000123453.1 |
Gmip
|
Gem-interacting protein |
| chr3_-_129831374 | 5.70 |
ENSMUST00000029643.8
|
Gar1
|
GAR1 ribonucleoprotein homolog (yeast) |
| chr6_+_124712279 | 5.68 |
ENSMUST00000004375.9
|
Phb2
|
prohibitin 2 |
| chr11_-_106779483 | 5.66 |
ENSMUST00000021060.5
|
Polg2
|
polymerase (DNA directed), gamma 2, accessory subunit |
| chr1_-_169531447 | 5.61 |
ENSMUST00000111368.1
|
Nuf2
|
NUF2, NDC80 kinetochore complex component, homolog (S. cerevisiae) |
| chr2_+_109280738 | 5.56 |
ENSMUST00000028527.7
|
Kif18a
|
kinesin family member 18A |
| chr3_+_108383829 | 5.53 |
ENSMUST00000090561.3
ENSMUST00000102629.1 ENSMUST00000128089.1 |
Psrc1
|
proline/serine-rich coiled-coil 1 |
| chr14_-_57826128 | 5.51 |
ENSMUST00000022536.2
|
Ska3
|
spindle and kinetochore associated complex subunit 3 |
| chr4_-_43499608 | 5.50 |
ENSMUST00000136005.1
ENSMUST00000054538.6 |
Arhgef39
|
Rho guanine nucleotide exchange factor (GEF) 39 |
| chr5_-_92435114 | 5.47 |
ENSMUST00000135112.1
|
Nup54
|
nucleoporin 54 |
| chr6_+_4755327 | 5.17 |
ENSMUST00000176551.1
|
Peg10
|
paternally expressed 10 |
| chr19_-_9899450 | 5.12 |
ENSMUST00000025562.7
|
Incenp
|
inner centromere protein |
| chr10_-_89732253 | 5.03 |
ENSMUST00000020109.3
|
Actr6
|
ARP6 actin-related protein 6 |
| chr9_+_107950952 | 5.01 |
ENSMUST00000049348.3
|
Traip
|
TRAF-interacting protein |
| chr11_+_86683985 | 5.01 |
ENSMUST00000108022.1
ENSMUST00000108021.1 |
Ptrh2
|
peptidyl-tRNA hydrolase 2 |
| chr17_+_24632671 | 4.98 |
ENSMUST00000047611.2
|
Nthl1
|
nth (endonuclease III)-like 1 (E.coli) |
| chr2_-_113848601 | 4.91 |
ENSMUST00000110949.2
|
Arhgap11a
|
Rho GTPase activating protein 11A |
| chr7_+_79743142 | 4.90 |
ENSMUST00000035622.7
|
Wdr93
|
WD repeat domain 93 |
| chr1_-_186749304 | 4.89 |
ENSMUST00000001339.5
|
Rrp15
|
ribosomal RNA processing 15 homolog (S. cerevisiae) |
| chr6_-_100671126 | 4.85 |
ENSMUST00000089245.6
ENSMUST00000113312.2 ENSMUST00000170667.1 |
Shq1
|
SHQ1 homolog (S. cerevisiae) |
| chr4_+_149485260 | 4.83 |
ENSMUST00000030842.7
|
Lzic
|
leucine zipper and CTNNBIP1 domain containing |
| chr11_+_76179658 | 4.73 |
ENSMUST00000129853.1
ENSMUST00000179223.1 |
Fam57a
Fam57a
|
family with sequence similarity 57, member A family with sequence similarity 57, member A |
| chr2_-_113848655 | 4.72 |
ENSMUST00000102545.1
ENSMUST00000110948.1 |
Arhgap11a
|
Rho GTPase activating protein 11A |
| chr13_-_97137877 | 4.68 |
ENSMUST00000073456.7
|
Nsa2
|
NSA2 ribosome biogenesis homolog (S. cerevisiae) |
| chr10_-_117792663 | 4.63 |
ENSMUST00000167943.1
ENSMUST00000064848.5 |
Nup107
|
nucleoporin 107 |
| chr13_-_73937761 | 4.62 |
ENSMUST00000022053.8
|
Trip13
|
thyroid hormone receptor interactor 13 |
| chr2_+_5845243 | 4.54 |
ENSMUST00000127116.1
|
Nudt5
|
nudix (nucleoside diphosphate linked moiety X)-type motif 5 |
| chr9_+_73113426 | 4.54 |
ENSMUST00000169399.1
ENSMUST00000034738.7 |
Rsl24d1
|
ribosomal L24 domain containing 1 |
| chr7_-_119793958 | 4.48 |
ENSMUST00000106523.1
ENSMUST00000063902.7 ENSMUST00000150844.1 |
Eri2
|
exoribonuclease 2 |
| chr7_+_126695942 | 4.45 |
ENSMUST00000106369.1
|
Bola2
|
bolA-like 2 (E. coli) |
| chr6_-_125191535 | 4.44 |
ENSMUST00000043848.4
|
Ncapd2
|
non-SMC condensin I complex, subunit D2 |
| chr2_+_22895482 | 4.41 |
ENSMUST00000053729.7
|
Pdss1
|
prenyl (solanesyl) diphosphate synthase, subunit 1 |
| chr8_+_106893616 | 4.40 |
ENSMUST00000047629.5
|
Cirh1a
|
cirrhosis, autosomal recessive 1A (human) |
| chr7_+_24112314 | 4.39 |
ENSMUST00000120006.1
ENSMUST00000005413.3 |
Zfp112
|
zinc finger protein 112 |
| chr19_-_40271506 | 4.35 |
ENSMUST00000068439.6
|
Pdlim1
|
PDZ and LIM domain 1 (elfin) |
| chr2_+_22895583 | 4.27 |
ENSMUST00000152170.1
|
Pdss1
|
prenyl (solanesyl) diphosphate synthase, subunit 1 |
| chr6_+_85915787 | 4.24 |
ENSMUST00000149026.1
|
Tprkb
|
Tp53rk binding protein |
| chr3_+_79591356 | 4.24 |
ENSMUST00000029382.7
|
Ppid
|
peptidylprolyl isomerase D (cyclophilin D) |
| chr4_-_129121889 | 4.23 |
ENSMUST00000139450.1
ENSMUST00000125931.1 ENSMUST00000116444.2 |
Hpca
|
hippocalcin |
| chr4_+_45018583 | 4.18 |
ENSMUST00000133157.1
ENSMUST00000029999.8 ENSMUST00000107814.3 |
Polr1e
|
polymerase (RNA) I polypeptide E |
| chr10_+_120227109 | 4.17 |
ENSMUST00000130198.1
|
Llph
|
LLP homolog, long-term synaptic facilitation (Aplysia) |
| chr18_-_36783146 | 4.14 |
ENSMUST00000001416.6
|
Hars
|
histidyl-tRNA synthetase |
| chr19_+_34922351 | 4.13 |
ENSMUST00000087341.5
|
Kif20b
|
kinesin family member 20B |
| chr17_+_34048280 | 4.12 |
ENSMUST00000143354.1
|
Col11a2
|
collagen, type XI, alpha 2 |
| chr4_+_52439235 | 4.06 |
ENSMUST00000117280.1
ENSMUST00000102915.3 ENSMUST00000142227.1 |
Smc2
|
structural maintenance of chromosomes 2 |
| chr14_-_31494992 | 4.04 |
ENSMUST00000055303.3
|
Mettl6
|
methyltransferase like 6 |
| chr16_-_38522662 | 4.02 |
ENSMUST00000002925.5
|
Timmdc1
|
translocase of inner mitochondrial membrane domain containing 1 |
| chr19_+_11770415 | 4.00 |
ENSMUST00000167199.1
|
Mrpl16
|
mitochondrial ribosomal protein L16 |
| chr13_+_12395362 | 3.99 |
ENSMUST00000059270.8
|
Heatr1
|
HEAT repeat containing 1 |
| chr14_-_47418407 | 3.97 |
ENSMUST00000043296.3
|
Dlgap5
|
discs, large (Drosophila) homolog-associated protein 5 |
| chr10_-_41303171 | 3.93 |
ENSMUST00000043814.3
|
Fig4
|
FIG4 homolog (S. cerevisiae) |
| chr6_+_113046225 | 3.92 |
ENSMUST00000032398.8
ENSMUST00000155378.1 |
Thumpd3
|
THUMP domain containing 3 |
| chr16_-_48993931 | 3.87 |
ENSMUST00000114516.1
|
Dzip3
|
DAZ interacting protein 3, zinc finger |
| chr10_+_120227030 | 3.86 |
ENSMUST00000020444.8
|
Llph
|
LLP homolog, long-term synaptic facilitation (Aplysia) |
| chr7_+_82648595 | 3.81 |
ENSMUST00000141726.1
ENSMUST00000179489.1 ENSMUST00000039881.3 |
Eftud1
|
elongation factor Tu GTP binding domain containing 1 |
| chr4_-_136053343 | 3.79 |
ENSMUST00000102536.4
|
Rpl11
|
ribosomal protein L11 |
| chr6_-_126939524 | 3.77 |
ENSMUST00000144954.1
ENSMUST00000112221.1 ENSMUST00000112220.1 |
Rad51ap1
|
RAD51 associated protein 1 |
| chr6_-_115808736 | 3.76 |
ENSMUST00000081840.3
|
Rpl32
|
ribosomal protein L32 |
| chr5_+_45669907 | 3.74 |
ENSMUST00000117396.1
|
Ncapg
|
non-SMC condensin I complex, subunit G |
| chr16_-_18811615 | 3.74 |
ENSMUST00000096990.3
|
Cdc45
|
cell division cycle 45 |
| chr6_+_86371489 | 3.73 |
ENSMUST00000089558.5
|
Snrpg
|
small nuclear ribonucleoprotein polypeptide G |
| chr8_-_70510552 | 3.71 |
ENSMUST00000125184.1
|
Uba52
|
ubiquitin A-52 residue ribosomal protein fusion product 1 |
| chr2_+_5845017 | 3.69 |
ENSMUST00000026927.3
ENSMUST00000179748.1 |
Nudt5
|
nudix (nucleoside diphosphate linked moiety X)-type motif 5 |
| chr1_+_118321834 | 3.66 |
ENSMUST00000027626.6
ENSMUST00000112688.3 |
Mki67ip
|
Mki67 (FHA domain) interacting nucleolar phosphoprotein |
| chr15_+_85859689 | 3.64 |
ENSMUST00000170629.1
|
Gtse1
|
G two S phase expressed protein 1 |
| chr4_+_123105146 | 3.63 |
ENSMUST00000002457.1
|
Bmp8b
|
bone morphogenetic protein 8b |
| chr7_+_141061274 | 3.58 |
ENSMUST00000048002.5
|
B4galnt4
|
beta-1,4-N-acetyl-galactosaminyl transferase 4 |
| chr13_-_98316967 | 3.57 |
ENSMUST00000022163.8
ENSMUST00000152704.1 |
Btf3
|
basic transcription factor 3 |
| chr8_-_70510322 | 3.57 |
ENSMUST00000140679.1
ENSMUST00000129909.1 ENSMUST00000081940.4 |
Uba52
|
ubiquitin A-52 residue ribosomal protein fusion product 1 |
| chr8_+_107056870 | 3.56 |
ENSMUST00000034392.5
ENSMUST00000170962.1 |
Nip7
|
nuclear import 7 homolog (S. cerevisiae) |
| chr15_-_80264276 | 3.55 |
ENSMUST00000052499.7
|
Rps19bp1
|
ribosomal protein S19 binding protein 1 |
| chr7_-_126200413 | 3.55 |
ENSMUST00000163959.1
|
Xpo6
|
exportin 6 |
| chr2_-_5012716 | 3.53 |
ENSMUST00000027980.7
|
Mcm10
|
minichromosome maintenance deficient 10 (S. cerevisiae) |
| chr2_-_26902829 | 3.53 |
ENSMUST00000114043.1
ENSMUST00000047632.7 |
Surf6
|
surfeit gene 6 |
| chr9_-_70421533 | 3.52 |
ENSMUST00000034742.6
|
Ccnb2
|
cyclin B2 |
| chr18_+_14706145 | 3.52 |
ENSMUST00000040860.1
|
Psma8
|
proteasome (prosome, macropain) subunit, alpha type, 8 |
| chr12_+_84362029 | 3.44 |
ENSMUST00000110278.1
ENSMUST00000145522.1 |
Coq6
|
coenzyme Q6 homolog (yeast) |
| chr2_-_26021532 | 3.42 |
ENSMUST00000136750.1
|
Ubac1
|
ubiquitin associated domain containing 1 |
| chr9_+_65908967 | 3.38 |
ENSMUST00000034949.3
ENSMUST00000154589.1 |
Csnk1g1
|
casein kinase 1, gamma 1 |
| chr2_-_130284422 | 3.33 |
ENSMUST00000028892.4
|
Idh3b
|
isocitrate dehydrogenase 3 (NAD+) beta |
| chr3_+_139205658 | 3.32 |
ENSMUST00000106239.1
|
Stpg2
|
sperm tail PG rich repeat containing 2 |
| chr4_-_123139929 | 3.30 |
ENSMUST00000030404.4
|
Ppie
|
peptidylprolyl isomerase E (cyclophilin E) |
| chr13_-_49652714 | 3.30 |
ENSMUST00000021818.7
|
Cenpp
|
centromere protein P |
| chr7_-_80901220 | 3.29 |
ENSMUST00000146402.1
ENSMUST00000026816.8 |
Wdr73
|
WD repeat domain 73 |
| chr2_-_156144138 | 3.24 |
ENSMUST00000109600.1
ENSMUST00000029147.9 |
Nfs1
|
nitrogen fixation gene 1 (S. cerevisiae) |
| chr8_+_72240052 | 3.24 |
ENSMUST00000145213.1
|
Ap1m1
|
adaptor-related protein complex AP-1, mu subunit 1 |
| chr15_-_81926148 | 3.22 |
ENSMUST00000023113.5
|
Polr3h
|
polymerase (RNA) III (DNA directed) polypeptide H |
| chr2_-_167492826 | 3.20 |
ENSMUST00000109211.2
ENSMUST00000057627.9 |
Spata2
|
spermatogenesis associated 2 |
| chr18_-_84589491 | 3.19 |
ENSMUST00000125763.1
|
Zfp407
|
zinc finger protein 407 |
| chr2_+_164805082 | 3.19 |
ENSMUST00000052107.4
|
Zswim3
|
zinc finger SWIM-type containing 3 |
| chr2_+_181319714 | 3.19 |
ENSMUST00000098971.4
ENSMUST00000054622.8 ENSMUST00000108814.1 ENSMUST00000048608.9 ENSMUST00000108815.1 |
Rtel1
|
regulator of telomere elongation helicase 1 |
| chr7_+_105640448 | 3.19 |
ENSMUST00000058333.3
|
Timm10b
|
translocase of inner mitochondrial membrane 10B |
| chr7_-_126200397 | 3.18 |
ENSMUST00000009344.9
|
Xpo6
|
exportin 6 |
| chr5_-_124578992 | 3.17 |
ENSMUST00000128920.1
|
Eif2b1
|
eukaryotic translation initiation factor 2B, subunit 1 (alpha) |
| chr11_+_84880308 | 3.14 |
ENSMUST00000020837.6
|
Myo19
|
myosin XIX |
| chr7_-_126200474 | 3.14 |
ENSMUST00000168189.1
|
Xpo6
|
exportin 6 |
| chr8_+_72240315 | 3.13 |
ENSMUST00000126885.1
|
Ap1m1
|
adaptor-related protein complex AP-1, mu subunit 1 |
| chr2_+_74825802 | 3.13 |
ENSMUST00000028511.7
|
Mtx2
|
metaxin 2 |
| chr9_+_20888175 | 3.11 |
ENSMUST00000004203.5
|
Ppan
|
peter pan homolog (Drosophila) |
| chr7_+_12922290 | 3.11 |
ENSMUST00000108539.1
ENSMUST00000004554.7 ENSMUST00000147435.1 ENSMUST00000137329.1 |
Rps5
|
ribosomal protein S5 |
| chr1_-_133610215 | 3.10 |
ENSMUST00000164574.1
ENSMUST00000166291.1 ENSMUST00000164096.1 |
Snrpe
|
small nuclear ribonucleoprotein E |
| chr17_-_6827990 | 3.07 |
ENSMUST00000181895.1
|
Gm2885
|
predicted gene 2885 |
| chr12_+_84361968 | 3.05 |
ENSMUST00000021661.6
|
Coq6
|
coenzyme Q6 homolog (yeast) |
| chr2_-_91649785 | 3.05 |
ENSMUST00000111333.1
|
Zfp408
|
zinc finger protein 408 |
| chr12_-_103738158 | 3.05 |
ENSMUST00000095450.4
|
Serpina1b
|
serine (or cysteine) preptidase inhibitor, clade A, member 1B |
| chr19_+_8735808 | 3.03 |
ENSMUST00000049424.9
|
Wdr74
|
WD repeat domain 74 |
| chr9_-_20898592 | 3.03 |
ENSMUST00000004206.8
|
Eif3g
|
eukaryotic translation initiation factor 3, subunit G |
| chr7_+_105640522 | 3.03 |
ENSMUST00000106785.1
ENSMUST00000106786.1 ENSMUST00000106780.1 ENSMUST00000106784.1 |
Timm10b
|
translocase of inner mitochondrial membrane 10B |
| chr4_+_118621160 | 3.00 |
ENSMUST00000147373.1
|
Ebna1bp2
|
EBNA1 binding protein 2 |
| chr12_+_84361636 | 3.00 |
ENSMUST00000110276.1
|
Coq6
|
coenzyme Q6 homolog (yeast) |
| chr16_+_13780699 | 3.00 |
ENSMUST00000023363.6
|
Rrn3
|
RRN3 RNA polymerase I transcription factor homolog (yeast) |
| chr4_+_108579445 | 3.00 |
ENSMUST00000102744.3
|
Orc1
|
origin recognition complex, subunit 1 |
| chr2_-_26021679 | 2.99 |
ENSMUST00000036509.7
|
Ubac1
|
ubiquitin associated domain containing 1 |
| chr5_+_138085083 | 2.99 |
ENSMUST00000019660.4
ENSMUST00000066617.5 ENSMUST00000110963.1 |
Zkscan1
|
zinc finger with KRAB and SCAN domains 1 |
| chr6_-_56704673 | 2.98 |
ENSMUST00000170382.2
|
Lsm5
|
LSM5 homolog, U6 small nuclear RNA associated (S. cerevisiae) |
| chr15_+_85879306 | 2.97 |
ENSMUST00000023019.5
|
Trmu
|
tRNA 5-methylaminomethyl-2-thiouridylate methyltransferase |
| chr16_-_48994081 | 2.96 |
ENSMUST00000121869.1
|
Dzip3
|
DAZ interacting protein 3, zinc finger |
| chr11_+_104550663 | 2.95 |
ENSMUST00000018800.2
|
Myl4
|
myosin, light polypeptide 4 |
| chr11_+_120458093 | 2.93 |
ENSMUST00000058370.7
ENSMUST00000175970.1 ENSMUST00000176120.1 |
Ccdc137
|
coiled-coil domain containing 137 |
| chr11_+_29526407 | 2.93 |
ENSMUST00000133452.1
|
Mtif2
|
mitochondrial translational initiation factor 2 |
| chr2_-_38644087 | 2.89 |
ENSMUST00000028083.5
|
Psmb7
|
proteasome (prosome, macropain) subunit, beta type 7 |
| chr5_-_138170992 | 2.89 |
ENSMUST00000139983.1
|
Mcm7
|
minichromosome maintenance deficient 7 (S. cerevisiae) |
| chr13_-_100775844 | 2.89 |
ENSMUST00000075550.3
|
Cenph
|
centromere protein H |
| chr3_+_87930256 | 2.87 |
ENSMUST00000055984.6
|
Isg20l2
|
interferon stimulated exonuclease gene 20-like 2 |
| chr17_-_35235755 | 2.87 |
ENSMUST00000048994.6
|
Nfkbil1
|
nuclear factor of kappa light polypeptide gene enhancer in B cells inhibitor like 1 |
| chr15_+_5116589 | 2.86 |
ENSMUST00000045356.7
|
Rpl37
|
ribosomal protein L37 |
| chr1_+_87755870 | 2.85 |
ENSMUST00000144047.1
ENSMUST00000027512.6 ENSMUST00000113186.1 ENSMUST00000113190.2 |
Atg16l1
|
autophagy related 16-like 1 (S. cerevisiae) |
| chr5_+_99979061 | 2.83 |
ENSMUST00000046721.1
|
4930524J08Rik
|
RIKEN cDNA 4930524J08 gene |
| chr14_-_26669835 | 2.82 |
ENSMUST00000052932.9
|
Pde12
|
phosphodiesterase 12 |
| chr5_+_33658567 | 2.81 |
ENSMUST00000114426.3
|
Tacc3
|
transforming, acidic coiled-coil containing protein 3 |
| chr11_+_4895328 | 2.81 |
ENSMUST00000038237.1
|
Thoc5
|
THO complex 5 |
| chr12_+_84970897 | 2.80 |
ENSMUST00000021669.8
ENSMUST00000171040.1 |
Fcf1
|
FCF1 small subunit (SSU) processome component homolog (S. cerevisiae) |
| chr5_-_34169409 | 2.79 |
ENSMUST00000060049.6
ENSMUST00000042954.7 |
Haus3
Poln
|
HAUS augmin-like complex, subunit 3 DNA polymerase N |
| chr4_-_45108038 | 2.78 |
ENSMUST00000107809.2
ENSMUST00000107808.2 ENSMUST00000107807.1 ENSMUST00000107810.2 |
Tomm5
|
translocase of outer mitochondrial membrane 5 homolog (yeast) |
| chr1_-_164307443 | 2.78 |
ENSMUST00000027866.4
ENSMUST00000120447.1 ENSMUST00000086032.3 |
Blzf1
|
basic leucine zipper nuclear factor 1 |
| chr1_-_128102412 | 2.77 |
ENSMUST00000112538.1
ENSMUST00000086614.5 |
Zranb3
|
zinc finger, RAN-binding domain containing 3 |
| chr11_+_4895316 | 2.77 |
ENSMUST00000101615.2
|
Thoc5
|
THO complex 5 |
| chr16_-_11203259 | 2.76 |
ENSMUST00000119953.1
|
Rsl1d1
|
ribosomal L1 domain containing 1 |
| chr4_-_129600586 | 2.75 |
ENSMUST00000135055.1
|
Eif3i
|
eukaryotic translation initiation factor 3, subunit I |
| chr16_-_23127702 | 2.74 |
ENSMUST00000115338.1
ENSMUST00000115337.1 ENSMUST00000023598.8 |
Rfc4
|
replication factor C (activator 1) 4 |
| chr3_+_88043098 | 2.73 |
ENSMUST00000166021.1
ENSMUST00000029707.7 |
Gpatch4
|
G patch domain containing 4 |
| chr17_-_78937031 | 2.73 |
ENSMUST00000024885.8
|
Cebpz
|
CCAAT/enhancer binding protein zeta |
| chr7_-_116334132 | 2.72 |
ENSMUST00000170953.1
|
Rps13
|
ribosomal protein S13 |
| chr4_+_129960760 | 2.71 |
ENSMUST00000139884.1
|
1700003M07Rik
|
RIKEN cDNA 1700003M07 gene |
| chr9_+_46273064 | 2.70 |
ENSMUST00000156440.1
ENSMUST00000034583.6 ENSMUST00000114552.3 |
Zfp259
|
zinc finger protein 259 |
| chr4_+_124714776 | 2.70 |
ENSMUST00000030734.4
|
Sf3a3
|
splicing factor 3a, subunit 3 |
| chr19_+_18713225 | 2.70 |
ENSMUST00000055792.7
|
D030056L22Rik
|
RIKEN cDNA D030056L22 gene |
| chr15_+_62037986 | 2.69 |
ENSMUST00000182956.1
ENSMUST00000182075.1 ENSMUST00000180432.2 ENSMUST00000181416.2 ENSMUST00000181657.2 |
Pvt1
|
plasmacytoma variant translocation 1 |
| chr4_+_118620799 | 2.68 |
ENSMUST00000030501.8
|
Ebna1bp2
|
EBNA1 binding protein 2 |
| chr9_+_44407629 | 2.67 |
ENSMUST00000080300.7
|
Rps25
|
ribosomal protein S25 |
| chr17_+_32403006 | 2.67 |
ENSMUST00000065921.5
|
A530088E08Rik
|
RIKEN cDNA A530088E08 gene |
| chr17_+_35135463 | 2.67 |
ENSMUST00000173535.1
ENSMUST00000173952.1 |
Bag6
|
BCL2-associated athanogene 6 |
| chr6_+_88465409 | 2.66 |
ENSMUST00000032165.9
|
Ruvbl1
|
RuvB-like protein 1 |
| chrX_+_144317799 | 2.65 |
ENSMUST00000070801.4
|
Alg13
|
asparagine-linked glycosylation 13 |
| chr1_-_189688074 | 2.63 |
ENSMUST00000171929.1
ENSMUST00000165962.1 |
Cenpf
|
centromere protein F |
| chr12_-_103956891 | 2.63 |
ENSMUST00000085054.4
|
Serpina1e
|
serine (or cysteine) peptidase inhibitor, clade A, member 1E |
| chr5_-_92435219 | 2.62 |
ENSMUST00000038514.8
|
Nup54
|
nucleoporin 54 |
| chr6_+_125131869 | 2.60 |
ENSMUST00000044200.8
|
Nop2
|
NOP2 nucleolar protein |
| chr14_-_55116935 | 2.60 |
ENSMUST00000022819.5
|
Jph4
|
junctophilin 4 |
| chr8_-_110846770 | 2.59 |
ENSMUST00000042012.5
|
Sf3b3
|
splicing factor 3b, subunit 3 |
| chr1_+_87214286 | 2.57 |
ENSMUST00000113231.3
|
Eif4e2
|
eukaryotic translation initiation factor 4E member 2 |
| chr9_-_20952838 | 2.56 |
ENSMUST00000004202.9
|
Dnmt1
|
DNA methyltransferase (cytosine-5) 1 |
| chr10_+_77622363 | 2.55 |
ENSMUST00000172772.1
|
Ube2g2
|
ubiquitin-conjugating enzyme E2G 2 |
| chr19_-_55315980 | 2.55 |
ENSMUST00000076891.5
|
Zdhhc6
|
zinc finger, DHHC domain containing 6 |
| chrX_+_74429671 | 2.55 |
ENSMUST00000114127.1
ENSMUST00000064407.3 ENSMUST00000156707.1 |
Ikbkg
|
inhibitor of kappaB kinase gamma |
| chr19_+_45006475 | 2.54 |
ENSMUST00000026227.2
|
Peo1
|
progressive external ophthalmoplegia 1 (human) |
| chr2_-_12419456 | 2.53 |
ENSMUST00000154899.1
ENSMUST00000028105.6 |
Fam188a
|
family with sequence similarity 188, member A |
| chr12_-_103773592 | 2.53 |
ENSMUST00000078869.5
|
Serpina1d
|
serine (or cysteine) peptidase inhibitor, clade A, member 1D |
| chr7_-_81345189 | 2.52 |
ENSMUST00000080813.4
|
Rps17
|
ribosomal protein S17 |
| chr13_+_41001002 | 2.52 |
ENSMUST00000046951.9
|
Pak1ip1
|
PAK1 interacting protein 1 |
| chr7_-_127876777 | 2.51 |
ENSMUST00000106262.1
ENSMUST00000106263.1 ENSMUST00000054415.5 |
Zfp668
|
zinc finger protein 668 |
| chr8_+_70905970 | 2.51 |
ENSMUST00000019405.2
|
Map1s
|
microtubule-associated protein 1S |
| chr7_+_79392305 | 2.51 |
ENSMUST00000117227.1
ENSMUST00000118959.1 ENSMUST00000036865.6 |
Fanci
|
Fanconi anemia, complementation group I |
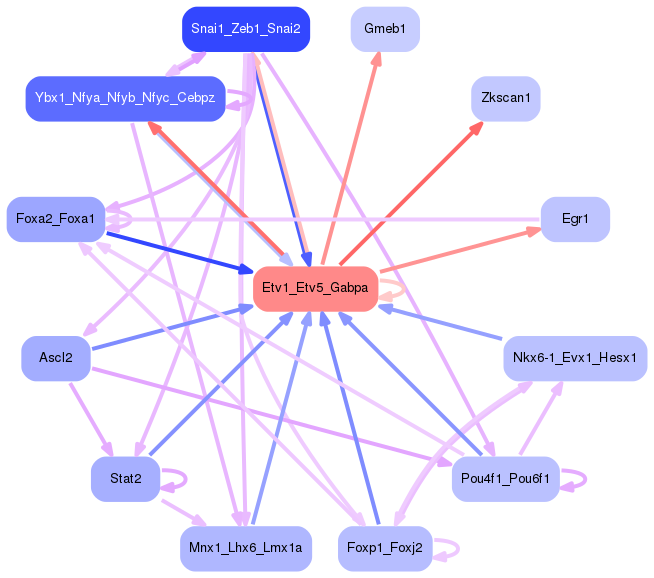
Network of associatons between targets according to the STRING database.

First level regulatory network of Etv1_Etv5_Gabpa
Gene Ontology Analysis
Gene overrepresentation in biological process category:
| Log-likelihood per target | Total log-likelihood | Term | Description |
|---|---|---|---|
| 5.2 | 15.7 | GO:0072382 | minus-end-directed vesicle transport along microtubule(GO:0072382) |
| 3.9 | 11.8 | GO:0071163 | pre-replicative complex assembly involved in nuclear cell cycle DNA replication(GO:0006267) pre-replicative complex assembly(GO:0036388) DNA replication preinitiation complex assembly(GO:0071163) pre-replicative complex assembly involved in cell cycle DNA replication(GO:1902299) |
| 3.2 | 9.7 | GO:0071921 | establishment of sister chromatid cohesion(GO:0034085) cohesin loading(GO:0071921) regulation of cohesin loading(GO:0071922) |
| 2.9 | 8.8 | GO:0036228 | protein targeting to nuclear inner membrane(GO:0036228) |
| 2.7 | 8.0 | GO:0001180 | transcription initiation from RNA polymerase I promoter for nuclear large rRNA transcript(GO:0001180) |
| 2.2 | 6.5 | GO:0006296 | nucleotide-excision repair, DNA incision, 5'-to lesion(GO:0006296) |
| 2.1 | 6.3 | GO:0002946 | tRNA C5-cytosine methylation(GO:0002946) |
| 2.1 | 6.2 | GO:0090071 | negative regulation of ribosome biogenesis(GO:0090071) |
| 2.0 | 5.9 | GO:1902626 | assembly of large subunit precursor of preribosome(GO:1902626) |
| 1.9 | 7.6 | GO:0019323 | pentose catabolic process(GO:0019323) |
| 1.6 | 28.0 | GO:0051988 | regulation of attachment of spindle microtubules to kinetochore(GO:0051988) |
| 1.5 | 4.6 | GO:0000973 | posttranscriptional tethering of RNA polymerase II gene DNA at nuclear periphery(GO:0000973) |
| 1.5 | 4.4 | GO:1990046 | positive regulation of mitochondrial DNA replication(GO:0090297) regulation of cardiolipin metabolic process(GO:1900208) positive regulation of cardiolipin metabolic process(GO:1900210) stress-induced mitochondrial fusion(GO:1990046) |
| 1.4 | 4.2 | GO:0071492 | cellular response to UV-A(GO:0071492) |
| 1.4 | 4.2 | GO:0030827 | negative regulation of cGMP metabolic process(GO:0030824) negative regulation of cGMP biosynthetic process(GO:0030827) negative regulation of guanylate cyclase activity(GO:0031283) |
| 1.4 | 4.1 | GO:0032954 | regulation of cytokinetic process(GO:0032954) regulation of mitotic cytokinetic process(GO:1903436) positive regulation of mitotic cytokinetic process(GO:1903438) positive regulation of mitotic cytokinesis(GO:1903490) |
| 1.3 | 5.4 | GO:1904430 | negative regulation of t-circle formation(GO:1904430) |
| 1.3 | 6.5 | GO:0000454 | snoRNA guided rRNA pseudouridine synthesis(GO:0000454) |
| 1.3 | 10.1 | GO:0010032 | meiotic chromosome condensation(GO:0010032) |
| 1.2 | 9.8 | GO:1901977 | negative regulation of cell cycle checkpoint(GO:1901977) |
| 1.2 | 3.6 | GO:0002184 | cytoplasmic translational termination(GO:0002184) |
| 1.2 | 6.0 | GO:0072429 | response to intra-S DNA damage checkpoint signaling(GO:0072429) |
| 1.2 | 5.9 | GO:0075525 | viral translational termination-reinitiation(GO:0075525) |
| 1.2 | 3.5 | GO:0021933 | radial glia guided migration of cerebellar granule cell(GO:0021933) |
| 1.1 | 3.4 | GO:0036292 | DNA rewinding(GO:0036292) |
| 1.1 | 2.2 | GO:0051309 | female meiosis chromosome separation(GO:0051309) |
| 1.1 | 5.5 | GO:2000210 | positive regulation of anoikis(GO:2000210) |
| 1.0 | 2.1 | GO:1901355 | response to rapamycin(GO:1901355) |
| 1.0 | 8.2 | GO:0071816 | maintenance of unfolded protein(GO:0036506) tail-anchored membrane protein insertion into ER membrane(GO:0071816) maintenance of unfolded protein involved in ERAD pathway(GO:1904378) |
| 1.0 | 18.4 | GO:0006744 | ubiquinone biosynthetic process(GO:0006744) |
| 1.0 | 10.1 | GO:0006268 | DNA unwinding involved in DNA replication(GO:0006268) |
| 0.9 | 5.7 | GO:0031536 | positive regulation of exit from mitosis(GO:0031536) |
| 0.9 | 4.7 | GO:0007089 | traversing start control point of mitotic cell cycle(GO:0007089) |
| 0.9 | 3.6 | GO:0070900 | mitochondrial tRNA modification(GO:0070900) mitochondrial RNA modification(GO:1900864) |
| 0.9 | 70.7 | GO:0042273 | ribosomal large subunit biogenesis(GO:0042273) |
| 0.9 | 7.2 | GO:1900262 | regulation of DNA-directed DNA polymerase activity(GO:1900262) positive regulation of DNA-directed DNA polymerase activity(GO:1900264) |
| 0.9 | 5.4 | GO:0000447 | endonucleolytic cleavage in ITS1 to separate SSU-rRNA from 5.8S rRNA and LSU-rRNA from tricistronic rRNA transcript (SSU-rRNA, 5.8S rRNA, LSU-rRNA)(GO:0000447) |
| 0.9 | 3.6 | GO:0009212 | dTTP biosynthetic process(GO:0006235) pyrimidine deoxyribonucleoside triphosphate biosynthetic process(GO:0009212) dTTP metabolic process(GO:0046075) |
| 0.9 | 3.6 | GO:0090309 | positive regulation of methylation-dependent chromatin silencing(GO:0090309) |
| 0.9 | 6.1 | GO:0070127 | tRNA aminoacylation for mitochondrial protein translation(GO:0070127) |
| 0.9 | 17.2 | GO:0000028 | ribosomal small subunit assembly(GO:0000028) |
| 0.9 | 5.2 | GO:2000234 | positive regulation of ribosome biogenesis(GO:0090070) positive regulation of rRNA processing(GO:2000234) |
| 0.9 | 4.3 | GO:0051031 | tRNA transport(GO:0051031) |
| 0.9 | 2.6 | GO:0002188 | translation reinitiation(GO:0002188) |
| 0.9 | 4.3 | GO:0006384 | transcription initiation from RNA polymerase III promoter(GO:0006384) |
| 0.8 | 0.8 | GO:0031990 | mRNA export from nucleus in response to heat stress(GO:0031990) |
| 0.8 | 3.3 | GO:0010520 | regulation of reciprocal meiotic recombination(GO:0010520) |
| 0.8 | 6.4 | GO:0006390 | transcription from mitochondrial promoter(GO:0006390) |
| 0.8 | 2.4 | GO:2000387 | negative regulation of interleukin-1 alpha production(GO:0032690) negative regulation of integrin activation(GO:0033624) negative regulation of interleukin-1 alpha secretion(GO:0050712) regulation of matrix metallopeptidase secretion(GO:1904464) matrix metallopeptidase secretion(GO:1990773) positive regulation of ovarian follicle development(GO:2000386) regulation of antral ovarian follicle growth(GO:2000387) positive regulation of antral ovarian follicle growth(GO:2000388) negative regulation of eosinophil migration(GO:2000417) |
| 0.8 | 4.8 | GO:1990928 | response to amino acid starvation(GO:1990928) |
| 0.8 | 3.2 | GO:0007000 | nucleolus organization(GO:0007000) |
| 0.8 | 4.0 | GO:0034628 | nicotinamide nucleotide biosynthetic process from aspartate(GO:0019355) 'de novo' NAD biosynthetic process(GO:0034627) 'de novo' NAD biosynthetic process from aspartate(GO:0034628) |
| 0.8 | 3.2 | GO:0006432 | phenylalanyl-tRNA aminoacylation(GO:0006432) |
| 0.8 | 2.3 | GO:2001160 | regulation of histone H3-K79 methylation(GO:2001160) |
| 0.8 | 3.1 | GO:0030576 | Cajal body organization(GO:0030576) |
| 0.8 | 3.0 | GO:0000479 | endonucleolytic cleavage involved in rRNA processing(GO:0000478) endonucleolytic cleavage of tricistronic rRNA transcript (SSU-rRNA, 5.8S rRNA, LSU-rRNA)(GO:0000479) |
| 0.8 | 2.3 | GO:0006269 | DNA replication, synthesis of RNA primer(GO:0006269) |
| 0.7 | 4.5 | GO:0006102 | isocitrate metabolic process(GO:0006102) |
| 0.7 | 25.9 | GO:0060236 | regulation of mitotic spindle organization(GO:0060236) |
| 0.7 | 1.5 | GO:0042256 | mature ribosome assembly(GO:0042256) |
| 0.7 | 13.7 | GO:0008608 | attachment of spindle microtubules to kinetochore(GO:0008608) |
| 0.7 | 12.8 | GO:0007080 | mitotic metaphase plate congression(GO:0007080) |
| 0.7 | 1.4 | GO:0033313 | meiotic cell cycle checkpoint(GO:0033313) |
| 0.7 | 4.1 | GO:0034080 | CENP-A containing nucleosome assembly(GO:0034080) CENP-A containing chromatin organization(GO:0061641) |
| 0.7 | 3.4 | GO:0021539 | subthalamus development(GO:0021539) |
| 0.7 | 0.7 | GO:0032056 | positive regulation of translation in response to stress(GO:0032056) |
| 0.7 | 11.5 | GO:0001833 | inner cell mass cell proliferation(GO:0001833) |
| 0.7 | 3.4 | GO:0060023 | soft palate development(GO:0060023) |
| 0.7 | 4.7 | GO:0006265 | DNA topological change(GO:0006265) |
| 0.7 | 6.0 | GO:0000492 | small nucleolar ribonucleoprotein complex assembly(GO:0000491) box C/D snoRNP assembly(GO:0000492) |
| 0.7 | 2.0 | GO:0070476 | rRNA (guanine-N7)-methylation(GO:0070476) |
| 0.6 | 5.8 | GO:1903504 | regulation of mitotic cell cycle spindle assembly checkpoint(GO:0090266) regulation of mitotic spindle checkpoint(GO:1903504) |
| 0.6 | 1.9 | GO:0036500 | ATF6-mediated unfolded protein response(GO:0036500) |
| 0.6 | 2.6 | GO:0070889 | platelet alpha granule organization(GO:0070889) |
| 0.6 | 1.9 | GO:1901254 | regulation of translation at synapse, modulating synaptic transmission(GO:0099547) regulation of translation at postsynapse, modulating synaptic transmission(GO:0099578) positive regulation of intracellular transport of viral material(GO:1901254) |
| 0.6 | 1.3 | GO:0032202 | telomere assembly(GO:0032202) |
| 0.6 | 3.1 | GO:0070318 | positive regulation of G0 to G1 transition(GO:0070318) |
| 0.6 | 8.8 | GO:0048757 | endosome to melanosome transport(GO:0035646) endosome to pigment granule transport(GO:0043485) pigment granule maturation(GO:0048757) |
| 0.6 | 3.1 | GO:0046784 | viral mRNA export from host cell nucleus(GO:0046784) |
| 0.6 | 2.5 | GO:0015825 | L-serine transport(GO:0015825) |
| 0.6 | 3.7 | GO:0000963 | mitochondrial RNA processing(GO:0000963) |
| 0.6 | 1.8 | GO:1900039 | positive regulation of cellular response to hypoxia(GO:1900039) regulation of hypoxia-inducible factor-1alpha signaling pathway(GO:1902071) |
| 0.6 | 1.2 | GO:0018364 | peptidyl-glutamine methylation(GO:0018364) snoRNA localization(GO:0048254) |
| 0.6 | 6.1 | GO:2000348 | regulation of CD40 signaling pathway(GO:2000348) |
| 0.6 | 1.8 | GO:1905053 | regulation of base-excision repair(GO:1905051) positive regulation of base-excision repair(GO:1905053) |
| 0.6 | 11.4 | GO:0000462 | maturation of SSU-rRNA from tricistronic rRNA transcript (SSU-rRNA, 5.8S rRNA, LSU-rRNA)(GO:0000462) |
| 0.6 | 3.0 | GO:0010636 | positive regulation of mitochondrial fusion(GO:0010636) |
| 0.6 | 3.6 | GO:0003065 | positive regulation of heart rate by epinephrine(GO:0003065) |
| 0.6 | 7.1 | GO:0098789 | pre-mRNA cleavage required for polyadenylation(GO:0098789) |
| 0.6 | 1.8 | GO:0000389 | mRNA 3'-splice site recognition(GO:0000389) |
| 0.6 | 1.2 | GO:1901668 | regulation of superoxide dismutase activity(GO:1901668) |
| 0.6 | 7.0 | GO:0051984 | positive regulation of chromosome segregation(GO:0051984) |
| 0.6 | 7.6 | GO:2000042 | negative regulation of double-strand break repair via homologous recombination(GO:2000042) |
| 0.6 | 2.2 | GO:1901069 | guanosine-containing compound catabolic process(GO:1901069) |
| 0.6 | 1.7 | GO:0042222 | interleukin-1 biosynthetic process(GO:0042222) |
| 0.6 | 2.8 | GO:0061739 | protein lipidation involved in autophagosome assembly(GO:0061739) |
| 0.6 | 13.2 | GO:0030488 | tRNA methylation(GO:0030488) |
| 0.5 | 1.6 | GO:0008612 | peptidyl-lysine modification to peptidyl-hypusine(GO:0008612) |
| 0.5 | 4.9 | GO:0000022 | mitotic spindle elongation(GO:0000022) mitotic spindle midzone assembly(GO:0051256) |
| 0.5 | 4.3 | GO:0031642 | negative regulation of myelination(GO:0031642) |
| 0.5 | 1.6 | GO:0051030 | snRNA transport(GO:0051030) |
| 0.5 | 3.2 | GO:0098838 | reduced folate transmembrane transport(GO:0098838) |
| 0.5 | 5.9 | GO:1904851 | positive regulation of establishment of protein localization to telomere(GO:1904851) |
| 0.5 | 1.6 | GO:0046601 | positive regulation of centriole replication(GO:0046601) |
| 0.5 | 18.8 | GO:0000387 | spliceosomal snRNP assembly(GO:0000387) |
| 0.5 | 3.0 | GO:0046654 | tetrahydrofolate biosynthetic process(GO:0046654) |
| 0.5 | 2.0 | GO:0090365 | regulation of mRNA modification(GO:0090365) |
| 0.5 | 0.5 | GO:0034427 | nuclear-transcribed mRNA catabolic process, exonucleolytic, 3'-5'(GO:0034427) |
| 0.5 | 0.5 | GO:0045048 | protein insertion into ER membrane(GO:0045048) |
| 0.5 | 1.4 | GO:0009826 | unidimensional cell growth(GO:0009826) |
| 0.5 | 2.4 | GO:0032298 | positive regulation of DNA-dependent DNA replication initiation(GO:0032298) |
| 0.5 | 1.4 | GO:0015680 | intracellular copper ion transport(GO:0015680) |
| 0.5 | 3.8 | GO:0015074 | DNA integration(GO:0015074) |
| 0.5 | 0.9 | GO:0043137 | DNA replication, removal of RNA primer(GO:0043137) |
| 0.5 | 1.4 | GO:1903659 | transforming growth factor beta activation(GO:0036363) regulation of complement-dependent cytotoxicity(GO:1903659) negative regulation of complement-dependent cytotoxicity(GO:1903660) |
| 0.5 | 1.9 | GO:0070200 | establishment of protein localization to telomere(GO:0070200) |
| 0.5 | 0.9 | GO:1904751 | positive regulation of protein localization to nucleolus(GO:1904751) |
| 0.5 | 5.6 | GO:0036297 | interstrand cross-link repair(GO:0036297) |
| 0.5 | 2.8 | GO:0019720 | Mo-molybdopterin cofactor biosynthetic process(GO:0006777) Mo-molybdopterin cofactor metabolic process(GO:0019720) |
| 0.5 | 1.8 | GO:0010360 | negative regulation of anion channel activity(GO:0010360) |
| 0.5 | 0.5 | GO:0071630 | nucleus-associated proteasomal ubiquitin-dependent protein catabolic process(GO:0071630) |
| 0.5 | 1.4 | GO:0043553 | negative regulation of phosphatidylinositol 3-kinase activity(GO:0043553) |
| 0.5 | 2.3 | GO:0036324 | vascular endothelial growth factor receptor-2 signaling pathway(GO:0036324) |
| 0.5 | 1.8 | GO:0046061 | dGTP catabolic process(GO:0006203) dATP catabolic process(GO:0046061) |
| 0.4 | 1.7 | GO:0072737 | response to diamide(GO:0072737) cellular response to diamide(GO:0072738) |
| 0.4 | 4.3 | GO:0051310 | metaphase plate congression(GO:0051310) |
| 0.4 | 1.3 | GO:0019389 | glucuronoside metabolic process(GO:0019389) |
| 0.4 | 1.7 | GO:0002309 | T cell proliferation involved in immune response(GO:0002309) |
| 0.4 | 2.5 | GO:2000676 | positive regulation of type B pancreatic cell apoptotic process(GO:2000676) |
| 0.4 | 1.3 | GO:1902256 | apoptotic process involved in outflow tract morphogenesis(GO:0003275) regulation of apoptotic process involved in outflow tract morphogenesis(GO:1902256) |
| 0.4 | 12.2 | GO:0002181 | cytoplasmic translation(GO:0002181) |
| 0.4 | 2.5 | GO:1903336 | negative regulation of vacuolar transport(GO:1903336) |
| 0.4 | 4.2 | GO:0006398 | mRNA 3'-end processing by stem-loop binding and cleavage(GO:0006398) |
| 0.4 | 1.2 | GO:0042776 | mitochondrial ATP synthesis coupled proton transport(GO:0042776) |
| 0.4 | 1.2 | GO:0045006 | DNA deamination(GO:0045006) |
| 0.4 | 5.7 | GO:2000001 | regulation of DNA damage checkpoint(GO:2000001) |
| 0.4 | 1.2 | GO:0033693 | neurofilament bundle assembly(GO:0033693) response to sodium arsenite(GO:1903935) |
| 0.4 | 2.8 | GO:0007076 | mitotic chromosome condensation(GO:0007076) |
| 0.4 | 1.6 | GO:0042796 | snRNA transcription from RNA polymerase III promoter(GO:0042796) |
| 0.4 | 2.0 | GO:1903093 | regulation of protein K48-linked deubiquitination(GO:1903093) negative regulation of protein K48-linked deubiquitination(GO:1903094) negative regulation of ubiquitin-specific protease activity(GO:2000157) |
| 0.4 | 2.4 | GO:0007144 | female meiosis I(GO:0007144) |
| 0.4 | 1.2 | GO:1900245 | positive regulation of MDA-5 signaling pathway(GO:1900245) |
| 0.4 | 1.2 | GO:0051096 | positive regulation of helicase activity(GO:0051096) |
| 0.4 | 1.5 | GO:0036265 | RNA (guanine-N7)-methylation(GO:0036265) |
| 0.4 | 1.5 | GO:1902571 | regulation of serine-type endopeptidase activity(GO:1900003) negative regulation of serine-type endopeptidase activity(GO:1900004) regulation of serine-type peptidase activity(GO:1902571) negative regulation of serine-type peptidase activity(GO:1902572) |
| 0.4 | 2.6 | GO:0006369 | termination of RNA polymerase II transcription(GO:0006369) |
| 0.4 | 1.5 | GO:0036343 | psychomotor behavior(GO:0036343) |
| 0.4 | 1.1 | GO:0014735 | regulation of muscle atrophy(GO:0014735) cholangiocyte proliferation(GO:1990705) |
| 0.4 | 1.1 | GO:0031064 | negative regulation of histone deacetylation(GO:0031064) |
| 0.4 | 2.6 | GO:1901228 | positive regulation of transcription from RNA polymerase II promoter involved in heart development(GO:1901228) |
| 0.4 | 1.1 | GO:0033566 | gamma-tubulin complex localization(GO:0033566) |
| 0.4 | 6.9 | GO:0006270 | DNA replication initiation(GO:0006270) |
| 0.4 | 5.1 | GO:0010804 | negative regulation of tumor necrosis factor-mediated signaling pathway(GO:0010804) |
| 0.4 | 1.1 | GO:0071034 | CUT catabolic process(GO:0071034) CUT metabolic process(GO:0071043) |
| 0.4 | 2.8 | GO:0009452 | 7-methylguanosine RNA capping(GO:0009452) RNA capping(GO:0036260) |
| 0.4 | 1.1 | GO:0031335 | regulation of sulfur amino acid metabolic process(GO:0031335) |
| 0.3 | 1.4 | GO:0015966 | diadenosine polyphosphate biosynthetic process(GO:0015960) diadenosine tetraphosphate metabolic process(GO:0015965) diadenosine tetraphosphate biosynthetic process(GO:0015966) |
| 0.3 | 1.0 | GO:0006931 | substrate-dependent cell migration, cell attachment to substrate(GO:0006931) |
| 0.3 | 9.7 | GO:0000413 | protein peptidyl-prolyl isomerization(GO:0000413) |
| 0.3 | 8.3 | GO:0006298 | mismatch repair(GO:0006298) |
| 0.3 | 1.4 | GO:1990481 | mRNA pseudouridine synthesis(GO:1990481) |
| 0.3 | 1.0 | GO:1904569 | regulation of selenocysteine incorporation(GO:1904569) |
| 0.3 | 3.6 | GO:0051383 | kinetochore assembly(GO:0051382) kinetochore organization(GO:0051383) |
| 0.3 | 1.3 | GO:0035524 | proline transmembrane transport(GO:0035524) |
| 0.3 | 1.6 | GO:0018343 | protein farnesylation(GO:0018343) |
| 0.3 | 1.3 | GO:0061086 | negative regulation of histone H3-K27 methylation(GO:0061086) |
| 0.3 | 1.0 | GO:0007084 | mitotic nuclear envelope reassembly(GO:0007084) |
| 0.3 | 38.4 | GO:0042254 | ribosome biogenesis(GO:0042254) |
| 0.3 | 2.5 | GO:0085020 | protein K6-linked ubiquitination(GO:0085020) |
| 0.3 | 0.9 | GO:1904925 | positive regulation of macromitophagy(GO:1901526) positive regulation of mitophagy in response to mitochondrial depolarization(GO:1904925) |
| 0.3 | 1.2 | GO:0031117 | positive regulation of microtubule depolymerization(GO:0031117) |
| 0.3 | 3.6 | GO:0018206 | peptidyl-methionine modification(GO:0018206) |
| 0.3 | 0.3 | GO:2000812 | regulation of barbed-end actin filament capping(GO:2000812) |
| 0.3 | 0.9 | GO:0046606 | negative regulation of centrosome duplication(GO:0010826) negative regulation of centrosome cycle(GO:0046606) |
| 0.3 | 1.5 | GO:0007096 | regulation of exit from mitosis(GO:0007096) |
| 0.3 | 0.3 | GO:1903898 | negative regulation of PERK-mediated unfolded protein response(GO:1903898) |
| 0.3 | 5.2 | GO:0031498 | chromatin disassembly(GO:0031498) |
| 0.3 | 1.2 | GO:0031860 | telomeric 3' overhang formation(GO:0031860) |
| 0.3 | 0.6 | GO:0071169 | establishment of protein localization to chromatin(GO:0071169) |
| 0.3 | 1.7 | GO:0017185 | peptidyl-lysine hydroxylation(GO:0017185) |
| 0.3 | 4.9 | GO:0000338 | protein deneddylation(GO:0000338) |
| 0.3 | 1.7 | GO:0006452 | translational frameshifting(GO:0006452) positive regulation of translational termination(GO:0045905) |
| 0.3 | 3.1 | GO:0031665 | negative regulation of lipopolysaccharide-mediated signaling pathway(GO:0031665) |
| 0.3 | 12.7 | GO:0032543 | mitochondrial translation(GO:0032543) |
| 0.3 | 2.3 | GO:0010757 | negative regulation of plasminogen activation(GO:0010757) |
| 0.3 | 1.1 | GO:0051643 | endoplasmic reticulum localization(GO:0051643) |
| 0.3 | 0.6 | GO:1900157 | regulation of bone mineralization involved in bone maturation(GO:1900157) |
| 0.3 | 1.4 | GO:0033148 | positive regulation of intracellular estrogen receptor signaling pathway(GO:0033148) |
| 0.3 | 0.3 | GO:0071677 | positive regulation of mononuclear cell migration(GO:0071677) |
| 0.3 | 3.5 | GO:0031297 | replication fork processing(GO:0031297) |
| 0.3 | 1.1 | GO:0032053 | ciliary basal body organization(GO:0032053) |
| 0.3 | 2.5 | GO:0051503 | adenine nucleotide transport(GO:0051503) |
| 0.3 | 0.8 | GO:0035552 | oxidative single-stranded DNA demethylation(GO:0035552) |
| 0.3 | 6.0 | GO:0051654 | establishment of mitochondrion localization(GO:0051654) |
| 0.3 | 1.1 | GO:0014846 | esophagus smooth muscle contraction(GO:0014846) |
| 0.3 | 0.8 | GO:0016131 | brassinosteroid metabolic process(GO:0016131) brassinosteroid biosynthetic process(GO:0016132) |
| 0.3 | 1.3 | GO:0006167 | AMP biosynthetic process(GO:0006167) |
| 0.3 | 0.3 | GO:0016078 | tRNA catabolic process(GO:0016078) |
| 0.3 | 0.8 | GO:0061144 | alveolar secondary septum development(GO:0061144) |
| 0.3 | 1.0 | GO:0044376 | RNA polymerase II complex import to nucleus(GO:0044376) RNA polymerase III complex localization to nucleus(GO:1990022) |
| 0.3 | 0.3 | GO:1903588 | negative regulation of blood vessel endothelial cell proliferation involved in sprouting angiogenesis(GO:1903588) |
| 0.3 | 0.5 | GO:1905024 | regulation of membrane repolarization during ventricular cardiac muscle cell action potential(GO:1905024) |
| 0.3 | 1.0 | GO:0060800 | regulation of cell differentiation involved in embryonic placenta development(GO:0060800) |
| 0.3 | 1.5 | GO:0080009 | mRNA methylation(GO:0080009) |
| 0.2 | 1.7 | GO:0006450 | regulation of translational fidelity(GO:0006450) |
| 0.2 | 4.2 | GO:0002024 | diet induced thermogenesis(GO:0002024) |
| 0.2 | 1.5 | GO:0003431 | growth plate cartilage chondrocyte development(GO:0003431) |
| 0.2 | 1.9 | GO:0033314 | mitotic DNA replication checkpoint(GO:0033314) |
| 0.2 | 0.7 | GO:0002270 | plasmacytoid dendritic cell activation(GO:0002270) |
| 0.2 | 2.8 | GO:0006123 | mitochondrial electron transport, cytochrome c to oxygen(GO:0006123) |
| 0.2 | 17.3 | GO:0008033 | tRNA processing(GO:0008033) |
| 0.2 | 0.7 | GO:0098971 | anterograde dendritic transport of neurotransmitter receptor complex(GO:0098971) |
| 0.2 | 0.9 | GO:0032218 | riboflavin transport(GO:0032218) |
| 0.2 | 2.3 | GO:0035330 | regulation of hippo signaling(GO:0035330) |
| 0.2 | 0.7 | GO:0015881 | creatine transport(GO:0015881) |
| 0.2 | 0.5 | GO:1901420 | negative regulation of response to alcohol(GO:1901420) |
| 0.2 | 5.7 | GO:0032786 | positive regulation of DNA-templated transcription, elongation(GO:0032786) |
| 0.2 | 1.1 | GO:0021764 | amygdala development(GO:0021764) |
| 0.2 | 0.9 | GO:2000383 | regulation of ectoderm development(GO:2000383) negative regulation of ectoderm development(GO:2000384) |
| 0.2 | 1.6 | GO:0090141 | positive regulation of mitochondrial fission(GO:0090141) |
| 0.2 | 1.8 | GO:0008215 | spermine metabolic process(GO:0008215) |
| 0.2 | 0.4 | GO:0045041 | protein import into mitochondrial intermembrane space(GO:0045041) |
| 0.2 | 1.3 | GO:0043628 | snRNA 3'-end processing(GO:0034472) ncRNA 3'-end processing(GO:0043628) |
| 0.2 | 0.4 | GO:0097029 | mature conventional dendritic cell differentiation(GO:0097029) |
| 0.2 | 21.1 | GO:0006413 | translational initiation(GO:0006413) |
| 0.2 | 0.2 | GO:0031627 | telomeric loop formation(GO:0031627) |
| 0.2 | 0.9 | GO:0021508 | floor plate formation(GO:0021508) |
| 0.2 | 2.4 | GO:0006020 | inositol metabolic process(GO:0006020) |
| 0.2 | 1.1 | GO:0035246 | peptidyl-arginine N-methylation(GO:0035246) peptidyl-arginine omega-N-methylation(GO:0035247) |
| 0.2 | 4.9 | GO:0007099 | centriole replication(GO:0007099) |
| 0.2 | 0.4 | GO:0010606 | positive regulation of cytoplasmic mRNA processing body assembly(GO:0010606) |
| 0.2 | 0.6 | GO:0006420 | arginyl-tRNA aminoacylation(GO:0006420) |
| 0.2 | 0.9 | GO:0060715 | syncytiotrophoblast cell differentiation involved in labyrinthine layer development(GO:0060715) |
| 0.2 | 0.6 | GO:0006601 | creatine biosynthetic process(GO:0006601) |
| 0.2 | 0.6 | GO:0070537 | histone H2A K63-linked deubiquitination(GO:0070537) |
| 0.2 | 0.2 | GO:1903377 | negative regulation of oxidative stress-induced neuron intrinsic apoptotic signaling pathway(GO:1903377) |
| 0.2 | 0.4 | GO:0048478 | replication fork protection(GO:0048478) |
| 0.2 | 2.9 | GO:0045899 | positive regulation of RNA polymerase II transcriptional preinitiation complex assembly(GO:0045899) |
| 0.2 | 0.6 | GO:0045726 | positive regulation of integrin biosynthetic process(GO:0045726) |
| 0.2 | 0.4 | GO:1901252 | regulation of intracellular transport of viral material(GO:1901252) |
| 0.2 | 0.6 | GO:0006434 | seryl-tRNA aminoacylation(GO:0006434) |
| 0.2 | 1.6 | GO:0034982 | mitochondrial protein processing(GO:0034982) |
| 0.2 | 0.8 | GO:0006121 | mitochondrial electron transport, succinate to ubiquinone(GO:0006121) |
| 0.2 | 1.2 | GO:0060931 | sinoatrial node cell development(GO:0060931) |
| 0.2 | 2.4 | GO:2000096 | positive regulation of Wnt signaling pathway, planar cell polarity pathway(GO:2000096) |
| 0.2 | 1.0 | GO:0006564 | L-serine biosynthetic process(GO:0006564) |
| 0.2 | 0.6 | GO:0006114 | fumarate metabolic process(GO:0006106) glycerol biosynthetic process(GO:0006114) aspartate biosynthetic process(GO:0006532) aspartate catabolic process(GO:0006533) |
| 0.2 | 0.8 | GO:0015786 | UDP-glucose transport(GO:0015786) |
| 0.2 | 1.4 | GO:1903056 | regulation of melanosome organization(GO:1903056) |
| 0.2 | 1.2 | GO:0097039 | protein linear polyubiquitination(GO:0097039) |
| 0.2 | 3.4 | GO:0071157 | negative regulation of cell cycle arrest(GO:0071157) |
| 0.2 | 2.8 | GO:2001256 | regulation of store-operated calcium entry(GO:2001256) |
| 0.2 | 11.2 | GO:0006611 | protein export from nucleus(GO:0006611) |
| 0.2 | 0.9 | GO:0032485 | regulation of Ral protein signal transduction(GO:0032485) |
| 0.2 | 0.9 | GO:0045347 | negative regulation of MHC class II biosynthetic process(GO:0045347) |
| 0.2 | 1.2 | GO:0032596 | protein transport into membrane raft(GO:0032596) |
| 0.2 | 3.2 | GO:0043968 | histone H2A acetylation(GO:0043968) |
| 0.2 | 0.4 | GO:0045914 | negative regulation of catecholamine metabolic process(GO:0045914) negative regulation of dopamine metabolic process(GO:0045963) |
| 0.2 | 1.2 | GO:0098887 | neurotransmitter receptor transport, endosome to postsynaptic membrane(GO:0098887) neurotransmitter receptor transport, endosome to plasma membrane(GO:0099639) |
| 0.2 | 0.7 | GO:1904668 | positive regulation of ubiquitin protein ligase activity(GO:1904668) |
| 0.2 | 1.6 | GO:0043649 | dicarboxylic acid catabolic process(GO:0043649) |
| 0.2 | 1.7 | GO:0006702 | androgen biosynthetic process(GO:0006702) |
| 0.2 | 7.4 | GO:0097484 | dendrite extension(GO:0097484) |
| 0.2 | 10.9 | GO:0022900 | electron transport chain(GO:0022900) |
| 0.2 | 1.0 | GO:1903690 | negative regulation of wound healing, spreading of epidermal cells(GO:1903690) |
| 0.2 | 0.7 | GO:0071475 | cellular hyperosmotic salinity response(GO:0071475) |
| 0.2 | 0.2 | GO:0034971 | histone H3-R17 methylation(GO:0034971) |
| 0.2 | 1.3 | GO:0097646 | calcitonin family receptor signaling pathway(GO:0097646) amylin receptor signaling pathway(GO:0097647) |
| 0.2 | 1.5 | GO:0030538 | embryonic genitalia morphogenesis(GO:0030538) embryonic hindgut morphogenesis(GO:0048619) |
| 0.2 | 0.8 | GO:0042138 | meiotic DNA double-strand break formation(GO:0042138) |
| 0.2 | 0.3 | GO:0072716 | response to sorbitol(GO:0072708) response to actinomycin D(GO:0072716) response to dithiothreitol(GO:0072720) |
| 0.2 | 0.5 | GO:0021649 | vestibulocochlear nerve structural organization(GO:0021649) ganglion morphogenesis(GO:0061552) dorsal root ganglion morphogenesis(GO:1904835) |
| 0.2 | 1.5 | GO:1900121 | negative regulation of receptor binding(GO:1900121) |
| 0.2 | 0.6 | GO:0070779 | D-aspartate transport(GO:0070777) D-aspartate import(GO:0070779) |
| 0.2 | 0.3 | GO:0010982 | regulation of high-density lipoprotein particle clearance(GO:0010982) |
| 0.2 | 0.8 | GO:0006616 | SRP-dependent cotranslational protein targeting to membrane, translocation(GO:0006616) |
| 0.2 | 1.0 | GO:0051418 | interphase microtubule nucleation by interphase microtubule organizing center(GO:0051415) microtubule nucleation by microtubule organizing center(GO:0051418) |
| 0.2 | 3.0 | GO:0001771 | immunological synapse formation(GO:0001771) |
| 0.2 | 0.8 | GO:1901857 | positive regulation of cellular respiration(GO:1901857) |
| 0.2 | 1.3 | GO:0030223 | neutrophil differentiation(GO:0030223) |
| 0.2 | 2.3 | GO:0043248 | proteasome assembly(GO:0043248) |
| 0.2 | 1.1 | GO:0000920 | cell separation after cytokinesis(GO:0000920) |
| 0.2 | 1.5 | GO:0045040 | protein import into mitochondrial outer membrane(GO:0045040) |
| 0.2 | 1.1 | GO:0061718 | NADH regeneration(GO:0006735) canonical glycolysis(GO:0061621) glucose catabolic process to pyruvate(GO:0061718) |
| 0.2 | 0.8 | GO:0006287 | base-excision repair, gap-filling(GO:0006287) |
| 0.2 | 0.8 | GO:0038032 | termination of G-protein coupled receptor signaling pathway(GO:0038032) |
| 0.2 | 0.8 | GO:1904937 | pancreatic A cell development(GO:0003322) forebrain-midbrain boundary formation(GO:0021905) somatic motor neuron fate commitment(GO:0021917) regulation of transcription from RNA polymerase II promoter involved in somatic motor neuron fate commitment(GO:0021918) sensory neuron migration(GO:1904937) |
| 0.2 | 3.2 | GO:0006301 | postreplication repair(GO:0006301) |
| 0.1 | 0.4 | GO:0051005 | negative regulation of lipoprotein lipase activity(GO:0051005) |
| 0.1 | 2.8 | GO:0099514 | anterograde synaptic vesicle transport(GO:0048490) synaptic vesicle cytoskeletal transport(GO:0099514) synaptic vesicle transport along microtubule(GO:0099517) |
| 0.1 | 0.7 | GO:1903378 | positive regulation of oxidative stress-induced neuron intrinsic apoptotic signaling pathway(GO:1903378) |
| 0.1 | 1.6 | GO:0071578 | zinc II ion transmembrane import(GO:0071578) |
| 0.1 | 3.5 | GO:0045070 | positive regulation of viral genome replication(GO:0045070) |
| 0.1 | 3.7 | GO:0015985 | energy coupled proton transport, down electrochemical gradient(GO:0015985) ATP synthesis coupled proton transport(GO:0015986) |
| 0.1 | 2.9 | GO:0007091 | metaphase/anaphase transition of mitotic cell cycle(GO:0007091) |
| 0.1 | 0.1 | GO:0090650 | response to oxygen-glucose deprivation(GO:0090649) cellular response to oxygen-glucose deprivation(GO:0090650) |
| 0.1 | 0.3 | GO:2000584 | regulation of platelet-derived growth factor receptor-alpha signaling pathway(GO:2000583) negative regulation of platelet-derived growth factor receptor-alpha signaling pathway(GO:2000584) |
| 0.1 | 1.6 | GO:0018231 | peptidyl-L-cysteine S-palmitoylation(GO:0018230) peptidyl-S-diacylglycerol-L-cysteine biosynthetic process from peptidyl-cysteine(GO:0018231) |
| 0.1 | 0.3 | GO:0003072 | angiotensin mediated vasoconstriction involved in regulation of systemic arterial blood pressure(GO:0001998) regulation of blood vessel size by renin-angiotensin(GO:0002034) renal control of peripheral vascular resistance involved in regulation of systemic arterial blood pressure(GO:0003072) |
| 0.1 | 1.7 | GO:0033120 | positive regulation of RNA splicing(GO:0033120) |
| 0.1 | 0.4 | GO:0045226 | extracellular polysaccharide biosynthetic process(GO:0045226) extracellular polysaccharide metabolic process(GO:0046379) |
| 0.1 | 0.3 | GO:0009838 | abscission(GO:0009838) |
| 0.1 | 1.8 | GO:1903818 | positive regulation of voltage-gated potassium channel activity(GO:1903818) |
| 0.1 | 0.3 | GO:0010726 | positive regulation of hydrogen peroxide metabolic process(GO:0010726) |
| 0.1 | 1.8 | GO:0070493 | thrombin receptor signaling pathway(GO:0070493) |
| 0.1 | 1.0 | GO:0070932 | histone H3 deacetylation(GO:0070932) |
| 0.1 | 31.5 | GO:0000398 | RNA splicing, via transesterification reactions with bulged adenosine as nucleophile(GO:0000377) mRNA splicing, via spliceosome(GO:0000398) |
| 0.1 | 0.4 | GO:0036090 | cleavage furrow ingression(GO:0036090) |
| 0.1 | 0.3 | GO:0034196 | acylglycerol transport(GO:0034196) triglyceride transport(GO:0034197) |
| 0.1 | 0.5 | GO:0014022 | neural plate elongation(GO:0014022) convergent extension involved in neural plate elongation(GO:0022007) |
| 0.1 | 0.3 | GO:2000017 | positive regulation of determination of dorsal identity(GO:2000017) |
| 0.1 | 0.7 | GO:0010989 | negative regulation of low-density lipoprotein particle clearance(GO:0010989) |
| 0.1 | 0.4 | GO:2000393 | negative regulation of lamellipodium morphogenesis(GO:2000393) |
| 0.1 | 0.4 | GO:0045342 | MHC class II biosynthetic process(GO:0045342) regulation of MHC class II biosynthetic process(GO:0045346) positive regulation of MHC class II biosynthetic process(GO:0045348) |
| 0.1 | 3.1 | GO:0060080 | inhibitory postsynaptic potential(GO:0060080) |
| 0.1 | 0.9 | GO:0030382 | sperm mitochondrion organization(GO:0030382) |
| 0.1 | 1.7 | GO:0008209 | androgen metabolic process(GO:0008209) |
| 0.1 | 0.7 | GO:0042891 | antibiotic transport(GO:0042891) |
| 0.1 | 0.4 | GO:0016095 | polyprenol catabolic process(GO:0016095) |
| 0.1 | 0.7 | GO:1900378 | positive regulation of melanin biosynthetic process(GO:0048023) positive regulation of secondary metabolite biosynthetic process(GO:1900378) |
| 0.1 | 0.4 | GO:0036515 | serotonergic neuron axon guidance(GO:0036515) |
| 0.1 | 0.5 | GO:0046294 | formaldehyde catabolic process(GO:0046294) |
| 0.1 | 0.7 | GO:0090073 | positive regulation of protein homodimerization activity(GO:0090073) |
| 0.1 | 2.5 | GO:0031424 | keratinization(GO:0031424) |
| 0.1 | 17.2 | GO:0007059 | chromosome segregation(GO:0007059) |
| 0.1 | 0.9 | GO:0035542 | regulation of SNARE complex assembly(GO:0035542) |
| 0.1 | 1.7 | GO:0031581 | hemidesmosome assembly(GO:0031581) |
| 0.1 | 3.5 | GO:0006414 | translational elongation(GO:0006414) |
| 0.1 | 0.5 | GO:0002326 | B cell lineage commitment(GO:0002326) |
| 0.1 | 1.3 | GO:0070862 | negative regulation of protein exit from endoplasmic reticulum(GO:0070862) negative regulation of retrograde protein transport, ER to cytosol(GO:1904153) |
| 0.1 | 0.8 | GO:0001927 | exocyst assembly(GO:0001927) |
| 0.1 | 0.9 | GO:0031339 | negative regulation of vesicle fusion(GO:0031339) |
| 0.1 | 4.4 | GO:0021522 | spinal cord motor neuron differentiation(GO:0021522) |
| 0.1 | 1.0 | GO:0097460 | ferrous iron import into cell(GO:0097460) ferrous iron import across plasma membrane(GO:0098707) |
| 0.1 | 0.2 | GO:0030422 | production of siRNA involved in RNA interference(GO:0030422) |
| 0.1 | 1.4 | GO:0098953 | receptor diffusion trapping(GO:0098953) postsynaptic neurotransmitter receptor diffusion trapping(GO:0098970) neurotransmitter receptor diffusion trapping(GO:0099628) |
| 0.1 | 1.9 | GO:0060134 | prepulse inhibition(GO:0060134) |
| 0.1 | 0.4 | GO:1900045 | negative regulation of protein K63-linked ubiquitination(GO:1900045) negative regulation of protein polyubiquitination(GO:1902915) |
| 0.1 | 0.2 | GO:0009146 | purine nucleoside triphosphate catabolic process(GO:0009146) |
| 0.1 | 0.7 | GO:0070294 | renal sodium ion absorption(GO:0070294) |
| 0.1 | 0.8 | GO:0072086 | specification of loop of Henle identity(GO:0072086) |
| 0.1 | 0.6 | GO:0080154 | regulation of fertilization(GO:0080154) |
| 0.1 | 1.1 | GO:0001842 | neural fold formation(GO:0001842) |
| 0.1 | 0.8 | GO:0002361 | CD4-positive, CD25-positive, alpha-beta regulatory T cell differentiation(GO:0002361) |
| 0.1 | 0.4 | GO:0019659 | fermentation(GO:0006113) glucose catabolic process to lactate(GO:0019659) glycolytic fermentation(GO:0019660) glucose catabolic process to lactate via pyruvate(GO:0019661) |
| 0.1 | 1.6 | GO:0033211 | adiponectin-activated signaling pathway(GO:0033211) |
| 0.1 | 0.7 | GO:0039532 | negative regulation of viral-induced cytoplasmic pattern recognition receptor signaling pathway(GO:0039532) |
| 0.1 | 0.7 | GO:1903265 | positive regulation of tumor necrosis factor-mediated signaling pathway(GO:1903265) |
| 0.1 | 0.4 | GO:0006438 | valyl-tRNA aminoacylation(GO:0006438) |
| 0.1 | 0.3 | GO:0002069 | columnar/cuboidal epithelial cell maturation(GO:0002069) |
| 0.1 | 2.2 | GO:0034629 | cellular protein complex localization(GO:0034629) |
| 0.1 | 0.9 | GO:0015879 | carnitine transport(GO:0015879) |
| 0.1 | 0.7 | GO:0071955 | recycling endosome to Golgi transport(GO:0071955) |
| 0.1 | 1.0 | GO:0005981 | regulation of glycogen catabolic process(GO:0005981) |
| 0.1 | 1.1 | GO:0010569 | regulation of double-strand break repair via homologous recombination(GO:0010569) |
| 0.1 | 2.3 | GO:0006308 | DNA catabolic process(GO:0006308) |
| 0.1 | 0.1 | GO:1904357 | negative regulation of telomere maintenance via telomere lengthening(GO:1904357) |
| 0.1 | 0.3 | GO:0017004 | cytochrome complex assembly(GO:0017004) |
| 0.1 | 1.4 | GO:0044818 | mitotic G2/M transition checkpoint(GO:0044818) |
| 0.1 | 6.0 | GO:2000179 | positive regulation of neural precursor cell proliferation(GO:2000179) |
| 0.1 | 0.2 | GO:0060399 | positive regulation of growth hormone receptor signaling pathway(GO:0060399) |
| 0.1 | 2.0 | GO:1902857 | positive regulation of nonmotile primary cilium assembly(GO:1902857) |
| 0.1 | 4.5 | GO:0009060 | aerobic respiration(GO:0009060) |
| 0.1 | 0.3 | GO:0006546 | glycine catabolic process(GO:0006546) glycine decarboxylation via glycine cleavage system(GO:0019464) |
| 0.1 | 0.6 | GO:0035234 | ectopic germ cell programmed cell death(GO:0035234) |
| 0.1 | 0.3 | GO:0000289 | nuclear-transcribed mRNA poly(A) tail shortening(GO:0000289) |
| 0.1 | 0.3 | GO:2000774 | positive regulation of cellular senescence(GO:2000774) |
| 0.1 | 1.1 | GO:0070935 | 3'-UTR-mediated mRNA stabilization(GO:0070935) |
| 0.1 | 0.3 | GO:1904158 | axonemal central apparatus assembly(GO:1904158) |
| 0.1 | 0.8 | GO:0060766 | negative regulation of androgen receptor signaling pathway(GO:0060766) |
| 0.1 | 2.3 | GO:0010501 | RNA secondary structure unwinding(GO:0010501) |
| 0.1 | 0.3 | GO:0021538 | epithalamus development(GO:0021538) habenula development(GO:0021986) |
| 0.1 | 1.5 | GO:0045792 | negative regulation of cell size(GO:0045792) |
| 0.1 | 1.3 | GO:0030150 | protein import into mitochondrial matrix(GO:0030150) |
| 0.1 | 1.7 | GO:0007250 | activation of NF-kappaB-inducing kinase activity(GO:0007250) |
| 0.1 | 0.1 | GO:0099640 | axo-dendritic protein transport(GO:0099640) |
| 0.1 | 0.6 | GO:0010747 | positive regulation of plasma membrane long-chain fatty acid transport(GO:0010747) |
| 0.1 | 0.3 | GO:0052203 | modulation by symbiont of host molecular function(GO:0052055) modulation of catalytic activity in other organism involved in symbiotic interaction(GO:0052203) modulation by host of symbiont catalytic activity(GO:0052422) |
| 0.1 | 1.2 | GO:2000671 | regulation of motor neuron apoptotic process(GO:2000671) |
| 0.1 | 0.2 | GO:0070934 | CRD-mediated mRNA stabilization(GO:0070934) |
| 0.1 | 1.8 | GO:0016578 | histone deubiquitination(GO:0016578) |
| 0.1 | 0.7 | GO:2000052 | positive regulation of non-canonical Wnt signaling pathway(GO:2000052) |
| 0.1 | 1.5 | GO:0070816 | phosphorylation of RNA polymerase II C-terminal domain(GO:0070816) |
| 0.1 | 0.4 | GO:0017182 | peptidyl-diphthamide metabolic process(GO:0017182) peptidyl-diphthamide biosynthetic process from peptidyl-histidine(GO:0017183) |
| 0.1 | 0.3 | GO:0001788 | antibody-dependent cellular cytotoxicity(GO:0001788) |
| 0.1 | 0.4 | GO:0070829 | heterochromatin maintenance(GO:0070829) |
| 0.1 | 4.7 | GO:0051028 | mRNA transport(GO:0051028) |
| 0.1 | 1.1 | GO:0035988 | chondrocyte proliferation(GO:0035988) |
| 0.1 | 1.6 | GO:2000279 | negative regulation of DNA biosynthetic process(GO:2000279) |
| 0.1 | 0.5 | GO:0035360 | positive regulation of peroxisome proliferator activated receptor signaling pathway(GO:0035360) |
| 0.1 | 0.5 | GO:0035372 | protein localization to microtubule(GO:0035372) |
| 0.1 | 0.2 | GO:0035844 | cloaca development(GO:0035844) |
| 0.1 | 0.2 | GO:0070094 | positive regulation of glucagon secretion(GO:0070094) |
| 0.1 | 0.2 | GO:1903061 | positive regulation of protein lipidation(GO:1903061) |
| 0.1 | 0.7 | GO:0016560 | protein import into peroxisome matrix, docking(GO:0016560) |
| 0.1 | 1.2 | GO:0010766 | negative regulation of sodium ion transport(GO:0010766) |
| 0.1 | 0.2 | GO:0061087 | positive regulation of histone H3-K27 methylation(GO:0061087) |
| 0.1 | 0.8 | GO:0090308 | regulation of methylation-dependent chromatin silencing(GO:0090308) |
| 0.1 | 0.1 | GO:1902774 | late endosome to lysosome transport(GO:1902774) |
| 0.1 | 0.6 | GO:0051126 | negative regulation of actin nucleation(GO:0051126) |
| 0.1 | 0.3 | GO:1903232 | melanosome assembly(GO:1903232) |
| 0.1 | 0.6 | GO:0009303 | rRNA transcription(GO:0009303) |
| 0.1 | 9.6 | GO:0006397 | mRNA processing(GO:0006397) |
| 0.1 | 0.5 | GO:0071044 | histone mRNA catabolic process(GO:0071044) |
| 0.1 | 3.4 | GO:0048538 | thymus development(GO:0048538) |
| 0.1 | 0.3 | GO:0021966 | corticospinal neuron axon guidance(GO:0021966) |
| 0.1 | 0.5 | GO:0006172 | ADP biosynthetic process(GO:0006172) |
| 0.1 | 0.7 | GO:0008063 | Toll signaling pathway(GO:0008063) positive regulation of toll-like receptor 4 signaling pathway(GO:0034145) |
| 0.1 | 1.0 | GO:0070875 | positive regulation of glycogen biosynthetic process(GO:0045725) positive regulation of glycogen metabolic process(GO:0070875) |
| 0.1 | 22.3 | GO:0006412 | translation(GO:0006412) |
| 0.1 | 0.2 | GO:2000680 | regulation of rubidium ion transport(GO:2000680) regulation of rubidium ion transmembrane transporter activity(GO:2000686) |
| 0.1 | 0.8 | GO:0021860 | pyramidal neuron development(GO:0021860) |
| 0.1 | 0.5 | GO:0005513 | detection of calcium ion(GO:0005513) |
| 0.1 | 0.2 | GO:0031161 | phosphatidylinositol catabolic process(GO:0031161) |
| 0.1 | 0.2 | GO:2001293 | malonyl-CoA metabolic process(GO:2001293) |
| 0.1 | 0.5 | GO:0030049 | muscle filament sliding(GO:0030049) |
| 0.1 | 0.6 | GO:0034975 | protein folding in endoplasmic reticulum(GO:0034975) |
| 0.1 | 0.6 | GO:0008089 | anterograde axonal transport(GO:0008089) |
| 0.1 | 0.9 | GO:0051352 | negative regulation of ligase activity(GO:0051352) negative regulation of ubiquitin-protein transferase activity(GO:0051444) |
| 0.1 | 1.4 | GO:0045722 | positive regulation of gluconeogenesis(GO:0045722) |
| 0.1 | 0.5 | GO:0010919 | regulation of inositol phosphate biosynthetic process(GO:0010919) positive regulation of inositol phosphate biosynthetic process(GO:0060732) |
| 0.1 | 0.3 | GO:0048341 | paraxial mesoderm formation(GO:0048341) |
| 0.1 | 1.0 | GO:0050667 | homocysteine metabolic process(GO:0050667) |
| 0.1 | 0.3 | GO:0097350 | neutrophil clearance(GO:0097350) |
| 0.1 | 0.6 | GO:0016576 | histone dephosphorylation(GO:0016576) |
| 0.1 | 1.1 | GO:0007183 | SMAD protein complex assembly(GO:0007183) |
| 0.1 | 0.8 | GO:0048251 | elastic fiber assembly(GO:0048251) |
| 0.1 | 1.0 | GO:0008535 | respiratory chain complex IV assembly(GO:0008535) |
| 0.1 | 0.6 | GO:0060087 | relaxation of vascular smooth muscle(GO:0060087) |
| 0.1 | 1.7 | GO:0043551 | regulation of phosphatidylinositol 3-kinase activity(GO:0043551) |
| 0.1 | 0.3 | GO:1903361 | protein localization to basolateral plasma membrane(GO:1903361) |
| 0.1 | 0.3 | GO:1903237 | negative regulation of leukocyte tethering or rolling(GO:1903237) |
| 0.1 | 1.4 | GO:0002031 | G-protein coupled receptor internalization(GO:0002031) |
| 0.1 | 1.5 | GO:0045747 | positive regulation of Notch signaling pathway(GO:0045747) |
| 0.1 | 0.3 | GO:0090140 | regulation of mitochondrial fission(GO:0090140) |
| 0.1 | 0.5 | GO:0043517 | positive regulation of DNA damage response, signal transduction by p53 class mediator(GO:0043517) |
| 0.1 | 0.3 | GO:0014045 | establishment of endothelial blood-brain barrier(GO:0014045) |
| 0.1 | 0.9 | GO:0034391 | smooth muscle cell apoptotic process(GO:0034390) regulation of smooth muscle cell apoptotic process(GO:0034391) |
| 0.1 | 0.2 | GO:0045650 | negative regulation of macrophage differentiation(GO:0045650) |
| 0.1 | 0.7 | GO:1904030 | negative regulation of cyclin-dependent protein serine/threonine kinase activity(GO:0045736) negative regulation of cyclin-dependent protein kinase activity(GO:1904030) |
| 0.1 | 2.4 | GO:0006261 | DNA-dependent DNA replication(GO:0006261) |
| 0.1 | 0.1 | GO:2000586 | regulation of platelet-derived growth factor receptor-beta signaling pathway(GO:2000586) |
| 0.1 | 0.5 | GO:0050765 | negative regulation of phagocytosis(GO:0050765) |
| 0.1 | 0.4 | GO:0018026 | peptidyl-lysine monomethylation(GO:0018026) |
| 0.1 | 0.1 | GO:2001034 | positive regulation of double-strand break repair via nonhomologous end joining(GO:2001034) |
| 0.1 | 0.4 | GO:0018094 | protein polyglycylation(GO:0018094) |
| 0.1 | 1.9 | GO:0002026 | regulation of the force of heart contraction(GO:0002026) |
| 0.1 | 0.7 | GO:1902254 | negative regulation of intrinsic apoptotic signaling pathway by p53 class mediator(GO:1902254) |
| 0.1 | 0.4 | GO:0051001 | negative regulation of nitric-oxide synthase activity(GO:0051001) |
| 0.1 | 0.2 | GO:0002036 | regulation of L-glutamate transport(GO:0002036) |
| 0.1 | 1.2 | GO:0000305 | response to oxygen radical(GO:0000305) |
| 0.1 | 0.2 | GO:0034058 | endosomal vesicle fusion(GO:0034058) |
| 0.1 | 0.8 | GO:0006490 | oligosaccharide-lipid intermediate biosynthetic process(GO:0006490) |
| 0.1 | 0.5 | GO:0042427 | serotonin biosynthetic process(GO:0042427) primary amino compound biosynthetic process(GO:1901162) |
| 0.1 | 0.4 | GO:1900037 | regulation of cellular response to hypoxia(GO:1900037) |
| 0.1 | 0.5 | GO:0010972 | negative regulation of G2/M transition of mitotic cell cycle(GO:0010972) |
| 0.1 | 1.3 | GO:0045744 | negative regulation of G-protein coupled receptor protein signaling pathway(GO:0045744) |
| 0.1 | 0.3 | GO:1901524 | regulation of macromitophagy(GO:1901524) |
| 0.1 | 0.3 | GO:0006537 | glutamate biosynthetic process(GO:0006537) |
| 0.1 | 0.6 | GO:2001241 | positive regulation of extrinsic apoptotic signaling pathway in absence of ligand(GO:2001241) |
| 0.1 | 0.6 | GO:0060501 | positive regulation of epithelial cell proliferation involved in lung morphogenesis(GO:0060501) |
| 0.1 | 0.1 | GO:1903895 | negative regulation of IRE1-mediated unfolded protein response(GO:1903895) |
| 0.1 | 0.6 | GO:0051298 | centrosome duplication(GO:0051298) |
| 0.1 | 0.4 | GO:0007016 | cytoskeletal anchoring at plasma membrane(GO:0007016) |
| 0.1 | 0.2 | GO:0008050 | female courtship behavior(GO:0008050) |
| 0.1 | 0.3 | GO:0051967 | negative regulation of synaptic transmission, glutamatergic(GO:0051967) |
| 0.1 | 0.2 | GO:0001302 | replicative cell aging(GO:0001302) |
| 0.1 | 0.2 | GO:0045898 | regulation of RNA polymerase II transcriptional preinitiation complex assembly(GO:0045898) |
| 0.1 | 1.9 | GO:0007088 | regulation of mitotic nuclear division(GO:0007088) |
| 0.1 | 0.4 | GO:1905146 | lysosomal protein catabolic process(GO:1905146) |
| 0.1 | 0.2 | GO:0070933 | histone H4 deacetylation(GO:0070933) |
| 0.1 | 0.3 | GO:0061588 | calcium activated phospholipid scrambling(GO:0061588) calcium activated phosphatidylcholine scrambling(GO:0061590) calcium activated galactosylceramide scrambling(GO:0061591) |
| 0.1 | 0.2 | GO:0030309 | poly-N-acetyllactosamine metabolic process(GO:0030309) poly-N-acetyllactosamine biosynthetic process(GO:0030311) |
| 0.1 | 0.1 | GO:0071929 | alpha-tubulin acetylation(GO:0071929) |
| 0.1 | 2.1 | GO:0006396 | RNA processing(GO:0006396) |
| 0.1 | 0.1 | GO:2000095 | regulation of Wnt signaling pathway, planar cell polarity pathway(GO:2000095) |
| 0.1 | 0.3 | GO:0001510 | RNA methylation(GO:0001510) |
| 0.1 | 0.4 | GO:0021942 | radial glia guided migration of Purkinje cell(GO:0021942) |
| 0.0 | 0.0 | GO:1903181 | regulation of dopamine biosynthetic process(GO:1903179) positive regulation of dopamine biosynthetic process(GO:1903181) |
| 0.0 | 0.1 | GO:0008626 | granzyme-mediated apoptotic signaling pathway(GO:0008626) |
| 0.0 | 0.7 | GO:0033601 | positive regulation of mammary gland epithelial cell proliferation(GO:0033601) |
| 0.0 | 0.1 | GO:0039692 | single stranded viral RNA replication via double stranded DNA intermediate(GO:0039692) regulation of single stranded viral RNA replication via double stranded DNA intermediate(GO:0045091) |
| 0.0 | 0.5 | GO:0006359 | regulation of transcription from RNA polymerase III promoter(GO:0006359) |
| 0.0 | 0.6 | GO:0030157 | pancreatic juice secretion(GO:0030157) |
| 0.0 | 0.9 | GO:0051353 | positive regulation of oxidoreductase activity(GO:0051353) |
| 0.0 | 0.4 | GO:0008156 | negative regulation of DNA replication(GO:0008156) |
| 0.0 | 0.3 | GO:0006348 | chromatin silencing at telomere(GO:0006348) |
| 0.0 | 2.3 | GO:0030512 | negative regulation of transforming growth factor beta receptor signaling pathway(GO:0030512) |
| 0.0 | 0.5 | GO:0042744 | hydrogen peroxide catabolic process(GO:0042744) |
| 0.0 | 0.8 | GO:0045333 | cellular respiration(GO:0045333) |
| 0.0 | 1.2 | GO:0046856 | phosphatidylinositol dephosphorylation(GO:0046856) |
| 0.0 | 0.7 | GO:0060539 | diaphragm development(GO:0060539) |
| 0.0 | 0.4 | GO:0003094 | glomerular filtration(GO:0003094) |
| 0.0 | 0.2 | GO:0010815 | bradykinin catabolic process(GO:0010815) |
| 0.0 | 0.1 | GO:0071605 | monocyte chemotactic protein-1 production(GO:0071605) regulation of monocyte chemotactic protein-1 production(GO:0071637) negative regulation of monocyte chemotactic protein-1 production(GO:0071638) |
| 0.0 | 0.7 | GO:0070536 | protein K63-linked deubiquitination(GO:0070536) |
| 0.0 | 0.8 | GO:1900087 | positive regulation of G1/S transition of mitotic cell cycle(GO:1900087) |
| 0.0 | 0.8 | GO:0006054 | N-acetylneuraminate metabolic process(GO:0006054) |
| 0.0 | 0.1 | GO:1902262 | B cell negative selection(GO:0002352) apoptotic process involved in patterning of blood vessels(GO:1902262) |
| 0.0 | 0.1 | GO:0007182 | common-partner SMAD protein phosphorylation(GO:0007182) |
| 0.0 | 0.5 | GO:0007220 | Notch receptor processing(GO:0007220) |
| 0.0 | 0.5 | GO:0055012 | ventricular cardiac muscle cell differentiation(GO:0055012) |
| 0.0 | 1.4 | GO:0060425 | lung morphogenesis(GO:0060425) |
| 0.0 | 0.4 | GO:0042407 | cristae formation(GO:0042407) |
| 0.0 | 0.9 | GO:0030521 | androgen receptor signaling pathway(GO:0030521) |
| 0.0 | 0.5 | GO:0043488 | regulation of mRNA stability(GO:0043488) |
| 0.0 | 0.3 | GO:0002051 | osteoblast fate commitment(GO:0002051) |
| 0.0 | 0.3 | GO:0043982 | histone H4-K5 acetylation(GO:0043981) histone H4-K8 acetylation(GO:0043982) |
| 0.0 | 1.1 | GO:0016486 | peptide hormone processing(GO:0016486) |
| 0.0 | 0.2 | GO:0006741 | NADP biosynthetic process(GO:0006741) |
| 0.0 | 0.1 | GO:0010133 | proline catabolic process to glutamate(GO:0010133) |
| 0.0 | 0.1 | GO:0003273 | cell migration involved in endocardial cushion formation(GO:0003273) |
| 0.0 | 0.1 | GO:0006659 | phosphatidylserine biosynthetic process(GO:0006659) |
| 0.0 | 0.2 | GO:1901096 | regulation of autophagosome maturation(GO:1901096) |
| 0.0 | 0.1 | GO:0051562 | negative regulation of mitochondrial calcium ion concentration(GO:0051562) |
| 0.0 | 0.1 | GO:0044598 | polyketide metabolic process(GO:0030638) aminoglycoside antibiotic metabolic process(GO:0030647) daunorubicin metabolic process(GO:0044597) doxorubicin metabolic process(GO:0044598) |
| 0.0 | 0.3 | GO:0070236 | negative regulation of activation-induced cell death of T cells(GO:0070236) |
| 0.0 | 0.3 | GO:0016926 | protein desumoylation(GO:0016926) |
| 0.0 | 1.5 | GO:0043966 | histone H3 acetylation(GO:0043966) |
| 0.0 | 0.5 | GO:0015937 | coenzyme A biosynthetic process(GO:0015937) |
| 0.0 | 0.2 | GO:0021796 | cerebral cortex regionalization(GO:0021796) |
| 0.0 | 0.3 | GO:0018344 | protein geranylgeranylation(GO:0018344) |
| 0.0 | 0.3 | GO:0071158 | positive regulation of cell cycle arrest(GO:0071158) |
| 0.0 | 0.2 | GO:0045647 | negative regulation of erythrocyte differentiation(GO:0045647) |
| 0.0 | 0.3 | GO:0035435 | phosphate ion transmembrane transport(GO:0035435) |
| 0.0 | 1.2 | GO:0001656 | metanephros development(GO:0001656) |
| 0.0 | 0.2 | GO:0071105 | response to interleukin-11(GO:0071105) osteoclast fusion(GO:0072675) |
| 0.0 | 0.4 | GO:2000144 | positive regulation of DNA-templated transcription, initiation(GO:2000144) |
| 0.0 | 0.1 | GO:0060948 | cardiac vascular smooth muscle cell development(GO:0060948) |
| 0.0 | 0.1 | GO:0072321 | chaperone-mediated protein transport(GO:0072321) |
| 0.0 | 1.0 | GO:0048008 | platelet-derived growth factor receptor signaling pathway(GO:0048008) |
| 0.0 | 0.5 | GO:0001967 | suckling behavior(GO:0001967) |
| 0.0 | 0.3 | GO:0051531 | NFAT protein import into nucleus(GO:0051531) |
| 0.0 | 1.3 | GO:0031529 | ruffle organization(GO:0031529) |
| 0.0 | 0.4 | GO:0015695 | organic cation transport(GO:0015695) |
| 0.0 | 0.8 | GO:0030517 | negative regulation of axon extension(GO:0030517) |
| 0.0 | 0.2 | GO:1904970 | brush border assembly(GO:1904970) |
| 0.0 | 0.1 | GO:0002566 | somatic diversification of immune receptors via somatic mutation(GO:0002566) |
| 0.0 | 0.1 | GO:0097411 | hypoxia-inducible factor-1alpha signaling pathway(GO:0097411) |
| 0.0 | 1.2 | GO:0045931 | positive regulation of mitotic cell cycle(GO:0045931) |
| 0.0 | 0.1 | GO:0033683 | nucleotide-excision repair, DNA incision(GO:0033683) |
| 0.0 | 0.2 | GO:0002291 | T cell activation via T cell receptor contact with antigen bound to MHC molecule on antigen presenting cell(GO:0002291) |
| 0.0 | 0.1 | GO:0034720 | histone H3-K4 demethylation(GO:0034720) |
| 0.0 | 0.5 | GO:0040034 | regulation of development, heterochronic(GO:0040034) |
| 0.0 | 0.2 | GO:0043249 | erythrocyte maturation(GO:0043249) |
| 0.0 | 0.5 | GO:0035411 | catenin import into nucleus(GO:0035411) |
| 0.0 | 0.1 | GO:0031296 | B cell costimulation(GO:0031296) |
| 0.0 | 0.1 | GO:0090168 | Golgi reassembly(GO:0090168) |
| 0.0 | 0.4 | GO:0045780 | positive regulation of bone resorption(GO:0045780) positive regulation of bone remodeling(GO:0046852) |
| 0.0 | 0.3 | GO:0010763 | positive regulation of fibroblast migration(GO:0010763) |
| 0.0 | 0.2 | GO:0060412 | ventricular septum morphogenesis(GO:0060412) |
| 0.0 | 0.1 | GO:0036119 | response to platelet-derived growth factor(GO:0036119) cellular response to platelet-derived growth factor stimulus(GO:0036120) |
| 0.0 | 0.5 | GO:0001706 | endoderm formation(GO:0001706) |
| 0.0 | 0.1 | GO:1904730 | negative regulation of intestinal phytosterol absorption(GO:0010949) negative regulation of intestinal cholesterol absorption(GO:0045796) intestinal phytosterol absorption(GO:0060752) negative regulation of intestinal lipid absorption(GO:1904730) |
| 0.0 | 1.8 | GO:0072332 | intrinsic apoptotic signaling pathway by p53 class mediator(GO:0072332) |
| 0.0 | 0.6 | GO:0034724 | DNA replication-independent nucleosome organization(GO:0034724) |
| 0.0 | 0.4 | GO:0006284 | base-excision repair(GO:0006284) |
| 0.0 | 0.8 | GO:0006198 | cAMP catabolic process(GO:0006198) |
| 0.0 | 0.2 | GO:0019372 | lipoxygenase pathway(GO:0019372) |
| 0.0 | 0.2 | GO:1902459 | positive regulation of stem cell population maintenance(GO:1902459) |
| 0.0 | 0.4 | GO:0035455 | response to interferon-alpha(GO:0035455) |
| 0.0 | 0.1 | GO:0098967 | exocytic insertion of neurotransmitter receptor to plasma membrane(GO:0098881) exocytic insertion of neurotransmitter receptor to postsynaptic membrane(GO:0098967) |
| 0.0 | 0.4 | GO:0035024 | negative regulation of Rho protein signal transduction(GO:0035024) |
| 0.0 | 0.4 | GO:0060325 | face morphogenesis(GO:0060325) |
| 0.0 | 0.0 | GO:0010536 | positive regulation of activation of Janus kinase activity(GO:0010536) |
| 0.0 | 0.1 | GO:0060020 | Bergmann glial cell differentiation(GO:0060020) |
| 0.0 | 0.1 | GO:0003011 | involuntary skeletal muscle contraction(GO:0003011) |
| 0.0 | 0.2 | GO:0006646 | phosphatidylethanolamine biosynthetic process(GO:0006646) |
| 0.0 | 0.3 | GO:0030259 | lipid glycosylation(GO:0030259) |
| 0.0 | 0.4 | GO:2000311 | regulation of alpha-amino-3-hydroxy-5-methyl-4-isoxazole propionate selective glutamate receptor activity(GO:2000311) |
| 0.0 | 0.2 | GO:0051451 | myoblast migration(GO:0051451) |
| 0.0 | 0.9 | GO:1901655 | cellular response to ketone(GO:1901655) |
| 0.0 | 0.2 | GO:0071802 | negative regulation of podosome assembly(GO:0071802) |
| 0.0 | 0.2 | GO:0010529 | regulation of transposition(GO:0010528) negative regulation of transposition(GO:0010529) |
| 0.0 | 0.3 | GO:0070208 | protein heterotrimerization(GO:0070208) |
| 0.0 | 0.6 | GO:0007340 | acrosome reaction(GO:0007340) |
| 0.0 | 0.1 | GO:0033599 | regulation of mammary gland epithelial cell proliferation(GO:0033599) |
| 0.0 | 0.1 | GO:0021678 | third ventricle development(GO:0021678) |
| 0.0 | 0.3 | GO:0009083 | branched-chain amino acid catabolic process(GO:0009083) |
| 0.0 | 0.2 | GO:0032331 | negative regulation of chondrocyte differentiation(GO:0032331) |
| 0.0 | 0.2 | GO:1901099 | negative regulation of signal transduction in absence of ligand(GO:1901099) negative regulation of extrinsic apoptotic signaling pathway in absence of ligand(GO:2001240) |
| 0.0 | 0.7 | GO:0001938 | positive regulation of endothelial cell proliferation(GO:0001938) |
| 0.0 | 0.1 | GO:0045213 | neurotransmitter receptor metabolic process(GO:0045213) |
| 0.0 | 0.3 | GO:0040023 | nuclear migration(GO:0007097) establishment of nucleus localization(GO:0040023) |
| 0.0 | 0.2 | GO:0038092 | nodal signaling pathway(GO:0038092) |
| 0.0 | 0.2 | GO:0051646 | mitochondrion localization(GO:0051646) |
| 0.0 | 0.1 | GO:0032815 | negative regulation of natural killer cell activation(GO:0032815) |
| 0.0 | 0.1 | GO:0070269 | pyroptosis(GO:0070269) |
| 0.0 | 0.1 | GO:0010867 | positive regulation of triglyceride biosynthetic process(GO:0010867) |
| 0.0 | 0.6 | GO:0051966 | regulation of synaptic transmission, glutamatergic(GO:0051966) |
| 0.0 | 0.2 | GO:0072658 | positive regulation of cell communication by electrical coupling(GO:0010650) maintenance of protein location in membrane(GO:0072658) maintenance of protein location in plasma membrane(GO:0072660) positive regulation of membrane depolarization during cardiac muscle cell action potential(GO:1900827) |
| 0.0 | 1.4 | GO:0006626 | protein targeting to mitochondrion(GO:0006626) |
| 0.0 | 0.7 | GO:0015844 | monoamine transport(GO:0015844) |
| 0.0 | 0.1 | GO:1901223 | negative regulation of NIK/NF-kappaB signaling(GO:1901223) |
| 0.0 | 0.7 | GO:0043154 | negative regulation of cysteine-type endopeptidase activity involved in apoptotic process(GO:0043154) |
| 0.0 | 0.4 | GO:0051926 | negative regulation of calcium ion transport(GO:0051926) |
| 0.0 | 0.1 | GO:0042989 | sequestering of actin monomers(GO:0042989) |
| 0.0 | 2.3 | GO:0071805 | potassium ion transmembrane transport(GO:0071805) |
| 0.0 | 0.3 | GO:0032981 | NADH dehydrogenase complex assembly(GO:0010257) mitochondrial respiratory chain complex I assembly(GO:0032981) mitochondrial respiratory chain complex I biogenesis(GO:0097031) |
| 0.0 | 0.0 | GO:0002314 | germinal center B cell differentiation(GO:0002314) |
| 0.0 | 0.2 | GO:0033234 | negative regulation of protein sumoylation(GO:0033234) |
| 0.0 | 0.5 | GO:0045670 | regulation of osteoclast differentiation(GO:0045670) |
| 0.0 | 0.1 | GO:0015014 | heparan sulfate proteoglycan biosynthetic process, polysaccharide chain biosynthetic process(GO:0015014) |
| 0.0 | 0.3 | GO:0002437 | inflammatory response to antigenic stimulus(GO:0002437) |
| 0.0 | 0.2 | GO:0033622 | integrin activation(GO:0033622) |
| 0.0 | 0.1 | GO:0010890 | positive regulation of sequestering of triglyceride(GO:0010890) |
| 0.0 | 0.1 | GO:0002076 | osteoblast development(GO:0002076) |
| 0.0 | 0.2 | GO:0018345 | protein palmitoylation(GO:0018345) |
| 0.0 | 0.1 | GO:0042532 | negative regulation of tyrosine phosphorylation of STAT protein(GO:0042532) |
| 0.0 | 0.5 | GO:0032418 | lysosome localization(GO:0032418) |
| 0.0 | 0.5 | GO:0007218 | neuropeptide signaling pathway(GO:0007218) |
| 0.0 | 0.4 | GO:0000086 | G2/M transition of mitotic cell cycle(GO:0000086) |
| 0.0 | 0.0 | GO:0060693 | regulation of branching involved in salivary gland morphogenesis(GO:0060693) |
| 0.0 | 0.2 | GO:0060716 | labyrinthine layer blood vessel development(GO:0060716) |
| 0.0 | 0.1 | GO:0098734 | protein depalmitoylation(GO:0002084) macromolecule depalmitoylation(GO:0098734) |
| 0.0 | 0.0 | GO:0071877 | regulation of adrenergic receptor signaling pathway(GO:0071877) |
Gene overrepresentation in cellular component category:
| Log-likelihood per target | Total log-likelihood | Term | Description |
|---|---|---|---|
| 3.9 | 11.8 | GO:0005656 | nuclear pre-replicative complex(GO:0005656) pre-replicative complex(GO:0036387) |
| 2.2 | 17.7 | GO:0005818 | aster(GO:0005818) |
| 2.0 | 6.0 | GO:0000799 | nuclear condensin complex(GO:0000799) |
| 1.9 | 11.5 | GO:0031262 | Ndc80 complex(GO:0031262) |
| 1.6 | 4.8 | GO:0071920 | cleavage body(GO:0071920) |
| 1.5 | 18.6 | GO:0005687 | U4 snRNP(GO:0005687) |
| 1.3 | 6.7 | GO:0000408 | EKC/KEOPS complex(GO:0000408) |
| 1.3 | 6.3 | GO:0042719 | mitochondrial intermembrane space protein transporter complex(GO:0042719) |
| 1.3 | 3.8 | GO:0071001 | U4/U6 snRNP(GO:0071001) |
| 1.2 | 3.6 | GO:0035101 | FACT complex(GO:0035101) |
| 1.2 | 3.6 | GO:0018444 | translation release factor complex(GO:0018444) |
| 1.2 | 7.2 | GO:0001651 | dense fibrillar component(GO:0001651) |
| 1.2 | 8.2 | GO:0072379 | BAT3 complex(GO:0071818) ER membrane insertion complex(GO:0072379) |
| 1.1 | 2.3 | GO:0042585 | germinal vesicle(GO:0042585) |
| 1.1 | 7.8 | GO:0000796 | condensin complex(GO:0000796) |
| 1.1 | 9.6 | GO:0008278 | cohesin complex(GO:0008278) |
| 1.1 | 20.1 | GO:0031616 | spindle pole centrosome(GO:0031616) |
| 1.1 | 3.2 | GO:0009328 | phenylalanine-tRNA ligase complex(GO:0009328) |
| 1.0 | 5.2 | GO:0048476 | Holliday junction resolvase complex(GO:0048476) |
| 1.0 | 1.0 | GO:0030981 | cortical microtubule cytoskeleton(GO:0030981) |
| 1.0 | 32.5 | GO:0030687 | preribosome, large subunit precursor(GO:0030687) |
| 1.0 | 3.9 | GO:0031298 | replication fork protection complex(GO:0031298) |
| 0.9 | 6.4 | GO:0097255 | R2TP complex(GO:0097255) |
| 0.9 | 2.7 | GO:0043541 | UDP-N-acetylglucosamine transferase complex(GO:0043541) |
| 0.9 | 8.1 | GO:0005850 | eukaryotic translation initiation factor 2 complex(GO:0005850) |
| 0.9 | 7.2 | GO:0000835 | ER ubiquitin ligase complex(GO:0000835) Hrd1p ubiquitin ligase complex(GO:0000836) |
| 0.9 | 8.7 | GO:0000347 | THO complex(GO:0000347) THO complex part of transcription export complex(GO:0000445) |
| 0.9 | 7.8 | GO:0071541 | eukaryotic translation initiation factor 3 complex, eIF3m(GO:0071541) |
| 0.8 | 41.4 | GO:0022627 | cytosolic small ribosomal subunit(GO:0022627) |
| 0.8 | 20.3 | GO:0030686 | 90S preribosome(GO:0030686) |
| 0.8 | 8.4 | GO:1990023 | mitotic spindle midzone(GO:1990023) |
| 0.8 | 61.9 | GO:0022625 | cytosolic large ribosomal subunit(GO:0022625) |
| 0.8 | 8.3 | GO:0044613 | nuclear pore central transport channel(GO:0044613) |
| 0.8 | 8.1 | GO:0000940 | condensed chromosome outer kinetochore(GO:0000940) |
| 0.8 | 4.0 | GO:0097149 | centralspindlin complex(GO:0097149) |
| 0.8 | 8.8 | GO:0031080 | nuclear pore outer ring(GO:0031080) |
| 0.8 | 7.2 | GO:0031390 | Ctf18 RFC-like complex(GO:0031390) |
| 0.8 | 2.4 | GO:0097543 | ciliary inversin compartment(GO:0097543) |
| 0.8 | 1.5 | GO:0000110 | nucleotide-excision repair factor 1 complex(GO:0000110) |
| 0.8 | 4.5 | GO:0070847 | core mediator complex(GO:0070847) |
| 0.7 | 3.7 | GO:0005672 | transcription factor TFIIA complex(GO:0005672) |
| 0.7 | 4.4 | GO:0005852 | eukaryotic translation initiation factor 3 complex(GO:0005852) |
| 0.7 | 3.7 | GO:0000120 | RNA polymerase I transcription factor complex(GO:0000120) |
| 0.7 | 3.0 | GO:0071797 | LUBAC complex(GO:0071797) |
| 0.7 | 9.4 | GO:0042555 | MCM complex(GO:0042555) |
| 0.7 | 4.3 | GO:0097443 | sorting endosome(GO:0097443) |
| 0.7 | 24.9 | GO:0035371 | microtubule plus-end(GO:0035371) |
| 0.7 | 11.9 | GO:0034518 | mRNA cap binding complex(GO:0005845) RNA cap binding complex(GO:0034518) |
| 0.7 | 7.4 | GO:0019773 | proteasome core complex, alpha-subunit complex(GO:0019773) |
| 0.6 | 3.2 | GO:0071006 | U2-type catalytic step 1 spliceosome(GO:0071006) |
| 0.6 | 9.0 | GO:0005662 | DNA replication factor A complex(GO:0005662) |
| 0.6 | 3.8 | GO:0098536 | deuterosome(GO:0098536) |
| 0.6 | 3.8 | GO:0000808 | origin recognition complex(GO:0000808) nuclear origin of replication recognition complex(GO:0005664) |
| 0.6 | 0.6 | GO:0034715 | pICln-Sm protein complex(GO:0034715) |
| 0.6 | 1.8 | GO:0070985 | TFIIK complex(GO:0070985) |
| 0.6 | 0.6 | GO:0019034 | viral replication complex(GO:0019034) |
| 0.6 | 9.5 | GO:0005736 | DNA-directed RNA polymerase I complex(GO:0005736) |
| 0.6 | 4.1 | GO:0033588 | Elongator holoenzyme complex(GO:0033588) |
| 0.6 | 5.2 | GO:0005742 | mitochondrial outer membrane translocase complex(GO:0005742) |
| 0.6 | 2.3 | GO:0005658 | alpha DNA polymerase:primase complex(GO:0005658) |
| 0.6 | 3.4 | GO:0070531 | BRCA1-A complex(GO:0070531) |
| 0.6 | 6.7 | GO:0005686 | U2 snRNP(GO:0005686) |
| 0.6 | 5.5 | GO:0031595 | nuclear proteasome complex(GO:0031595) |
| 0.5 | 9.8 | GO:0032040 | small-subunit processome(GO:0032040) |
| 0.5 | 3.2 | GO:1990726 | Lsm1-7-Pat1 complex(GO:1990726) |
| 0.5 | 3.1 | GO:0071204 | histone pre-mRNA 3'end processing complex(GO:0071204) |
| 0.5 | 4.6 | GO:0000439 | core TFIIH complex(GO:0000439) |
| 0.5 | 1.5 | GO:0034271 | phosphatidylinositol 3-kinase complex, class III, type I(GO:0034271) phosphatidylinositol 3-kinase complex, class III, type II(GO:0034272) |
| 0.5 | 4.0 | GO:0000275 | mitochondrial proton-transporting ATP synthase complex, catalytic core F(1)(GO:0000275) proton-transporting ATP synthase complex, catalytic core F(1)(GO:0045261) |
| 0.5 | 2.0 | GO:0030870 | Mre11 complex(GO:0030870) |
| 0.5 | 0.5 | GO:0055087 | Ski complex(GO:0055087) |
| 0.5 | 2.0 | GO:0070761 | pre-snoRNP complex(GO:0070761) |
| 0.5 | 1.0 | GO:0005688 | U6 snRNP(GO:0005688) |
| 0.5 | 7.0 | GO:0001673 | male germ cell nucleus(GO:0001673) |
| 0.5 | 2.8 | GO:0097504 | Gemini of coiled bodies(GO:0097504) |
| 0.5 | 3.7 | GO:0070652 | HAUS complex(GO:0070652) |
| 0.5 | 4.2 | GO:0000801 | central element(GO:0000801) |
| 0.5 | 1.8 | GO:0098799 | outer mitochondrial membrane protein complex(GO:0098799) |
| 0.5 | 22.2 | GO:0009295 | nucleoid(GO:0009295) mitochondrial nucleoid(GO:0042645) |
| 0.4 | 1.7 | GO:0071817 | MMXD complex(GO:0071817) |
| 0.4 | 2.6 | GO:0031314 | extrinsic component of mitochondrial inner membrane(GO:0031314) |
| 0.4 | 3.0 | GO:0032300 | mismatch repair complex(GO:0032300) |
| 0.4 | 4.2 | GO:0044327 | dendritic spine head(GO:0044327) |
| 0.4 | 1.7 | GO:0045257 | mitochondrial respiratory chain complex II, succinate dehydrogenase complex (ubiquinone)(GO:0005749) succinate dehydrogenase complex (ubiquinone)(GO:0045257) respiratory chain complex II(GO:0045273) succinate dehydrogenase complex(GO:0045281) fumarate reductase complex(GO:0045283) |
| 0.4 | 3.8 | GO:0005642 | annulate lamellae(GO:0005642) |
| 0.4 | 4.2 | GO:0061700 | GATOR2 complex(GO:0061700) |
| 0.4 | 0.8 | GO:0044615 | nuclear pore nuclear basket(GO:0044615) |
| 0.4 | 1.6 | GO:0071953 | elastic fiber(GO:0071953) |
| 0.4 | 2.4 | GO:0032299 | ribonuclease H2 complex(GO:0032299) |
| 0.4 | 1.5 | GO:0019907 | cyclin-dependent protein kinase activating kinase holoenzyme complex(GO:0019907) |
| 0.4 | 5.3 | GO:0005666 | DNA-directed RNA polymerase III complex(GO:0005666) |
| 0.4 | 1.1 | GO:0031510 | SUMO activating enzyme complex(GO:0031510) |
| 0.4 | 1.5 | GO:0030289 | protein phosphatase 4 complex(GO:0030289) |
| 0.4 | 1.1 | GO:0035061 | interchromatin granule(GO:0035061) |
| 0.4 | 6.2 | GO:0005689 | U12-type spliceosomal complex(GO:0005689) |
| 0.4 | 3.2 | GO:0000015 | phosphopyruvate hydratase complex(GO:0000015) |
| 0.4 | 3.2 | GO:0061574 | ASAP complex(GO:0061574) |
| 0.4 | 1.4 | GO:0005745 | m-AAA complex(GO:0005745) |
| 0.4 | 1.4 | GO:0034709 | methylosome(GO:0034709) |
| 0.4 | 3.5 | GO:0005750 | mitochondrial respiratory chain complex III(GO:0005750) |
| 0.3 | 2.1 | GO:1990393 | 3M complex(GO:1990393) |
| 0.3 | 13.0 | GO:0015030 | Cajal body(GO:0015030) |
| 0.3 | 2.0 | GO:0030688 | preribosome, small subunit precursor(GO:0030688) |
| 0.3 | 1.0 | GO:1990257 | piccolo-bassoon transport vesicle(GO:1990257) |
| 0.3 | 4.2 | GO:0005839 | proteasome core complex(GO:0005839) |
| 0.3 | 2.6 | GO:0030314 | junctional membrane complex(GO:0030314) |
| 0.3 | 5.8 | GO:0035327 | transcriptionally active chromatin(GO:0035327) |
| 0.3 | 3.5 | GO:0031931 | TORC1 complex(GO:0031931) |
| 0.3 | 0.6 | GO:0031074 | nucleocytoplasmic shuttling complex(GO:0031074) |
| 0.3 | 0.6 | GO:0044614 | nuclear pore cytoplasmic filaments(GO:0044614) |
| 0.3 | 0.9 | GO:0071012 | catalytic step 1 spliceosome(GO:0071012) |
| 0.3 | 1.2 | GO:0043564 | Ku70:Ku80 complex(GO:0043564) |
| 0.3 | 3.9 | GO:0005862 | muscle thin filament tropomyosin(GO:0005862) |
| 0.3 | 0.6 | GO:0036396 | MIS complex(GO:0036396) mRNA editing complex(GO:0045293) |
| 0.3 | 0.9 | GO:0031429 | box H/ACA snoRNP complex(GO:0031429) box H/ACA RNP complex(GO:0072588) |
| 0.3 | 2.0 | GO:0005956 | protein kinase CK2 complex(GO:0005956) |
| 0.3 | 4.0 | GO:0017101 | aminoacyl-tRNA synthetase multienzyme complex(GO:0017101) |
| 0.3 | 3.1 | GO:0043240 | Fanconi anaemia nuclear complex(GO:0043240) |
| 0.3 | 4.5 | GO:0002199 | zona pellucida receptor complex(GO:0002199) |
| 0.3 | 3.1 | GO:0071439 | clathrin complex(GO:0071439) |
| 0.3 | 1.4 | GO:0005968 | Rab-protein geranylgeranyltransferase complex(GO:0005968) |
| 0.3 | 3.0 | GO:0071011 | precatalytic spliceosome(GO:0071011) |
| 0.3 | 1.4 | GO:0000974 | Prp19 complex(GO:0000974) |
| 0.3 | 1.1 | GO:0008537 | proteasome activator complex(GO:0008537) |
| 0.3 | 0.8 | GO:0005965 | protein farnesyltransferase complex(GO:0005965) |
| 0.3 | 19.3 | GO:0071013 | catalytic step 2 spliceosome(GO:0071013) |
| 0.3 | 14.5 | GO:0005762 | organellar large ribosomal subunit(GO:0000315) mitochondrial large ribosomal subunit(GO:0005762) |
| 0.3 | 1.3 | GO:0070187 | telosome(GO:0070187) |
| 0.3 | 0.8 | GO:0005967 | mitochondrial pyruvate dehydrogenase complex(GO:0005967) |
| 0.3 | 2.5 | GO:0016272 | prefoldin complex(GO:0016272) |
| 0.2 | 0.7 | GO:0005899 | insulin receptor complex(GO:0005899) |
| 0.2 | 0.7 | GO:0033186 | CAF-1 complex(GO:0033186) |
| 0.2 | 4.2 | GO:0005751 | mitochondrial respiratory chain complex IV(GO:0005751) |
| 0.2 | 6.0 | GO:0005680 | anaphase-promoting complex(GO:0005680) |
| 0.2 | 1.4 | GO:0005853 | eukaryotic translation elongation factor 1 complex(GO:0005853) |
| 0.2 | 0.9 | GO:1990707 | subtelomeric heterochromatin(GO:1990421) nuclear subtelomeric heterochromatin(GO:1990707) |
| 0.2 | 0.9 | GO:0090537 | CERF complex(GO:0090537) |
| 0.2 | 0.9 | GO:0044316 | cone cell pedicle(GO:0044316) |
| 0.2 | 7.0 | GO:0000314 | organellar small ribosomal subunit(GO:0000314) mitochondrial small ribosomal subunit(GO:0005763) |
| 0.2 | 3.6 | GO:0005838 | proteasome regulatory particle(GO:0005838) |
| 0.2 | 10.2 | GO:0005657 | replication fork(GO:0005657) |
| 0.2 | 1.6 | GO:0042382 | paraspeckles(GO:0042382) |
| 0.2 | 1.3 | GO:1903440 | calcitonin family receptor complex(GO:1903439) amylin receptor complex(GO:1903440) |
| 0.2 | 1.9 | GO:0005697 | telomerase holoenzyme complex(GO:0005697) |
| 0.2 | 11.5 | GO:0005871 | kinesin complex(GO:0005871) |
| 0.2 | 1.0 | GO:0070876 | SOSS complex(GO:0070876) |
| 0.2 | 0.6 | GO:0005947 | mitochondrial alpha-ketoglutarate dehydrogenase complex(GO:0005947) |
| 0.2 | 2.3 | GO:0005869 | dynactin complex(GO:0005869) |
| 0.2 | 2.1 | GO:0072669 | tRNA-splicing ligase complex(GO:0072669) |
| 0.2 | 2.4 | GO:0005885 | Arp2/3 protein complex(GO:0005885) |
| 0.2 | 1.0 | GO:0030915 | Smc5-Smc6 complex(GO:0030915) |
| 0.2 | 4.0 | GO:0035861 | site of double-strand break(GO:0035861) |
| 0.2 | 1.0 | GO:0034751 | aryl hydrocarbon receptor complex(GO:0034751) |
| 0.2 | 1.9 | GO:0044214 | spanning component of plasma membrane(GO:0044214) spanning component of membrane(GO:0089717) |
| 0.2 | 4.7 | GO:0000930 | gamma-tubulin complex(GO:0000930) |
| 0.2 | 0.2 | GO:0001405 | presequence translocase-associated import motor(GO:0001405) |
| 0.2 | 0.9 | GO:0071547 | piP-body(GO:0071547) |
| 0.2 | 2.3 | GO:0005665 | DNA-directed RNA polymerase II, core complex(GO:0005665) |
| 0.2 | 2.7 | GO:0032039 | integrator complex(GO:0032039) |
| 0.2 | 0.7 | GO:0033647 | host intracellular organelle(GO:0033647) host intracellular membrane-bounded organelle(GO:0033648) |
| 0.2 | 1.7 | GO:0030123 | AP-3 adaptor complex(GO:0030123) |
| 0.2 | 0.5 | GO:0071942 | XPC complex(GO:0071942) |
| 0.2 | 2.0 | GO:0000164 | protein phosphatase type 1 complex(GO:0000164) |
| 0.2 | 1.8 | GO:0042788 | polysomal ribosome(GO:0042788) |
| 0.2 | 0.7 | GO:0002189 | ribose phosphate diphosphokinase complex(GO:0002189) |
| 0.2 | 2.1 | GO:0097539 | ciliary transition fiber(GO:0097539) |
| 0.2 | 10.5 | GO:0005758 | mitochondrial intermembrane space(GO:0005758) |
| 0.2 | 2.1 | GO:0031414 | N-terminal protein acetyltransferase complex(GO:0031414) |
| 0.2 | 0.6 | GO:1990032 | parallel fiber(GO:1990032) |
| 0.2 | 2.5 | GO:0005753 | mitochondrial proton-transporting ATP synthase complex(GO:0005753) |
| 0.2 | 1.1 | GO:0030896 | checkpoint clamp complex(GO:0030896) |
| 0.2 | 1.8 | GO:0070852 | cell body fiber(GO:0070852) |
| 0.2 | 5.4 | GO:0005840 | ribosome(GO:0005840) |
| 0.1 | 0.3 | GO:0000153 | cytoplasmic ubiquitin ligase complex(GO:0000153) |
| 0.1 | 0.4 | GO:0031251 | PAN complex(GO:0031251) |
| 0.1 | 2.0 | GO:0008385 | IkappaB kinase complex(GO:0008385) |
| 0.1 | 4.0 | GO:0005876 | spindle microtubule(GO:0005876) |
| 0.1 | 1.6 | GO:0043020 | NADPH oxidase complex(GO:0043020) |
| 0.1 | 0.7 | GO:0044611 | nuclear pore inner ring(GO:0044611) |
| 0.1 | 1.2 | GO:0045252 | oxoglutarate dehydrogenase complex(GO:0045252) |
| 0.1 | 1.2 | GO:0005883 | neurofilament(GO:0005883) |
| 0.1 | 110.6 | GO:0005730 | nucleolus(GO:0005730) |
| 0.1 | 0.9 | GO:0097025 | MPP7-DLG1-LIN7 complex(GO:0097025) |
| 0.1 | 0.3 | GO:0014802 | terminal cisterna(GO:0014802) |
| 0.1 | 0.1 | GO:1990796 | photoreceptor cell terminal bouton(GO:1990796) |
| 0.1 | 0.3 | GO:0005675 | holo TFIIH complex(GO:0005675) |
| 0.1 | 2.3 | GO:0030914 | STAGA complex(GO:0030914) |
| 0.1 | 0.4 | GO:0033276 | transcription factor TFTC complex(GO:0033276) |
| 0.1 | 1.5 | GO:0005583 | fibrillar collagen trimer(GO:0005583) banded collagen fibril(GO:0098643) |
| 0.1 | 4.5 | GO:0030131 | clathrin adaptor complex(GO:0030131) |
| 0.1 | 0.7 | GO:0032983 | kainate selective glutamate receptor complex(GO:0032983) |
| 0.1 | 1.5 | GO:0044300 | cerebellar mossy fiber(GO:0044300) |
| 0.1 | 5.9 | GO:0005643 | nuclear pore(GO:0005643) |
| 0.1 | 10.6 | GO:0005759 | mitochondrial matrix(GO:0005759) |
| 0.1 | 1.8 | GO:0001741 | XY body(GO:0001741) |
| 0.1 | 1.1 | GO:0045298 | tubulin complex(GO:0045298) |
| 0.1 | 0.5 | GO:0005851 | eukaryotic translation initiation factor 2B complex(GO:0005851) |
| 0.1 | 0.3 | GO:0097452 | GAIT complex(GO:0097452) |
| 0.1 | 1.5 | GO:0005685 | U1 snRNP(GO:0005685) |
| 0.1 | 2.2 | GO:0016010 | dystrophin-associated glycoprotein complex(GO:0016010) glycoprotein complex(GO:0090665) |
| 0.1 | 1.4 | GO:0072546 | ER membrane protein complex(GO:0072546) |
| 0.1 | 0.3 | GO:1990716 | axonemal central apparatus(GO:1990716) |
| 0.1 | 0.7 | GO:0017071 | intracellular cyclic nucleotide activated cation channel complex(GO:0017071) |
| 0.1 | 0.3 | GO:0005610 | laminin-5 complex(GO:0005610) |
| 0.1 | 0.7 | GO:0033116 | endoplasmic reticulum-Golgi intermediate compartment membrane(GO:0033116) |
| 0.1 | 1.1 | GO:0070938 | contractile ring(GO:0070938) |
| 0.1 | 0.3 | GO:0042406 | extrinsic component of endoplasmic reticulum membrane(GO:0042406) |
| 0.1 | 1.1 | GO:0020005 | symbiont-containing vacuole membrane(GO:0020005) |
| 0.1 | 0.6 | GO:0045009 | melanosome membrane(GO:0033162) chitosome(GO:0045009) |
| 0.1 | 1.0 | GO:1990712 | HFE-transferrin receptor complex(GO:1990712) |
| 0.1 | 1.7 | GO:0030056 | hemidesmosome(GO:0030056) |
| 0.1 | 1.0 | GO:0097208 | alveolar lamellar body(GO:0097208) |
| 0.1 | 0.6 | GO:0097165 | nuclear stress granule(GO:0097165) |
| 0.1 | 0.6 | GO:0005671 | Ada2/Gcn5/Ada3 transcription activator complex(GO:0005671) |
| 0.1 | 1.3 | GO:0005847 | mRNA cleavage and polyadenylation specificity factor complex(GO:0005847) |
| 0.1 | 3.5 | GO:0005746 | mitochondrial respiratory chain(GO:0005746) |
| 0.1 | 1.5 | GO:0043189 | NuA4 histone acetyltransferase complex(GO:0035267) H4/H2A histone acetyltransferase complex(GO:0043189) H4 histone acetyltransferase complex(GO:1902562) |
| 0.1 | 0.2 | GO:0098592 | cytoplasmic side of apical plasma membrane(GO:0098592) |
| 0.1 | 0.6 | GO:0016281 | eukaryotic translation initiation factor 4F complex(GO:0016281) |
| 0.1 | 0.8 | GO:0008290 | F-actin capping protein complex(GO:0008290) |
| 0.1 | 0.8 | GO:0005640 | nuclear outer membrane(GO:0005640) |
| 0.1 | 5.1 | GO:0000776 | kinetochore(GO:0000776) |
| 0.1 | 0.5 | GO:0016461 | unconventional myosin complex(GO:0016461) |
| 0.1 | 1.0 | GO:0031258 | lamellipodium membrane(GO:0031258) |
| 0.1 | 1.8 | GO:0005719 | nuclear euchromatin(GO:0005719) |
| 0.1 | 0.2 | GO:0000783 | telomere cap complex(GO:0000782) nuclear telomere cap complex(GO:0000783) |
| 0.1 | 1.0 | GO:0051233 | spindle midzone(GO:0051233) |
| 0.1 | 1.7 | GO:0000502 | proteasome complex(GO:0000502) |
| 0.1 | 1.1 | GO:0030118 | clathrin coat(GO:0030118) |
| 0.1 | 1.3 | GO:0005605 | basal lamina(GO:0005605) |
| 0.1 | 0.1 | GO:0033061 | DNA recombinase mediator complex(GO:0033061) |
| 0.1 | 0.2 | GO:0031084 | BLOC-2 complex(GO:0031084) |
| 0.1 | 0.2 | GO:0071148 | TEAD-1-YAP complex(GO:0071148) |
| 0.1 | 0.2 | GO:0044354 | pinosome(GO:0044352) macropinosome(GO:0044354) |
| 0.1 | 3.9 | GO:0016605 | PML body(GO:0016605) |
| 0.1 | 0.8 | GO:0071339 | MLL1/2 complex(GO:0044665) MLL1 complex(GO:0071339) |
| 0.1 | 0.2 | GO:0031371 | ubiquitin conjugating enzyme complex(GO:0031371) |
| 0.1 | 0.3 | GO:0071598 | neuronal ribonucleoprotein granule(GO:0071598) |
| 0.1 | 0.5 | GO:0030061 | mitochondrial crista(GO:0030061) |
| 0.1 | 1.7 | GO:0043034 | costamere(GO:0043034) |
| 0.1 | 0.7 | GO:0002178 | palmitoyltransferase complex(GO:0002178) |
| 0.1 | 0.2 | GO:0034687 | integrin alphaL-beta2 complex(GO:0034687) |
| 0.0 | 0.3 | GO:0032584 | growth cone membrane(GO:0032584) |
| 0.0 | 2.3 | GO:0044295 | axonal growth cone(GO:0044295) |
| 0.0 | 3.1 | GO:0016363 | nuclear matrix(GO:0016363) |
| 0.0 | 0.2 | GO:0032437 | cuticular plate(GO:0032437) |
| 0.0 | 1.3 | GO:0000775 | chromosome, centromeric region(GO:0000775) |
| 0.0 | 0.3 | GO:0070578 | RISC-loading complex(GO:0070578) |
| 0.0 | 0.2 | GO:0060187 | cell pole(GO:0060187) |
| 0.0 | 0.4 | GO:0061617 | MICOS complex(GO:0061617) |
| 0.0 | 0.9 | GO:0032839 | dendrite cytoplasm(GO:0032839) |
| 0.0 | 0.1 | GO:0071595 | Nem1-Spo7 phosphatase complex(GO:0071595) |
| 0.0 | 0.1 | GO:0097636 | intrinsic component of autophagosome membrane(GO:0097636) integral component of autophagosome membrane(GO:0097637) |
| 0.0 | 0.1 | GO:0070877 | microprocessor complex(GO:0070877) ribonuclease III complex(GO:1903095) |
| 0.0 | 2.1 | GO:0031672 | A band(GO:0031672) |
| 0.0 | 0.2 | GO:0030119 | AP-type membrane coat adaptor complex(GO:0030119) |
| 0.0 | 0.4 | GO:0033093 | Weibel-Palade body(GO:0033093) |
| 0.0 | 4.0 | GO:0031526 | brush border membrane(GO:0031526) |
| 0.0 | 0.1 | GO:0005673 | transcription factor TFIIE complex(GO:0005673) |
| 0.0 | 0.1 | GO:0097169 | AIM2 inflammasome complex(GO:0097169) |
| 0.0 | 1.2 | GO:0016592 | mediator complex(GO:0016592) |
| 0.0 | 0.8 | GO:1902711 | GABA-A receptor complex(GO:1902711) |
| 0.0 | 0.2 | GO:0032541 | cortical endoplasmic reticulum(GO:0032541) |
| 0.0 | 0.4 | GO:0035686 | sperm fibrous sheath(GO:0035686) |
| 0.0 | 1.6 | GO:0005881 | cytoplasmic microtubule(GO:0005881) |
| 0.0 | 2.8 | GO:0005581 | collagen trimer(GO:0005581) |
| 0.0 | 0.2 | GO:1990391 | DNA repair complex(GO:1990391) |
| 0.0 | 0.5 | GO:0036038 | MKS complex(GO:0036038) |
| 0.0 | 0.7 | GO:0043194 | axon initial segment(GO:0043194) |
| 0.0 | 0.8 | GO:0090544 | BAF-type complex(GO:0090544) |
| 0.0 | 0.9 | GO:0030673 | axolemma(GO:0030673) |
| 0.0 | 16.9 | GO:0005694 | chromosome(GO:0005694) |
| 0.0 | 0.6 | GO:0016460 | myosin II complex(GO:0016460) |
| 0.0 | 0.3 | GO:0031970 | organelle envelope lumen(GO:0031970) |
| 0.0 | 1.9 | GO:0098878 | ionotropic glutamate receptor complex(GO:0008328) neurotransmitter receptor complex(GO:0098878) |
| 0.0 | 0.1 | GO:0043190 | ATP-binding cassette (ABC) transporter complex(GO:0043190) |
| 0.0 | 0.4 | GO:0032593 | insulin-responsive compartment(GO:0032593) |
| 0.0 | 0.7 | GO:0005942 | phosphatidylinositol 3-kinase complex(GO:0005942) |
| 0.0 | 0.5 | GO:0000159 | protein phosphatase type 2A complex(GO:0000159) |
| 0.0 | 0.1 | GO:0097427 | microtubule bundle(GO:0097427) |
| 0.0 | 0.5 | GO:0032426 | stereocilium tip(GO:0032426) |
| 0.0 | 0.9 | GO:0016459 | myosin complex(GO:0016459) |
| 0.0 | 0.2 | GO:0090576 | RNA polymerase III transcription factor complex(GO:0090576) |
| 0.0 | 0.3 | GO:0098827 | endoplasmic reticulum subcompartment(GO:0098827) |
| 0.0 | 0.3 | GO:0005892 | acetylcholine-gated channel complex(GO:0005892) |
| 0.0 | 6.3 | GO:0005743 | mitochondrial inner membrane(GO:0005743) |
| 0.0 | 0.3 | GO:0033180 | proton-transporting V-type ATPase, V1 domain(GO:0033180) |
| 0.0 | 0.1 | GO:0043293 | apoptosome(GO:0043293) |
| 0.0 | 0.2 | GO:0046581 | intercellular canaliculus(GO:0046581) |
| 0.0 | 0.2 | GO:0031105 | septin complex(GO:0031105) |
| 0.0 | 0.7 | GO:0008180 | COP9 signalosome(GO:0008180) |
| 0.0 | 0.2 | GO:0030127 | COPII vesicle coat(GO:0030127) |
| 0.0 | 0.1 | GO:0097136 | Bcl-2 family protein complex(GO:0097136) |
| 0.0 | 0.1 | GO:0031680 | G-protein beta/gamma-subunit complex(GO:0031680) |
| 0.0 | 2.2 | GO:0031965 | nuclear membrane(GO:0031965) |
| 0.0 | 0.1 | GO:0031313 | extrinsic component of endosome membrane(GO:0031313) |
| 0.0 | 1.0 | GO:0005811 | lipid particle(GO:0005811) |
| 0.0 | 0.0 | GO:0097524 | sperm plasma membrane(GO:0097524) |
| 0.0 | 0.3 | GO:0099738 | cell cortex region(GO:0099738) |
| 0.0 | 0.3 | GO:0044298 | neuronal cell body membrane(GO:0032809) cell body membrane(GO:0044298) |
| 0.0 | 0.3 | GO:0031941 | filamentous actin(GO:0031941) |
Gene overrepresentation in molecular function category:
| Log-likelihood per target | Total log-likelihood | Term | Description |
|---|---|---|---|
| 2.7 | 8.2 | GO:0044715 | 8-oxo-dGDP phosphatase activity(GO:0044715) |
| 2.2 | 8.7 | GO:0050347 | trans-hexaprenyltranstransferase activity(GO:0000010) trans-octaprenyltranstransferase activity(GO:0050347) |
| 1.9 | 17.3 | GO:1990446 | U1 snRNP binding(GO:1990446) |
| 1.4 | 12.7 | GO:0061676 | importin-alpha family protein binding(GO:0061676) |
| 1.4 | 7.0 | GO:0000702 | oxidized base lesion DNA N-glycosylase activity(GO:0000702) |
| 1.4 | 4.1 | GO:0030337 | DNA polymerase processivity factor activity(GO:0030337) |
| 1.3 | 18.2 | GO:0003688 | DNA replication origin binding(GO:0003688) |
| 1.3 | 2.5 | GO:0032139 | dinucleotide insertion or deletion binding(GO:0032139) |
| 1.2 | 3.7 | GO:0001042 | RNA polymerase I core binding(GO:0001042) |
| 1.1 | 8.8 | GO:0009019 | tRNA (guanine-N1-)-methyltransferase activity(GO:0009019) |
| 1.1 | 7.4 | GO:0016428 | tRNA (cytosine-5-)-methyltransferase activity(GO:0016428) |
| 1.1 | 7.4 | GO:0034513 | box H/ACA snoRNA binding(GO:0034513) |
| 1.0 | 3.1 | GO:0008192 | RNA guanylyltransferase activity(GO:0008192) |
| 1.0 | 3.1 | GO:0070140 | isopeptidase activity(GO:0070122) ubiquitin-like protein-specific isopeptidase activity(GO:0070138) SUMO-specific isopeptidase activity(GO:0070140) |
| 1.0 | 3.9 | GO:0004449 | isocitrate dehydrogenase (NAD+) activity(GO:0004449) |
| 0.9 | 7.6 | GO:0070180 | large ribosomal subunit rRNA binding(GO:0070180) |
| 0.9 | 12.0 | GO:0043142 | single-stranded DNA-dependent ATPase activity(GO:0043142) |
| 0.9 | 2.6 | GO:0009383 | rRNA (cytosine-C5-)-methyltransferase activity(GO:0009383) |
| 0.9 | 6.9 | GO:0008821 | crossover junction endodeoxyribonuclease activity(GO:0008821) |
| 0.8 | 2.5 | GO:1990450 | linear polyubiquitin binding(GO:1990450) |
| 0.8 | 5.8 | GO:0004523 | RNA-DNA hybrid ribonuclease activity(GO:0004523) |
| 0.8 | 4.0 | GO:0000309 | nicotinamide-nucleotide adenylyltransferase activity(GO:0000309) nicotinate-nucleotide adenylyltransferase activity(GO:0004515) |
| 0.8 | 3.9 | GO:0043515 | kinetochore binding(GO:0043515) |
| 0.8 | 4.6 | GO:0043141 | ATP-dependent 5'-3' DNA helicase activity(GO:0043141) |
| 0.8 | 6.1 | GO:1901612 | cardiolipin binding(GO:1901612) |
| 0.7 | 6.0 | GO:0070181 | small ribosomal subunit rRNA binding(GO:0070181) |
| 0.7 | 3.6 | GO:0043812 | phosphatidylinositol-4-phosphate phosphatase activity(GO:0043812) |
| 0.7 | 1.4 | GO:0070990 | snRNP binding(GO:0070990) |
| 0.7 | 2.2 | GO:0052743 | inositol tetrakisphosphate phosphatase activity(GO:0052743) |
| 0.7 | 15.5 | GO:1990381 | ubiquitin-specific protease binding(GO:1990381) |
| 0.7 | 4.2 | GO:0001179 | RNA polymerase I transcription factor binding(GO:0001179) |
| 0.7 | 5.5 | GO:0043023 | ribosomal large subunit binding(GO:0043023) |
| 0.7 | 2.0 | GO:0071207 | histone pre-mRNA stem-loop binding(GO:0071207) |
| 0.7 | 4.6 | GO:0016018 | cyclosporin A binding(GO:0016018) |
| 0.6 | 2.6 | GO:1990932 | 5.8S rRNA binding(GO:1990932) |
| 0.6 | 1.9 | GO:0051538 | 3 iron, 4 sulfur cluster binding(GO:0051538) |
| 0.6 | 17.7 | GO:0070182 | DNA polymerase binding(GO:0070182) |
| 0.6 | 3.2 | GO:0003917 | DNA topoisomerase type I activity(GO:0003917) |
| 0.6 | 2.5 | GO:0030621 | U4 snRNA binding(GO:0030621) |
| 0.6 | 33.1 | GO:0019843 | rRNA binding(GO:0019843) |
| 0.6 | 1.8 | GO:0004829 | threonine-tRNA ligase activity(GO:0004829) |
| 0.6 | 4.2 | GO:0032027 | myosin light chain binding(GO:0032027) |
| 0.6 | 1.8 | GO:0047751 | 3-oxo-5-alpha-steroid 4-dehydrogenase activity(GO:0003865) cholestenone 5-alpha-reductase activity(GO:0047751) |
| 0.6 | 1.8 | GO:0000179 | rRNA (adenine-N6,N6-)-dimethyltransferase activity(GO:0000179) |
| 0.6 | 2.4 | GO:0004663 | Rab geranylgeranyltransferase activity(GO:0004663) |
| 0.6 | 15.6 | GO:0008569 | ATP-dependent microtubule motor activity, minus-end-directed(GO:0008569) |
| 0.6 | 1.7 | GO:0004482 | mRNA (guanine-N7-)-methyltransferase activity(GO:0004482) |
| 0.6 | 2.3 | GO:0004045 | aminoacyl-tRNA hydrolase activity(GO:0004045) |
| 0.6 | 13.6 | GO:0030515 | snoRNA binding(GO:0030515) |
| 0.6 | 1.7 | GO:0004948 | calcitonin receptor activity(GO:0004948) |
| 0.5 | 2.7 | GO:0001094 | TFIID-class transcription factor binding(GO:0001094) |
| 0.5 | 3.2 | GO:0008518 | reduced folate carrier activity(GO:0008518) |
| 0.5 | 6.4 | GO:0016423 | tRNA (guanine) methyltransferase activity(GO:0016423) |
| 0.5 | 3.7 | GO:0003747 | translation release factor activity(GO:0003747) translation termination factor activity(GO:0008079) |
| 0.5 | 2.6 | GO:0004826 | phenylalanine-tRNA ligase activity(GO:0004826) |
| 0.5 | 6.1 | GO:0016783 | sulfurtransferase activity(GO:0016783) |
| 0.5 | 31.5 | GO:0003743 | translation initiation factor activity(GO:0003743) |
| 0.5 | 11.6 | GO:0004298 | threonine-type endopeptidase activity(GO:0004298) threonine-type peptidase activity(GO:0070003) |
| 0.5 | 67.9 | GO:0003735 | structural constituent of ribosome(GO:0003735) |
| 0.5 | 1.9 | GO:0004566 | beta-glucuronidase activity(GO:0004566) |
| 0.5 | 12.3 | GO:0017056 | structural constituent of nuclear pore(GO:0017056) |
| 0.5 | 2.4 | GO:0010997 | anaphase-promoting complex binding(GO:0010997) |
| 0.5 | 1.4 | GO:0004704 | NF-kappaB-inducing kinase activity(GO:0004704) |
| 0.5 | 2.8 | GO:0061649 | ubiquitinated histone binding(GO:0061649) |
| 0.5 | 1.8 | GO:0004703 | G-protein coupled receptor kinase activity(GO:0004703) |
| 0.5 | 9.2 | GO:0001056 | RNA polymerase III activity(GO:0001056) |
| 0.5 | 1.4 | GO:0008113 | peptide-methionine (S)-S-oxide reductase activity(GO:0008113) |
| 0.4 | 12.1 | GO:0003887 | DNA-directed DNA polymerase activity(GO:0003887) |
| 0.4 | 2.2 | GO:0003916 | DNA topoisomerase activity(GO:0003916) DNA topoisomerase type II (ATP-hydrolyzing) activity(GO:0003918) DNA topoisomerase II activity(GO:0061505) |
| 0.4 | 1.3 | GO:0001156 | TFIIIC-class transcription factor binding(GO:0001156) |
| 0.4 | 0.9 | GO:0071209 | U7 snRNA binding(GO:0071209) |
| 0.4 | 3.5 | GO:0008121 | ubiquinol-cytochrome-c reductase activity(GO:0008121) oxidoreductase activity, acting on diphenols and related substances as donors, cytochrome as acceptor(GO:0016681) |
| 0.4 | 1.3 | GO:0016174 | NAD(P)H oxidase activity(GO:0016174) |
| 0.4 | 1.3 | GO:0016855 | racemase and epimerase activity, acting on amino acids and derivatives(GO:0016855) racemase activity, acting on amino acids and derivatives(GO:0036361) amino-acid racemase activity(GO:0047661) |
| 0.4 | 3.4 | GO:0036310 | annealing helicase activity(GO:0036310) |
| 0.4 | 6.9 | GO:0051010 | microtubule plus-end binding(GO:0051010) |
| 0.4 | 2.1 | GO:0016531 | copper chaperone activity(GO:0016531) |
| 0.4 | 2.9 | GO:0036402 | proteasome-activating ATPase activity(GO:0036402) |
| 0.4 | 1.2 | GO:0016748 | succinyltransferase activity(GO:0016748) |
| 0.4 | 1.2 | GO:0000033 | alpha-1,3-mannosyltransferase activity(GO:0000033) |
| 0.4 | 4.0 | GO:0000339 | RNA cap binding(GO:0000339) |
| 0.4 | 1.6 | GO:0004839 | ubiquitin activating enzyme activity(GO:0004839) |
| 0.4 | 4.6 | GO:0017070 | U6 snRNA binding(GO:0017070) |
| 0.4 | 0.8 | GO:0016434 | rRNA (cytosine) methyltransferase activity(GO:0016434) |
| 0.4 | 2.2 | GO:0015450 | P-P-bond-hydrolysis-driven protein transmembrane transporter activity(GO:0015450) |
| 0.4 | 4.4 | GO:0070700 | BMP receptor binding(GO:0070700) |
| 0.4 | 0.4 | GO:0051430 | corticotropin-releasing hormone receptor 1 binding(GO:0051430) |
| 0.4 | 1.5 | GO:0030984 | kininogen binding(GO:0030984) |
| 0.4 | 0.4 | GO:0001129 | transcription factor activity, RNA polymerase II basal transcription factor binding(GO:0001083) RNA polymerase II transcription factor activity, TBP-class protein binding, involved in preinitiation complex assembly(GO:0001129) RNA polymerase II transcription factor activity, TBP-class protein binding(GO:0001132) |
| 0.4 | 1.4 | GO:0015057 | thrombin receptor activity(GO:0015057) |
| 0.4 | 1.4 | GO:0035243 | protein-arginine omega-N symmetric methyltransferase activity(GO:0035243) |
| 0.4 | 3.2 | GO:0004634 | phosphopyruvate hydratase activity(GO:0004634) |
| 0.4 | 1.1 | GO:0016206 | catechol O-methyltransferase activity(GO:0016206) |
| 0.4 | 2.5 | GO:0008174 | mRNA methyltransferase activity(GO:0008174) |
| 0.3 | 2.1 | GO:0034618 | arginine binding(GO:0034618) |
| 0.3 | 1.4 | GO:0036313 | phosphatidylinositol 3-kinase catalytic subunit binding(GO:0036313) |
| 0.3 | 10.3 | GO:0004003 | ATP-dependent DNA helicase activity(GO:0004003) |
| 0.3 | 2.4 | GO:0004957 | prostaglandin E receptor activity(GO:0004957) |
| 0.3 | 6.4 | GO:0008353 | RNA polymerase II carboxy-terminal domain kinase activity(GO:0008353) |
| 0.3 | 3.0 | GO:0004438 | phosphatidylinositol-3-phosphatase activity(GO:0004438) |
| 0.3 | 2.0 | GO:0008190 | eukaryotic initiation factor 4E binding(GO:0008190) |
| 0.3 | 1.0 | GO:0046964 | 3'-phosphoadenosine 5'-phosphosulfate transmembrane transporter activity(GO:0046964) |
| 0.3 | 1.0 | GO:0033829 | O-fucosylpeptide 3-beta-N-acetylglucosaminyltransferase activity(GO:0033829) |
| 0.3 | 1.3 | GO:0031687 | A2A adenosine receptor binding(GO:0031687) |
| 0.3 | 2.6 | GO:0003886 | DNA (cytosine-5-)-methyltransferase activity(GO:0003886) |
| 0.3 | 2.5 | GO:0030550 | acetylcholine receptor inhibitor activity(GO:0030550) |
| 0.3 | 0.9 | GO:0000700 | mismatch base pair DNA N-glycosylase activity(GO:0000700) |
| 0.3 | 0.6 | GO:0032135 | DNA insertion or deletion binding(GO:0032135) single base insertion or deletion binding(GO:0032138) |
| 0.3 | 2.5 | GO:0016888 | endodeoxyribonuclease activity, producing 5'-phosphomonoesters(GO:0016888) |
| 0.3 | 3.7 | GO:0010181 | FMN binding(GO:0010181) |
| 0.3 | 8.8 | GO:0000175 | 3'-5'-exoribonuclease activity(GO:0000175) |
| 0.3 | 3.0 | GO:0098599 | palmitoyl-(protein) hydrolase activity(GO:0008474) palmitoyl hydrolase activity(GO:0098599) |
| 0.3 | 2.1 | GO:0000990 | transcription factor activity, core RNA polymerase binding(GO:0000990) |
| 0.3 | 0.9 | GO:0004637 | phosphoribosylamine-glycine ligase activity(GO:0004637) |
| 0.3 | 2.4 | GO:0046935 | 1-phosphatidylinositol-3-kinase regulator activity(GO:0046935) |
| 0.3 | 1.5 | GO:0036435 | K48-linked polyubiquitin binding(GO:0036435) |
| 0.3 | 1.5 | GO:0008494 | translation activator activity(GO:0008494) |
| 0.3 | 1.5 | GO:0008761 | UDP-N-acetylglucosamine 2-epimerase activity(GO:0008761) |
| 0.3 | 1.2 | GO:0034647 | histone demethylase activity (H3-trimethyl-K4 specific)(GO:0034647) |
| 0.3 | 0.9 | GO:0061575 | cyclin-dependent protein serine/threonine kinase activator activity(GO:0061575) |
| 0.3 | 9.0 | GO:0071949 | FAD binding(GO:0071949) |
| 0.3 | 11.5 | GO:0003684 | damaged DNA binding(GO:0003684) |
| 0.3 | 5.6 | GO:0098641 | cadherin binding involved in cell-cell adhesion(GO:0098641) |
| 0.3 | 0.5 | GO:0016314 | phosphatidylinositol-3,4,5-trisphosphate 3-phosphatase activity(GO:0016314) |
| 0.3 | 6.0 | GO:0003899 | DNA-directed RNA polymerase activity(GO:0003899) |
| 0.3 | 0.8 | GO:0051747 | cytosine C-5 DNA demethylase activity(GO:0051747) |
| 0.3 | 0.8 | GO:0001729 | ceramide kinase activity(GO:0001729) |
| 0.3 | 10.8 | GO:0003755 | peptidyl-prolyl cis-trans isomerase activity(GO:0003755) |
| 0.3 | 0.8 | GO:0000171 | ribonuclease MRP activity(GO:0000171) |
| 0.3 | 2.1 | GO:0050815 | phosphoserine binding(GO:0050815) |
| 0.3 | 0.8 | GO:0009918 | sterol delta7 reductase activity(GO:0009918) 7-dehydrocholesterol reductase activity(GO:0047598) |
| 0.3 | 0.8 | GO:1990050 | phosphatidic acid transporter activity(GO:1990050) |
| 0.3 | 1.8 | GO:0048407 | platelet-derived growth factor binding(GO:0048407) |
| 0.3 | 1.0 | GO:0004609 | phosphatidylserine decarboxylase activity(GO:0004609) |
| 0.3 | 2.3 | GO:0035174 | histone serine kinase activity(GO:0035174) |
| 0.3 | 3.0 | GO:0001163 | RNA polymerase I regulatory region sequence-specific DNA binding(GO:0001163) RNA polymerase I CORE element sequence-specific DNA binding(GO:0001164) |
| 0.2 | 4.2 | GO:0046933 | proton-transporting ATP synthase activity, rotational mechanism(GO:0046933) |
| 0.2 | 10.7 | GO:0008536 | Ran GTPase binding(GO:0008536) |
| 0.2 | 6.6 | GO:0016676 | cytochrome-c oxidase activity(GO:0004129) heme-copper terminal oxidase activity(GO:0015002) oxidoreductase activity, acting on a heme group of donors(GO:0016675) oxidoreductase activity, acting on a heme group of donors, oxygen as acceptor(GO:0016676) |
| 0.2 | 1.2 | GO:0031493 | nucleosomal histone binding(GO:0031493) |
| 0.2 | 0.7 | GO:0000402 | open form four-way junction DNA binding(GO:0000401) crossed form four-way junction DNA binding(GO:0000402) |
| 0.2 | 0.7 | GO:0017150 | tRNA dihydrouridine synthase activity(GO:0017150) |
| 0.2 | 0.9 | GO:0032217 | riboflavin transporter activity(GO:0032217) |
| 0.2 | 16.4 | GO:0003777 | microtubule motor activity(GO:0003777) |
| 0.2 | 0.7 | GO:0005308 | creatine transmembrane transporter activity(GO:0005308) |
| 0.2 | 0.5 | GO:0044020 | histone methyltransferase activity (H4-R3 specific)(GO:0044020) |
| 0.2 | 1.1 | GO:0010521 | telomerase inhibitor activity(GO:0010521) |
| 0.2 | 0.7 | GO:0019961 | interferon binding(GO:0019961) |
| 0.2 | 1.1 | GO:0004095 | carnitine O-palmitoyltransferase activity(GO:0004095) O-palmitoyltransferase activity(GO:0016416) |
| 0.2 | 1.1 | GO:0048248 | CXCR3 chemokine receptor binding(GO:0048248) |
| 0.2 | 1.1 | GO:0035368 | selenocysteine insertion sequence binding(GO:0035368) |
| 0.2 | 1.1 | GO:0070051 | fibrinogen binding(GO:0070051) |
| 0.2 | 0.9 | GO:0015199 | amino-acid betaine transmembrane transporter activity(GO:0015199) carnitine transmembrane transporter activity(GO:0015226) |
| 0.2 | 0.7 | GO:0003858 | 3-hydroxybutyrate dehydrogenase activity(GO:0003858) |
| 0.2 | 1.1 | GO:0008449 | N-acetylglucosamine-6-sulfatase activity(GO:0008449) |
| 0.2 | 6.2 | GO:0070840 | dynein complex binding(GO:0070840) |
| 0.2 | 1.3 | GO:0015277 | kainate selective glutamate receptor activity(GO:0015277) |
| 0.2 | 1.9 | GO:0070891 | lipoteichoic acid binding(GO:0070891) |
| 0.2 | 1.5 | GO:0015266 | protein channel activity(GO:0015266) |
| 0.2 | 0.6 | GO:0047179 | platelet-activating factor acetyltransferase activity(GO:0047179) |
| 0.2 | 4.1 | GO:0008139 | nuclear localization sequence binding(GO:0008139) |
| 0.2 | 0.6 | GO:0004828 | serine-tRNA ligase activity(GO:0004828) |
| 0.2 | 1.0 | GO:0008545 | JUN kinase kinase activity(GO:0008545) |
| 0.2 | 1.0 | GO:0072510 | ferric iron transmembrane transporter activity(GO:0015091) trivalent inorganic cation transmembrane transporter activity(GO:0072510) |
| 0.2 | 1.8 | GO:0004908 | interleukin-1 receptor activity(GO:0004908) |
| 0.2 | 0.8 | GO:0008240 | tripeptidyl-peptidase activity(GO:0008240) |
| 0.2 | 14.2 | GO:0016651 | oxidoreductase activity, acting on NAD(P)H(GO:0016651) |
| 0.2 | 0.4 | GO:0008311 | double-stranded DNA 3'-5' exodeoxyribonuclease activity(GO:0008311) |
| 0.2 | 1.3 | GO:0008559 | xenobiotic-transporting ATPase activity(GO:0008559) |
| 0.2 | 0.8 | GO:0008802 | betaine-aldehyde dehydrogenase activity(GO:0008802) |
| 0.2 | 0.8 | GO:0034603 | pyruvate dehydrogenase activity(GO:0004738) pyruvate dehydrogenase [NAD(P)+] activity(GO:0034603) pyruvate dehydrogenase (NAD+) activity(GO:0034604) |
| 0.2 | 0.9 | GO:0015616 | DNA translocase activity(GO:0015616) |
| 0.2 | 1.7 | GO:0008301 | DNA binding, bending(GO:0008301) |
| 0.2 | 0.6 | GO:0004140 | dephospho-CoA kinase activity(GO:0004140) |
| 0.2 | 1.8 | GO:0001135 | transcription factor activity, RNA polymerase II transcription factor recruiting(GO:0001135) |
| 0.2 | 7.3 | GO:0001099 | basal transcription machinery binding(GO:0001098) basal RNA polymerase II transcription machinery binding(GO:0001099) |
| 0.2 | 0.5 | GO:0001032 | RNA polymerase III type 3 promoter DNA binding(GO:0001032) |
| 0.2 | 1.4 | GO:0031811 | G-protein coupled nucleotide receptor binding(GO:0031811) P2Y1 nucleotide receptor binding(GO:0031812) |
| 0.2 | 1.4 | GO:0032051 | clathrin light chain binding(GO:0032051) |
| 0.2 | 2.2 | GO:0070402 | NADPH binding(GO:0070402) |
| 0.2 | 0.7 | GO:0016842 | amidine-lyase activity(GO:0016842) |
| 0.2 | 0.7 | GO:0004749 | ribose phosphate diphosphokinase activity(GO:0004749) |
| 0.2 | 0.7 | GO:0042895 | antibiotic transporter activity(GO:0042895) |
| 0.2 | 0.7 | GO:0031782 | melanocortin receptor binding(GO:0031779) type 3 melanocortin receptor binding(GO:0031781) type 4 melanocortin receptor binding(GO:0031782) |
| 0.2 | 0.6 | GO:0044729 | hemi-methylated DNA-binding(GO:0044729) |
| 0.2 | 0.3 | GO:0001147 | transcription termination site sequence-specific DNA binding(GO:0001147) transcription termination site DNA binding(GO:0001160) |
| 0.2 | 1.4 | GO:0034450 | ubiquitin-ubiquitin ligase activity(GO:0034450) |
| 0.2 | 2.5 | GO:0016891 | endoribonuclease activity, producing 5'-phosphomonoesters(GO:0016891) |
| 0.2 | 0.6 | GO:0033142 | progesterone receptor binding(GO:0033142) |
| 0.2 | 2.6 | GO:0017069 | snRNA binding(GO:0017069) |
| 0.2 | 0.6 | GO:0000822 | inositol hexakisphosphate binding(GO:0000822) |
| 0.2 | 0.9 | GO:0097016 | L27 domain binding(GO:0097016) |
| 0.2 | 3.4 | GO:0003950 | NAD+ ADP-ribosyltransferase activity(GO:0003950) |
| 0.2 | 0.9 | GO:0042030 | ATPase inhibitor activity(GO:0042030) |
| 0.2 | 0.9 | GO:0005222 | intracellular cAMP activated cation channel activity(GO:0005222) |
| 0.2 | 2.7 | GO:0008143 | poly(A) binding(GO:0008143) |
| 0.2 | 0.5 | GO:0070139 | ubiquitin-like protein-specific endopeptidase activity(GO:0070137) SUMO-specific endopeptidase activity(GO:0070139) |
| 0.2 | 2.0 | GO:0015643 | toxic substance binding(GO:0015643) |
| 0.1 | 1.0 | GO:0008312 | 7S RNA binding(GO:0008312) |
| 0.1 | 0.4 | GO:0071077 | coenzyme A transmembrane transporter activity(GO:0015228) adenosine 3',5'-bisphosphate transmembrane transporter activity(GO:0071077) AMP transmembrane transporter activity(GO:0080122) |
| 0.1 | 1.0 | GO:0004652 | polynucleotide adenylyltransferase activity(GO:0004652) |
| 0.1 | 5.3 | GO:0016876 | aminoacyl-tRNA ligase activity(GO:0004812) ligase activity, forming carbon-oxygen bonds(GO:0016875) ligase activity, forming aminoacyl-tRNA and related compounds(GO:0016876) |
| 0.1 | 3.5 | GO:0008432 | JUN kinase binding(GO:0008432) |
| 0.1 | 0.4 | GO:0019767 | IgE receptor activity(GO:0019767) |
| 0.1 | 0.6 | GO:0047429 | nucleoside-triphosphate diphosphatase activity(GO:0047429) |
| 0.1 | 0.8 | GO:0022851 | GABA-gated chloride ion channel activity(GO:0022851) |
| 0.1 | 0.5 | GO:0004510 | tryptophan 5-monooxygenase activity(GO:0004510) |
| 0.1 | 6.6 | GO:0005201 | extracellular matrix structural constituent(GO:0005201) |
| 0.1 | 1.2 | GO:0044388 | small protein activating enzyme binding(GO:0044388) |
| 0.1 | 4.5 | GO:0004527 | exonuclease activity(GO:0004527) |
| 0.1 | 0.9 | GO:0001849 | complement component C1q binding(GO:0001849) |
| 0.1 | 0.3 | GO:0001851 | complement component C3b binding(GO:0001851) |
| 0.1 | 1.3 | GO:0015193 | L-proline transmembrane transporter activity(GO:0015193) |
| 0.1 | 1.0 | GO:0061133 | endopeptidase activator activity(GO:0061133) |
| 0.1 | 0.4 | GO:0010698 | acetyltransferase activator activity(GO:0010698) |
| 0.1 | 0.1 | GO:0034648 | histone demethylase activity (H3-dimethyl-K4 specific)(GO:0034648) |
| 0.1 | 7.6 | GO:0003697 | single-stranded DNA binding(GO:0003697) |
| 0.1 | 13.2 | GO:0005200 | structural constituent of cytoskeleton(GO:0005200) |
| 0.1 | 0.5 | GO:0004488 | methenyltetrahydrofolate cyclohydrolase activity(GO:0004477) methylenetetrahydrofolate dehydrogenase (NADP+) activity(GO:0004488) |
| 0.1 | 0.5 | GO:0070644 | vitamin D response element binding(GO:0070644) |
| 0.1 | 0.4 | GO:0070736 | protein-glycine ligase activity, initiating(GO:0070736) |
| 0.1 | 1.5 | GO:0050692 | DBD domain binding(GO:0050692) |
| 0.1 | 1.4 | GO:0016861 | intramolecular oxidoreductase activity, interconverting aldoses and ketoses(GO:0016861) |
| 0.1 | 0.4 | GO:0008107 | galactoside 2-alpha-L-fucosyltransferase activity(GO:0008107) alpha-(1,2)-fucosyltransferase activity(GO:0031127) |
| 0.1 | 1.1 | GO:0017017 | MAP kinase tyrosine/serine/threonine phosphatase activity(GO:0017017) |
| 0.1 | 0.9 | GO:0048101 | calmodulin-dependent cyclic-nucleotide phosphodiesterase activity(GO:0004117) calcium- and calmodulin-regulated 3',5'-cyclic-GMP phosphodiesterase activity(GO:0048101) |
| 0.1 | 1.2 | GO:0050291 | sphingosine N-acyltransferase activity(GO:0050291) |
| 0.1 | 2.6 | GO:0017025 | TBP-class protein binding(GO:0017025) |
| 0.1 | 0.2 | GO:0070573 | metallodipeptidase activity(GO:0070573) |
| 0.1 | 0.8 | GO:0035240 | dopamine binding(GO:0035240) |
| 0.1 | 0.7 | GO:0005052 | peroxisome matrix targeting signal-1 binding(GO:0005052) |
| 0.1 | 2.0 | GO:0003746 | translation elongation factor activity(GO:0003746) |
| 0.1 | 1.3 | GO:1990405 | protein antigen binding(GO:1990405) |
| 0.1 | 0.1 | GO:0035276 | ethanol binding(GO:0035276) |
| 0.1 | 0.2 | GO:0003880 | protein C-terminal carboxyl O-methyltransferase activity(GO:0003880) |
| 0.1 | 0.7 | GO:0030375 | thyroid hormone receptor coactivator activity(GO:0030375) |
| 0.1 | 1.7 | GO:0009982 | pseudouridine synthase activity(GO:0009982) |
| 0.1 | 0.6 | GO:0070815 | peptidyl-lysine 5-dioxygenase activity(GO:0070815) |
| 0.1 | 1.7 | GO:0003680 | AT DNA binding(GO:0003680) |
| 0.1 | 1.5 | GO:0070063 | RNA polymerase binding(GO:0070063) |
| 0.1 | 0.5 | GO:0031404 | chloride ion binding(GO:0031404) |
| 0.1 | 0.9 | GO:0035173 | histone kinase activity(GO:0035173) |
| 0.1 | 0.6 | GO:0015501 | glutamate:sodium symporter activity(GO:0015501) |
| 0.1 | 2.4 | GO:0008173 | RNA methyltransferase activity(GO:0008173) |
| 0.1 | 0.2 | GO:0097677 | STAT family protein binding(GO:0097677) |
| 0.1 | 0.2 | GO:0051990 | (R)-2-hydroxyglutarate dehydrogenase activity(GO:0051990) |
| 0.1 | 0.4 | GO:0050501 | hyaluronan synthase activity(GO:0050501) |
| 0.1 | 0.3 | GO:0035605 | peptidyl-cysteine S-nitrosylase activity(GO:0035605) |
| 0.1 | 0.3 | GO:0030158 | protein xylosyltransferase activity(GO:0030158) |
| 0.1 | 1.9 | GO:0042165 | neurotransmitter binding(GO:0042165) |
| 0.1 | 1.6 | GO:0004596 | peptide alpha-N-acetyltransferase activity(GO:0004596) |
| 0.1 | 0.5 | GO:0003835 | beta-galactoside alpha-2,6-sialyltransferase activity(GO:0003835) |
| 0.1 | 1.3 | GO:0031386 | protein tag(GO:0031386) |
| 0.1 | 0.4 | GO:0052798 | beta-galactoside alpha-2,3-sialyltransferase activity(GO:0052798) |
| 0.1 | 0.2 | GO:0044547 | DNA topoisomerase binding(GO:0044547) |
| 0.1 | 3.3 | GO:0043015 | gamma-tubulin binding(GO:0043015) |
| 0.1 | 0.2 | GO:0016635 | succinate dehydrogenase (ubiquinone) activity(GO:0008177) oxidoreductase activity, acting on the CH-CH group of donors, quinone or related compound as acceptor(GO:0016635) |
| 0.1 | 0.3 | GO:0003963 | RNA-3'-phosphate cyclase activity(GO:0003963) |
| 0.1 | 4.5 | GO:0004864 | protein phosphatase inhibitor activity(GO:0004864) |
| 0.1 | 0.8 | GO:0034596 | phosphatidylinositol phosphate 4-phosphatase activity(GO:0034596) |
| 0.1 | 0.7 | GO:0008420 | CTD phosphatase activity(GO:0008420) |
| 0.1 | 1.9 | GO:0031681 | G-protein beta-subunit binding(GO:0031681) |
| 0.1 | 0.3 | GO:0019776 | Atg8 ligase activity(GO:0019776) |
| 0.1 | 4.1 | GO:0061650 | ubiquitin-like protein conjugating enzyme activity(GO:0061650) |
| 0.1 | 2.2 | GO:0017134 | fibroblast growth factor binding(GO:0017134) |
| 0.1 | 1.1 | GO:0015194 | L-serine transmembrane transporter activity(GO:0015194) serine transmembrane transporter activity(GO:0022889) |
| 0.1 | 0.4 | GO:0043758 | acetate-CoA ligase (ADP-forming) activity(GO:0043758) |
| 0.1 | 5.8 | GO:0003724 | RNA helicase activity(GO:0003724) ATP-dependent RNA helicase activity(GO:0004004) RNA-dependent ATPase activity(GO:0008186) |
| 0.1 | 0.3 | GO:0031735 | CCR10 chemokine receptor binding(GO:0031735) |
| 0.1 | 1.9 | GO:0004970 | ionotropic glutamate receptor activity(GO:0004970) |
| 0.1 | 0.4 | GO:2001069 | glycogen binding(GO:2001069) |
| 0.1 | 11.5 | GO:0008168 | methyltransferase activity(GO:0008168) |
| 0.1 | 0.6 | GO:0015252 | hydrogen ion channel activity(GO:0015252) |
| 0.1 | 0.7 | GO:0008504 | monoamine transmembrane transporter activity(GO:0008504) |
| 0.1 | 0.4 | GO:0043559 | insulin binding(GO:0043559) |
| 0.1 | 0.4 | GO:0004459 | L-lactate dehydrogenase activity(GO:0004459) |
| 0.1 | 0.4 | GO:0042162 | telomeric DNA binding(GO:0042162) |
| 0.1 | 1.6 | GO:0016290 | palmitoyl-CoA hydrolase activity(GO:0016290) |
| 0.1 | 0.3 | GO:0004694 | eukaryotic translation initiation factor 2alpha kinase activity(GO:0004694) |
| 0.1 | 0.5 | GO:0032795 | heterotrimeric G-protein binding(GO:0032795) |
| 0.1 | 4.2 | GO:0004402 | histone acetyltransferase activity(GO:0004402) |
| 0.1 | 1.9 | GO:0031434 | mitogen-activated protein kinase kinase binding(GO:0031434) |
| 0.1 | 0.2 | GO:0070883 | pre-miRNA binding(GO:0070883) |
| 0.1 | 101.8 | GO:0003723 | RNA binding(GO:0003723) |
| 0.1 | 0.5 | GO:0005021 | vascular endothelial growth factor-activated receptor activity(GO:0005021) |
| 0.1 | 0.7 | GO:0004861 | cyclin-dependent protein serine/threonine kinase inhibitor activity(GO:0004861) |
| 0.1 | 0.4 | GO:0004022 | alcohol dehydrogenase (NAD) activity(GO:0004022) |
| 0.1 | 0.6 | GO:0000774 | adenyl-nucleotide exchange factor activity(GO:0000774) |
| 0.1 | 0.7 | GO:0016624 | oxidoreductase activity, acting on the aldehyde or oxo group of donors, disulfide as acceptor(GO:0016624) |
| 0.1 | 0.4 | GO:0001758 | retinal dehydrogenase activity(GO:0001758) alditol:NADP+ 1-oxidoreductase activity(GO:0004032) |
| 0.1 | 0.5 | GO:0061665 | SUMO ligase activity(GO:0061665) |
| 0.1 | 1.3 | GO:0032041 | histone deacetylase activity (H3-K14 specific)(GO:0031078) NAD-dependent histone deacetylase activity (H3-K14 specific)(GO:0032041) |
| 0.1 | 0.3 | GO:0016909 | JUN kinase activity(GO:0004705) SAP kinase activity(GO:0016909) |
| 0.1 | 0.3 | GO:0061513 | hexose phosphate transmembrane transporter activity(GO:0015119) organophosphate:inorganic phosphate antiporter activity(GO:0015315) hexose-phosphate:inorganic phosphate antiporter activity(GO:0015526) glucose 6-phosphate:inorganic phosphate antiporter activity(GO:0061513) |
| 0.1 | 8.4 | GO:0047485 | protein N-terminus binding(GO:0047485) |
| 0.1 | 1.4 | GO:0030215 | semaphorin receptor binding(GO:0030215) |
| 0.1 | 1.9 | GO:0005112 | Notch binding(GO:0005112) |
| 0.1 | 0.9 | GO:0004385 | guanylate kinase activity(GO:0004385) |
| 0.1 | 0.4 | GO:0016176 | superoxide-generating NADPH oxidase activator activity(GO:0016176) |
| 0.1 | 5.9 | GO:0001104 | RNA polymerase II transcription cofactor activity(GO:0001104) |
| 0.1 | 0.8 | GO:0004017 | adenylate kinase activity(GO:0004017) |
| 0.1 | 0.3 | GO:0019770 | IgG receptor activity(GO:0019770) |
| 0.1 | 0.2 | GO:0008532 | N-acetyllactosaminide beta-1,3-N-acetylglucosaminyltransferase activity(GO:0008532) |
| 0.1 | 0.7 | GO:0031802 | type 5 metabotropic glutamate receptor binding(GO:0031802) |
| 0.1 | 0.3 | GO:0004430 | 1-phosphatidylinositol 4-kinase activity(GO:0004430) |
| 0.1 | 1.0 | GO:0017049 | GTP-Rho binding(GO:0017049) |
| 0.1 | 0.2 | GO:0030369 | ICAM-3 receptor activity(GO:0030369) |
| 0.1 | 0.7 | GO:0050321 | tau-protein kinase activity(GO:0050321) |
| 0.1 | 1.8 | GO:0043395 | heparan sulfate proteoglycan binding(GO:0043395) |
| 0.1 | 5.9 | GO:0008013 | beta-catenin binding(GO:0008013) |
| 0.1 | 0.4 | GO:0046966 | thyroid hormone receptor binding(GO:0046966) |
| 0.1 | 2.2 | GO:0004386 | helicase activity(GO:0004386) |
| 0.1 | 7.5 | GO:0005089 | Rho guanyl-nucleotide exchange factor activity(GO:0005089) |
| 0.1 | 0.3 | GO:0004345 | glucose-6-phosphate dehydrogenase activity(GO:0004345) |
| 0.1 | 1.0 | GO:0017075 | syntaxin-1 binding(GO:0017075) |
| 0.1 | 1.8 | GO:0030742 | GTP-dependent protein binding(GO:0030742) |
| 0.1 | 0.7 | GO:0015197 | peptide transporter activity(GO:0015197) |
| 0.1 | 0.3 | GO:0086006 | voltage-gated sodium channel activity involved in cardiac muscle cell action potential(GO:0086006) |
| 0.1 | 16.0 | GO:0005096 | GTPase activator activity(GO:0005096) |
| 0.1 | 0.5 | GO:0031730 | CCR5 chemokine receptor binding(GO:0031730) |
| 0.1 | 2.7 | GO:0015459 | potassium channel regulator activity(GO:0015459) |
| 0.1 | 5.7 | GO:0004222 | metalloendopeptidase activity(GO:0004222) |
| 0.1 | 0.6 | GO:0071933 | Arp2/3 complex binding(GO:0071933) |
| 0.0 | 0.1 | GO:0004886 | 9-cis retinoic acid receptor activity(GO:0004886) |
| 0.0 | 0.6 | GO:0070064 | proline-rich region binding(GO:0070064) |
| 0.0 | 0.3 | GO:0004359 | glutaminase activity(GO:0004359) |
| 0.0 | 0.3 | GO:0019784 | NEDD8-specific protease activity(GO:0019784) |
| 0.0 | 2.3 | GO:0015179 | L-amino acid transmembrane transporter activity(GO:0015179) |
| 0.0 | 0.5 | GO:0009931 | calcium-dependent protein serine/threonine kinase activity(GO:0009931) |
| 0.0 | 1.1 | GO:0004198 | calcium-dependent cysteine-type endopeptidase activity(GO:0004198) |
| 0.0 | 0.3 | GO:0000182 | rDNA binding(GO:0000182) |
| 0.0 | 0.4 | GO:1990226 | histone methyltransferase binding(GO:1990226) |
| 0.0 | 0.6 | GO:0015035 | protein disulfide oxidoreductase activity(GO:0015035) |
| 0.0 | 0.1 | GO:0016508 | long-chain-enoyl-CoA hydratase activity(GO:0016508) |
| 0.0 | 0.4 | GO:0017160 | Ral GTPase binding(GO:0017160) |
| 0.0 | 2.1 | GO:0005080 | protein kinase C binding(GO:0005080) |
| 0.0 | 0.3 | GO:0043426 | MRF binding(GO:0043426) |
| 0.0 | 0.1 | GO:0018738 | S-formylglutathione hydrolase activity(GO:0018738) |
| 0.0 | 0.3 | GO:0004118 | cGMP-stimulated cyclic-nucleotide phosphodiesterase activity(GO:0004118) |
| 0.0 | 1.1 | GO:0016417 | S-acyltransferase activity(GO:0016417) |
| 0.0 | 0.6 | GO:0102391 | decanoate--CoA ligase activity(GO:0102391) |
| 0.0 | 0.3 | GO:0005092 | GDP-dissociation inhibitor activity(GO:0005092) |
| 0.0 | 0.3 | GO:0016846 | carbon-sulfur lyase activity(GO:0016846) |
| 0.0 | 2.3 | GO:0051087 | chaperone binding(GO:0051087) |
| 0.0 | 0.5 | GO:0005225 | volume-sensitive anion channel activity(GO:0005225) |
| 0.0 | 1.2 | GO:0005160 | transforming growth factor beta receptor binding(GO:0005160) |
| 0.0 | 1.3 | GO:0004180 | carboxypeptidase activity(GO:0004180) |
| 0.0 | 0.5 | GO:0070412 | R-SMAD binding(GO:0070412) |
| 0.0 | 0.2 | GO:0017169 | CDP-alcohol phosphatidyltransferase activity(GO:0017169) |
| 0.0 | 3.7 | GO:0042393 | histone binding(GO:0042393) |
| 0.0 | 0.1 | GO:0015254 | glycerol channel activity(GO:0015254) |
| 0.0 | 0.6 | GO:0005229 | intracellular calcium activated chloride channel activity(GO:0005229) |
| 0.0 | 2.9 | GO:0004867 | serine-type endopeptidase inhibitor activity(GO:0004867) |
| 0.0 | 0.1 | GO:0050508 | glucuronosyl-N-acetylglucosaminyl-proteoglycan 4-alpha-N-acetylglucosaminyltransferase activity(GO:0050508) |
| 0.0 | 0.8 | GO:0016881 | acid-amino acid ligase activity(GO:0016881) |
| 0.0 | 0.2 | GO:0004103 | choline kinase activity(GO:0004103) |
| 0.0 | 0.3 | GO:0042975 | peroxisome proliferator activated receptor binding(GO:0042975) |
| 0.0 | 0.1 | GO:0004468 | lysine N-acetyltransferase activity, acting on acetyl phosphate as donor(GO:0004468) |
| 0.0 | 0.1 | GO:0050542 | icosanoid binding(GO:0050542) arachidonic acid binding(GO:0050544) fatty acid derivative binding(GO:1901567) |
| 0.0 | 0.1 | GO:0004723 | calcium-dependent protein serine/threonine phosphatase activity(GO:0004723) |
| 0.0 | 0.2 | GO:0005328 | neurotransmitter:sodium symporter activity(GO:0005328) |
| 0.0 | 0.5 | GO:0004115 | 3',5'-cyclic-AMP phosphodiesterase activity(GO:0004115) |
| 0.0 | 0.1 | GO:0004074 | biliverdin reductase activity(GO:0004074) |
| 0.0 | 0.1 | GO:0004740 | pyruvate dehydrogenase (acetyl-transferring) kinase activity(GO:0004740) |
| 0.0 | 0.2 | GO:0048273 | mitogen-activated protein kinase p38 binding(GO:0048273) |
| 0.0 | 0.5 | GO:0005184 | neuropeptide hormone activity(GO:0005184) |
| 0.0 | 0.1 | GO:0070628 | proteasome binding(GO:0070628) |
| 0.0 | 0.8 | GO:0033613 | activating transcription factor binding(GO:0033613) |
| 0.0 | 0.3 | GO:0035259 | glucocorticoid receptor binding(GO:0035259) |
| 0.0 | 1.0 | GO:0001540 | beta-amyloid binding(GO:0001540) |
| 0.0 | 0.0 | GO:0019863 | IgE binding(GO:0019863) |
| 0.0 | 0.3 | GO:0001223 | transcription coactivator binding(GO:0001223) |
| 0.0 | 0.4 | GO:0001103 | RNA polymerase II repressing transcription factor binding(GO:0001103) |
| 0.0 | 1.7 | GO:0005249 | voltage-gated potassium channel activity(GO:0005249) |
| 0.0 | 0.4 | GO:0008307 | structural constituent of muscle(GO:0008307) |
| 0.0 | 0.4 | GO:0003841 | 1-acylglycerol-3-phosphate O-acyltransferase activity(GO:0003841) |
| 0.0 | 0.9 | GO:0001076 | transcription factor activity, RNA polymerase II transcription factor binding(GO:0001076) |
| 0.0 | 0.1 | GO:0045134 | uridine-diphosphatase activity(GO:0045134) |
| 0.0 | 0.1 | GO:0052795 | exo-alpha-sialidase activity(GO:0004308) alpha-sialidase activity(GO:0016997) exo-alpha-(2->3)-sialidase activity(GO:0052794) exo-alpha-(2->6)-sialidase activity(GO:0052795) exo-alpha-(2->8)-sialidase activity(GO:0052796) |
| 0.0 | 0.2 | GO:0016884 | carbon-nitrogen ligase activity, with glutamine as amido-N-donor(GO:0016884) |
| 0.0 | 0.1 | GO:0043394 | proteoglycan binding(GO:0043394) |
| 0.0 | 0.3 | GO:0034185 | apolipoprotein binding(GO:0034185) |
| 0.0 | 0.1 | GO:0001594 | trace-amine receptor activity(GO:0001594) |
| 0.0 | 2.3 | GO:0001078 | transcriptional repressor activity, RNA polymerase II core promoter proximal region sequence-specific binding(GO:0001078) |
| 0.0 | 0.2 | GO:0009055 | electron carrier activity(GO:0009055) |
| 0.0 | 0.3 | GO:0008483 | transaminase activity(GO:0008483) |
| 0.0 | 0.3 | GO:0031005 | filamin binding(GO:0031005) |
| 0.0 | 0.0 | GO:0004774 | succinate-CoA ligase activity(GO:0004774) |
| 0.0 | 0.2 | GO:0042813 | Wnt-activated receptor activity(GO:0042813) |
| 0.0 | 0.1 | GO:0005522 | profilin binding(GO:0005522) |
| 0.0 | 0.0 | GO:0072345 | NAADP-sensitive calcium-release channel activity(GO:0072345) |
| 0.0 | 0.1 | GO:0005247 | voltage-gated chloride channel activity(GO:0005247) |
| 0.0 | 0.2 | GO:0004622 | lysophospholipase activity(GO:0004622) |
| 0.0 | 0.2 | GO:0004089 | carbonate dehydratase activity(GO:0004089) |
Gene overrepresentation in curated gene sets: canonical pathways category:
| Log-likelihood per target | Total log-likelihood | Term | Description |
|---|---|---|---|
| 0.7 | 30.3 | PID AURORA A PATHWAY | Aurora A signaling |
| 0.6 | 27.7 | PID ATR PATHWAY | ATR signaling pathway |
| 0.5 | 21.1 | PID AURORA B PATHWAY | Aurora B signaling |
| 0.5 | 15.4 | PID FANCONI PATHWAY | Fanconi anemia pathway |
| 0.3 | 2.0 | SA G2 AND M PHASES | Cdc25 activates the cdc2/cyclin B complex to induce the G2/M transition. |
| 0.3 | 11.4 | PID FOXM1 PATHWAY | FOXM1 transcription factor network |
| 0.2 | 1.7 | PID IL2 PI3K PATHWAY | IL2 signaling events mediated by PI3K |
| 0.2 | 19.2 | PID MYC ACTIV PATHWAY | Validated targets of C-MYC transcriptional activation |
| 0.2 | 3.6 | PID PRL SIGNALING EVENTS PATHWAY | Signaling events mediated by PRL |
| 0.2 | 2.7 | PID BARD1 PATHWAY | BARD1 signaling events |
| 0.1 | 8.5 | PID ECADHERIN NASCENT AJ PATHWAY | E-cadherin signaling in the nascent adherens junction |
| 0.1 | 11.4 | PID CDC42 PATHWAY | CDC42 signaling events |
| 0.1 | 1.5 | ST INTERFERON GAMMA PATHWAY | Interferon gamma pathway. |
| 0.1 | 4.4 | PID CDC42 REG PATHWAY | Regulation of CDC42 activity |
| 0.1 | 4.7 | ST TUMOR NECROSIS FACTOR PATHWAY | Tumor Necrosis Factor Pathway. |
| 0.1 | 2.1 | PID PS1 PATHWAY | Presenilin action in Notch and Wnt signaling |
| 0.1 | 1.4 | PID VEGFR1 2 PATHWAY | Signaling events mediated by VEGFR1 and VEGFR2 |
| 0.1 | 1.7 | PID P38 GAMMA DELTA PATHWAY | Signaling mediated by p38-gamma and p38-delta |
| 0.1 | 2.1 | PID WNT CANONICAL PATHWAY | Canonical Wnt signaling pathway |
| 0.1 | 5.6 | NABA COLLAGENS | Genes encoding collagen proteins |
| 0.1 | 1.8 | PID HIF1A PATHWAY | Hypoxic and oxygen homeostasis regulation of HIF-1-alpha |
| 0.1 | 1.7 | PID ERB GENOMIC PATHWAY | Validated nuclear estrogen receptor beta network |
| 0.1 | 1.5 | PID PTP1B PATHWAY | Signaling events mediated by PTP1B |
| 0.1 | 0.1 | ST B CELL ANTIGEN RECEPTOR | B Cell Antigen Receptor |
| 0.1 | 1.0 | PID INSULIN PATHWAY | Insulin Pathway |
| 0.1 | 1.7 | ST WNT BETA CATENIN PATHWAY | Wnt/beta-catenin Pathway |
| 0.1 | 1.7 | PID TRAIL PATHWAY | TRAIL signaling pathway |
| 0.1 | 1.0 | PID FCER1 PATHWAY | Fc-epsilon receptor I signaling in mast cells |
| 0.1 | 1.3 | PID WNT NONCANONICAL PATHWAY | Noncanonical Wnt signaling pathway |
| 0.1 | 1.7 | ST GA12 PATHWAY | G alpha 12 Pathway |
| 0.1 | 2.7 | PID RB 1PATHWAY | Regulation of retinoblastoma protein |
| 0.1 | 2.5 | PID PLK1 PATHWAY | PLK1 signaling events |
| 0.1 | 1.1 | PID IFNG PATHWAY | IFN-gamma pathway |
| 0.1 | 1.5 | PID HIV NEF PATHWAY | HIV-1 Nef: Negative effector of Fas and TNF-alpha |
| 0.1 | 1.2 | SIG CD40PATHWAYMAP | Genes related to CD40 signaling |
| 0.1 | 1.7 | PID HIF2PATHWAY | HIF-2-alpha transcription factor network |
| 0.1 | 3.4 | PID E2F PATHWAY | E2F transcription factor network |
| 0.1 | 1.9 | PID IL12 STAT4 PATHWAY | IL12 signaling mediated by STAT4 |
| 0.1 | 0.6 | PID ALK2 PATHWAY | ALK2 signaling events |
| 0.1 | 1.3 | PID CXCR3 PATHWAY | CXCR3-mediated signaling events |
| 0.0 | 2.7 | PID ERA GENOMIC PATHWAY | Validated nuclear estrogen receptor alpha network |
| 0.0 | 1.5 | PID CERAMIDE PATHWAY | Ceramide signaling pathway |
| 0.0 | 1.3 | PID INTEGRIN A9B1 PATHWAY | Alpha9 beta1 integrin signaling events |
| 0.0 | 4.1 | PID CMYB PATHWAY | C-MYB transcription factor network |
| 0.0 | 0.2 | PID MYC PATHWAY | C-MYC pathway |
| 0.0 | 0.8 | PID INSULIN GLUCOSE PATHWAY | Insulin-mediated glucose transport |
| 0.0 | 0.3 | PID VEGF VEGFR PATHWAY | VEGF and VEGFR signaling network |
| 0.0 | 2.9 | PID MTOR 4PATHWAY | mTOR signaling pathway |
| 0.0 | 1.4 | PID DELTA NP63 PATHWAY | Validated transcriptional targets of deltaNp63 isoforms |
| 0.0 | 1.4 | PID TAP63 PATHWAY | Validated transcriptional targets of TAp63 isoforms |
| 0.0 | 1.1 | PID AMB2 NEUTROPHILS PATHWAY | amb2 Integrin signaling |
| 0.0 | 1.9 | WNT SIGNALING | Genes related to Wnt-mediated signal transduction |
| 0.0 | 0.6 | PID HNF3A PATHWAY | FOXA1 transcription factor network |
| 0.0 | 0.5 | PID LYSOPHOSPHOLIPID PATHWAY | LPA receptor mediated events |
| 0.0 | 0.3 | SIG PIP3 SIGNALING IN CARDIAC MYOCTES | Genes related to PIP3 signaling in cardiac myocytes |
| 0.0 | 0.1 | PID TCR CALCIUM PATHWAY | Calcium signaling in the CD4+ TCR pathway |
| 0.0 | 0.9 | PID HES HEY PATHWAY | Notch-mediated HES/HEY network |
| 0.0 | 0.6 | PID LIS1 PATHWAY | Lissencephaly gene (LIS1) in neuronal migration and development |
| 0.0 | 0.3 | PID INTEGRIN4 PATHWAY | Alpha6 beta4 integrin-ligand interactions |
| 0.0 | 0.5 | PID RETINOIC ACID PATHWAY | Retinoic acid receptors-mediated signaling |
| 0.0 | 0.2 | PID SYNDECAN 1 PATHWAY | Syndecan-1-mediated signaling events |
| 0.0 | 0.2 | PID NEPHRIN NEPH1 PATHWAY | Nephrin/Neph1 signaling in the kidney podocyte |
| 0.0 | 0.6 | PID AP1 PATHWAY | AP-1 transcription factor network |
| 0.0 | 0.2 | PID SMAD2 3PATHWAY | Regulation of cytoplasmic and nuclear SMAD2/3 signaling |
| 0.0 | 0.2 | PID REELIN PATHWAY | Reelin signaling pathway |
| 0.0 | 0.6 | PID AR TF PATHWAY | Regulation of Androgen receptor activity |
| 0.0 | 0.7 | PID P53 REGULATION PATHWAY | p53 pathway |
| 0.0 | 0.3 | PID IL1 PATHWAY | IL1-mediated signaling events |
| 0.0 | 0.5 | PID MYC REPRESS PATHWAY | Validated targets of C-MYC transcriptional repression |
| 0.0 | 0.2 | PID RAC1 PATHWAY | RAC1 signaling pathway |
Gene overrepresentation in curated gene sets: REACTOME pathways category:
| Log-likelihood per target | Total log-likelihood | Term | Description |
|---|---|---|---|
| 1.4 | 17.3 | REACTOME SLBP DEPENDENT PROCESSING OF REPLICATION DEPENDENT HISTONE PRE MRNAS | Genes involved in SLBP Dependent Processing of Replication-Dependent Histone Pre-mRNAs |
| 1.3 | 20.8 | REACTOME UNWINDING OF DNA | Genes involved in Unwinding of DNA |
| 1.1 | 13.2 | REACTOME REGULATION OF THE FANCONI ANEMIA PATHWAY | Genes involved in Regulation of the Fanconi anemia pathway |
| 1.1 | 10.6 | REACTOME REMOVAL OF THE FLAP INTERMEDIATE FROM THE C STRAND | Genes involved in Removal of the Flap Intermediate from the C-strand |
| 0.9 | 47.9 | REACTOME FORMATION OF THE TERNARY COMPLEX AND SUBSEQUENTLY THE 43S COMPLEX | Genes involved in Formation of the ternary complex, and subsequently, the 43S complex |
| 0.9 | 0.9 | REACTOME SCFSKP2 MEDIATED DEGRADATION OF P27 P21 | Genes involved in SCF(Skp2)-mediated degradation of p27/p21 |
| 0.9 | 6.9 | REACTOME POL SWITCHING | Genes involved in Polymerase switching |
| 0.8 | 21.7 | REACTOME KINESINS | Genes involved in Kinesins |
| 0.8 | 11.3 | REACTOME FANCONI ANEMIA PATHWAY | Genes involved in Fanconi Anemia pathway |
| 0.8 | 26.9 | REACTOME NEP NS2 INTERACTS WITH THE CELLULAR EXPORT MACHINERY | Genes involved in NEP/NS2 Interacts with the Cellular Export Machinery |
| 0.7 | 2.2 | REACTOME APC C CDH1 MEDIATED DEGRADATION OF CDC20 AND OTHER APC C CDH1 TARGETED PROTEINS IN LATE MITOSIS EARLY G1 | Genes involved in APC/C:Cdh1 mediated degradation of Cdc20 and other APC/C:Cdh1 targeted proteins in late mitosis/early G1 |
| 0.7 | 10.8 | REACTOME ACTIVATION OF THE PRE REPLICATIVE COMPLEX | Genes involved in Activation of the pre-replicative complex |
| 0.7 | 46.2 | REACTOME PEPTIDE CHAIN ELONGATION | Genes involved in Peptide chain elongation |
| 0.6 | 8.4 | REACTOME NEF MEDIATED DOWNREGULATION OF MHC CLASS I COMPLEX CELL SURFACE EXPRESSION | Genes involved in Nef mediated downregulation of MHC class I complex cell surface expression |
| 0.6 | 9.4 | REACTOME METABOLISM OF NON CODING RNA | Genes involved in Metabolism of non-coding RNA |
| 0.5 | 5.6 | REACTOME BASE FREE SUGAR PHOSPHATE REMOVAL VIA THE SINGLE NUCLEOTIDE REPLACEMENT PATHWAY | Genes involved in Base-free sugar-phosphate removal via the single-nucleotide replacement pathway |
| 0.5 | 15.1 | REACTOME RNA POL I TRANSCRIPTION INITIATION | Genes involved in RNA Polymerase I Transcription Initiation |
| 0.5 | 7.0 | REACTOME PROCESSING OF CAPPED INTRONLESS PRE MRNA | Genes involved in Processing of Capped Intronless Pre-mRNA |
| 0.5 | 7.4 | REACTOME RNA POL III CHAIN ELONGATION | Genes involved in RNA Polymerase III Chain Elongation |
| 0.4 | 5.3 | REACTOME G2 M CHECKPOINTS | Genes involved in G2/M Checkpoints |
| 0.4 | 20.4 | REACTOME CDK MEDIATED PHOSPHORYLATION AND REMOVAL OF CDC6 | Genes involved in CDK-mediated phosphorylation and removal of Cdc6 |
| 0.4 | 3.0 | REACTOME APOBEC3G MEDIATED RESISTANCE TO HIV1 INFECTION | Genes involved in APOBEC3G mediated resistance to HIV-1 infection |
| 0.4 | 10.0 | REACTOME CYTOSOLIC TRNA AMINOACYLATION | Genes involved in Cytosolic tRNA aminoacylation |
| 0.4 | 3.5 | REACTOME HOMOLOGOUS RECOMBINATION REPAIR OF REPLICATION INDEPENDENT DOUBLE STRAND BREAKS | Genes involved in Homologous recombination repair of replication-independent double-strand breaks |
| 0.3 | 7.4 | REACTOME FORMATION OF TUBULIN FOLDING INTERMEDIATES BY CCT TRIC | Genes involved in Formation of tubulin folding intermediates by CCT/TriC |
| 0.3 | 3.0 | REACTOME EXTENSION OF TELOMERES | Genes involved in Extension of Telomeres |
| 0.3 | 4.3 | REACTOME MRNA DECAY BY 5 TO 3 EXORIBONUCLEASE | Genes involved in mRNA Decay by 5' to 3' Exoribonuclease |
| 0.3 | 7.2 | REACTOME CITRIC ACID CYCLE TCA CYCLE | Genes involved in Citric acid cycle (TCA cycle) |
| 0.3 | 1.9 | REACTOME TRANSCRIPTION COUPLED NER TC NER | Genes involved in Transcription-coupled NER (TC-NER) |
| 0.3 | 4.4 | REACTOME MRNA CAPPING | Genes involved in mRNA Capping |
| 0.3 | 29.2 | REACTOME MITOTIC PROMETAPHASE | Genes involved in Mitotic Prometaphase |
| 0.3 | 1.8 | REACTOME ANDROGEN BIOSYNTHESIS | Genes involved in Androgen biosynthesis |
| 0.3 | 5.2 | REACTOME TRNA AMINOACYLATION | Genes involved in tRNA Aminoacylation |
| 0.3 | 4.0 | REACTOME FORMATION OF ATP BY CHEMIOSMOTIC COUPLING | Genes involved in Formation of ATP by chemiosmotic coupling |
| 0.3 | 0.6 | REACTOME CDT1 ASSOCIATION WITH THE CDC6 ORC ORIGIN COMPLEX | Genes involved in CDT1 association with the CDC6:ORC:origin complex |
| 0.3 | 13.9 | REACTOME MITOCHONDRIAL PROTEIN IMPORT | Genes involved in Mitochondrial Protein Import |
| 0.3 | 6.5 | REACTOME MRNA SPLICING MINOR PATHWAY | Genes involved in mRNA Splicing - Minor Pathway |
| 0.3 | 4.7 | REACTOME APC CDC20 MEDIATED DEGRADATION OF NEK2A | Genes involved in APC-Cdc20 mediated degradation of Nek2A |
| 0.3 | 2.8 | REACTOME ELONGATION ARREST AND RECOVERY | Genes involved in Elongation arrest and recovery |
| 0.2 | 2.7 | REACTOME DESTABILIZATION OF MRNA BY AUF1 HNRNP D0 | Genes involved in Destabilization of mRNA by AUF1 (hnRNP D0) |
| 0.2 | 15.7 | REACTOME RESPIRATORY ELECTRON TRANSPORT | Genes involved in Respiratory electron transport |
| 0.2 | 3.5 | REACTOME SYNTHESIS OF PIPS AT THE LATE ENDOSOME MEMBRANE | Genes involved in Synthesis of PIPs at the late endosome membrane |
| 0.2 | 2.2 | REACTOME RNA POL III TRANSCRIPTION INITIATION FROM TYPE 3 PROMOTER | Genes involved in RNA Polymerase III Transcription Initiation From Type 3 Promoter |
| 0.2 | 2.2 | REACTOME PROSTANOID LIGAND RECEPTORS | Genes involved in Prostanoid ligand receptors |
| 0.2 | 2.5 | REACTOME IRAK1 RECRUITS IKK COMPLEX | Genes involved in IRAK1 recruits IKK complex |
| 0.2 | 3.0 | REACTOME DESTABILIZATION OF MRNA BY TRISTETRAPROLIN TTP | Genes involved in Destabilization of mRNA by Tristetraprolin (TTP) |
| 0.2 | 3.9 | REACTOME NONSENSE MEDIATED DECAY ENHANCED BY THE EXON JUNCTION COMPLEX | Genes involved in Nonsense Mediated Decay Enhanced by the Exon Junction Complex |
| 0.2 | 1.1 | REACTOME 3 UTR MEDIATED TRANSLATIONAL REGULATION | Genes involved in 3' -UTR-mediated translational regulation |
| 0.2 | 0.6 | REACTOME CYCLIN A B1 ASSOCIATED EVENTS DURING G2 M TRANSITION | Genes involved in Cyclin A/B1 associated events during G2/M transition |
| 0.2 | 0.8 | REACTOME PACKAGING OF TELOMERE ENDS | Genes involved in Packaging Of Telomere Ends |
| 0.2 | 0.5 | REACTOME INTERACTIONS OF VPR WITH HOST CELLULAR PROTEINS | Genes involved in Interactions of Vpr with host cellular proteins |
| 0.2 | 3.2 | REACTOME SEMA3A PAK DEPENDENT AXON REPULSION | Genes involved in Sema3A PAK dependent Axon repulsion |
| 0.2 | 5.9 | REACTOME ANTIVIRAL MECHANISM BY IFN STIMULATED GENES | Genes involved in Antiviral mechanism by IFN-stimulated genes |
| 0.1 | 6.8 | REACTOME STRIATED MUSCLE CONTRACTION | Genes involved in Striated Muscle Contraction |
| 0.1 | 1.1 | REACTOME COMMON PATHWAY | Genes involved in Common Pathway |
| 0.1 | 1.4 | REACTOME G1 S SPECIFIC TRANSCRIPTION | Genes involved in G1/S-Specific Transcription |
| 0.1 | 2.2 | REACTOME METABOLISM OF POLYAMINES | Genes involved in Metabolism of polyamines |
| 0.1 | 1.6 | REACTOME PREFOLDIN MEDIATED TRANSFER OF SUBSTRATE TO CCT TRIC | Genes involved in Prefoldin mediated transfer of substrate to CCT/TriC |
| 0.1 | 1.3 | REACTOME ABACAVIR TRANSPORT AND METABOLISM | Genes involved in Abacavir transport and metabolism |
| 0.1 | 2.2 | REACTOME IL 7 SIGNALING | Genes involved in Interleukin-7 signaling |
| 0.1 | 0.5 | REACTOME G ALPHA1213 SIGNALLING EVENTS | Genes involved in G alpha (12/13) signalling events |
| 0.1 | 0.8 | REACTOME DOWNREGULATION OF ERBB2 ERBB3 SIGNALING | Genes involved in Downregulation of ERBB2:ERBB3 signaling |
| 0.1 | 1.1 | REACTOME MTORC1 MEDIATED SIGNALLING | Genes involved in mTORC1-mediated signalling |
| 0.1 | 2.9 | REACTOME AKT PHOSPHORYLATES TARGETS IN THE CYTOSOL | Genes involved in AKT phosphorylates targets in the cytosol |
| 0.1 | 1.5 | REACTOME PURINE RIBONUCLEOSIDE MONOPHOSPHATE BIOSYNTHESIS | Genes involved in Purine ribonucleoside monophosphate biosynthesis |
| 0.1 | 2.1 | REACTOME ACYL CHAIN REMODELLING OF PG | Genes involved in Acyl chain remodelling of PG |
| 0.1 | 21.6 | REACTOME SIGNALING BY RHO GTPASES | Genes involved in Signaling by Rho GTPases |
| 0.1 | 3.3 | REACTOME PTM GAMMA CARBOXYLATION HYPUSINE FORMATION AND ARYLSULFATASE ACTIVATION | Genes involved in PTM: gamma carboxylation, hypusine formation and arylsulfatase activation |
| 0.1 | 1.1 | REACTOME HYALURONAN UPTAKE AND DEGRADATION | Genes involved in Hyaluronan uptake and degradation |
| 0.1 | 1.7 | REACTOME MEIOTIC RECOMBINATION | Genes involved in Meiotic Recombination |
| 0.1 | 0.8 | REACTOME CIRCADIAN REPRESSION OF EXPRESSION BY REV ERBA | Genes involved in Circadian Repression of Expression by REV-ERBA |
| 0.1 | 1.4 | REACTOME G0 AND EARLY G1 | Genes involved in G0 and Early G1 |
| 0.1 | 1.3 | REACTOME NRIF SIGNALS CELL DEATH FROM THE NUCLEUS | Genes involved in NRIF signals cell death from the nucleus |
| 0.1 | 2.5 | REACTOME TGF BETA RECEPTOR SIGNALING ACTIVATES SMADS | Genes involved in TGF-beta receptor signaling activates SMADs |
| 0.1 | 6.8 | REACTOME PROCESSING OF CAPPED INTRON CONTAINING PRE MRNA | Genes involved in Processing of Capped Intron-Containing Pre-mRNA |
| 0.1 | 1.0 | REACTOME CRMPS IN SEMA3A SIGNALING | Genes involved in CRMPs in Sema3A signaling |
| 0.1 | 5.6 | REACTOME METABOLISM OF VITAMINS AND COFACTORS | Genes involved in Metabolism of vitamins and cofactors |
| 0.1 | 1.4 | REACTOME PURINE SALVAGE | Genes involved in Purine salvage |
| 0.1 | 0.6 | REACTOME ERKS ARE INACTIVATED | Genes involved in ERKs are inactivated |
| 0.1 | 0.5 | REACTOME SEMA3A PLEXIN REPULSION SIGNALING BY INHIBITING INTEGRIN ADHESION | Genes involved in SEMA3A-Plexin repulsion signaling by inhibiting Integrin adhesion |
| 0.1 | 3.5 | REACTOME AMINO ACID TRANSPORT ACROSS THE PLASMA MEMBRANE | Genes involved in Amino acid transport across the plasma membrane |
| 0.1 | 0.4 | REACTOME INFLUENZA VIRAL RNA TRANSCRIPTION AND REPLICATION | Genes involved in Influenza Viral RNA Transcription and Replication |
| 0.1 | 0.9 | REACTOME REGULATION OF PYRUVATE DEHYDROGENASE PDH COMPLEX | Genes involved in Regulation of pyruvate dehydrogenase (PDH) complex |
| 0.1 | 0.4 | REACTOME HYALURONAN METABOLISM | Genes involved in Hyaluronan metabolism |
| 0.1 | 2.3 | REACTOME CGMP EFFECTS | Genes involved in cGMP effects |
| 0.1 | 1.5 | REACTOME LYSOSOME VESICLE BIOGENESIS | Genes involved in Lysosome Vesicle Biogenesis |
| 0.1 | 13.1 | REACTOME GENERIC TRANSCRIPTION PATHWAY | Genes involved in Generic Transcription Pathway |
| 0.1 | 0.6 | REACTOME CELL DEATH SIGNALLING VIA NRAGE NRIF AND NADE | Genes involved in Cell death signalling via NRAGE, NRIF and NADE |
| 0.1 | 0.2 | REACTOME DESTABILIZATION OF MRNA BY KSRP | Genes involved in Destabilization of mRNA by KSRP |
| 0.1 | 0.1 | REACTOME NUCLEOTIDE BINDING DOMAIN LEUCINE RICH REPEAT CONTAINING RECEPTOR NLR SIGNALING PATHWAYS | Genes involved in Nucleotide-binding domain, leucine rich repeat containing receptor (NLR) signaling pathways |
| 0.1 | 0.8 | REACTOME GABA A RECEPTOR ACTIVATION | Genes involved in GABA A receptor activation |
| 0.1 | 1.5 | REACTOME MUSCLE CONTRACTION | Genes involved in Muscle contraction |
| 0.1 | 2.5 | REACTOME VOLTAGE GATED POTASSIUM CHANNELS | Genes involved in Voltage gated Potassium channels |
| 0.1 | 0.7 | REACTOME IONOTROPIC ACTIVITY OF KAINATE RECEPTORS | Genes involved in Ionotropic activity of Kainate Receptors |
| 0.0 | 1.3 | REACTOME AMINO ACID SYNTHESIS AND INTERCONVERSION TRANSAMINATION | Genes involved in Amino acid synthesis and interconversion (transamination) |
| 0.0 | 0.8 | REACTOME SIGNALING BY FGFR3 MUTANTS | Genes involved in Signaling by FGFR3 mutants |
| 0.0 | 0.5 | REACTOME DEPOSITION OF NEW CENPA CONTAINING NUCLEOSOMES AT THE CENTROMERE | Genes involved in Deposition of New CENPA-containing Nucleosomes at the Centromere |
| 0.0 | 0.5 | REACTOME HOST INTERACTIONS OF HIV FACTORS | Genes involved in Host Interactions of HIV factors |
| 0.0 | 0.4 | REACTOME SYNTHESIS OF PIPS AT THE GOLGI MEMBRANE | Genes involved in Synthesis of PIPs at the Golgi membrane |
| 0.0 | 0.5 | REACTOME ROLE OF DCC IN REGULATING APOPTOSIS | Genes involved in Role of DCC in regulating apoptosis |
| 0.0 | 1.1 | REACTOME DEGRADATION OF THE EXTRACELLULAR MATRIX | Genes involved in Degradation of the extracellular matrix |
| 0.0 | 1.9 | REACTOME SYNTHESIS OF PIPS AT THE PLASMA MEMBRANE | Genes involved in Synthesis of PIPs at the plasma membrane |
| 0.0 | 0.3 | REACTOME REGULATION OF MRNA STABILITY BY PROTEINS THAT BIND AU RICH ELEMENTS | Genes involved in Regulation of mRNA Stability by Proteins that Bind AU-rich Elements |
| 0.0 | 0.3 | REACTOME NUCLEOTIDE EXCISION REPAIR | Genes involved in Nucleotide Excision Repair |
| 0.0 | 7.7 | REACTOME ANTIGEN PROCESSING UBIQUITINATION PROTEASOME DEGRADATION | Genes involved in Antigen processing: Ubiquitination & Proteasome degradation |
| 0.0 | 0.4 | REACTOME INHIBITION OF INSULIN SECRETION BY ADRENALINE NORADRENALINE | Genes involved in Inhibition of Insulin Secretion by Adrenaline/Noradrenaline |
| 0.0 | 0.7 | REACTOME SYNTHESIS OF BILE ACIDS AND BILE SALTS VIA 7ALPHA HYDROXYCHOLESTEROL | Genes involved in Synthesis of bile acids and bile salts via 7alpha-hydroxycholesterol |
| 0.0 | 0.3 | REACTOME MICRORNA MIRNA BIOGENESIS | Genes involved in MicroRNA (miRNA) Biogenesis |
| 0.0 | 0.6 | REACTOME PYRUVATE METABOLISM AND CITRIC ACID TCA CYCLE | Genes involved in Pyruvate metabolism and Citric Acid (TCA) cycle |
| 0.0 | 0.5 | REACTOME AMINE DERIVED HORMONES | Genes involved in Amine-derived hormones |
| 0.0 | 0.3 | REACTOME BILE SALT AND ORGANIC ANION SLC TRANSPORTERS | Genes involved in Bile salt and organic anion SLC transporters |
| 0.0 | 0.4 | REACTOME INTERFERON SIGNALING | Genes involved in Interferon Signaling |
| 0.0 | 0.7 | REACTOME CHOLESTEROL BIOSYNTHESIS | Genes involved in Cholesterol biosynthesis |
| 0.0 | 0.6 | REACTOME AMINO ACID AND OLIGOPEPTIDE SLC TRANSPORTERS | Genes involved in Amino acid and oligopeptide SLC transporters |
| 0.0 | 0.4 | REACTOME AMYLOIDS | Genes involved in Amyloids |
| 0.0 | 0.3 | REACTOME THROMBIN SIGNALLING THROUGH PROTEINASE ACTIVATED RECEPTORS PARS | Genes involved in Thrombin signalling through proteinase activated receptors (PARs) |
| 0.0 | 0.3 | REACTOME ACTIVATION OF BH3 ONLY PROTEINS | Genes involved in Activation of BH3-only proteins |
| 0.0 | 0.5 | REACTOME JNK C JUN KINASES PHOSPHORYLATION AND ACTIVATION MEDIATED BY ACTIVATED HUMAN TAK1 | Genes involved in JNK (c-Jun kinases) phosphorylation and activation mediated by activated human TAK1 |
| 0.0 | 1.5 | REACTOME PPARA ACTIVATES GENE EXPRESSION | Genes involved in PPARA Activates Gene Expression |
| 0.0 | 1.0 | REACTOME GLYCOLYSIS | Genes involved in Glycolysis |
| 0.0 | 2.6 | REACTOME CLASS B 2 SECRETIN FAMILY RECEPTORS | Genes involved in Class B/2 (Secretin family receptors) |
| 0.0 | 0.6 | REACTOME UNBLOCKING OF NMDA RECEPTOR GLUTAMATE BINDING AND ACTIVATION | Genes involved in Unblocking of NMDA receptor, glutamate binding and activation |
| 0.0 | 0.3 | REACTOME VEGF LIGAND RECEPTOR INTERACTIONS | Genes involved in VEGF ligand-receptor interactions |
| 0.0 | 0.6 | REACTOME KERATAN SULFATE BIOSYNTHESIS | Genes involved in Keratan sulfate biosynthesis |
| 0.0 | 0.6 | REACTOME SYNTHESIS OF GLYCOSYLPHOSPHATIDYLINOSITOL GPI | Genes involved in Synthesis of glycosylphosphatidylinositol (GPI) |
| 0.0 | 0.2 | REACTOME CREATION OF C4 AND C2 ACTIVATORS | Genes involved in Creation of C4 and C2 activators |
| 0.0 | 0.2 | REACTOME RECRUITMENT OF NUMA TO MITOTIC CENTROSOMES | Genes involved in Recruitment of NuMA to mitotic centrosomes |
| 0.0 | 0.9 | REACTOME POTASSIUM CHANNELS | Genes involved in Potassium Channels |
| 0.0 | 1.4 | REACTOME RNA POL I RNA POL III AND MITOCHONDRIAL TRANSCRIPTION | Genes involved in RNA Polymerase I, RNA Polymerase III, and Mitochondrial Transcription |
| 0.0 | 0.1 | REACTOME REGULATION OF IFNG SIGNALING | Genes involved in Regulation of IFNG signaling |
| 0.0 | 0.4 | REACTOME CLASS C 3 METABOTROPIC GLUTAMATE PHEROMONE RECEPTORS | Genes involved in Class C/3 (Metabotropic glutamate/pheromone receptors) |
| 0.0 | 0.2 | REACTOME PROLACTIN RECEPTOR SIGNALING | Genes involved in Prolactin receptor signaling |
| 0.0 | 0.3 | REACTOME PHOSPHORYLATION OF CD3 AND TCR ZETA CHAINS | Genes involved in Phosphorylation of CD3 and TCR zeta chains |
| 0.0 | 0.3 | REACTOME INTRINSIC PATHWAY | Genes involved in Intrinsic Pathway |
| 0.0 | 0.1 | REACTOME G BETA GAMMA SIGNALLING THROUGH PLC BETA | Genes involved in G beta:gamma signalling through PLC beta |
| 0.0 | 0.3 | REACTOME CHYLOMICRON MEDIATED LIPID TRANSPORT | Genes involved in Chylomicron-mediated lipid transport |
| 0.0 | 0.2 | REACTOME BASIGIN INTERACTIONS | Genes involved in Basigin interactions |
| 0.0 | 0.1 | REACTOME CTLA4 INHIBITORY SIGNALING | Genes involved in CTLA4 inhibitory signaling |
| 0.0 | 0.1 | REACTOME TRAFFICKING AND PROCESSING OF ENDOSOMAL TLR | Genes involved in Trafficking and processing of endosomal TLR |
| 0.0 | 0.2 | REACTOME STEROID HORMONES | Genes involved in Steroid hormones |
| 0.0 | 1.3 | REACTOME METABOLISM OF AMINO ACIDS AND DERIVATIVES | Genes involved in Metabolism of amino acids and derivatives |
| 0.0 | 0.5 | REACTOME MHC CLASS II ANTIGEN PRESENTATION | Genes involved in MHC class II antigen presentation |
| 0.0 | 0.1 | REACTOME REGULATION OF KIT SIGNALING | Genes involved in Regulation of KIT signaling |