Project
GFI1 WT vs 36n/n vs KD
Navigation
Downloads
Results for CCACAGG
Z-value: 0.27
Motif logo

miRNA associated with seed CCACAGG
| Name | miRBASE accession |
|---|---|
|
mmu-miR-140-3p.1
|
Activity profile of CCACAGG motif
Sorted Z-values of CCACAGG motif
| Promoter | Log-likelihood | Transcript | Gene | Gene Info |
|---|---|---|---|---|
| chr10_-_117681864 | 0.17 |
ENSMUST00000064667.9
|
Rap1b
|
RAS related protein 1b |
| chr3_-_57559088 | 0.08 |
ENSMUST00000160959.8
|
Commd2
|
COMM domain containing 2 |
| chr18_+_3383230 | 0.07 |
ENSMUST00000162301.8
ENSMUST00000161317.2 |
Cul2
|
cullin 2 |
| chr1_-_131025562 | 0.07 |
ENSMUST00000016672.11
|
Mapkapk2
|
MAP kinase-activated protein kinase 2 |
| chrX_-_141749704 | 0.06 |
ENSMUST00000041317.3
|
Ammecr1
|
Alport syndrome, mental retardation, midface hypoplasia and elliptocytosis chromosomal region gene 1 |
| chr19_+_53298906 | 0.06 |
ENSMUST00000003870.15
|
Mxi1
|
MAX interactor 1, dimerization protein |
| chr6_+_108637577 | 0.06 |
ENSMUST00000032194.11
|
Bhlhe40
|
basic helix-loop-helix family, member e40 |
| chr2_+_71617266 | 0.06 |
ENSMUST00000112101.8
ENSMUST00000028522.10 |
Itga6
|
integrin alpha 6 |
| chr3_-_50398027 | 0.06 |
ENSMUST00000029297.6
ENSMUST00000194462.6 |
Slc7a11
|
solute carrier family 7 (cationic amino acid transporter, y+ system), member 11 |
| chr6_-_52211882 | 0.05 |
ENSMUST00000125581.2
|
Hoxa10
|
homeobox A10 |
| chr13_-_63713549 | 0.05 |
ENSMUST00000021921.11
|
Ptch1
|
patched 1 |
| chr3_-_151899470 | 0.05 |
ENSMUST00000050073.13
|
Dnajb4
|
DnaJ heat shock protein family (Hsp40) member B4 |
| chr7_-_16657825 | 0.05 |
ENSMUST00000019514.10
|
Calm3
|
calmodulin 3 |
| chr2_+_127178072 | 0.05 |
ENSMUST00000028846.7
|
Dusp2
|
dual specificity phosphatase 2 |
| chr12_+_73948143 | 0.04 |
ENSMUST00000110461.8
|
Hif1a
|
hypoxia inducible factor 1, alpha subunit |
| chr11_-_86648309 | 0.04 |
ENSMUST00000060766.16
ENSMUST00000103186.11 |
Cltc
|
clathrin, heavy polypeptide (Hc) |
| chr12_+_100165694 | 0.04 |
ENSMUST00000110082.11
|
Calm1
|
calmodulin 1 |
| chr7_-_113716996 | 0.04 |
ENSMUST00000069449.7
|
Rras2
|
related RAS viral (r-ras) oncogene 2 |
| chr18_+_73706115 | 0.03 |
ENSMUST00000091852.5
|
Mex3c
|
mex3 RNA binding family member C |
| chr18_-_36587573 | 0.03 |
ENSMUST00000025204.7
ENSMUST00000237792.2 |
Pfdn1
|
prefoldin 1 |
| chr2_+_156038562 | 0.03 |
ENSMUST00000037401.10
|
Phf20
|
PHD finger protein 20 |
| chr13_-_25121568 | 0.03 |
ENSMUST00000037615.7
|
Aldh5a1
|
aldhehyde dehydrogenase family 5, subfamily A1 |
| chr10_+_57362457 | 0.03 |
ENSMUST00000079833.6
|
Hsf2
|
heat shock factor 2 |
| chr1_-_170978157 | 0.03 |
ENSMUST00000155798.2
ENSMUST00000081560.5 ENSMUST00000111336.10 |
Sdhc
|
succinate dehydrogenase complex, subunit C, integral membrane protein |
| chr2_-_34645241 | 0.03 |
ENSMUST00000102800.9
|
Gapvd1
|
GTPase activating protein and VPS9 domains 1 |
| chr2_-_6889783 | 0.03 |
ENSMUST00000170438.8
ENSMUST00000114924.10 ENSMUST00000114934.11 |
Celf2
|
CUGBP, Elav-like family member 2 |
| chr9_+_77824646 | 0.03 |
ENSMUST00000034904.14
|
Elovl5
|
ELOVL family member 5, elongation of long chain fatty acids (yeast) |
| chr7_+_101545547 | 0.03 |
ENSMUST00000035395.14
ENSMUST00000106973.8 ENSMUST00000144207.9 |
Anapc15
|
anaphase promoting complex C subunit 15 |
| chr18_+_35695199 | 0.03 |
ENSMUST00000236860.2
ENSMUST00000166793.10 ENSMUST00000237780.2 ENSMUST00000236507.2 ENSMUST00000235960.2 ENSMUST00000237061.2 |
Matr3
|
matrin 3 |
| chr14_-_14255588 | 0.03 |
ENSMUST00000022272.14
|
Kctd6
|
potassium channel tetramerisation domain containing 6 |
| chr4_-_87951565 | 0.03 |
ENSMUST00000078090.12
|
Mllt3
|
myeloid/lymphoid or mixed-lineage leukemia; translocated to, 3 |
| chr1_+_57445487 | 0.03 |
ENSMUST00000027114.6
|
Maip1
|
matrix AAA peptidase interacting protein 1 |
| chr12_+_32870334 | 0.03 |
ENSMUST00000020886.9
|
Nampt
|
nicotinamide phosphoribosyltransferase |
| chr9_+_106048116 | 0.03 |
ENSMUST00000020490.13
|
Wdr82
|
WD repeat domain containing 82 |
| chr12_-_59266511 | 0.03 |
ENSMUST00000043204.8
|
Fbxo33
|
F-box protein 33 |
| chr15_-_37007623 | 0.03 |
ENSMUST00000078976.9
|
Zfp706
|
zinc finger protein 706 |
| chr5_-_149559667 | 0.03 |
ENSMUST00000074846.14
|
Hsph1
|
heat shock 105kDa/110kDa protein 1 |
| chr13_-_96807346 | 0.03 |
ENSMUST00000022176.15
|
Hmgcr
|
3-hydroxy-3-methylglutaryl-Coenzyme A reductase |
| chr8_-_111754379 | 0.03 |
ENSMUST00000040241.15
|
Ddx19b
|
DEAD box helicase 19b |
| chr6_-_51446752 | 0.03 |
ENSMUST00000204188.3
ENSMUST00000203220.3 ENSMUST00000114459.8 ENSMUST00000090002.10 |
Hnrnpa2b1
|
heterogeneous nuclear ribonucleoprotein A2/B1 |
| chr19_-_34504871 | 0.03 |
ENSMUST00000178114.2
ENSMUST00000049572.15 |
Lipa
|
lysosomal acid lipase A |
| chr2_-_152239966 | 0.02 |
ENSMUST00000063332.9
ENSMUST00000182625.2 |
Sox12
|
SRY (sex determining region Y)-box 12 |
| chr16_-_35589726 | 0.02 |
ENSMUST00000023554.9
|
Slc49a4
|
solute carrier family 49 member 4 |
| chr6_+_54572096 | 0.02 |
ENSMUST00000119706.8
|
Plekha8
|
pleckstrin homology domain containing, family A (phosphoinositide binding specific) member 8 |
| chr10_-_128727542 | 0.02 |
ENSMUST00000026408.7
|
Gdf11
|
growth differentiation factor 11 |
| chr11_+_23256883 | 0.02 |
ENSMUST00000180046.8
|
Usp34
|
ubiquitin specific peptidase 34 |
| chr18_+_69478790 | 0.02 |
ENSMUST00000202116.4
ENSMUST00000114982.8 ENSMUST00000078486.13 ENSMUST00000202772.4 ENSMUST00000201288.4 |
Tcf4
|
transcription factor 4 |
| chr11_+_29642937 | 0.02 |
ENSMUST00000102843.10
ENSMUST00000102842.10 ENSMUST00000078830.11 ENSMUST00000170731.8 |
Rtn4
|
reticulon 4 |
| chr16_-_21982049 | 0.02 |
ENSMUST00000100052.11
|
Igf2bp2
|
insulin-like growth factor 2 mRNA binding protein 2 |
| chr9_-_86453862 | 0.02 |
ENSMUST00000070064.11
ENSMUST00000072585.8 |
Pgm3
|
phosphoglucomutase 3 |
| chr4_+_8535604 | 0.02 |
ENSMUST00000060232.8
|
Rab2a
|
RAB2A, member RAS oncogene family |
| chr16_+_20354225 | 0.02 |
ENSMUST00000090023.13
ENSMUST00000007216.9 ENSMUST00000232001.2 |
Ap2m1
|
adaptor-related protein complex 2, mu 1 subunit |
| chr3_-_65300000 | 0.02 |
ENSMUST00000029414.12
|
Ssr3
|
signal sequence receptor, gamma |
| chr12_+_111540920 | 0.02 |
ENSMUST00000075281.8
ENSMUST00000084953.13 |
Mark3
|
MAP/microtubule affinity regulating kinase 3 |
| chr11_+_116089678 | 0.02 |
ENSMUST00000021130.7
|
Ten1
|
TEN1 telomerase capping complex subunit |
| chr1_-_52539395 | 0.02 |
ENSMUST00000186764.7
|
Nab1
|
Ngfi-A binding protein 1 |
| chr7_-_141614758 | 0.02 |
ENSMUST00000211000.2
ENSMUST00000209725.2 ENSMUST00000084418.4 |
Mob2
|
MOB kinase activator 2 |
| chr5_-_92231314 | 0.02 |
ENSMUST00000169094.8
ENSMUST00000167918.8 |
G3bp2
|
GTPase activating protein (SH3 domain) binding protein 2 |
| chr2_+_49341498 | 0.02 |
ENSMUST00000092123.11
|
Epc2
|
enhancer of polycomb homolog 2 |
| chr18_+_11972277 | 0.02 |
ENSMUST00000171109.9
ENSMUST00000046948.10 |
Cables1
|
CDK5 and Abl enzyme substrate 1 |
| chr7_+_109721230 | 0.02 |
ENSMUST00000033326.10
|
Wee1
|
WEE 1 homolog 1 (S. pombe) |
| chr12_+_111005768 | 0.02 |
ENSMUST00000084968.14
|
Rcor1
|
REST corepressor 1 |
| chr13_+_45660905 | 0.02 |
ENSMUST00000000260.13
|
Gmpr
|
guanosine monophosphate reductase |
| chr5_+_129970882 | 0.02 |
ENSMUST00000201855.2
ENSMUST00000073945.6 |
Vkorc1l1
|
vitamin K epoxide reductase complex, subunit 1-like 1 |
| chr9_+_70586232 | 0.02 |
ENSMUST00000067880.13
|
Adam10
|
a disintegrin and metallopeptidase domain 10 |
| chr13_+_20274708 | 0.02 |
ENSMUST00000072519.7
|
Elmo1
|
engulfment and cell motility 1 |
| chr2_+_118731860 | 0.02 |
ENSMUST00000036578.7
|
Bahd1
|
bromo adjacent homology domain containing 1 |
| chr6_-_88495835 | 0.02 |
ENSMUST00000032168.7
|
Sec61a1
|
Sec61 alpha 1 subunit (S. cerevisiae) |
| chr13_-_120252337 | 0.02 |
ENSMUST00000177916.8
ENSMUST00000178271.3 ENSMUST00000223722.2 |
Zfp131
|
zinc finger protein 131 |
| chr2_+_131104389 | 0.02 |
ENSMUST00000150843.9
|
Pank2
|
pantothenate kinase 2 |
| chr9_+_44290787 | 0.02 |
ENSMUST00000066601.13
|
Hyou1
|
hypoxia up-regulated 1 |
| chr15_+_58287305 | 0.02 |
ENSMUST00000037270.5
|
Fam91a1
|
family with sequence similarity 91, member A1 |
| chr9_-_31123083 | 0.02 |
ENSMUST00000217641.2
ENSMUST00000072634.15 ENSMUST00000079758.9 ENSMUST00000213254.2 |
Aplp2
|
amyloid beta (A4) precursor-like protein 2 |
| chr12_-_102844537 | 0.01 |
ENSMUST00000045652.8
ENSMUST00000223554.2 |
Btbd7
|
BTB (POZ) domain containing 7 |
| chr19_+_32734884 | 0.01 |
ENSMUST00000013807.8
|
Pten
|
phosphatase and tensin homolog |
| chr1_+_172327569 | 0.01 |
ENSMUST00000111230.8
|
Tagln2
|
transgelin 2 |
| chr8_-_80784619 | 0.01 |
ENSMUST00000079038.4
|
Hhip
|
Hedgehog-interacting protein |
| chr1_-_98023321 | 0.01 |
ENSMUST00000058762.15
ENSMUST00000097625.10 |
Pam
|
peptidylglycine alpha-amidating monooxygenase |
| chr14_+_71011744 | 0.01 |
ENSMUST00000022698.8
|
Dok2
|
docking protein 2 |
| chr1_-_164285914 | 0.01 |
ENSMUST00000027863.13
|
Atp1b1
|
ATPase, Na+/K+ transporting, beta 1 polypeptide |
| chr16_-_85698679 | 0.01 |
ENSMUST00000023611.7
|
Adamts5
|
a disintegrin-like and metallopeptidase (reprolysin type) with thrombospondin type 1 motif, 5 (aggrecanase-2) |
| chr17_-_52139693 | 0.01 |
ENSMUST00000144331.8
|
Satb1
|
special AT-rich sequence binding protein 1 |
| chr11_+_4207557 | 0.01 |
ENSMUST00000066283.12
|
Lif
|
leukemia inhibitory factor |
| chr10_+_26648473 | 0.01 |
ENSMUST00000039557.9
|
Arhgap18
|
Rho GTPase activating protein 18 |
| chr2_+_118756973 | 0.01 |
ENSMUST00000099546.6
ENSMUST00000110837.2 |
Chst14
|
carbohydrate sulfotransferase 14 |
| chr13_-_30170031 | 0.01 |
ENSMUST00000102948.11
|
E2f3
|
E2F transcription factor 3 |
| chr4_-_135780660 | 0.01 |
ENSMUST00000102536.11
|
Rpl11
|
ribosomal protein L11 |
| chr12_+_103498542 | 0.01 |
ENSMUST00000021631.12
|
Ppp4r4
|
protein phosphatase 4, regulatory subunit 4 |
| chr9_+_114560235 | 0.01 |
ENSMUST00000035007.10
|
Cmtm6
|
CKLF-like MARVEL transmembrane domain containing 6 |
| chr8_+_110595216 | 0.01 |
ENSMUST00000179721.8
ENSMUST00000034175.5 |
Phlpp2
|
PH domain and leucine rich repeat protein phosphatase 2 |
| chr7_+_73390026 | 0.01 |
ENSMUST00000107456.4
|
Fam174b
|
family with sequence similarity 174, member B |
| chr17_+_75312520 | 0.01 |
ENSMUST00000234490.2
ENSMUST00000001927.12 |
Ltbp1
|
latent transforming growth factor beta binding protein 1 |
| chr3_+_28835425 | 0.01 |
ENSMUST00000060500.9
|
Eif5a2
|
eukaryotic translation initiation factor 5A2 |
| chr12_+_86725459 | 0.01 |
ENSMUST00000021681.4
|
Vash1
|
vasohibin 1 |
| chr5_-_115236354 | 0.01 |
ENSMUST00000100848.3
|
Gm10401
|
predicted gene 10401 |
| chr3_+_145281941 | 0.01 |
ENSMUST00000199033.5
ENSMUST00000098534.9 ENSMUST00000200574.5 ENSMUST00000196413.5 ENSMUST00000197604.3 |
Znhit6
|
zinc finger, HIT type 6 |
| chr11_+_4136789 | 0.01 |
ENSMUST00000041042.13
ENSMUST00000180088.2 |
Tbc1d10a
|
TBC1 domain family, member 10a |
| chr17_+_46471950 | 0.01 |
ENSMUST00000024748.14
ENSMUST00000172170.8 |
Gtpbp2
|
GTP binding protein 2 |
| chr15_+_6416229 | 0.01 |
ENSMUST00000110664.9
ENSMUST00000110663.9 ENSMUST00000161812.8 ENSMUST00000160134.8 |
Dab2
|
disabled 2, mitogen-responsive phosphoprotein |
| chr4_+_48045143 | 0.01 |
ENSMUST00000030025.10
|
Nr4a3
|
nuclear receptor subfamily 4, group A, member 3 |
| chr5_+_54155814 | 0.01 |
ENSMUST00000117661.9
|
Stim2
|
stromal interaction molecule 2 |
| chr18_-_77652820 | 0.01 |
ENSMUST00000026494.14
ENSMUST00000182024.2 |
Rnf165
|
ring finger protein 165 |
| chr3_-_54715191 | 0.01 |
ENSMUST00000044373.6
|
Rfxap
|
regulatory factor X-associated protein |
| chr11_-_106679312 | 0.01 |
ENSMUST00000021062.12
|
Ddx5
|
DEAD box helicase 5 |
| chr4_-_108436514 | 0.01 |
ENSMUST00000079213.6
|
Prpf38a
|
PRP38 pre-mRNA processing factor 38 (yeast) domain containing A |
| chr2_-_130506484 | 0.01 |
ENSMUST00000089559.11
|
Ddrgk1
|
DDRGK domain containing 1 |
| chr15_-_3612703 | 0.01 |
ENSMUST00000069451.11
|
Ghr
|
growth hormone receptor |
| chr17_+_86475205 | 0.01 |
ENSMUST00000097275.9
|
Prkce
|
protein kinase C, epsilon |
| chr19_-_7360350 | 0.01 |
ENSMUST00000025924.4
|
Spindoc
|
spindlin interactor and repressor of chromatin binding |
| chr18_+_10325148 | 0.01 |
ENSMUST00000048977.16
|
Greb1l
|
growth regulation by estrogen in breast cancer-like |
| chr14_+_67953547 | 0.01 |
ENSMUST00000078053.13
|
Kctd9
|
potassium channel tetramerisation domain containing 9 |
| chr8_-_11362731 | 0.01 |
ENSMUST00000033898.10
|
Col4a1
|
collagen, type IV, alpha 1 |
| chr14_-_61677258 | 0.01 |
ENSMUST00000022496.9
|
Kpna3
|
karyopherin (importin) alpha 3 |
| chr13_+_104424359 | 0.01 |
ENSMUST00000065766.7
|
Adamts6
|
a disintegrin-like and metallopeptidase (reprolysin type) with thrombospondin type 1 motif, 6 |
| chr7_-_100021514 | 0.01 |
ENSMUST00000032963.10
|
Ppme1
|
protein phosphatase methylesterase 1 |
| chr2_+_152873772 | 0.01 |
ENSMUST00000037235.7
|
Xkr7
|
X-linked Kx blood group related 7 |
| chr10_+_106306122 | 0.01 |
ENSMUST00000029404.17
ENSMUST00000217854.2 |
Ppfia2
|
protein tyrosine phosphatase, receptor type, f polypeptide (PTPRF), interacting protein (liprin), alpha 2 |
| chr2_+_76200299 | 0.01 |
ENSMUST00000046389.5
|
Rbm45
|
RNA binding motif protein 45 |
| chr11_+_95304903 | 0.01 |
ENSMUST00000107724.9
ENSMUST00000150884.8 ENSMUST00000107722.8 ENSMUST00000127713.2 |
Spop
|
speckle-type BTB/POZ protein |
| chrX_-_42256694 | 0.01 |
ENSMUST00000115058.8
ENSMUST00000115059.8 |
Tenm1
|
teneurin transmembrane protein 1 |
| chr19_-_4355983 | 0.01 |
ENSMUST00000025791.12
|
Grk2
|
G protein-coupled receptor kinase 2 |
| chr5_+_43390513 | 0.01 |
ENSMUST00000166713.9
ENSMUST00000169035.8 ENSMUST00000114065.9 |
Cpeb2
|
cytoplasmic polyadenylation element binding protein 2 |
| chr17_+_28426752 | 0.01 |
ENSMUST00000002327.6
ENSMUST00000233560.2 ENSMUST00000233958.2 ENSMUST00000233170.2 |
Def6
|
differentially expressed in FDCP 6 |
| chr11_-_102209767 | 0.01 |
ENSMUST00000174302.8
ENSMUST00000178839.8 ENSMUST00000006754.14 |
Ubtf
|
upstream binding transcription factor, RNA polymerase I |
| chrX_+_12937714 | 0.01 |
ENSMUST00000169594.9
ENSMUST00000089302.11 |
Usp9x
|
ubiquitin specific peptidase 9, X chromosome |
| chr11_-_4696778 | 0.01 |
ENSMUST00000009219.3
|
Cabp7
|
calcium binding protein 7 |
| chr12_+_29578354 | 0.01 |
ENSMUST00000218583.2
ENSMUST00000049784.17 |
Myt1l
|
myelin transcription factor 1-like |
| chr17_+_29879569 | 0.01 |
ENSMUST00000024816.13
ENSMUST00000235031.2 ENSMUST00000234911.2 |
Cmtr1
|
cap methyltransferase 1 |
| chr19_-_44058175 | 0.01 |
ENSMUST00000172041.8
ENSMUST00000071698.13 ENSMUST00000112028.10 |
Erlin1
|
ER lipid raft associated 1 |
| chr8_+_26275314 | 0.01 |
ENSMUST00000038421.8
|
Lsm1
|
LSM1 homolog, mRNA degradation associated |
| chr6_-_71609881 | 0.01 |
ENSMUST00000065509.11
ENSMUST00000207023.2 |
Kdm3a
|
lysine (K)-specific demethylase 3A |
| chr2_-_115896279 | 0.01 |
ENSMUST00000110907.8
ENSMUST00000110908.9 |
Meis2
|
Meis homeobox 2 |
| chr6_-_120470768 | 0.01 |
ENSMUST00000178687.2
|
Tmem121b
|
transmembrane protein 121B |
| chr5_-_137682927 | 0.01 |
ENSMUST00000100544.11
ENSMUST00000031736.16 ENSMUST00000151839.2 |
Agfg2
|
ArfGAP with FG repeats 2 |
| chr1_-_36748985 | 0.01 |
ENSMUST00000043951.10
|
Actr1b
|
ARP1 actin-related protein 1B, centractin beta |
| chr2_-_65397809 | 0.01 |
ENSMUST00000066432.12
|
Scn3a
|
sodium channel, voltage-gated, type III, alpha |
| chr11_-_60770098 | 0.01 |
ENSMUST00000062677.12
|
Tmem11
|
transmembrane protein 11 |
| chr19_+_53128861 | 0.01 |
ENSMUST00000111741.10
|
Add3
|
adducin 3 (gamma) |
| chr7_-_144837719 | 0.01 |
ENSMUST00000058022.6
|
Tpcn2
|
two pore segment channel 2 |
| chr13_-_101904662 | 0.00 |
ENSMUST00000055518.13
|
Pik3r1
|
phosphoinositide-3-kinase regulatory subunit 1 |
| chr10_-_63039709 | 0.00 |
ENSMUST00000095580.3
|
Mypn
|
myopalladin |
| chr2_+_121786444 | 0.00 |
ENSMUST00000036647.13
|
Ctdspl2
|
CTD (carboxy-terminal domain, RNA polymerase II, polypeptide A) small phosphatase like 2 |
| chr11_+_69737437 | 0.00 |
ENSMUST00000152566.8
ENSMUST00000108633.9 |
Plscr3
|
phospholipid scramblase 3 |
| chr11_+_59197746 | 0.00 |
ENSMUST00000000128.10
ENSMUST00000108783.4 |
Wnt9a
|
wingless-type MMTV integration site family, member 9A |
| chr9_-_59393893 | 0.00 |
ENSMUST00000171975.8
|
Arih1
|
ariadne RBR E3 ubiquitin protein ligase 1 |
| chr4_+_129407374 | 0.00 |
ENSMUST00000062356.7
|
Marcksl1
|
MARCKS-like 1 |
| chr8_-_105169621 | 0.00 |
ENSMUST00000041769.8
|
Dync1li2
|
dynein, cytoplasmic 1 light intermediate chain 2 |
| chr2_+_74656145 | 0.00 |
ENSMUST00000028511.8
|
Mtx2
|
metaxin 2 |
| chr17_-_46798566 | 0.00 |
ENSMUST00000047034.9
|
Ttbk1
|
tau tubulin kinase 1 |
| chr12_-_8550003 | 0.00 |
ENSMUST00000067384.6
|
Rhob
|
ras homolog family member B |
| chr4_-_133360749 | 0.00 |
ENSMUST00000084238.5
|
Zdhhc18
|
zinc finger, DHHC domain containing 18 |
| chr12_+_80837284 | 0.00 |
ENSMUST00000220238.2
ENSMUST00000068519.7 |
Susd6
|
sushi domain containing 6 |
| chr18_-_38734389 | 0.00 |
ENSMUST00000025295.8
|
Spry4
|
sprouty RTK signaling antagonist 4 |
| chr19_+_40819682 | 0.00 |
ENSMUST00000025983.13
ENSMUST00000119316.2 |
Ccnj
|
cyclin J |
| chr19_+_8797330 | 0.00 |
ENSMUST00000096753.5
|
Hnrnpul2
|
heterogeneous nuclear ribonucleoprotein U-like 2 |
| chr11_+_56902624 | 0.00 |
ENSMUST00000036315.16
|
Gria1
|
glutamate receptor, ionotropic, AMPA1 (alpha 1) |
| chr11_+_115656246 | 0.00 |
ENSMUST00000093912.11
ENSMUST00000136720.8 ENSMUST00000103034.10 ENSMUST00000141871.8 |
Tmem94
|
transmembrane protein 94 |
| chr4_-_132459762 | 0.00 |
ENSMUST00000045550.5
|
Xkr8
|
X-linked Kx blood group related 8 |
| chr13_+_16189041 | 0.00 |
ENSMUST00000164993.2
|
Inhba
|
inhibin beta-A |
| chr4_+_140875222 | 0.00 |
ENSMUST00000030757.10
|
Fbxo42
|
F-box protein 42 |
| chr11_-_37126709 | 0.00 |
ENSMUST00000102801.8
|
Tenm2
|
teneurin transmembrane protein 2 |
| chr10_+_93476903 | 0.00 |
ENSMUST00000020204.5
|
Ntn4
|
netrin 4 |
| chr18_-_23174698 | 0.00 |
ENSMUST00000097651.10
|
Nol4
|
nucleolar protein 4 |
| chr11_-_85125889 | 0.00 |
ENSMUST00000018625.10
|
Appbp2
|
amyloid beta precursor protein (cytoplasmic tail) binding protein 2 |
| chr6_+_63232955 | 0.00 |
ENSMUST00000095852.5
|
Grid2
|
glutamate receptor, ionotropic, delta 2 |
| chr2_-_163592127 | 0.00 |
ENSMUST00000017841.4
|
Ada
|
adenosine deaminase |
| chr14_-_52610508 | 0.00 |
ENSMUST00000071221.2
|
Olfr1512
|
olfactory receptor 1512 |
| chr11_+_75623695 | 0.00 |
ENSMUST00000067664.10
|
Ywhae
|
tyrosine 3-monooxygenase/tryptophan 5-monooxygenase activation protein, epsilon polypeptide |
| chr16_-_67417768 | 0.00 |
ENSMUST00000114292.8
ENSMUST00000120898.8 |
Cadm2
|
cell adhesion molecule 2 |
| chr11_+_32592707 | 0.00 |
ENSMUST00000109366.8
ENSMUST00000093205.13 ENSMUST00000076383.8 |
Fbxw11
|
F-box and WD-40 domain protein 11 |
| chr7_+_107166653 | 0.00 |
ENSMUST00000120990.2
|
Olfml1
|
olfactomedin-like 1 |
| chr3_-_108443769 | 0.00 |
ENSMUST00000048012.13
ENSMUST00000106625.10 |
Elapor1
|
endosome-lysosome associated apoptosis and autophagy regulator 1 |
| chr7_+_63094489 | 0.00 |
ENSMUST00000058476.14
|
Otud7a
|
OTU domain containing 7A |
| chr14_+_70314652 | 0.00 |
ENSMUST00000035908.3
|
Egr3
|
early growth response 3 |
| chr14_+_3575879 | 0.00 |
ENSMUST00000150727.8
|
Ube2e2
|
ubiquitin-conjugating enzyme E2E 2 |
| chr11_-_104333059 | 0.00 |
ENSMUST00000106977.8
ENSMUST00000106972.8 |
Kansl1
|
KAT8 regulatory NSL complex subunit 1 |
| chr8_+_14145848 | 0.00 |
ENSMUST00000152652.8
ENSMUST00000133298.8 |
Dlgap2
|
DLG associated protein 2 |
| chr16_+_31697628 | 0.00 |
ENSMUST00000023464.6
|
Meltf
|
melanotransferrin |
| chr13_+_13612136 | 0.00 |
ENSMUST00000005532.9
|
Nid1
|
nidogen 1 |
| chr2_+_31462780 | 0.00 |
ENSMUST00000137889.7
ENSMUST00000194386.6 ENSMUST00000055244.13 |
Fubp3
|
far upstream element (FUSE) binding protein 3 |
| chr1_-_172156884 | 0.00 |
ENSMUST00000062387.8
|
Kcnj9
|
potassium inwardly-rectifying channel, subfamily J, member 9 |
| chr15_+_80057894 | 0.00 |
ENSMUST00000044970.7
|
Mgat3
|
mannoside acetylglucosaminyltransferase 3 |
| chr4_-_141391406 | 0.00 |
ENSMUST00000084203.11
|
Plekhm2
|
pleckstrin homology domain containing, family M (with RUN domain) member 2 |
| chr14_-_109151590 | 0.00 |
ENSMUST00000100322.4
|
Slitrk1
|
SLIT and NTRK-like family, member 1 |
| chr9_+_107812873 | 0.00 |
ENSMUST00000035700.14
|
Camkv
|
CaM kinase-like vesicle-associated |
| chr16_-_20549294 | 0.00 |
ENSMUST00000231826.2
ENSMUST00000076422.13 ENSMUST00000232217.2 |
Thpo
|
thrombopoietin |
| chr15_-_89310060 | 0.00 |
ENSMUST00000109313.9
|
Cpt1b
|
carnitine palmitoyltransferase 1b, muscle |
| chr19_+_38919353 | 0.00 |
ENSMUST00000025965.12
|
Hells
|
helicase, lymphoid specific |
| chr5_+_111478608 | 0.00 |
ENSMUST00000086635.9
ENSMUST00000200298.2 |
Pitpnb
|
phosphatidylinositol transfer protein, beta |
| chr15_+_66449385 | 0.00 |
ENSMUST00000230882.2
ENSMUST00000048188.10 ENSMUST00000230948.2 ENSMUST00000229160.2 |
Phf20l1
|
PHD finger protein 20-like 1 |
| chr14_+_70768257 | 0.00 |
ENSMUST00000047331.8
|
Lgi3
|
leucine-rich repeat LGI family, member 3 |
| chr6_+_38639945 | 0.00 |
ENSMUST00000114874.5
|
Clec2l
|
C-type lectin domain family 2, member L |
| chr4_-_49845549 | 0.00 |
ENSMUST00000093859.11
ENSMUST00000076674.4 |
Grin3a
|
glutamate receptor ionotropic, NMDA3A |
| chrX_-_133652080 | 0.00 |
ENSMUST00000113194.8
|
Armcx6
|
armadillo repeat containing, X-linked 6 |
| chr11_-_100861713 | 0.00 |
ENSMUST00000060792.6
|
Cavin1
|
caveolae associated 1 |
| chr9_+_30338329 | 0.00 |
ENSMUST00000164099.3
|
Snx19
|
sorting nexin 19 |
| chr5_-_31250817 | 0.00 |
ENSMUST00000031037.14
|
Slc30a3
|
solute carrier family 30 (zinc transporter), member 3 |
| chr4_-_138820269 | 0.00 |
ENSMUST00000042844.7
|
Nbl1
|
NBL1, DAN family BMP antagonist |
| chr10_-_30531768 | 0.00 |
ENSMUST00000092610.12
|
Ncoa7
|
nuclear receptor coactivator 7 |
| chr1_-_135846937 | 0.00 |
ENSMUST00000027667.13
|
Pkp1
|
plakophilin 1 |
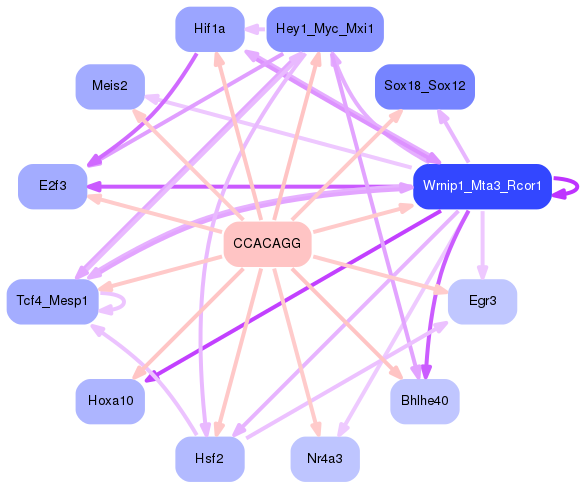
Network of associatons between targets according to the STRING database.

First level regulatory network of CCACAGG
Gene Ontology Analysis
Gene overrepresentation in biological process category:
| Log-likelihood per target | Total log-likelihood | Term | Description |
|---|---|---|---|
| 0.0 | 0.2 | GO:2000301 | negative regulation of synaptic vesicle exocytosis(GO:2000301) |
| 0.0 | 0.0 | GO:0060574 | intestinal epithelial cell maturation(GO:0060574) |
| 0.0 | 0.0 | GO:1900126 | negative regulation of hyaluronan biosynthetic process(GO:1900126) |
| 0.0 | 0.1 | GO:0010157 | response to chlorate(GO:0010157) |
Gene overrepresentation in molecular function category:
| Log-likelihood per target | Total log-likelihood | Term | Description |
|---|---|---|---|
| 0.0 | 0.1 | GO:0031800 | type 3 metabotropic glutamate receptor binding(GO:0031800) |