Project
GFI1 WT vs 36n/n vs KD
Navigation
Downloads
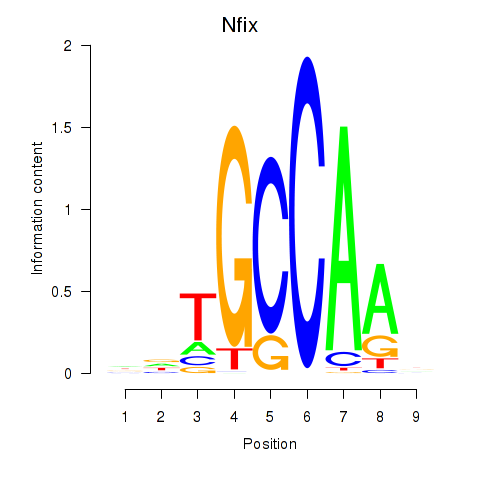
Results for Nfix
Z-value: 2.12
Motif logo
Transcription factors associated with Nfix
| Gene Symbol | Gene ID | Gene Info |
|---|---|---|
|
Nfix
|
ENSMUSG00000001911.17 | nuclear factor I/X |
Activity-expression correlation:
| Gene | Promoter | Pearson corr. coef. | P-value | Plot |
|---|---|---|---|---|
| Nfix | mm39_v1_chr8_-_85526972_85527008 | 0.98 | 3.2e-03 | Click! |
Activity profile of Nfix motif
Sorted Z-values of Nfix motif
| Promoter | Log-likelihood | Transcript | Gene | Gene Info |
|---|---|---|---|---|
| chr13_-_23806530 | 5.98 |
ENSMUST00000062045.4
|
H1f4
|
H1.4 linker histone, cluster member |
| chr11_+_68986043 | 4.07 |
ENSMUST00000101004.9
|
Per1
|
period circadian clock 1 |
| chr1_-_44258112 | 3.76 |
ENSMUST00000054801.4
|
Mettl21e
|
methyltransferase like 21E |
| chr17_-_82045800 | 3.43 |
ENSMUST00000235015.2
ENSMUST00000163123.3 |
Slc8a1
|
solute carrier family 8 (sodium/calcium exchanger), member 1 |
| chr18_-_78166595 | 2.64 |
ENSMUST00000091813.12
|
Slc14a1
|
solute carrier family 14 (urea transporter), member 1 |
| chr19_+_8828132 | 2.46 |
ENSMUST00000235683.2
ENSMUST00000096257.3 |
Lrrn4cl
|
LRRN4 C-terminal like |
| chr5_-_84565218 | 2.13 |
ENSMUST00000113401.4
|
Epha5
|
Eph receptor A5 |
| chr7_+_26895206 | 2.07 |
ENSMUST00000179391.8
ENSMUST00000108379.8 |
BC024978
|
cDNA sequence BC024978 |
| chr12_-_45120895 | 1.83 |
ENSMUST00000120531.8
ENSMUST00000143376.8 |
Stxbp6
|
syntaxin binding protein 6 (amisyn) |
| chr1_+_107456731 | 1.74 |
ENSMUST00000182198.8
|
Serpinb10
|
serine (or cysteine) peptidase inhibitor, clade B (ovalbumin), member 10 |
| chr3_-_129834788 | 1.61 |
ENSMUST00000168644.3
|
Sec24b
|
Sec24 related gene family, member B (S. cerevisiae) |
| chr7_+_19699291 | 1.58 |
ENSMUST00000094753.6
|
Ceacam20
|
carcinoembryonic antigen-related cell adhesion molecule 20 |
| chr9_+_89791943 | 1.58 |
ENSMUST00000189545.2
ENSMUST00000034909.11 ENSMUST00000034912.6 |
Rasgrf1
|
RAS protein-specific guanine nucleotide-releasing factor 1 |
| chr15_-_98769056 | 1.54 |
ENSMUST00000178486.9
ENSMUST00000023741.16 |
Kmt2d
|
lysine (K)-specific methyltransferase 2D |
| chr16_+_65317389 | 1.53 |
ENSMUST00000176330.8
ENSMUST00000004964.15 ENSMUST00000176038.8 |
Pou1f1
|
POU domain, class 1, transcription factor 1 |
| chr7_+_142030744 | 1.51 |
ENSMUST00000149521.8
|
Lsp1
|
lymphocyte specific 1 |
| chr5_+_64969679 | 1.46 |
ENSMUST00000166409.6
ENSMUST00000197879.2 |
Klf3
|
Kruppel-like factor 3 (basic) |
| chr12_-_72455708 | 1.41 |
ENSMUST00000078505.14
|
Rtn1
|
reticulon 1 |
| chr9_-_87613301 | 1.34 |
ENSMUST00000034991.8
|
Tbx18
|
T-box18 |
| chr6_-_128332760 | 1.28 |
ENSMUST00000133134.3
ENSMUST00000157005.3 |
Tulp3
|
tubby-like protein 3 |
| chr7_+_46700349 | 1.26 |
ENSMUST00000010451.8
|
Tmem86a
|
transmembrane protein 86A |
| chr3_-_58792633 | 1.25 |
ENSMUST00000055636.13
ENSMUST00000072551.7 ENSMUST00000051408.8 |
Clrn1
|
clarin 1 |
| chr1_+_159351337 | 1.21 |
ENSMUST00000192069.6
|
Tnr
|
tenascin R |
| chr1_-_160134873 | 1.19 |
ENSMUST00000193185.6
|
Rabgap1l
|
RAB GTPase activating protein 1-like |
| chr11_+_96822213 | 1.19 |
ENSMUST00000107633.2
|
Prr15l
|
proline rich 15-like |
| chr3_+_63203235 | 1.15 |
ENSMUST00000194134.6
|
Mme
|
membrane metallo endopeptidase |
| chr10_-_12744025 | 1.13 |
ENSMUST00000219660.2
|
Utrn
|
utrophin |
| chr5_-_104125226 | 1.12 |
ENSMUST00000048118.15
|
Hsd17b13
|
hydroxysteroid (17-beta) dehydrogenase 13 |
| chrX_+_162691978 | 1.11 |
ENSMUST00000069041.15
|
Ap1s2
|
adaptor-related protein complex 1, sigma 2 subunit |
| chr2_-_111843053 | 1.08 |
ENSMUST00000213559.3
|
Olfr1310
|
olfactory receptor 1310 |
| chr16_+_51851917 | 1.06 |
ENSMUST00000227062.2
|
Cblb
|
Casitas B-lineage lymphoma b |
| chr7_-_19621833 | 1.05 |
ENSMUST00000052605.8
|
Ceacam19
|
carcinoembryonic antigen-related cell adhesion molecule 19 |
| chr10_-_12743915 | 1.04 |
ENSMUST00000219584.2
|
Utrn
|
utrophin |
| chr1_-_162687488 | 1.03 |
ENSMUST00000134098.8
ENSMUST00000111518.3 |
Fmo1
|
flavin containing monooxygenase 1 |
| chr16_+_51851588 | 1.03 |
ENSMUST00000114471.3
|
Cblb
|
Casitas B-lineage lymphoma b |
| chr11_+_77107006 | 0.99 |
ENSMUST00000156488.8
ENSMUST00000037912.12 |
Ssh2
|
slingshot protein phosphatase 2 |
| chr16_+_57173456 | 0.94 |
ENSMUST00000159816.8
|
Filip1l
|
filamin A interacting protein 1-like |
| chr7_+_27879650 | 0.93 |
ENSMUST00000172467.8
|
Dyrk1b
|
dual-specificity tyrosine-(Y)-phosphorylation regulated kinase 1b |
| chr11_+_98727611 | 0.93 |
ENSMUST00000107479.3
|
Rapgefl1
|
Rap guanine nucleotide exchange factor (GEF)-like 1 |
| chr8_-_106723026 | 0.92 |
ENSMUST00000227363.2
ENSMUST00000081998.13 |
Dpep2
|
dipeptidase 2 |
| chr4_+_118818775 | 0.90 |
ENSMUST00000058651.5
|
Lao1
|
L-amino acid oxidase 1 |
| chr2_+_121978156 | 0.89 |
ENSMUST00000102476.5
|
B2m
|
beta-2 microglobulin |
| chrX_+_10351360 | 0.88 |
ENSMUST00000076354.13
ENSMUST00000115526.2 |
Tspan7
|
tetraspanin 7 |
| chr12_-_84408576 | 0.87 |
ENSMUST00000021659.2
ENSMUST00000065536.9 |
Fam161b
|
family with sequence similarity 161, member B |
| chr10_+_73657689 | 0.85 |
ENSMUST00000064562.14
ENSMUST00000193174.6 ENSMUST00000105426.10 ENSMUST00000129404.9 ENSMUST00000131321.9 ENSMUST00000126920.9 ENSMUST00000147189.9 ENSMUST00000105424.10 ENSMUST00000092420.13 ENSMUST00000105429.10 ENSMUST00000193361.6 ENSMUST00000131724.9 ENSMUST00000152655.9 ENSMUST00000151116.9 ENSMUST00000155701.9 ENSMUST00000152819.9 ENSMUST00000125517.9 ENSMUST00000124046.8 ENSMUST00000146682.8 ENSMUST00000177107.8 ENSMUST00000149977.9 ENSMUST00000191854.6 |
Pcdh15
|
protocadherin 15 |
| chrX_-_20816841 | 0.85 |
ENSMUST00000009550.14
|
Elk1
|
ELK1, member of ETS oncogene family |
| chr12_-_72283465 | 0.84 |
ENSMUST00000021497.16
ENSMUST00000137990.2 |
Rtn1
|
reticulon 1 |
| chr2_-_45003270 | 0.81 |
ENSMUST00000202935.4
ENSMUST00000068415.11 ENSMUST00000127520.8 |
Zeb2
|
zinc finger E-box binding homeobox 2 |
| chr19_+_44321531 | 0.80 |
ENSMUST00000058856.9
|
Scd4
|
stearoyl-coenzyme A desaturase 4 |
| chr2_-_5680801 | 0.79 |
ENSMUST00000114987.4
|
Camk1d
|
calcium/calmodulin-dependent protein kinase ID |
| chrX_+_162692126 | 0.77 |
ENSMUST00000033734.14
ENSMUST00000112294.9 |
Ap1s2
|
adaptor-related protein complex 1, sigma 2 subunit |
| chr2_+_165834546 | 0.77 |
ENSMUST00000109252.8
ENSMUST00000088095.6 |
Ncoa3
|
nuclear receptor coactivator 3 |
| chr7_-_26895561 | 0.75 |
ENSMUST00000122202.8
ENSMUST00000080356.10 |
Snrpa
|
small nuclear ribonucleoprotein polypeptide A |
| chrX_-_47297436 | 0.74 |
ENSMUST00000037960.11
|
Zdhhc9
|
zinc finger, DHHC domain containing 9 |
| chr10_-_12702674 | 0.74 |
ENSMUST00000219130.2
|
Utrn
|
utrophin |
| chr13_+_16186410 | 0.73 |
ENSMUST00000042603.14
|
Inhba
|
inhibin beta-A |
| chr13_+_49761506 | 0.71 |
ENSMUST00000021822.7
|
Ogn
|
osteoglycin |
| chr7_-_30251680 | 0.70 |
ENSMUST00000215288.2
ENSMUST00000108165.8 ENSMUST00000153594.3 |
Proser3
|
proline and serine rich 3 |
| chr8_+_91554933 | 0.69 |
ENSMUST00000048665.8
|
Chd9
|
chromodomain helicase DNA binding protein 9 |
| chr1_-_86039692 | 0.67 |
ENSMUST00000027431.7
|
Htr2b
|
5-hydroxytryptamine (serotonin) receptor 2B |
| chr5_-_123887434 | 0.66 |
ENSMUST00000182955.8
ENSMUST00000182489.8 ENSMUST00000183147.9 ENSMUST00000050827.14 ENSMUST00000057795.12 ENSMUST00000111515.8 ENSMUST00000182309.8 |
Rsrc2
|
arginine/serine-rich coiled-coil 2 |
| chr7_+_99184858 | 0.65 |
ENSMUST00000032995.15
ENSMUST00000162404.8 |
Arrb1
|
arrestin, beta 1 |
| chr1_+_59952131 | 0.64 |
ENSMUST00000036540.12
|
Fam117b
|
family with sequence similarity 117, member B |
| chr11_+_3438274 | 0.64 |
ENSMUST00000064265.13
|
Pla2g3
|
phospholipase A2, group III |
| chr11_+_115802828 | 0.62 |
ENSMUST00000132961.2
|
Smim6
|
small integral membrane protein 6 |
| chr16_+_20492014 | 0.60 |
ENSMUST00000154950.8
ENSMUST00000115461.8 ENSMUST00000136713.5 |
Eif4g1
|
eukaryotic translation initiation factor 4, gamma 1 |
| chr8_+_107409765 | 0.60 |
ENSMUST00000211979.2
|
Tango6
|
transport and golgi organization 6 |
| chr5_+_149335214 | 0.60 |
ENSMUST00000093110.12
|
Medag
|
mesenteric estrogen dependent adipogenesis |
| chr14_-_55150547 | 0.60 |
ENSMUST00000228495.3
ENSMUST00000228119.3 ENSMUST00000050772.10 ENSMUST00000231305.2 |
Slc22a17
|
solute carrier family 22 (organic cation transporter), member 17 |
| chrX_+_56008685 | 0.59 |
ENSMUST00000096431.10
|
Adgrg4
|
adhesion G protein-coupled receptor G4 |
| chr9_+_77959206 | 0.58 |
ENSMUST00000024104.9
|
Gcm1
|
glial cells missing homolog 1 |
| chr6_-_128332789 | 0.57 |
ENSMUST00000001562.9
|
Tulp3
|
tubby-like protein 3 |
| chr7_-_25358406 | 0.57 |
ENSMUST00000071329.8
|
Bckdha
|
branched chain ketoacid dehydrogenase E1, alpha polypeptide |
| chr5_+_104447037 | 0.55 |
ENSMUST00000031246.9
|
Ibsp
|
integrin binding sialoprotein |
| chr6_-_129428869 | 0.55 |
ENSMUST00000203162.3
|
Clec1a
|
C-type lectin domain family 1, member a |
| chr1_-_155293141 | 0.54 |
ENSMUST00000111775.8
ENSMUST00000111774.2 |
Xpr1
|
xenotropic and polytropic retrovirus receptor 1 |
| chrX_-_47297746 | 0.52 |
ENSMUST00000088935.4
|
Zdhhc9
|
zinc finger, DHHC domain containing 9 |
| chr8_-_103512274 | 0.50 |
ENSMUST00000075190.5
|
Cdh11
|
cadherin 11 |
| chr16_-_20245071 | 0.47 |
ENSMUST00000115547.9
ENSMUST00000096199.5 |
Abcc5
|
ATP-binding cassette, sub-family C (CFTR/MRP), member 5 |
| chr13_+_83720457 | 0.47 |
ENSMUST00000196730.5
|
Mef2c
|
myocyte enhancer factor 2C |
| chr18_+_34380738 | 0.47 |
ENSMUST00000066133.7
|
Apc
|
APC, WNT signaling pathway regulator |
| chr7_-_26895141 | 0.46 |
ENSMUST00000163311.9
ENSMUST00000126211.2 |
Snrpa
|
small nuclear ribonucleoprotein polypeptide A |
| chrX_+_103526380 | 0.45 |
ENSMUST00000087867.6
|
Uprt
|
uracil phosphoribosyltransferase |
| chr2_+_29236815 | 0.45 |
ENSMUST00000028139.11
ENSMUST00000113830.11 |
Med27
|
mediator complex subunit 27 |
| chr14_-_36628263 | 0.45 |
ENSMUST00000183007.2
|
Ccser2
|
coiled-coil serine rich 2 |
| chr17_+_75772475 | 0.44 |
ENSMUST00000095204.6
|
Rasgrp3
|
RAS, guanyl releasing protein 3 |
| chr13_+_83720484 | 0.43 |
ENSMUST00000196207.5
|
Mef2c
|
myocyte enhancer factor 2C |
| chr1_-_160079007 | 0.43 |
ENSMUST00000191909.6
|
Rabgap1l
|
RAB GTPase activating protein 1-like |
| chr8_-_37200051 | 0.42 |
ENSMUST00000098826.10
|
Dlc1
|
deleted in liver cancer 1 |
| chr6_+_83055321 | 0.41 |
ENSMUST00000165164.9
ENSMUST00000092614.9 |
Pcgf1
|
polycomb group ring finger 1 |
| chr8_-_32440071 | 0.41 |
ENSMUST00000207678.3
|
Nrg1
|
neuregulin 1 |
| chr16_+_27208660 | 0.41 |
ENSMUST00000143823.2
|
Ccdc50
|
coiled-coil domain containing 50 |
| chr7_+_141276575 | 0.41 |
ENSMUST00000185406.8
|
Muc2
|
mucin 2 |
| chr5_+_24618380 | 0.41 |
ENSMUST00000049346.10
|
Asic3
|
acid-sensing (proton-gated) ion channel 3 |
| chr16_-_3726503 | 0.40 |
ENSMUST00000115859.8
|
1700037C18Rik
|
RIKEN cDNA 1700037C18 gene |
| chr16_-_20245138 | 0.39 |
ENSMUST00000079158.13
|
Abcc5
|
ATP-binding cassette, sub-family C (CFTR/MRP), member 5 |
| chr16_+_42727926 | 0.38 |
ENSMUST00000151244.8
ENSMUST00000114694.9 |
Zbtb20
|
zinc finger and BTB domain containing 20 |
| chr4_+_105014536 | 0.38 |
ENSMUST00000064139.8
|
Plpp3
|
phospholipid phosphatase 3 |
| chr9_-_60418286 | 0.35 |
ENSMUST00000098660.10
|
Thsd4
|
thrombospondin, type I, domain containing 4 |
| chr1_-_192880260 | 0.35 |
ENSMUST00000161367.2
|
Traf3ip3
|
TRAF3 interacting protein 3 |
| chr17_+_84933872 | 0.34 |
ENSMUST00000025101.10
|
Dync2li1
|
dynein cytoplasmic 2 light intermediate chain 1 |
| chr18_-_78166539 | 0.34 |
ENSMUST00000160292.8
|
Slc14a1
|
solute carrier family 14 (urea transporter), member 1 |
| chr6_-_33037107 | 0.34 |
ENSMUST00000115091.2
ENSMUST00000127666.8 |
Chchd3
|
coiled-coil-helix-coiled-coil-helix domain containing 3 |
| chr11_+_78181667 | 0.33 |
ENSMUST00000046361.5
ENSMUST00000238934.2 |
Rskr
|
ribosomal protein S6 kinase related |
| chr16_+_20492564 | 0.33 |
ENSMUST00000141034.8
|
Eif4g1
|
eukaryotic translation initiation factor 4, gamma 1 |
| chr13_+_38529062 | 0.32 |
ENSMUST00000171970.3
|
Bmp6
|
bone morphogenetic protein 6 |
| chr17_-_49871291 | 0.32 |
ENSMUST00000224595.2
ENSMUST00000057610.8 |
Daam2
|
dishevelled associated activator of morphogenesis 2 |
| chr10_-_125164826 | 0.30 |
ENSMUST00000211781.2
|
Slc16a7
|
solute carrier family 16 (monocarboxylic acid transporters), member 7 |
| chr17_+_35354430 | 0.30 |
ENSMUST00000173535.8
ENSMUST00000173952.8 |
Bag6
|
BCL2-associated athanogene 6 |
| chr5_+_117271632 | 0.30 |
ENSMUST00000179276.8
ENSMUST00000092889.12 ENSMUST00000145640.8 |
Taok3
|
TAO kinase 3 |
| chr2_-_25471703 | 0.29 |
ENSMUST00000114217.3
ENSMUST00000191602.2 |
Ajm1
|
apical junction component 1 |
| chr11_+_67090878 | 0.29 |
ENSMUST00000124516.8
ENSMUST00000018637.15 ENSMUST00000129018.8 |
Myh1
|
myosin, heavy polypeptide 1, skeletal muscle, adult |
| chr11_-_75329726 | 0.29 |
ENSMUST00000108437.8
|
Serpinf2
|
serine (or cysteine) peptidase inhibitor, clade F, member 2 |
| chr9_+_44013019 | 0.28 |
ENSMUST00000034654.9
ENSMUST00000206308.2 ENSMUST00000161381.8 |
Mfrp
|
membrane frizzled-related protein |
| chr19_+_24651362 | 0.28 |
ENSMUST00000057243.6
|
Tmem252
|
transmembrane protein 252 |
| chr4_-_141351110 | 0.27 |
ENSMUST00000038661.8
|
Slc25a34
|
solute carrier family 25, member 34 |
| chr2_+_112097087 | 0.27 |
ENSMUST00000110987.9
ENSMUST00000028549.14 |
Slc12a6
|
solute carrier family 12, member 6 |
| chr6_+_15727798 | 0.27 |
ENSMUST00000128849.3
|
Mdfic
|
MyoD family inhibitor domain containing |
| chrX_+_101048650 | 0.26 |
ENSMUST00000144753.2
|
Nhsl2
|
NHS-like 2 |
| chr1_+_23801007 | 0.26 |
ENSMUST00000063663.6
|
B3gat2
|
beta-1,3-glucuronyltransferase 2 (glucuronosyltransferase S) |
| chr2_-_32277773 | 0.26 |
ENSMUST00000050785.14
|
Lcn2
|
lipocalin 2 |
| chr13_+_83652150 | 0.26 |
ENSMUST00000198199.5
|
Mef2c
|
myocyte enhancer factor 2C |
| chr2_-_142743354 | 0.26 |
ENSMUST00000211861.2
|
Kif16b
|
kinesin family member 16B |
| chr8_+_91555449 | 0.25 |
ENSMUST00000109614.9
|
Chd9
|
chromodomain helicase DNA binding protein 9 |
| chr6_-_102441628 | 0.24 |
ENSMUST00000032159.7
|
Cntn3
|
contactin 3 |
| chr18_+_4994600 | 0.24 |
ENSMUST00000140448.8
|
Svil
|
supervillin |
| chr12_-_70394074 | 0.24 |
ENSMUST00000223160.2
ENSMUST00000222316.2 ENSMUST00000167755.3 ENSMUST00000110520.10 ENSMUST00000110522.10 ENSMUST00000221041.2 ENSMUST00000222603.3 |
Trim9
|
tripartite motif-containing 9 |
| chr9_+_21095399 | 0.24 |
ENSMUST00000115458.9
|
Pde4a
|
phosphodiesterase 4A, cAMP specific |
| chr6_+_83055581 | 0.24 |
ENSMUST00000177177.8
ENSMUST00000176089.2 |
Pcgf1
|
polycomb group ring finger 1 |
| chr2_-_165726610 | 0.24 |
ENSMUST00000177633.8
ENSMUST00000018050.14 ENSMUST00000088113.11 |
Zmynd8
|
zinc finger, MYND-type containing 8 |
| chr3_+_103740056 | 0.23 |
ENSMUST00000106822.2
|
Bcl2l15
|
BCLl2-like 15 |
| chr2_+_51928017 | 0.23 |
ENSMUST00000065927.6
|
Tnfaip6
|
tumor necrosis factor alpha induced protein 6 |
| chr19_-_34856853 | 0.23 |
ENSMUST00000036584.13
|
Pank1
|
pantothenate kinase 1 |
| chr2_+_118493713 | 0.23 |
ENSMUST00000099557.10
|
Pak6
|
p21 (RAC1) activated kinase 6 |
| chr6_+_126992549 | 0.23 |
ENSMUST00000000187.7
|
Fgf6
|
fibroblast growth factor 6 |
| chr4_-_123466853 | 0.23 |
ENSMUST00000238555.2
|
Macf1
|
microtubule-actin crosslinking factor 1 |
| chr3_-_127202693 | 0.23 |
ENSMUST00000182078.9
|
Ank2
|
ankyrin 2, brain |
| chr11_+_110914678 | 0.22 |
ENSMUST00000150902.8
ENSMUST00000178798.2 |
Kcnj16
|
potassium inwardly-rectifying channel, subfamily J, member 16 |
| chr8_+_111345209 | 0.22 |
ENSMUST00000034190.11
|
Vac14
|
Vac14 homolog (S. cerevisiae) |
| chr2_-_22930188 | 0.22 |
ENSMUST00000114544.10
ENSMUST00000139038.8 ENSMUST00000126112.8 ENSMUST00000178908.2 ENSMUST00000078977.14 ENSMUST00000140164.8 ENSMUST00000149719.8 |
Abi1
|
abl interactor 1 |
| chr16_+_20513658 | 0.21 |
ENSMUST00000056518.13
|
Fam131a
|
family with sequence similarity 131, member A |
| chr6_+_125529911 | 0.20 |
ENSMUST00000112254.8
ENSMUST00000112253.6 |
Vwf
|
Von Willebrand factor |
| chr15_-_64794139 | 0.20 |
ENSMUST00000023007.7
ENSMUST00000228014.2 |
Adcy8
|
adenylate cyclase 8 |
| chr15_-_81581457 | 0.20 |
ENSMUST00000072910.6
|
Chadl
|
chondroadherin-like |
| chr3_-_127202663 | 0.20 |
ENSMUST00000182008.8
ENSMUST00000182547.8 |
Ank2
|
ankyrin 2, brain |
| chr9_+_121196034 | 0.19 |
ENSMUST00000210636.2
ENSMUST00000045903.8 |
Trak1
|
trafficking protein, kinesin binding 1 |
| chr17_+_35460722 | 0.18 |
ENSMUST00000068056.12
ENSMUST00000174757.8 ENSMUST00000173731.8 |
Ddx39b
|
DEAD box helicase 39b |
| chr6_+_128376729 | 0.18 |
ENSMUST00000001561.12
|
Nrip2
|
nuclear receptor interacting protein 2 |
| chr6_-_33037191 | 0.18 |
ENSMUST00000066379.11
|
Chchd3
|
coiled-coil-helix-coiled-coil-helix domain containing 3 |
| chr6_+_68414401 | 0.17 |
ENSMUST00000103324.3
|
Igkv15-103
|
immunoglobulin kappa chain variable 15-103 |
| chr13_+_83652280 | 0.17 |
ENSMUST00000199450.5
|
Mef2c
|
myocyte enhancer factor 2C |
| chr2_+_33106121 | 0.17 |
ENSMUST00000193373.3
|
Angptl2
|
angiopoietin-like 2 |
| chrX_-_105647282 | 0.17 |
ENSMUST00000113480.2
|
Cysltr1
|
cysteinyl leukotriene receptor 1 |
| chr14_+_55728519 | 0.17 |
ENSMUST00000076236.7
|
Carmil3
|
capping protein regulator and myosin 1 linker 3 |
| chr16_+_11223512 | 0.17 |
ENSMUST00000096273.9
|
Snx29
|
sorting nexin 29 |
| chr6_+_128376844 | 0.17 |
ENSMUST00000120405.4
|
Nrip2
|
nuclear receptor interacting protein 2 |
| chr2_+_33106062 | 0.16 |
ENSMUST00000004208.7
|
Angptl2
|
angiopoietin-like 2 |
| chr17_+_37836737 | 0.16 |
ENSMUST00000215424.2
|
Olfr111
|
olfactory receptor 111 |
| chrX_+_100473161 | 0.15 |
ENSMUST00000033673.7
|
Nono
|
non-POU-domain-containing, octamer binding protein |
| chr11_+_87471867 | 0.14 |
ENSMUST00000018544.12
ENSMUST00000063156.11 ENSMUST00000107960.8 |
Septin4
|
septin 4 |
| chr6_+_72333209 | 0.14 |
ENSMUST00000206531.2
|
Tmem150a
|
transmembrane protein 150A |
| chr13_+_42862957 | 0.14 |
ENSMUST00000066928.12
ENSMUST00000148891.8 |
Phactr1
|
phosphatase and actin regulator 1 |
| chr9_-_106035332 | 0.14 |
ENSMUST00000112543.9
|
Glyctk
|
glycerate kinase |
| chr1_+_93271340 | 0.14 |
ENSMUST00000185498.7
|
Ppp1r7
|
protein phosphatase 1, regulatory subunit 7 |
| chrX_-_58613428 | 0.14 |
ENSMUST00000119833.8
ENSMUST00000131319.8 |
Fgf13
|
fibroblast growth factor 13 |
| chr15_+_10952418 | 0.13 |
ENSMUST00000022853.15
ENSMUST00000110523.2 |
C1qtnf3
|
C1q and tumor necrosis factor related protein 3 |
| chr19_+_37674029 | 0.12 |
ENSMUST00000073391.5
|
Cyp26c1
|
cytochrome P450, family 26, subfamily c, polypeptide 1 |
| chr1_-_134260666 | 0.12 |
ENSMUST00000168515.8
ENSMUST00000189361.2 |
Ppfia4
|
protein tyrosine phosphatase, receptor type, f polypeptide (PTPRF), interacting protein (liprin), alpha 4 |
| chr8_+_10056654 | 0.12 |
ENSMUST00000033892.9
|
Tnfsf13b
|
tumor necrosis factor (ligand) superfamily, member 13b |
| chr7_+_18810097 | 0.12 |
ENSMUST00000032570.14
|
Dmwd
|
dystrophia myotonica-containing WD repeat motif |
| chr9_-_123546642 | 0.12 |
ENSMUST00000165754.8
ENSMUST00000026274.14 |
Lztfl1
|
leucine zipper transcription factor-like 1 |
| chr8_-_72019245 | 0.11 |
ENSMUST00000163659.3
ENSMUST00000048243.7 |
Nxnl1
|
nucleoredoxin-like 1 |
| chr7_+_18810167 | 0.11 |
ENSMUST00000108479.2
|
Dmwd
|
dystrophia myotonica-containing WD repeat motif |
| chr3_-_127202586 | 0.10 |
ENSMUST00000183095.3
ENSMUST00000182610.8 |
Ank2
|
ankyrin 2, brain |
| chr6_-_24956296 | 0.10 |
ENSMUST00000127247.4
|
Tmem229a
|
transmembrane protein 229A |
| chr8_-_68658694 | 0.10 |
ENSMUST00000212960.2
|
Psd3
|
pleckstrin and Sec7 domain containing 3 |
| chr17_-_15163362 | 0.10 |
ENSMUST00000238668.2
ENSMUST00000228330.2 |
Wdr27
|
WD repeat domain 27 |
| chr4_+_114945905 | 0.10 |
ENSMUST00000171877.8
ENSMUST00000177647.8 ENSMUST00000106548.9 ENSMUST00000030488.3 |
Pdzk1ip1
|
PDZK1 interacting protein 1 |
| chr11_+_49500090 | 0.09 |
ENSMUST00000020617.3
|
Flt4
|
FMS-like tyrosine kinase 4 |
| chr14_+_70694887 | 0.09 |
ENSMUST00000003561.10
|
Phyhip
|
phytanoyl-CoA hydroxylase interacting protein |
| chr9_+_32283779 | 0.09 |
ENSMUST00000047334.10
|
Kcnj1
|
potassium inwardly-rectifying channel, subfamily J, member 1 |
| chr12_-_81579614 | 0.08 |
ENSMUST00000169158.2
ENSMUST00000164431.2 ENSMUST00000163402.8 ENSMUST00000166664.2 ENSMUST00000164386.8 |
Synj2bp
Gm20498
|
synaptojanin 2 binding protein predicted gene 20498 |
| chr6_-_119173699 | 0.08 |
ENSMUST00000239204.2
|
Cacna1c
|
calcium channel, voltage-dependent, L type, alpha 1C subunit |
| chr1_+_90131702 | 0.08 |
ENSMUST00000065587.5
ENSMUST00000159654.2 |
Ackr3
|
atypical chemokine receptor 3 |
| chr8_+_10056631 | 0.08 |
ENSMUST00000207792.3
|
Tnfsf13b
|
tumor necrosis factor (ligand) superfamily, member 13b |
| chr11_+_115353290 | 0.07 |
ENSMUST00000106532.4
ENSMUST00000092445.12 ENSMUST00000153466.2 |
Slc16a5
|
solute carrier family 16 (monocarboxylic acid transporters), member 5 |
| chr12_-_76842263 | 0.07 |
ENSMUST00000082431.6
|
Gpx2
|
glutathione peroxidase 2 |
| chr7_+_48993197 | 0.07 |
ENSMUST00000207743.2
|
Nav2
|
neuron navigator 2 |
| chr11_+_54205722 | 0.07 |
ENSMUST00000072178.11
ENSMUST00000101211.9 ENSMUST00000101213.9 ENSMUST00000064690.10 ENSMUST00000108899.8 |
Acsl6
|
acyl-CoA synthetase long-chain family member 6 |
| chr2_-_86722536 | 0.07 |
ENSMUST00000111576.3
ENSMUST00000217403.2 |
Olfr1097
|
olfactory receptor 1097 |
| chr9_-_106343137 | 0.06 |
ENSMUST00000164834.3
|
Gpr62
|
G protein-coupled receptor 62 |
| chr10_-_77587188 | 0.06 |
ENSMUST00000219969.2
|
Gm9736
|
predicted gene 9736 |
| chr4_+_156214969 | 0.06 |
ENSMUST00000209248.2
|
Rnf223
|
ring finger 223 |
| chr19_-_41732104 | 0.06 |
ENSMUST00000025993.10
|
Slit1
|
slit guidance ligand 1 |
| chr17_-_14279793 | 0.06 |
ENSMUST00000186636.3
|
Gm7358
|
predicted gene 7358 |
| chr3_+_125197722 | 0.06 |
ENSMUST00000173932.8
|
Ndst4
|
N-deacetylase/N-sulfotransferase (heparin glucosaminyl) 4 |
| chr3_+_123240562 | 0.06 |
ENSMUST00000029603.10
|
Prss12
|
protease, serine 12 neurotrypsin (motopsin) |
| chr2_-_89893938 | 0.05 |
ENSMUST00000111506.3
ENSMUST00000216475.2 |
Olfr140
|
olfactory receptor 140 |
| chr8_-_84903181 | 0.05 |
ENSMUST00000070102.6
ENSMUST00000210202.2 |
Nanos3
|
nanos C2HC-type zinc finger 3 |
| chr9_+_40712562 | 0.05 |
ENSMUST00000117557.8
|
Hspa8
|
heat shock protein 8 |
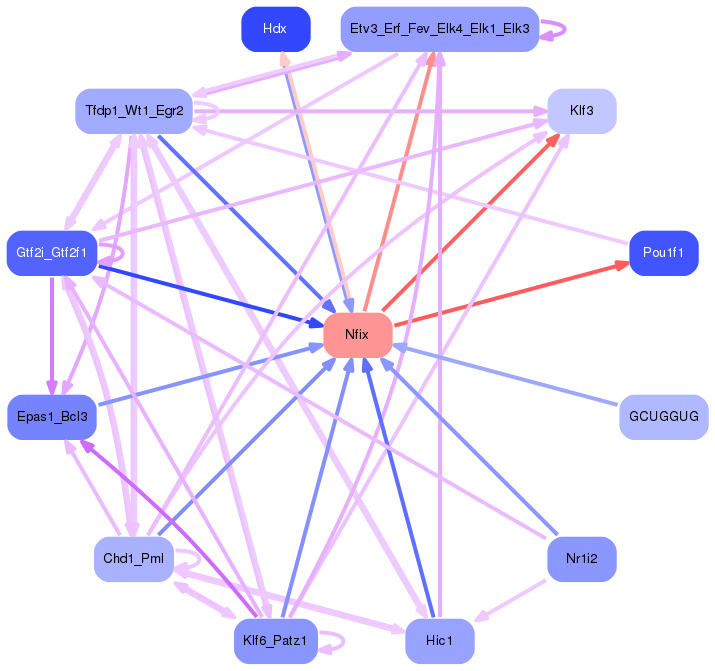
Network of associatons between targets according to the STRING database.

First level regulatory network of Nfix
Gene Ontology Analysis
Gene overrepresentation in biological process category:
| Log-likelihood per target | Total log-likelihood | Term | Description |
|---|---|---|---|
| 0.7 | 4.1 | GO:0097167 | circadian regulation of translation(GO:0097167) |
| 0.5 | 3.0 | GO:0071918 | urea transmembrane transport(GO:0071918) |
| 0.5 | 1.9 | GO:0060434 | bronchus morphogenesis(GO:0060434) |
| 0.4 | 1.3 | GO:2000729 | positive regulation of mesenchymal cell proliferation involved in ureter development(GO:2000729) |
| 0.4 | 2.9 | GO:0007527 | adult somatic muscle development(GO:0007527) |
| 0.4 | 1.6 | GO:1901301 | regulation of cargo loading into COPII-coated vesicle(GO:1901301) |
| 0.4 | 1.5 | GO:0060133 | somatotropin secreting cell development(GO:0060133) |
| 0.4 | 3.4 | GO:0071313 | cellular response to caffeine(GO:0071313) positive regulation of the force of heart contraction(GO:0098735) |
| 0.3 | 0.9 | GO:0034758 | antigen processing and presentation of exogenous peptide antigen via MHC class Ib(GO:0002477) antigen processing and presentation of exogenous protein antigen via MHC class Ib, TAP-dependent(GO:0002481) positive regulation of iron ion transport(GO:0034758) positive regulation of iron ion transmembrane transport(GO:0034761) regulation of iron ion import(GO:1900390) regulation of ferrous iron import into cell(GO:1903989) positive regulation of ferrous iron import into cell(GO:1903991) regulation of ferrous iron binding(GO:1904432) positive regulation of ferrous iron binding(GO:1904434) regulation of transferrin receptor binding(GO:1904435) positive regulation of transferrin receptor binding(GO:1904437) regulation of ferrous iron import across plasma membrane(GO:1904438) positive regulation of ferrous iron import across plasma membrane(GO:1904440) |
| 0.3 | 0.9 | GO:0015891 | iron chelate transport(GO:0015688) siderophore transport(GO:0015891) |
| 0.3 | 0.8 | GO:0050973 | detection of mechanical stimulus involved in equilibrioception(GO:0050973) |
| 0.3 | 2.1 | GO:0035542 | regulation of SNARE complex assembly(GO:0035542) |
| 0.2 | 1.2 | GO:0048690 | regulation of sprouting of injured axon(GO:0048686) regulation of axon extension involved in regeneration(GO:0048690) |
| 0.2 | 2.1 | GO:0002913 | positive regulation of T cell anergy(GO:0002669) positive regulation of lymphocyte anergy(GO:0002913) |
| 0.2 | 1.2 | GO:0071492 | cellular response to UV-A(GO:0071492) |
| 0.2 | 0.7 | GO:0007208 | phospholipase C-activating serotonin receptor signaling pathway(GO:0007208) |
| 0.2 | 2.5 | GO:0071372 | cellular response to follicle-stimulating hormone stimulus(GO:0071372) |
| 0.1 | 0.6 | GO:0060800 | regulation of cell differentiation involved in embryonic placenta development(GO:0060800) |
| 0.1 | 1.2 | GO:0050957 | equilibrioception(GO:0050957) |
| 0.1 | 0.8 | GO:1903966 | monounsaturated fatty acid metabolic process(GO:1903964) monounsaturated fatty acid biosynthetic process(GO:1903966) |
| 0.1 | 2.3 | GO:0033148 | positive regulation of intracellular estrogen receptor signaling pathway(GO:0033148) |
| 0.1 | 0.8 | GO:1902748 | positive regulation of lens fiber cell differentiation(GO:1902748) |
| 0.1 | 1.3 | GO:0018231 | peptidyl-L-cysteine S-palmitoylation(GO:0018230) peptidyl-S-diacylglycerol-L-cysteine biosynthetic process from peptidyl-cysteine(GO:0018231) |
| 0.1 | 0.4 | GO:0050968 | detection of chemical stimulus involved in sensory perception of pain(GO:0050968) |
| 0.1 | 0.7 | GO:0042699 | follicle-stimulating hormone signaling pathway(GO:0042699) |
| 0.1 | 0.8 | GO:0060267 | positive regulation of respiratory burst(GO:0060267) |
| 0.1 | 0.9 | GO:0003172 | primary heart field specification(GO:0003138) sinoatrial valve development(GO:0003172) sinoatrial valve morphogenesis(GO:0003185) |
| 0.1 | 0.5 | GO:2000211 | regulation of glutamate metabolic process(GO:2000211) |
| 0.1 | 0.4 | GO:0044330 | canonical Wnt signaling pathway involved in positive regulation of wound healing(GO:0044330) |
| 0.1 | 0.3 | GO:0035735 | intraciliary transport involved in cilium morphogenesis(GO:0035735) |
| 0.1 | 0.3 | GO:0042539 | hypotonic salinity response(GO:0042539) cellular hypotonic salinity response(GO:0071477) |
| 0.1 | 1.4 | GO:0035020 | regulation of Rac protein signal transduction(GO:0035020) |
| 0.1 | 1.0 | GO:0070995 | NADPH oxidation(GO:0070995) |
| 0.1 | 0.6 | GO:0019372 | lipoxygenase pathway(GO:0019372) |
| 0.1 | 0.4 | GO:0098907 | protein localization to M-band(GO:0036309) protein localization to T-tubule(GO:0036371) regulation of SA node cell action potential(GO:0098907) |
| 0.0 | 1.8 | GO:0035855 | megakaryocyte development(GO:0035855) |
| 0.0 | 0.3 | GO:0032346 | positive regulation of aldosterone metabolic process(GO:0032346) positive regulation of aldosterone biosynthetic process(GO:0032349) |
| 0.0 | 0.5 | GO:2000507 | positive regulation of energy homeostasis(GO:2000507) |
| 0.0 | 0.3 | GO:1903054 | negative regulation of extracellular matrix organization(GO:1903054) |
| 0.0 | 0.5 | GO:0021957 | corticospinal tract morphogenesis(GO:0021957) |
| 0.0 | 0.4 | GO:0021842 | directional guidance of interneurons involved in migration from the subpallium to the cortex(GO:0021840) chemorepulsion involved in interneuron migration from the subpallium to the cortex(GO:0021842) |
| 0.0 | 0.2 | GO:0031296 | B cell costimulation(GO:0031296) |
| 0.0 | 0.2 | GO:1903758 | regulation of transcription from RNA polymerase II promoter by histone modification(GO:1903756) negative regulation of transcription from RNA polymerase II promoter by histone modification(GO:1903758) |
| 0.0 | 2.7 | GO:0060612 | adipose tissue development(GO:0060612) |
| 0.0 | 0.5 | GO:0035435 | phosphate ion transmembrane transport(GO:0035435) |
| 0.0 | 0.3 | GO:0036506 | maintenance of unfolded protein(GO:0036506) maintenance of unfolded protein involved in ERAD pathway(GO:1904378) |
| 0.0 | 0.2 | GO:0098957 | anterograde axonal transport of mitochondrion(GO:0098957) |
| 0.0 | 0.3 | GO:0003072 | regulation of blood vessel size by renin-angiotensin(GO:0002034) renal control of peripheral vascular resistance involved in regulation of systemic arterial blood pressure(GO:0003072) |
| 0.0 | 0.1 | GO:0035356 | cellular triglyceride homeostasis(GO:0035356) |
| 0.0 | 0.5 | GO:0042407 | cristae formation(GO:0042407) |
| 0.0 | 0.6 | GO:0009083 | branched-chain amino acid catabolic process(GO:0009083) |
| 0.0 | 0.4 | GO:0030277 | maintenance of gastrointestinal epithelium(GO:0030277) |
| 0.0 | 0.4 | GO:1900119 | positive regulation of execution phase of apoptosis(GO:1900119) |
| 0.0 | 0.1 | GO:1903377 | negative regulation of oxidative stress-induced neuron intrinsic apoptotic signaling pathway(GO:1903377) |
| 0.0 | 0.1 | GO:0016103 | diterpenoid catabolic process(GO:0016103) retinoic acid catabolic process(GO:0034653) |
| 0.0 | 0.1 | GO:0045196 | establishment or maintenance of neuroblast polarity(GO:0045196) establishment of neuroblast polarity(GO:0045200) |
| 0.0 | 0.1 | GO:1901475 | pyruvate transport(GO:0006848) pyruvate transmembrane transport(GO:1901475) |
| 0.0 | 0.8 | GO:0071480 | cellular response to gamma radiation(GO:0071480) |
| 0.0 | 0.2 | GO:0048251 | elastic fiber assembly(GO:0048251) |
| 0.0 | 0.1 | GO:0009609 | response to symbiont(GO:0009608) response to symbiotic bacterium(GO:0009609) |
| 0.0 | 1.0 | GO:0010591 | regulation of lamellipodium assembly(GO:0010591) |
| 0.0 | 0.4 | GO:0035518 | histone H2A monoubiquitination(GO:0035518) |
| 0.0 | 0.1 | GO:0010747 | positive regulation of plasma membrane long-chain fatty acid transport(GO:0010747) |
| 0.0 | 0.3 | GO:0006895 | Golgi to endosome transport(GO:0006895) |
| 0.0 | 0.2 | GO:0015937 | coenzyme A biosynthetic process(GO:0015937) |
| 0.0 | 0.1 | GO:0033563 | dorsal/ventral axon guidance(GO:0033563) |
| 0.0 | 0.1 | GO:0098912 | membrane depolarization during atrial cardiac muscle cell action potential(GO:0098912) |
| 0.0 | 0.3 | GO:0007095 | mitotic G2 DNA damage checkpoint(GO:0007095) |
| 0.0 | 0.1 | GO:1901979 | renal sodium ion absorption(GO:0070294) regulation of inward rectifier potassium channel activity(GO:1901979) |
| 0.0 | 0.2 | GO:0006620 | posttranslational protein targeting to membrane(GO:0006620) |
Gene overrepresentation in cellular component category:
| Log-likelihood per target | Total log-likelihood | Term | Description |
|---|---|---|---|
| 0.3 | 1.3 | GO:0070722 | Tle3-Aes complex(GO:0070722) |
| 0.3 | 1.2 | GO:0072534 | perineuronal net(GO:0072534) |
| 0.2 | 1.9 | GO:0030991 | intraciliary transport particle A(GO:0030991) |
| 0.1 | 0.4 | GO:0043512 | inhibin A complex(GO:0043512) |
| 0.1 | 1.5 | GO:0044666 | MLL3/4 complex(GO:0044666) |
| 0.1 | 2.9 | GO:0070938 | contractile ring(GO:0070938) |
| 0.1 | 0.6 | GO:0005947 | mitochondrial alpha-ketoglutarate dehydrogenase complex(GO:0005947) |
| 0.1 | 0.2 | GO:0005687 | U4 snRNP(GO:0005687) |
| 0.1 | 1.6 | GO:0030127 | COPII vesicle coat(GO:0030127) |
| 0.1 | 1.2 | GO:0002178 | palmitoyltransferase complex(GO:0002178) |
| 0.1 | 1.8 | GO:0000145 | exocyst(GO:0000145) |
| 0.1 | 0.5 | GO:0061617 | MICOS complex(GO:0061617) |
| 0.1 | 0.9 | GO:0042612 | MHC class I protein complex(GO:0042612) |
| 0.1 | 0.5 | GO:0034750 | Scrib-APC-beta-catenin complex(GO:0034750) |
| 0.1 | 1.6 | GO:0031528 | microvillus membrane(GO:0031528) |
| 0.0 | 1.6 | GO:0016327 | apicolateral plasma membrane(GO:0016327) |
| 0.0 | 1.2 | GO:0005685 | U1 snRNP(GO:0005685) |
| 0.0 | 0.5 | GO:0016281 | eukaryotic translation initiation factor 4F complex(GO:0016281) |
| 0.0 | 4.3 | GO:0014704 | intercalated disc(GO:0014704) |
| 0.0 | 1.2 | GO:0030140 | trans-Golgi network transport vesicle(GO:0030140) |
| 0.0 | 0.3 | GO:0071818 | BAT3 complex(GO:0071818) ER membrane insertion complex(GO:0072379) |
| 0.0 | 0.3 | GO:0005577 | fibrinogen complex(GO:0005577) |
| 0.0 | 0.7 | GO:0031143 | pseudopodium(GO:0031143) |
| 0.0 | 0.2 | GO:0035032 | phosphatidylinositol 3-kinase complex, class III(GO:0035032) |
| 0.0 | 0.1 | GO:0002095 | caveolar macromolecular signaling complex(GO:0002095) |
| 0.0 | 1.1 | GO:0005790 | smooth endoplasmic reticulum(GO:0005790) |
| 0.0 | 0.2 | GO:0033093 | Weibel-Palade body(GO:0033093) |
| 0.0 | 0.4 | GO:0001527 | microfibril(GO:0001527) fibril(GO:0043205) |
| 0.0 | 2.1 | GO:0005791 | rough endoplasmic reticulum(GO:0005791) |
| 0.0 | 0.4 | GO:0032045 | guanyl-nucleotide exchange factor complex(GO:0032045) |
| 0.0 | 0.1 | GO:0042382 | paraspeckles(GO:0042382) |
| 0.0 | 0.2 | GO:0031209 | SCAR complex(GO:0031209) |
| 0.0 | 0.1 | GO:0043202 | lysosomal lumen(GO:0043202) |
| 0.0 | 1.2 | GO:0005905 | clathrin-coated pit(GO:0005905) |
| 0.0 | 0.2 | GO:1904115 | axon cytoplasm(GO:1904115) |
| 0.0 | 0.3 | GO:0005868 | cytoplasmic dynein complex(GO:0005868) |
| 0.0 | 1.1 | GO:0005811 | lipid particle(GO:0005811) |
Gene overrepresentation in molecular function category:
| Log-likelihood per target | Total log-likelihood | Term | Description |
|---|---|---|---|
| 1.1 | 3.4 | GO:0099580 | ion antiporter activity involved in regulation of postsynaptic membrane potential(GO:0099580) |
| 0.4 | 3.0 | GO:0015265 | urea channel activity(GO:0015265) |
| 0.3 | 0.9 | GO:0001716 | L-amino-acid oxidase activity(GO:0001716) |
| 0.2 | 1.2 | GO:0035614 | snRNA stem-loop binding(GO:0035614) |
| 0.2 | 0.7 | GO:0031896 | V2 vasopressin receptor binding(GO:0031896) |
| 0.2 | 2.1 | GO:0005004 | GPI-linked ephrin receptor activity(GO:0005004) |
| 0.2 | 0.6 | GO:0003863 | alpha-ketoacid dehydrogenase activity(GO:0003826) 3-methyl-2-oxobutanoate dehydrogenase (2-methylpropanoyl-transferring) activity(GO:0003863) |
| 0.1 | 0.5 | GO:0000822 | inositol hexakisphosphate binding(GO:0000822) |
| 0.1 | 0.8 | GO:0032896 | palmitoyl-CoA 9-desaturase activity(GO:0032896) |
| 0.1 | 3.3 | GO:0017166 | vinculin binding(GO:0017166) |
| 0.1 | 1.0 | GO:0004499 | N,N-dimethylaniline monooxygenase activity(GO:0004499) |
| 0.1 | 0.4 | GO:0042392 | sphingosine-1-phosphate phosphatase activity(GO:0042392) |
| 0.1 | 1.8 | GO:0017049 | GTP-Rho binding(GO:0017049) |
| 0.1 | 1.2 | GO:0046625 | sphingolipid binding(GO:0046625) |
| 0.1 | 0.3 | GO:0035827 | rubidium ion transmembrane transporter activity(GO:0035827) |
| 0.1 | 0.8 | GO:0001135 | transcription factor activity, RNA polymerase II transcription factor recruiting(GO:0001135) |
| 0.1 | 0.4 | GO:0070699 | type II activin receptor binding(GO:0070699) |
| 0.0 | 0.9 | GO:0008239 | dipeptidyl-peptidase activity(GO:0008239) |
| 0.0 | 0.7 | GO:0051378 | serotonin binding(GO:0051378) |
| 0.0 | 3.6 | GO:0070888 | E-box binding(GO:0070888) |
| 0.0 | 0.3 | GO:0015018 | galactosylgalactosylxylosylprotein 3-beta-glucuronosyltransferase activity(GO:0015018) |
| 0.0 | 0.4 | GO:0015280 | ligand-gated sodium channel activity(GO:0015280) |
| 0.0 | 1.3 | GO:0019707 | protein-cysteine S-palmitoyltransferase activity(GO:0019706) protein-cysteine S-acyltransferase activity(GO:0019707) |
| 0.0 | 0.2 | GO:0004594 | pantothenate kinase activity(GO:0004594) |
| 0.0 | 0.2 | GO:0030621 | U4 snRNA binding(GO:0030621) |
| 0.0 | 4.1 | GO:0030971 | receptor tyrosine kinase binding(GO:0030971) |
| 0.0 | 0.9 | GO:0003680 | AT DNA binding(GO:0003680) |
| 0.0 | 0.3 | GO:0045504 | dynein heavy chain binding(GO:0045504) |
| 0.0 | 0.2 | GO:0004974 | leukotriene receptor activity(GO:0004974) |
| 0.0 | 0.5 | GO:0008190 | eukaryotic initiation factor 4E binding(GO:0008190) |
| 0.0 | 0.2 | GO:0008294 | calcium- and calmodulin-responsive adenylate cyclase activity(GO:0008294) |
| 0.0 | 1.3 | GO:0001106 | RNA polymerase II transcription corepressor activity(GO:0001106) |
| 0.0 | 0.8 | GO:0070412 | R-SMAD binding(GO:0070412) |
| 0.0 | 1.5 | GO:0018024 | histone-lysine N-methyltransferase activity(GO:0018024) |
| 0.0 | 1.4 | GO:0001102 | RNA polymerase II activating transcription factor binding(GO:0001102) |
| 0.0 | 0.1 | GO:0008401 | retinoic acid 4-hydroxylase activity(GO:0008401) |
| 0.0 | 0.1 | GO:0050833 | pyruvate transmembrane transporter activity(GO:0050833) |
| 0.0 | 0.5 | GO:0051010 | microtubule plus-end binding(GO:0051010) |
| 0.0 | 0.2 | GO:0070700 | BMP receptor binding(GO:0070700) |
| 0.0 | 1.0 | GO:0008138 | protein tyrosine/serine/threonine phosphatase activity(GO:0008138) |
| 0.0 | 0.3 | GO:1990381 | ubiquitin-specific protease binding(GO:1990381) |
| 0.0 | 0.3 | GO:0030957 | Tat protein binding(GO:0030957) |
| 0.0 | 1.9 | GO:0008565 | protein transporter activity(GO:0008565) |
| 0.0 | 0.1 | GO:0031686 | A1 adenosine receptor binding(GO:0031686) |
| 0.0 | 0.1 | GO:0019958 | C-X-C chemokine binding(GO:0019958) |
| 0.0 | 0.1 | GO:0015272 | ATP-activated inward rectifier potassium channel activity(GO:0015272) |
| 0.0 | 0.1 | GO:0086056 | voltage-gated calcium channel activity involved in AV node cell action potential(GO:0086056) |
| 0.0 | 0.2 | GO:0030296 | protein tyrosine kinase activator activity(GO:0030296) |
| 0.0 | 0.3 | GO:0008574 | ATP-dependent microtubule motor activity, plus-end-directed(GO:0008574) |
| 0.0 | 0.3 | GO:0004190 | aspartic-type endopeptidase activity(GO:0004190) |
| 0.0 | 2.1 | GO:0008168 | methyltransferase activity(GO:0008168) |
| 0.0 | 0.7 | GO:0004712 | protein serine/threonine/tyrosine kinase activity(GO:0004712) |
Gene overrepresentation in curated gene sets: canonical pathways category:
| Log-likelihood per target | Total log-likelihood | Term | Description |
|---|---|---|---|
| 0.2 | 4.2 | PID CIRCADIAN PATHWAY | Circadian rhythm pathway |
| 0.0 | 2.1 | PID EPHA FWDPATHWAY | EPHA forward signaling |
| 0.0 | 0.8 | PID TCR RAS PATHWAY | Ras signaling in the CD4+ TCR pathway |
| 0.0 | 0.8 | PID ERB GENOMIC PATHWAY | Validated nuclear estrogen receptor beta network |
| 0.0 | 1.3 | PID P38 MK2 PATHWAY | p38 signaling mediated by MAPKAP kinases |
| 0.0 | 1.8 | PID CD40 PATHWAY | CD40/CD40L signaling |
| 0.0 | 0.7 | PID IL8 CXCR1 PATHWAY | IL8- and CXCR1-mediated signaling events |
| 0.0 | 0.9 | PID MAPK TRK PATHWAY | Trk receptor signaling mediated by the MAPK pathway |
| 0.0 | 1.0 | PID RAS PATHWAY | Regulation of Ras family activation |
| 0.0 | 0.9 | NABA PROTEOGLYCANS | Genes encoding proteoglycans |
| 0.0 | 0.9 | PID CD8 TCR DOWNSTREAM PATHWAY | Downstream signaling in naïve CD8+ T cells |
| 0.0 | 0.5 | ST GRANULE CELL SURVIVAL PATHWAY | Granule Cell Survival Pathway is a specific case of more general PAC1 Receptor Pathway. |
| 0.0 | 0.4 | PID ERBB NETWORK PATHWAY | ErbB receptor signaling network |
| 0.0 | 1.3 | PID REG GR PATHWAY | Glucocorticoid receptor regulatory network |
| 0.0 | 0.2 | PID LPA4 PATHWAY | LPA4-mediated signaling events |
| 0.0 | 0.3 | PID P38 MKK3 6PATHWAY | p38 MAPK signaling pathway |
Gene overrepresentation in curated gene sets: REACTOME pathways category:
| Log-likelihood per target | Total log-likelihood | Term | Description |
|---|---|---|---|
| 0.3 | 0.9 | REACTOME ENDOSOMAL VACUOLAR PATHWAY | Genes involved in Endosomal/Vacuolar pathway |
| 0.1 | 3.4 | REACTOME PLATELET CALCIUM HOMEOSTASIS | Genes involved in Platelet calcium homeostasis |
| 0.1 | 1.9 | REACTOME NEF MEDIATED DOWNREGULATION OF MHC CLASS I COMPLEX CELL SURFACE EXPRESSION | Genes involved in Nef mediated downregulation of MHC class I complex cell surface expression |
| 0.1 | 3.0 | REACTOME AMINE COMPOUND SLC TRANSPORTERS | Genes involved in Amine compound SLC transporters |
| 0.1 | 3.7 | REACTOME BMAL1 CLOCK NPAS2 ACTIVATES CIRCADIAN EXPRESSION | Genes involved in BMAL1:CLOCK/NPAS2 Activates Circadian Expression |
| 0.1 | 0.7 | REACTOME SEROTONIN RECEPTORS | Genes involved in Serotonin receptors |
| 0.1 | 0.9 | REACTOME HYALURONAN METABOLISM | Genes involved in Hyaluronan metabolism |
| 0.0 | 1.6 | REACTOME RAS ACTIVATION UOPN CA2 INFUX THROUGH NMDA RECEPTOR | Genes involved in Ras activation uopn Ca2+ infux through NMDA receptor |
| 0.0 | 2.1 | REACTOME ANTIGEN ACTIVATES B CELL RECEPTOR LEADING TO GENERATION OF SECOND MESSENGERS | Genes involved in Antigen Activates B Cell Receptor Leading to Generation of Second Messengers |
| 0.0 | 0.4 | REACTOME GLYCOPROTEIN HORMONES | Genes involved in Glycoprotein hormones |
| 0.0 | 0.5 | REACTOME KERATAN SULFATE DEGRADATION | Genes involved in Keratan sulfate degradation |
| 0.0 | 1.8 | REACTOME ERK MAPK TARGETS | Genes involved in ERK/MAPK targets |
| 0.0 | 0.6 | REACTOME ANTIGEN PRESENTATION FOLDING ASSEMBLY AND PEPTIDE LOADING OF CLASS I MHC | Genes involved in Antigen Presentation: Folding, assembly and peptide loading of class I MHC |
| 0.0 | 0.7 | REACTOME LYSOSOME VESICLE BIOGENESIS | Genes involved in Lysosome Vesicle Biogenesis |
| 0.0 | 0.6 | REACTOME ACYL CHAIN REMODELLING OF PG | Genes involved in Acyl chain remodelling of PG |
| 0.0 | 0.6 | REACTOME BRANCHED CHAIN AMINO ACID CATABOLISM | Genes involved in Branched-chain amino acid catabolism |
| 0.0 | 0.2 | REACTOME ACTIVATION OF RAC | Genes involved in Activation of Rac |
| 0.0 | 0.4 | REACTOME TERMINATION OF O GLYCAN BIOSYNTHESIS | Genes involved in Termination of O-glycan biosynthesis |
| 0.0 | 0.2 | REACTOME PLATELET ADHESION TO EXPOSED COLLAGEN | Genes involved in Platelet Adhesion to exposed collagen |
| 0.0 | 0.5 | REACTOME DEADENYLATION OF MRNA | Genes involved in Deadenylation of mRNA |
| 0.0 | 0.5 | REACTOME ADHERENS JUNCTIONS INTERACTIONS | Genes involved in Adherens junctions interactions |
| 0.0 | 0.4 | REACTOME DOWNREGULATION OF ERBB2 ERBB3 SIGNALING | Genes involved in Downregulation of ERBB2:ERBB3 signaling |
| 0.0 | 0.2 | REACTOME VITAMIN B5 PANTOTHENATE METABOLISM | Genes involved in Vitamin B5 (pantothenate) metabolism |
| 0.0 | 0.2 | REACTOME FGFR4 LIGAND BINDING AND ACTIVATION | Genes involved in FGFR4 ligand binding and activation |
| 0.0 | 0.2 | REACTOME ADENYLATE CYCLASE ACTIVATING PATHWAY | Genes involved in Adenylate cyclase activating pathway |
| 0.0 | 0.2 | REACTOME EICOSANOID LIGAND BINDING RECEPTORS | Genes involved in Eicosanoid ligand-binding receptors |
| 0.0 | 0.2 | REACTOME SYNTHESIS OF PIPS AT THE GOLGI MEMBRANE | Genes involved in Synthesis of PIPs at the Golgi membrane |