Project
GFI1 WT vs 36n/n vs KD
Navigation
Downloads
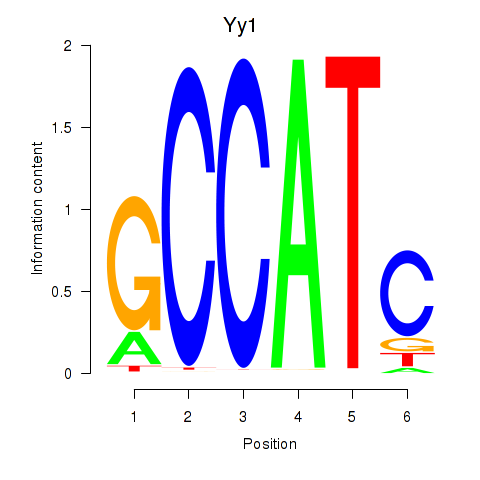
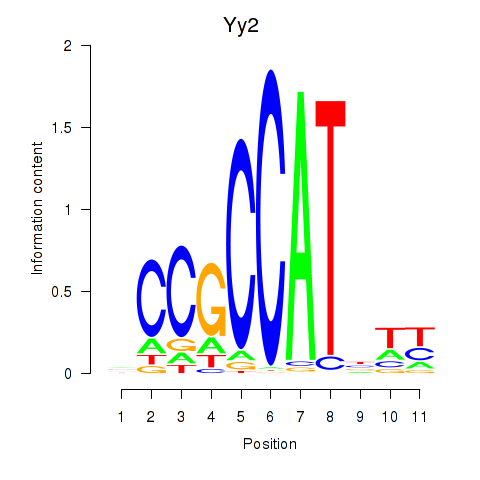
Results for Yy1_Yy2
Z-value: 2.79
Motif logo
Transcription factors associated with Yy1_Yy2
| Gene Symbol | Gene ID | Gene Info |
|---|---|---|
|
Yy1
|
ENSMUSG00000021264.13 | YY1 transcription factor |
|
Yy2
|
ENSMUSG00000091736.4 | Yy2 transcription factor |
Activity-expression correlation:
| Gene | Promoter | Pearson corr. coef. | P-value | Plot |
|---|---|---|---|---|
| Yy1 | mm39_v1_chr12_+_108758871_108758914 | 0.22 | 7.2e-01 | Click! |
| Yy2 | mm39_v1_chrX_-_156351979_156351987 | -0.17 | 7.9e-01 | Click! |
Activity profile of Yy1_Yy2 motif
Sorted Z-values of Yy1_Yy2 motif
| Promoter | Log-likelihood | Transcript | Gene | Gene Info |
|---|---|---|---|---|
| chr5_+_138159333 | 1.85 |
ENSMUST00000019638.15
ENSMUST00000110951.8 |
Cops6
|
COP9 signalosome subunit 6 |
| chr13_-_97897139 | 1.81 |
ENSMUST00000074072.5
|
Rps18-ps6
|
ribosomal protein S18, pseudogene 6 |
| chr7_+_28524627 | 1.80 |
ENSMUST00000066264.13
|
Ech1
|
enoyl coenzyme A hydratase 1, peroxisomal |
| chr13_+_55862437 | 1.61 |
ENSMUST00000021959.11
|
Txndc15
|
thioredoxin domain containing 15 |
| chr8_+_85583611 | 1.58 |
ENSMUST00000003906.13
ENSMUST00000109754.2 |
Farsa
|
phenylalanyl-tRNA synthetase, alpha subunit |
| chr15_-_79967543 | 1.48 |
ENSMUST00000081650.15
|
Rpl3
|
ribosomal protein L3 |
| chr10_-_128384971 | 1.46 |
ENSMUST00000176906.2
|
Rpl41
|
ribosomal protein L41 |
| chr9_-_50515089 | 1.30 |
ENSMUST00000000175.6
|
Sdhd
|
succinate dehydrogenase complex, subunit D, integral membrane protein |
| chrX_+_93768175 | 1.29 |
ENSMUST00000101388.4
|
Zxdb
|
zinc finger, X-linked, duplicated B |
| chr18_+_84106188 | 1.25 |
ENSMUST00000060223.4
|
Zadh2
|
zinc binding alcohol dehydrogenase, domain containing 2 |
| chr7_-_117715351 | 1.20 |
ENSMUST00000128482.8
ENSMUST00000131840.3 |
Rps15a
|
ribosomal protein S15A |
| chr17_-_27841759 | 1.19 |
ENSMUST00000176458.2
ENSMUST00000114886.8 |
Nudt3
|
nudix (nucleotide diphosphate linked moiety X)-type motif 3 |
| chr17_+_27000034 | 1.19 |
ENSMUST00000015725.16
ENSMUST00000135824.8 ENSMUST00000137989.2 |
Bnip1
|
BCL2/adenovirus E1B interacting protein 1 |
| chr11_-_69553451 | 1.16 |
ENSMUST00000018905.12
|
Mpdu1
|
mannose-P-dolichol utilization defect 1 |
| chr7_+_78432867 | 1.14 |
ENSMUST00000032840.5
|
Mrps11
|
mitochondrial ribosomal protein S11 |
| chr7_-_78432774 | 1.14 |
ENSMUST00000032841.7
|
Mrpl46
|
mitochondrial ribosomal protein L46 |
| chr13_+_73479101 | 1.13 |
ENSMUST00000022098.10
ENSMUST00000222030.2 |
Mrpl36
|
mitochondrial ribosomal protein L36 |
| chr3_-_130523954 | 1.07 |
ENSMUST00000196202.5
ENSMUST00000133802.6 ENSMUST00000062601.14 ENSMUST00000200517.2 |
Rpl34
|
ribosomal protein L34 |
| chr18_+_60907698 | 1.06 |
ENSMUST00000118551.8
|
Rps14
|
ribosomal protein S14 |
| chr13_+_28441511 | 1.06 |
ENSMUST00000223428.2
|
Rps18-ps5
|
ribosomal protein S18, pseudogene 5 |
| chrX_+_55493325 | 1.04 |
ENSMUST00000079663.7
|
Gm2174
|
predicted gene 2174 |
| chr3_-_130524024 | 1.04 |
ENSMUST00000079085.11
|
Rpl34
|
ribosomal protein L34 |
| chr18_+_84106796 | 1.03 |
ENSMUST00000235383.2
|
Zadh2
|
zinc binding alcohol dehydrogenase, domain containing 2 |
| chr14_+_51181956 | 1.03 |
ENSMUST00000178092.2
ENSMUST00000227052.2 |
Pnp
Gm49342
|
purine-nucleoside phosphorylase predicted gene, 49342 |
| chr6_-_83031358 | 1.02 |
ENSMUST00000113962.8
ENSMUST00000089645.13 ENSMUST00000113963.8 |
Htra2
|
HtrA serine peptidase 2 |
| chr6_+_88061464 | 0.99 |
ENSMUST00000032143.8
|
Rpn1
|
ribophorin I |
| chr2_-_144112700 | 0.98 |
ENSMUST00000110030.10
|
Snx5
|
sorting nexin 5 |
| chr17_+_46957151 | 0.96 |
ENSMUST00000002844.14
ENSMUST00000113429.8 ENSMUST00000113430.2 |
Mrpl2
|
mitochondrial ribosomal protein L2 |
| chr14_-_54855446 | 0.96 |
ENSMUST00000227257.2
ENSMUST00000022803.6 |
Psmb5
|
proteasome (prosome, macropain) subunit, beta type 5 |
| chr5_-_44383943 | 0.95 |
ENSMUST00000055128.12
|
Tapt1
|
transmembrane anterior posterior transformation 1 |
| chr7_-_45480200 | 0.95 |
ENSMUST00000107723.9
ENSMUST00000131384.3 |
Grwd1
|
glutamate-rich WD repeat containing 1 |
| chr11_+_117740077 | 0.94 |
ENSMUST00000081387.11
|
Birc5
|
baculoviral IAP repeat-containing 5 |
| chr4_+_129083553 | 0.94 |
ENSMUST00000106054.4
|
Yars
|
tyrosyl-tRNA synthetase |
| chr17_+_45817750 | 0.94 |
ENSMUST00000024733.9
|
Aars2
|
alanyl-tRNA synthetase 2, mitochondrial |
| chr10_-_116899239 | 0.93 |
ENSMUST00000219036.2
ENSMUST00000218059.2 |
Cct2
|
chaperonin containing Tcp1, subunit 2 (beta) |
| chr11_-_102588536 | 0.92 |
ENSMUST00000164506.3
ENSMUST00000092569.13 |
Ccdc43
|
coiled-coil domain containing 43 |
| chr11_-_115915315 | 0.90 |
ENSMUST00000016703.8
|
H3f3b
|
H3.3 histone B |
| chr12_-_80690573 | 0.89 |
ENSMUST00000166931.2
ENSMUST00000218364.2 |
Erh
|
ERH mRNA splicing and mitosis factor |
| chr2_-_164197987 | 0.87 |
ENSMUST00000165980.2
|
Slpi
|
secretory leukocyte peptidase inhibitor |
| chr2_-_25114660 | 0.87 |
ENSMUST00000043584.5
|
Tubb4b
|
tubulin, beta 4B class IVB |
| chr1_+_93682675 | 0.85 |
ENSMUST00000187824.7
|
Atg4b
|
autophagy related 4B, cysteine peptidase |
| chr7_-_126873219 | 0.85 |
ENSMUST00000082428.6
|
Sephs2
|
selenophosphate synthetase 2 |
| chr6_-_124689094 | 0.84 |
ENSMUST00000004379.8
|
Emg1
|
EMG1 N1-specific pseudouridine methyltransferase |
| chr4_+_135673758 | 0.84 |
ENSMUST00000030432.8
|
Hmgcl
|
3-hydroxy-3-methylglutaryl-Coenzyme A lyase |
| chr11_+_96920751 | 0.84 |
ENSMUST00000021249.11
|
Scrn2
|
secernin 2 |
| chr4_-_43656437 | 0.84 |
ENSMUST00000030192.5
|
Hint2
|
histidine triad nucleotide binding protein 2 |
| chr12_-_101942172 | 0.83 |
ENSMUST00000221191.2
|
Ndufb1
|
NADH:ubiquinone oxidoreductase subunit B1 |
| chr2_-_174305856 | 0.81 |
ENSMUST00000016396.8
|
Atp5e
|
ATP synthase, H+ transporting, mitochondrial F1 complex, epsilon subunit |
| chr11_-_69553390 | 0.81 |
ENSMUST00000129224.8
ENSMUST00000155200.8 |
Mpdu1
|
mannose-P-dolichol utilization defect 1 |
| chr17_+_29251602 | 0.81 |
ENSMUST00000130216.3
|
Srsf3
|
serine and arginine-rich splicing factor 3 |
| chr6_-_124689001 | 0.81 |
ENSMUST00000203238.2
|
Emg1
|
EMG1 N1-specific pseudouridine methyltransferase |
| chr4_+_133970973 | 0.81 |
ENSMUST00000135228.8
ENSMUST00000144222.8 ENSMUST00000143448.8 ENSMUST00000125921.8 ENSMUST00000122952.8 ENSMUST00000131447.2 |
E130218I03Rik
|
RIKEN cDNA E130218I03 gene |
| chr18_+_60907668 | 0.80 |
ENSMUST00000025511.11
|
Rps14
|
ribosomal protein S14 |
| chr12_+_87490666 | 0.80 |
ENSMUST00000161023.8
ENSMUST00000160488.8 ENSMUST00000077462.8 ENSMUST00000160880.2 |
Slirp
|
SRA stem-loop interacting RNA binding protein |
| chr11_-_93856783 | 0.78 |
ENSMUST00000021220.10
|
Nme1
|
NME/NM23 nucleoside diphosphate kinase 1 |
| chr13_+_73476629 | 0.78 |
ENSMUST00000221730.2
|
Mrpl36
|
mitochondrial ribosomal protein L36 |
| chr17_+_46421908 | 0.77 |
ENSMUST00000024763.10
ENSMUST00000123646.2 |
Mrps18a
|
mitochondrial ribosomal protein S18A |
| chr6_-_126826077 | 0.77 |
ENSMUST00000205002.3
ENSMUST00000088194.7 |
Ndufa9
|
NADH:ubiquinone oxidoreductase subunit A9 |
| chrX_+_73348832 | 0.76 |
ENSMUST00000153141.2
|
Gdi1
|
guanosine diphosphate (GDP) dissociation inhibitor 1 |
| chr11_-_119190830 | 0.75 |
ENSMUST00000106253.2
|
Eif4a3
|
eukaryotic translation initiation factor 4A3 |
| chr11_-_102360664 | 0.75 |
ENSMUST00000103086.4
|
Itga2b
|
integrin alpha 2b |
| chr7_-_4687916 | 0.75 |
ENSMUST00000206306.2
ENSMUST00000205952.2 ENSMUST00000079970.6 |
Hspbp1
|
HSPA (heat shock 70kDa) binding protein, cytoplasmic cochaperone 1 |
| chr7_+_140461860 | 0.75 |
ENSMUST00000026560.14
|
Psmd13
|
proteasome (prosome, macropain) 26S subunit, non-ATPase, 13 |
| chr19_+_10183397 | 0.75 |
ENSMUST00000166412.2
|
Tmem258
|
transmembrane protein 258 |
| chr7_-_99132843 | 0.75 |
ENSMUST00000208532.2
ENSMUST00000107096.2 ENSMUST00000032998.13 |
Rps3
|
ribosomal protein S3 |
| chr15_+_4055865 | 0.74 |
ENSMUST00000110690.9
|
Oxct1
|
3-oxoacid CoA transferase 1 |
| chr6_-_52217821 | 0.74 |
ENSMUST00000121043.2
|
Hoxa10
|
homeobox A10 |
| chr10_-_128384994 | 0.74 |
ENSMUST00000177163.8
ENSMUST00000176683.8 ENSMUST00000176010.8 |
Rpl41
|
ribosomal protein L41 |
| chr19_+_5012362 | 0.74 |
ENSMUST00000236917.2
|
Mrpl11
|
mitochondrial ribosomal protein L11 |
| chr11_-_62172164 | 0.73 |
ENSMUST00000072916.5
|
Zswim7
|
zinc finger SWIM-type containing 7 |
| chr1_+_43137852 | 0.73 |
ENSMUST00000010434.8
|
AI597479
|
expressed sequence AI597479 |
| chr12_+_51424343 | 0.73 |
ENSMUST00000219434.2
ENSMUST00000021335.7 |
Scfd1
|
Sec1 family domain containing 1 |
| chr14_+_21881599 | 0.73 |
ENSMUST00000173456.8
|
Vdac2
|
voltage-dependent anion channel 2 |
| chr7_+_43093507 | 0.72 |
ENSMUST00000004729.5
ENSMUST00000206286.2 ENSMUST00000206196.2 ENSMUST00000206411.2 |
Etfb
|
electron transferring flavoprotein, beta polypeptide |
| chr11_+_52265090 | 0.72 |
ENSMUST00000020673.3
|
Vdac1
|
voltage-dependent anion channel 1 |
| chr6_+_38511758 | 0.72 |
ENSMUST00000019833.5
|
Fmc1
|
formation of mitochondrial complex V assembly factor 1 |
| chr10_-_111829393 | 0.72 |
ENSMUST00000161870.3
|
Glipr1
|
GLI pathogenesis-related 1 (glioma) |
| chr2_-_164198427 | 0.71 |
ENSMUST00000109367.10
|
Slpi
|
secretory leukocyte peptidase inhibitor |
| chr11_+_58221538 | 0.71 |
ENSMUST00000116376.9
|
Sh3bp5l
|
SH3 binding domain protein 5 like |
| chr7_+_45364822 | 0.70 |
ENSMUST00000210640.2
|
Rpl18
|
ribosomal protein L18 |
| chr14_+_30853010 | 0.70 |
ENSMUST00000227096.2
|
Nt5dc2
|
5'-nucleotidase domain containing 2 |
| chr2_+_118576218 | 0.70 |
ENSMUST00000149978.2
|
Inafm2
|
InaF motif containing 2 |
| chr7_+_120633639 | 0.70 |
ENSMUST00000033163.8
|
Mettl9
|
methyltransferase like 9 |
| chr3_-_98247237 | 0.70 |
ENSMUST00000065793.12
|
Phgdh
|
3-phosphoglycerate dehydrogenase |
| chr11_-_116381125 | 0.69 |
ENSMUST00000135196.2
ENSMUST00000106391.8 |
Prpsap1
|
phosphoribosyl pyrophosphate synthetase-associated protein 1 |
| chr16_-_35311243 | 0.69 |
ENSMUST00000023550.9
|
Pdia5
|
protein disulfide isomerase associated 5 |
| chr6_-_24528012 | 0.69 |
ENSMUST00000023851.9
|
Ndufa5
|
NADH:ubiquinone oxidoreductase subunit A5 |
| chr19_+_5012336 | 0.68 |
ENSMUST00000237974.2
|
Mrpl11
|
mitochondrial ribosomal protein L11 |
| chr9_-_64633865 | 0.68 |
ENSMUST00000168366.2
|
Rab11a
|
RAB11A, member RAS oncogene family |
| chr11_+_76134541 | 0.68 |
ENSMUST00000040577.5
|
Mrm3
|
mitochondrial rRNA methyltransferase 3 |
| chrX_+_159945740 | 0.68 |
ENSMUST00000074802.12
ENSMUST00000019101.11 ENSMUST00000112345.8 |
Scml2
|
Scm polycomb group protein like 2 |
| chr3_+_5815863 | 0.68 |
ENSMUST00000192045.2
|
Gm8797
|
predicted pseudogene 8797 |
| chr5_+_52898910 | 0.68 |
ENSMUST00000031081.11
ENSMUST00000031082.8 |
Pi4k2b
|
phosphatidylinositol 4-kinase type 2 beta |
| chr5_+_45677571 | 0.67 |
ENSMUST00000156481.8
ENSMUST00000119579.3 ENSMUST00000118833.3 |
Med28
|
mediator complex subunit 28 |
| chr15_+_88703786 | 0.67 |
ENSMUST00000024042.5
|
Creld2
|
cysteine-rich with EGF-like domains 2 |
| chr13_-_99481160 | 0.67 |
ENSMUST00000022153.8
|
Ptcd2
|
pentatricopeptide repeat domain 2 |
| chr7_-_99508066 | 0.67 |
ENSMUST00000208477.2
ENSMUST00000208465.2 |
Spcs2
|
signal peptidase complex subunit 2 homolog (S. cerevisiae) |
| chr12_-_65120674 | 0.67 |
ENSMUST00000220983.2
ENSMUST00000220730.2 ENSMUST00000021332.10 |
Fkbp3
|
FK506 binding protein 3 |
| chr17_-_34250616 | 0.67 |
ENSMUST00000169397.9
|
Slc39a7
|
solute carrier family 39 (zinc transporter), member 7 |
| chr4_+_119090093 | 0.67 |
ENSMUST00000121111.9
ENSMUST00000030393.13 ENSMUST00000102662.11 |
P3h1
|
prolyl 3-hydroxylase 1 |
| chr12_+_84408742 | 0.66 |
ENSMUST00000021661.13
|
Coq6
|
coenzyme Q6 monooxygenase |
| chr7_+_45367545 | 0.66 |
ENSMUST00000209287.2
|
Rpl18
|
ribosomal protein L18 |
| chr5_+_129097133 | 0.66 |
ENSMUST00000031383.14
ENSMUST00000111343.2 |
Ran
|
RAN, member RAS oncogene family |
| chr9_+_107828136 | 0.65 |
ENSMUST00000049348.9
ENSMUST00000194271.2 |
Traip
|
TRAF-interacting protein |
| chr11_-_102297590 | 0.65 |
ENSMUST00000155104.8
ENSMUST00000130436.8 |
Slc25a39
|
solute carrier family 25, member 39 |
| chr7_-_99508117 | 0.65 |
ENSMUST00000209032.2
ENSMUST00000036274.8 |
Spcs2
|
signal peptidase complex subunit 2 homolog (S. cerevisiae) |
| chr15_-_55770118 | 0.65 |
ENSMUST00000110200.3
|
Sntb1
|
syntrophin, basic 1 |
| chr2_+_32647246 | 0.64 |
ENSMUST00000009707.14
ENSMUST00000177382.2 ENSMUST00000140999.2 |
Tor2a
|
torsin family 2, member A |
| chr4_-_123033721 | 0.64 |
ENSMUST00000030404.5
|
Ppie
|
peptidylprolyl isomerase E (cyclophilin E) |
| chr8_-_85573489 | 0.64 |
ENSMUST00000003912.7
|
Calr
|
calreticulin |
| chr15_+_4056103 | 0.64 |
ENSMUST00000138927.2
|
Oxct1
|
3-oxoacid CoA transferase 1 |
| chr1_-_171050004 | 0.63 |
ENSMUST00000147246.2
ENSMUST00000111326.8 ENSMUST00000138184.8 |
Tomm40l
|
translocase of outer mitochondrial membrane 40-like |
| chr5_+_108213608 | 0.63 |
ENSMUST00000081567.11
ENSMUST00000170319.8 ENSMUST00000112626.8 |
Mtf2
|
metal response element binding transcription factor 2 |
| chr19_-_33739351 | 0.63 |
ENSMUST00000025694.7
|
Lipo3
|
lipase, member O3 |
| chr14_+_4198667 | 0.63 |
ENSMUST00000079419.12
ENSMUST00000100799.9 |
Rpl15
|
ribosomal protein L15 |
| chr4_+_47474652 | 0.62 |
ENSMUST00000065678.6
|
Sec61b
|
Sec61 beta subunit |
| chr14_+_54924439 | 0.62 |
ENSMUST00000227269.2
|
1700123O20Rik
|
RIKEN cDNA 1700123O20 gene |
| chr10_-_117128763 | 0.62 |
ENSMUST00000092162.7
|
Lyz1
|
lysozyme 1 |
| chr1_-_171122509 | 0.62 |
ENSMUST00000111302.4
ENSMUST00000080001.9 |
Ufc1
|
ubiquitin-fold modifier conjugating enzyme 1 |
| chr14_-_25927674 | 0.62 |
ENSMUST00000100811.6
|
Tmem254a
|
transmembrane protein 254a |
| chr2_-_50186690 | 0.62 |
ENSMUST00000144143.8
ENSMUST00000102769.11 ENSMUST00000133768.2 |
Mmadhc
|
methylmalonic aciduria (cobalamin deficiency) cblD type, with homocystinuria |
| chr12_-_13299136 | 0.62 |
ENSMUST00000221623.2
|
Ddx1
|
DEAD box helicase 1 |
| chr1_+_39406979 | 0.61 |
ENSMUST00000178079.8
ENSMUST00000179954.8 |
Rpl31
|
ribosomal protein L31 |
| chr2_-_144112444 | 0.61 |
ENSMUST00000028909.5
|
Snx5
|
sorting nexin 5 |
| chr11_+_115494751 | 0.61 |
ENSMUST00000058109.9
|
Mrps7
|
mitchondrial ribosomal protein S7 |
| chr11_-_51579441 | 0.61 |
ENSMUST00000007921.9
|
0610009B22Rik
|
RIKEN cDNA 0610009B22 gene |
| chr9_+_83807162 | 0.61 |
ENSMUST00000190637.7
ENSMUST00000034801.11 |
Bckdhb
|
branched chain ketoacid dehydrogenase E1, beta polypeptide |
| chr15_-_4008913 | 0.61 |
ENSMUST00000022791.9
|
Fbxo4
|
F-box protein 4 |
| chr10_+_81012465 | 0.60 |
ENSMUST00000047864.11
|
Eef2
|
eukaryotic translation elongation factor 2 |
| chr12_+_84408803 | 0.60 |
ENSMUST00000110278.8
ENSMUST00000145522.2 |
Coq6
|
coenzyme Q6 monooxygenase |
| chr2_+_170353338 | 0.60 |
ENSMUST00000136839.2
ENSMUST00000109148.8 ENSMUST00000170167.8 |
Pfdn4
|
prefoldin 4 |
| chr11_+_69729340 | 0.59 |
ENSMUST00000133967.8
ENSMUST00000094065.5 |
Tmem256
|
transmembrane protein 256 |
| chr3_-_58433313 | 0.59 |
ENSMUST00000029385.9
|
Serp1
|
stress-associated endoplasmic reticulum protein 1 |
| chr8_+_70354828 | 0.59 |
ENSMUST00000050373.7
|
Tssk6
|
testis-specific serine kinase 6 |
| chr13_+_55740948 | 0.59 |
ENSMUST00000109905.5
|
Tmed9
|
transmembrane p24 trafficking protein 9 |
| chr11_+_58062467 | 0.59 |
ENSMUST00000020820.2
|
Mrpl22
|
mitochondrial ribosomal protein L22 |
| chrX_+_134786600 | 0.59 |
ENSMUST00000180025.8
ENSMUST00000148374.8 ENSMUST00000068755.14 |
Bhlhb9
|
basic helix-loop-helix domain containing, class B9 |
| chrX_+_139357362 | 0.58 |
ENSMUST00000033809.4
|
Prps1
|
phosphoribosyl pyrophosphate synthetase 1 |
| chr7_+_83541191 | 0.58 |
ENSMUST00000094215.10
ENSMUST00000130103.2 |
Mesd
|
mesoderm development LRP chaperone |
| chr9_-_78388080 | 0.58 |
ENSMUST00000156988.2
|
Eef1a1
|
eukaryotic translation elongation factor 1 alpha 1 |
| chr3_-_10416369 | 0.58 |
ENSMUST00000108377.8
ENSMUST00000037839.12 |
Zfand1
|
zinc finger, AN1-type domain 1 |
| chr19_-_33567708 | 0.58 |
ENSMUST00000112508.9
|
Lipo3
|
lipase, member O3 |
| chr11_+_58221569 | 0.58 |
ENSMUST00000073128.7
|
Sh3bp5l
|
SH3 binding domain protein 5 like |
| chr19_-_23425757 | 0.58 |
ENSMUST00000036069.8
|
Mamdc2
|
MAM domain containing 2 |
| chr9_-_115139489 | 0.58 |
ENSMUST00000035010.10
|
Stt3b
|
STT3, subunit of the oligosaccharyltransferase complex, homolog B (S. cerevisiae) |
| chr6_-_30390996 | 0.57 |
ENSMUST00000152391.9
ENSMUST00000115184.2 ENSMUST00000080812.14 ENSMUST00000102992.10 |
Zc3hc1
|
zinc finger, C3HC type 1 |
| chr2_-_26800581 | 0.57 |
ENSMUST00000015920.12
ENSMUST00000139815.2 ENSMUST00000102899.10 |
Med22
|
mediator complex subunit 22 |
| chr1_-_171050077 | 0.57 |
ENSMUST00000005817.9
|
Tomm40l
|
translocase of outer mitochondrial membrane 40-like |
| chr4_-_115932219 | 0.57 |
ENSMUST00000050580.11
ENSMUST00000078676.6 |
Uqcrh
|
ubiquinol-cytochrome c reductase hinge protein |
| chr18_+_67338437 | 0.57 |
ENSMUST00000210564.3
|
Chmp1b
|
charged multivesicular body protein 1B |
| chr18_-_36877571 | 0.57 |
ENSMUST00000014438.5
|
Ndufa2
|
NADH:ubiquinone oxidoreductase subunit A2 |
| chr13_+_4241149 | 0.57 |
ENSMUST00000021634.4
|
Akr1c13
|
aldo-keto reductase family 1, member C13 |
| chr11_-_76134436 | 0.57 |
ENSMUST00000164022.8
ENSMUST00000168055.2 ENSMUST00000169701.8 |
Glod4
|
glyoxalase domain containing 4 |
| chr1_-_182169150 | 0.57 |
ENSMUST00000051431.10
|
Fbxo28
|
F-box protein 28 |
| chr8_-_95564881 | 0.56 |
ENSMUST00000034233.15
ENSMUST00000162538.9 |
Ciapin1
|
cytokine induced apoptosis inhibitor 1 |
| chr19_-_45548942 | 0.56 |
ENSMUST00000026239.7
|
Poll
|
polymerase (DNA directed), lambda |
| chr9_+_56344700 | 0.56 |
ENSMUST00000239472.2
|
ENSMUSG00000118653.2
|
ubiquitin-conjugating enzyme E2S (Ube2s) retrogene |
| chr11_-_83540175 | 0.56 |
ENSMUST00000001008.6
|
Ccl3
|
chemokine (C-C motif) ligand 3 |
| chr15_+_76227695 | 0.56 |
ENSMUST00000023210.8
ENSMUST00000231045.2 |
Cyc1
|
cytochrome c-1 |
| chr19_+_6952319 | 0.56 |
ENSMUST00000070850.8
|
Ppp1r14b
|
protein phosphatase 1, regulatory inhibitor subunit 14B |
| chr4_+_47474715 | 0.56 |
ENSMUST00000137461.8
ENSMUST00000125622.2 |
Sec61b
|
Sec61 beta subunit |
| chr11_+_70416185 | 0.55 |
ENSMUST00000018430.7
|
Psmb6
|
proteasome (prosome, macropain) subunit, beta type 6 |
| chr17_-_56490887 | 0.55 |
ENSMUST00000019723.8
|
Mydgf
|
myeloid derived growth factor |
| chr19_-_44543838 | 0.55 |
ENSMUST00000167027.2
ENSMUST00000171415.8 ENSMUST00000026222.11 |
Ndufb8
|
NADH:ubiquinone oxidoreductase subunit B8 |
| chr17_+_47679807 | 0.55 |
ENSMUST00000120737.8
ENSMUST00000119945.8 ENSMUST00000125963.2 |
Mrps10
|
mitochondrial ribosomal protein S10 |
| chr1_-_93729562 | 0.55 |
ENSMUST00000112890.3
|
Dtymk
|
deoxythymidylate kinase |
| chr7_-_119319965 | 0.55 |
ENSMUST00000033236.9
|
Thumpd1
|
THUMP domain containing 1 |
| chr1_+_93406809 | 0.55 |
ENSMUST00000112912.8
|
Septin2
|
septin 2 |
| chr10_-_126737185 | 0.55 |
ENSMUST00000168520.3
ENSMUST00000026504.13 |
Atp23
|
ATP23 metallopeptidase and ATP synthase assembly factor homolog |
| chr11_-_119190896 | 0.55 |
ENSMUST00000026667.15
|
Eif4a3
|
eukaryotic translation initiation factor 4A3 |
| chr18_-_33346885 | 0.55 |
ENSMUST00000025236.9
|
Stard4
|
StAR-related lipid transfer (START) domain containing 4 |
| chr2_-_126333450 | 0.54 |
ENSMUST00000040149.13
|
Atp8b4
|
ATPase, class I, type 8B, member 4 |
| chr8_-_26505605 | 0.54 |
ENSMUST00000016138.11
|
Fnta
|
farnesyltransferase, CAAX box, alpha |
| chr6_-_125142539 | 0.54 |
ENSMUST00000183272.2
ENSMUST00000182052.8 ENSMUST00000182277.2 |
Gapdh
|
glyceraldehyde-3-phosphate dehydrogenase |
| chr13_-_54616618 | 0.54 |
ENSMUST00000026990.6
|
Thoc3
|
THO complex 3 |
| chr6_-_52185674 | 0.54 |
ENSMUST00000062829.9
|
Hoxa6
|
homeobox A6 |
| chr5_+_21942139 | 0.54 |
ENSMUST00000030882.12
|
Pmpcb
|
peptidase (mitochondrial processing) beta |
| chr2_+_109747984 | 0.54 |
ENSMUST00000046548.14
ENSMUST00000111037.3 |
Lgr4
|
leucine-rich repeat-containing G protein-coupled receptor 4 |
| chr1_+_93406686 | 0.54 |
ENSMUST00000027495.15
ENSMUST00000136182.8 ENSMUST00000131175.9 ENSMUST00000153826.8 ENSMUST00000129211.8 ENSMUST00000179353.8 ENSMUST00000172165.8 ENSMUST00000168776.8 |
Septin2
Septin2
|
septin 2 septin 2 |
| chr11_+_103024128 | 0.54 |
ENSMUST00000107037.8
ENSMUST00000124928.2 ENSMUST00000062530.5 |
Hexim2
|
hexamethylene bis-acetamide inducible 2 |
| chr18_-_36916148 | 0.53 |
ENSMUST00000001416.8
|
Hars
|
histidyl-tRNA synthetase |
| chr11_-_115426618 | 0.53 |
ENSMUST00000121185.8
ENSMUST00000117589.8 |
Sumo2
|
small ubiquitin-like modifier 2 |
| chr16_+_20536415 | 0.53 |
ENSMUST00000021405.8
|
Polr2h
|
polymerase (RNA) II (DNA directed) polypeptide H |
| chr19_+_24853039 | 0.53 |
ENSMUST00000073080.7
|
Gm10053
|
predicted gene 10053 |
| chr15_-_42540363 | 0.53 |
ENSMUST00000022921.7
|
Angpt1
|
angiopoietin 1 |
| chr11_-_29497819 | 0.53 |
ENSMUST00000102844.4
|
Rps27a
|
ribosomal protein S27A |
| chr13_+_34221572 | 0.53 |
ENSMUST00000040656.8
|
Bphl
|
biphenyl hydrolase-like (serine hydrolase, breast epithelial mucin-associated antigen) |
| chr1_-_72251466 | 0.53 |
ENSMUST00000048860.9
|
Mreg
|
melanoregulin |
| chr2_-_38534099 | 0.52 |
ENSMUST00000028083.6
|
Psmb7
|
proteasome (prosome, macropain) subunit, beta type 7 |
| chr7_-_44778050 | 0.52 |
ENSMUST00000209711.2
ENSMUST00000211037.2 ENSMUST00000209927.2 ENSMUST00000209815.2 ENSMUST00000210918.2 ENSMUST00000150350.9 |
Rpl13a
|
ribosomal protein L13A |
| chr5_-_117425648 | 0.52 |
ENSMUST00000111973.8
ENSMUST00000036951.13 |
Pebp1
|
phosphatidylethanolamine binding protein 1 |
| chr11_-_74614654 | 0.52 |
ENSMUST00000102520.9
|
Pafah1b1
|
platelet-activating factor acetylhydrolase, isoform 1b, subunit 1 |
| chr16_-_84632439 | 0.52 |
ENSMUST00000138279.2
|
Atp5j
|
ATP synthase, H+ transporting, mitochondrial F0 complex, subunit F |
| chr7_-_19432308 | 0.52 |
ENSMUST00000173739.8
|
Apoe
|
apolipoprotein E |
| chr19_-_4175837 | 0.52 |
ENSMUST00000121402.2
ENSMUST00000117831.8 |
Aip
|
aryl-hydrocarbon receptor-interacting protein |
| chr16_-_91723870 | 0.52 |
ENSMUST00000159295.8
|
Atp5o
|
ATP synthase, H+ transporting, mitochondrial F1 complex, O subunit |
| chr5_-_41865477 | 0.52 |
ENSMUST00000031011.12
ENSMUST00000202913.2 |
Rab28
|
RAB28, member RAS oncogene family |
| chr6_+_116528102 | 0.52 |
ENSMUST00000122096.3
|
Eif4a3l2
|
eukaryotic translation initiation factor 4A3 like 2 |
| chr16_+_20470402 | 0.52 |
ENSMUST00000007212.9
ENSMUST00000232629.2 |
Psmd2
|
proteasome (prosome, macropain) 26S subunit, non-ATPase, 2 |
| chr7_-_16651107 | 0.52 |
ENSMUST00000173139.2
|
Calm3
|
calmodulin 3 |
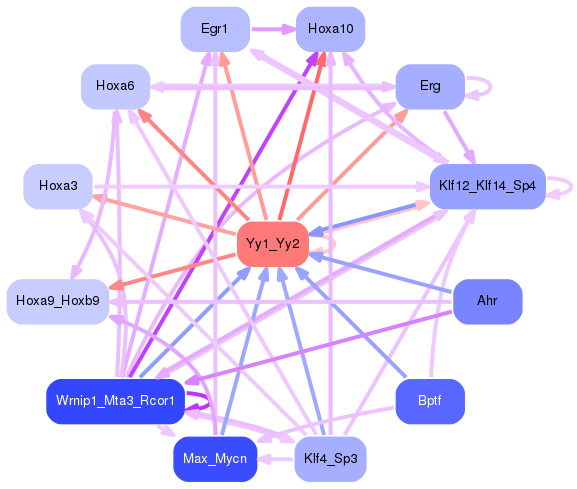
Network of associatons between targets according to the STRING database.

First level regulatory network of Yy1_Yy2
Gene Ontology Analysis
Gene overrepresentation in biological process category:
| Log-likelihood per target | Total log-likelihood | Term | Description |
|---|---|---|---|
| 0.4 | 1.3 | GO:0006419 | alanyl-tRNA aminoacylation(GO:0006419) |
| 0.4 | 1.6 | GO:0017126 | nucleologenesis(GO:0017126) |
| 0.4 | 0.7 | GO:0046101 | hypoxanthine metabolic process(GO:0046100) hypoxanthine biosynthetic process(GO:0046101) |
| 0.4 | 1.4 | GO:0071544 | diphosphoinositol polyphosphate catabolic process(GO:0071544) |
| 0.4 | 1.8 | GO:0010877 | lipid transport involved in lipid storage(GO:0010877) |
| 0.4 | 1.4 | GO:0071586 | CAAX-box protein processing(GO:0071586) CAAX-box protein maturation(GO:0080120) |
| 0.3 | 1.0 | GO:0046122 | purine deoxyribonucleoside metabolic process(GO:0046122) |
| 0.3 | 1.0 | GO:1904924 | negative regulation of mitophagy in response to mitochondrial depolarization(GO:1904924) |
| 0.3 | 1.7 | GO:0031509 | telomeric heterochromatin assembly(GO:0031509) negative regulation of chromosome condensation(GO:1902340) |
| 0.3 | 0.3 | GO:1902626 | assembly of large subunit precursor of preribosome(GO:1902626) |
| 0.3 | 0.9 | GO:0043686 | co-translational protein modification(GO:0043686) |
| 0.3 | 0.9 | GO:1990117 | release of matrix enzymes from mitochondria(GO:0032976) B cell receptor apoptotic signaling pathway(GO:1990117) |
| 0.3 | 1.2 | GO:0031204 | posttranslational protein targeting to membrane, translocation(GO:0031204) |
| 0.3 | 0.9 | GO:0006427 | histidyl-tRNA aminoacylation(GO:0006427) |
| 0.3 | 0.8 | GO:0044240 | multicellular organism lipid catabolic process(GO:0044240) |
| 0.3 | 1.4 | GO:0006432 | phenylalanyl-tRNA aminoacylation(GO:0006432) |
| 0.3 | 1.6 | GO:0042776 | mitochondrial ATP synthesis coupled proton transport(GO:0042776) |
| 0.3 | 0.8 | GO:0000451 | rRNA 2'-O-methylation(GO:0000451) |
| 0.3 | 1.3 | GO:0046952 | ketone body catabolic process(GO:0046952) |
| 0.3 | 0.8 | GO:1990428 | miRNA transport(GO:1990428) |
| 0.3 | 0.8 | GO:0046203 | spermidine catabolic process(GO:0046203) |
| 0.3 | 0.8 | GO:0006233 | dTDP biosynthetic process(GO:0006233) dTDP metabolic process(GO:0046072) |
| 0.3 | 1.0 | GO:0051344 | negative regulation of cyclic-nucleotide phosphodiesterase activity(GO:0051344) |
| 0.3 | 1.3 | GO:0010796 | regulation of multivesicular body size(GO:0010796) |
| 0.2 | 0.7 | GO:0030472 | mitotic spindle organization in nucleus(GO:0030472) |
| 0.2 | 0.9 | GO:0070625 | zymogen granule exocytosis(GO:0070625) |
| 0.2 | 1.1 | GO:0071038 | exonucleolytic trimming involved in rRNA processing(GO:0000459) exonucleolytic trimming to generate mature 3'-end of 5.8S rRNA from tricistronic rRNA transcript (SSU-rRNA, 5.8S rRNA, LSU-rRNA)(GO:0000467) nuclear polyadenylation-dependent tRNA catabolic process(GO:0071038) |
| 0.2 | 1.8 | GO:0090666 | scaRNA localization to Cajal body(GO:0090666) |
| 0.2 | 0.7 | GO:0002014 | vasoconstriction of artery involved in ischemic response to lowering of systemic arterial blood pressure(GO:0002014) |
| 0.2 | 1.1 | GO:0006421 | asparaginyl-tRNA aminoacylation(GO:0006421) |
| 0.2 | 0.7 | GO:0045212 | neurotransmitter receptor biosynthetic process(GO:0045212) |
| 0.2 | 0.9 | GO:0000957 | mitochondrial RNA catabolic process(GO:0000957) regulation of mitochondrial RNA catabolic process(GO:0000960) |
| 0.2 | 1.1 | GO:1902775 | mitochondrial large ribosomal subunit assembly(GO:1902775) |
| 0.2 | 1.5 | GO:0045900 | negative regulation of translational elongation(GO:0045900) |
| 0.2 | 0.6 | GO:0002396 | MHC protein complex assembly(GO:0002396) peptide antigen assembly with MHC protein complex(GO:0002501) |
| 0.2 | 0.6 | GO:0018312 | peptidyl-serine ADP-ribosylation(GO:0018312) |
| 0.2 | 1.7 | GO:0031536 | positive regulation of exit from mitosis(GO:0031536) |
| 0.2 | 4.0 | GO:0000338 | protein deneddylation(GO:0000338) |
| 0.2 | 0.6 | GO:1901873 | regulation of post-translational protein modification(GO:1901873) negative regulation of post-translational protein modification(GO:1901874) |
| 0.2 | 6.6 | GO:0000027 | ribosomal large subunit assembly(GO:0000027) |
| 0.2 | 4.9 | GO:0000028 | ribosomal small subunit assembly(GO:0000028) |
| 0.2 | 0.6 | GO:0006428 | isoleucyl-tRNA aminoacylation(GO:0006428) |
| 0.2 | 0.8 | GO:0000415 | negative regulation of histone H3-K36 methylation(GO:0000415) |
| 0.2 | 0.6 | GO:0006850 | mitochondrial pyruvate transport(GO:0006850) mitochondrial pyruvate transmembrane transport(GO:1902361) |
| 0.2 | 2.6 | GO:0006228 | UTP biosynthetic process(GO:0006228) |
| 0.2 | 0.8 | GO:0046951 | ketone body biosynthetic process(GO:0046951) |
| 0.2 | 0.6 | GO:0036090 | cleavage furrow ingression(GO:0036090) |
| 0.2 | 1.0 | GO:0002485 | antigen processing and presentation of endogenous peptide antigen via MHC class I via ER pathway(GO:0002484) antigen processing and presentation of endogenous peptide antigen via MHC class I via ER pathway, TAP-dependent(GO:0002485) |
| 0.2 | 1.0 | GO:1904171 | negative regulation of bleb assembly(GO:1904171) |
| 0.2 | 0.6 | GO:1902071 | regulation of hypoxia-inducible factor-1alpha signaling pathway(GO:1902071) |
| 0.2 | 0.2 | GO:0009173 | UMP biosynthetic process(GO:0006222) pyrimidine ribonucleoside monophosphate metabolic process(GO:0009173) pyrimidine ribonucleoside monophosphate biosynthetic process(GO:0009174) UMP metabolic process(GO:0046049) |
| 0.2 | 0.2 | GO:0002759 | regulation of antimicrobial humoral response(GO:0002759) |
| 0.2 | 0.9 | GO:1990564 | protein polyufmylation(GO:1990564) protein K69-linked ufmylation(GO:1990592) |
| 0.2 | 0.6 | GO:1904793 | regulation of chromatin-mediated maintenance of transcription(GO:1904499) positive regulation of chromatin-mediated maintenance of transcription(GO:1904501) regulation of euchromatin binding(GO:1904793) |
| 0.2 | 3.2 | GO:0001731 | formation of translation preinitiation complex(GO:0001731) |
| 0.2 | 0.5 | GO:1903233 | regulation of calcium ion-dependent exocytosis of neurotransmitter(GO:1903233) |
| 0.2 | 0.9 | GO:0036324 | vascular endothelial growth factor receptor-2 signaling pathway(GO:0036324) |
| 0.2 | 1.1 | GO:2000680 | regulation of rubidium ion transport(GO:2000680) |
| 0.2 | 0.5 | GO:0061290 | cell-cell signaling involved in kidney development(GO:0060995) Wnt signaling pathway involved in kidney development(GO:0061289) canonical Wnt signaling pathway involved in metanephric kidney development(GO:0061290) cell-cell signaling involved in metanephros development(GO:0072204) |
| 0.2 | 0.4 | GO:0046967 | cytosol to ER transport(GO:0046967) |
| 0.2 | 0.5 | GO:0008291 | acetylcholine metabolic process(GO:0008291) acetate ester metabolic process(GO:1900619) |
| 0.2 | 0.5 | GO:0016561 | protein import into peroxisome matrix, translocation(GO:0016561) |
| 0.2 | 0.7 | GO:1903976 | negative regulation of glial cell migration(GO:1903976) |
| 0.2 | 0.7 | GO:1903070 | negative regulation of ER-associated ubiquitin-dependent protein catabolic process(GO:1903070) |
| 0.2 | 0.7 | GO:0006450 | regulation of translational fidelity(GO:0006450) |
| 0.2 | 0.3 | GO:1900126 | negative regulation of hyaluronan biosynthetic process(GO:1900126) |
| 0.2 | 0.7 | GO:1902774 | late endosome to lysosome transport(GO:1902774) |
| 0.2 | 0.5 | GO:0036363 | transforming growth factor beta activation(GO:0036363) regulation of complement-dependent cytotoxicity(GO:1903659) negative regulation of complement-dependent cytotoxicity(GO:1903660) |
| 0.2 | 0.2 | GO:0090503 | RNA phosphodiester bond hydrolysis, exonucleolytic(GO:0090503) |
| 0.2 | 0.8 | GO:0009153 | purine deoxyribonucleotide biosynthetic process(GO:0009153) |
| 0.2 | 0.7 | GO:0060785 | regulation of apoptosis involved in tissue homeostasis(GO:0060785) |
| 0.2 | 1.3 | GO:0051771 | negative regulation of nitric-oxide synthase biosynthetic process(GO:0051771) |
| 0.2 | 0.8 | GO:0007023 | post-chaperonin tubulin folding pathway(GO:0007023) |
| 0.2 | 1.1 | GO:0042373 | vitamin K metabolic process(GO:0042373) |
| 0.2 | 1.9 | GO:0006122 | mitochondrial electron transport, ubiquinol to cytochrome c(GO:0006122) |
| 0.2 | 1.0 | GO:0051661 | maintenance of centrosome location(GO:0051661) |
| 0.2 | 0.3 | GO:0006550 | isoleucine catabolic process(GO:0006550) |
| 0.2 | 0.2 | GO:0021691 | cerebellar Purkinje cell layer maturation(GO:0021691) |
| 0.2 | 0.8 | GO:0006566 | threonine metabolic process(GO:0006566) |
| 0.2 | 0.3 | GO:1902445 | regulation of mitochondrial membrane permeability involved in programmed necrotic cell death(GO:1902445) |
| 0.2 | 1.1 | GO:0016259 | selenocysteine metabolic process(GO:0016259) |
| 0.2 | 1.1 | GO:0051697 | protein delipidation(GO:0051697) |
| 0.2 | 0.6 | GO:1902269 | positive regulation of polyamine transmembrane transport(GO:1902269) |
| 0.2 | 1.4 | GO:0000056 | ribosomal small subunit export from nucleus(GO:0000056) |
| 0.2 | 0.3 | GO:0048936 | peripheral nervous system neuron axonogenesis(GO:0048936) |
| 0.1 | 1.0 | GO:0045716 | positive regulation of low-density lipoprotein particle receptor biosynthetic process(GO:0045716) |
| 0.1 | 0.7 | GO:2001270 | regulation of cysteine-type endopeptidase activity involved in execution phase of apoptosis(GO:2001270) |
| 0.1 | 0.3 | GO:1901856 | negative regulation of cellular respiration(GO:1901856) |
| 0.1 | 0.6 | GO:0070125 | mitochondrial translational elongation(GO:0070125) |
| 0.1 | 0.4 | GO:0006021 | inositol biosynthetic process(GO:0006021) |
| 0.1 | 7.0 | GO:0097031 | NADH dehydrogenase complex assembly(GO:0010257) mitochondrial respiratory chain complex I assembly(GO:0032981) mitochondrial respiratory chain complex I biogenesis(GO:0097031) |
| 0.1 | 0.4 | GO:0070682 | proteasome regulatory particle assembly(GO:0070682) |
| 0.1 | 0.4 | GO:0032474 | otolith morphogenesis(GO:0032474) |
| 0.1 | 1.0 | GO:0036353 | histone H2A-K119 monoubiquitination(GO:0036353) |
| 0.1 | 0.3 | GO:0061623 | glycolytic process from galactose(GO:0061623) |
| 0.1 | 0.4 | GO:0046121 | deoxyribonucleoside catabolic process(GO:0046121) |
| 0.1 | 0.4 | GO:0097535 | lymphoid lineage cell migration(GO:0097534) lymphoid lineage cell migration into thymus(GO:0097535) |
| 0.1 | 0.4 | GO:0006597 | spermine biosynthetic process(GO:0006597) |
| 0.1 | 0.4 | GO:0071611 | macrophage colony-stimulating factor production(GO:0036301) granulocyte colony-stimulating factor production(GO:0071611) regulation of granulocyte colony-stimulating factor production(GO:0071655) regulation of macrophage colony-stimulating factor production(GO:1901256) |
| 0.1 | 0.5 | GO:0045897 | regulation of transcription during mitosis(GO:0045896) positive regulation of transcription during mitosis(GO:0045897) |
| 0.1 | 0.4 | GO:0016062 | adaptation of rhodopsin mediated signaling(GO:0016062) light adaption(GO:0036367) |
| 0.1 | 2.2 | GO:0009312 | oligosaccharide biosynthetic process(GO:0009312) |
| 0.1 | 0.4 | GO:0090285 | negative regulation of protein glycosylation in Golgi(GO:0090285) |
| 0.1 | 0.7 | GO:0019919 | peptidyl-arginine methylation, to asymmetrical-dimethyl arginine(GO:0019919) |
| 0.1 | 0.5 | GO:0019287 | isopentenyl diphosphate biosynthetic process, mevalonate pathway(GO:0019287) |
| 0.1 | 2.2 | GO:0006613 | cotranslational protein targeting to membrane(GO:0006613) |
| 0.1 | 0.5 | GO:0035964 | COPI-coated vesicle budding(GO:0035964) |
| 0.1 | 0.4 | GO:0046166 | alditol catabolic process(GO:0019405) glyceraldehyde-3-phosphate biosynthetic process(GO:0046166) |
| 0.1 | 0.4 | GO:0090063 | positive regulation of microtubule nucleation(GO:0090063) |
| 0.1 | 0.4 | GO:0046294 | formaldehyde catabolic process(GO:0046294) |
| 0.1 | 0.4 | GO:0042262 | DNA protection(GO:0042262) |
| 0.1 | 0.5 | GO:0035425 | autocrine signaling(GO:0035425) |
| 0.1 | 0.8 | GO:0002084 | protein depalmitoylation(GO:0002084) macromolecule depalmitoylation(GO:0098734) |
| 0.1 | 0.7 | GO:0034975 | protein folding in endoplasmic reticulum(GO:0034975) |
| 0.1 | 0.1 | GO:0000448 | cleavage in ITS2 between 5.8S rRNA and LSU-rRNA of tricistronic rRNA transcript (SSU-rRNA, 5.8S rRNA, LSU-rRNA)(GO:0000448) |
| 0.1 | 0.5 | GO:0051182 | coenzyme transport(GO:0051182) |
| 0.1 | 1.6 | GO:0043248 | proteasome assembly(GO:0043248) |
| 0.1 | 2.3 | GO:0006465 | signal peptide processing(GO:0006465) |
| 0.1 | 0.5 | GO:0021993 | initiation of neural tube closure(GO:0021993) |
| 0.1 | 1.7 | GO:0007008 | outer mitochondrial membrane organization(GO:0007008) |
| 0.1 | 0.2 | GO:0008612 | peptidyl-lysine modification to peptidyl-hypusine(GO:0008612) |
| 0.1 | 0.8 | GO:0075525 | viral translational termination-reinitiation(GO:0075525) |
| 0.1 | 1.3 | GO:0006335 | DNA replication-dependent nucleosome assembly(GO:0006335) DNA replication-dependent nucleosome organization(GO:0034723) |
| 0.1 | 0.7 | GO:0043137 | DNA replication, removal of RNA primer(GO:0043137) |
| 0.1 | 2.6 | GO:1901663 | ubiquinone biosynthetic process(GO:0006744) quinone biosynthetic process(GO:1901663) |
| 0.1 | 0.4 | GO:0042222 | interleukin-1 biosynthetic process(GO:0042222) |
| 0.1 | 0.3 | GO:0042450 | arginine biosynthetic process via ornithine(GO:0042450) |
| 0.1 | 0.3 | GO:0042275 | error-free postreplication DNA repair(GO:0042275) |
| 0.1 | 0.2 | GO:0006435 | threonyl-tRNA aminoacylation(GO:0006435) |
| 0.1 | 0.5 | GO:1904009 | response to monosodium glutamate(GO:1904008) cellular response to monosodium glutamate(GO:1904009) |
| 0.1 | 0.5 | GO:0006627 | protein processing involved in protein targeting to mitochondrion(GO:0006627) |
| 0.1 | 0.6 | GO:0046946 | hydroxylysine metabolic process(GO:0046946) hydroxylysine biosynthetic process(GO:0046947) |
| 0.1 | 1.4 | GO:0030150 | protein import into mitochondrial matrix(GO:0030150) |
| 0.1 | 0.5 | GO:0002433 | immune response-regulating cell surface receptor signaling pathway involved in phagocytosis(GO:0002433) Fc-gamma receptor signaling pathway involved in phagocytosis(GO:0038096) |
| 0.1 | 0.2 | GO:0061198 | fungiform papilla formation(GO:0061198) |
| 0.1 | 0.6 | GO:0006167 | AMP biosynthetic process(GO:0006167) |
| 0.1 | 0.2 | GO:0043418 | homocysteine catabolic process(GO:0043418) |
| 0.1 | 0.6 | GO:0043321 | regulation of natural killer cell degranulation(GO:0043321) |
| 0.1 | 0.3 | GO:0002940 | tRNA N2-guanine methylation(GO:0002940) |
| 0.1 | 0.3 | GO:0015904 | tetracycline transport(GO:0015904) |
| 0.1 | 0.7 | GO:0002159 | desmosome assembly(GO:0002159) |
| 0.1 | 0.7 | GO:0009235 | cobalamin metabolic process(GO:0009235) |
| 0.1 | 0.3 | GO:0018171 | peptidyl-cysteine oxidation(GO:0018171) |
| 0.1 | 0.4 | GO:0000480 | endonucleolytic cleavage in 5'-ETS of tricistronic rRNA transcript (SSU-rRNA, 5.8S rRNA, LSU-rRNA)(GO:0000480) |
| 0.1 | 0.3 | GO:0010968 | regulation of microtubule nucleation(GO:0010968) |
| 0.1 | 0.2 | GO:0051342 | regulation of cyclic-nucleotide phosphodiesterase activity(GO:0051342) |
| 0.1 | 0.3 | GO:0018243 | protein O-linked glycosylation via threonine(GO:0018243) |
| 0.1 | 0.4 | GO:0017055 | negative regulation of RNA polymerase II transcriptional preinitiation complex assembly(GO:0017055) |
| 0.1 | 0.1 | GO:0051036 | regulation of endosome size(GO:0051036) |
| 0.1 | 1.1 | GO:0019087 | transformation of host cell by virus(GO:0019087) |
| 0.1 | 1.0 | GO:0032056 | positive regulation of translation in response to stress(GO:0032056) |
| 0.1 | 0.3 | GO:0006097 | glyoxylate cycle(GO:0006097) |
| 0.1 | 0.5 | GO:0048014 | negative regulation of cytokine secretion involved in immune response(GO:0002740) Tie signaling pathway(GO:0048014) |
| 0.1 | 0.6 | GO:0006663 | platelet activating factor biosynthetic process(GO:0006663) |
| 0.1 | 0.1 | GO:0016078 | tRNA catabolic process(GO:0016078) |
| 0.1 | 0.4 | GO:1904247 | positive regulation of polynucleotide adenylyltransferase activity(GO:1904247) |
| 0.1 | 0.3 | GO:0097029 | mature conventional dendritic cell differentiation(GO:0097029) |
| 0.1 | 0.4 | GO:0019509 | L-methionine biosynthetic process from methylthioadenosine(GO:0019509) |
| 0.1 | 0.3 | GO:0031508 | pericentric heterochromatin assembly(GO:0031508) |
| 0.1 | 0.1 | GO:0044860 | protein localization to plasma membrane raft(GO:0044860) |
| 0.1 | 0.6 | GO:0070213 | protein auto-ADP-ribosylation(GO:0070213) |
| 0.1 | 0.7 | GO:0006621 | protein retention in ER lumen(GO:0006621) |
| 0.1 | 0.6 | GO:0099525 | presynaptic dense core granule exocytosis(GO:0099525) |
| 0.1 | 1.5 | GO:0035092 | sperm chromatin condensation(GO:0035092) |
| 0.1 | 0.3 | GO:0046087 | cytidine catabolic process(GO:0006216) cytidine deamination(GO:0009972) cytidine metabolic process(GO:0046087) |
| 0.1 | 0.3 | GO:0042977 | regulation of activation of JAK2 kinase activity(GO:0010534) activation of JAK2 kinase activity(GO:0042977) negative regulation of activation of JAK2 kinase activity(GO:1902569) |
| 0.1 | 0.3 | GO:2000587 | negative regulation of platelet-derived growth factor receptor-beta signaling pathway(GO:2000587) |
| 0.1 | 0.7 | GO:0032377 | regulation of intracellular lipid transport(GO:0032377) regulation of intracellular sterol transport(GO:0032380) regulation of intracellular cholesterol transport(GO:0032383) |
| 0.1 | 0.5 | GO:0046909 | intermembrane transport(GO:0046909) protein transport from ciliary membrane to plasma membrane(GO:1903445) |
| 0.1 | 0.5 | GO:0019074 | viral genome packaging(GO:0019072) viral RNA genome packaging(GO:0019074) |
| 0.1 | 0.7 | GO:0035542 | regulation of SNARE complex assembly(GO:0035542) |
| 0.1 | 0.9 | GO:0071231 | neural crest cell migration involved in heart formation(GO:0003147) anterior neural tube closure(GO:0061713) cellular response to folic acid(GO:0071231) |
| 0.1 | 0.4 | GO:0042125 | protein glycosylation at cell surface(GO:0033575) protein galactosylation at cell surface(GO:0033580) protein galactosylation(GO:0042125) |
| 0.1 | 0.4 | GO:0034982 | mitochondrial protein processing(GO:0034982) |
| 0.1 | 1.2 | GO:0006120 | mitochondrial electron transport, NADH to ubiquinone(GO:0006120) |
| 0.1 | 0.2 | GO:0006059 | hexitol metabolic process(GO:0006059) |
| 0.1 | 0.7 | GO:2000767 | positive regulation of cytoplasmic translation(GO:2000767) |
| 0.1 | 0.3 | GO:0009955 | adaxial/abaxial pattern specification(GO:0009955) regulation of adaxial/abaxial pattern formation(GO:2000011) |
| 0.1 | 0.6 | GO:0060011 | Sertoli cell proliferation(GO:0060011) |
| 0.1 | 0.9 | GO:0006030 | chitin metabolic process(GO:0006030) chitin catabolic process(GO:0006032) |
| 0.1 | 1.4 | GO:1902902 | negative regulation of autophagosome assembly(GO:1902902) |
| 0.1 | 0.3 | GO:0071550 | death-inducing signaling complex assembly(GO:0071550) |
| 0.1 | 0.3 | GO:0006546 | glycine catabolic process(GO:0006546) glycine decarboxylation via glycine cleavage system(GO:0019464) |
| 0.1 | 0.4 | GO:0002408 | myeloid dendritic cell chemotaxis(GO:0002408) |
| 0.1 | 1.8 | GO:0045899 | positive regulation of RNA polymerase II transcriptional preinitiation complex assembly(GO:0045899) |
| 0.1 | 1.1 | GO:0006268 | DNA unwinding involved in DNA replication(GO:0006268) |
| 0.1 | 0.6 | GO:0060336 | negative regulation of response to interferon-gamma(GO:0060331) negative regulation of interferon-gamma-mediated signaling pathway(GO:0060336) |
| 0.1 | 0.4 | GO:0021586 | pons maturation(GO:0021586) |
| 0.1 | 0.2 | GO:0019918 | peptidyl-arginine methylation, to symmetrical-dimethyl arginine(GO:0019918) |
| 0.1 | 0.6 | GO:0061732 | mitochondrial acetyl-CoA biosynthetic process from pyruvate(GO:0061732) |
| 0.1 | 0.4 | GO:0060729 | intestinal epithelial structure maintenance(GO:0060729) |
| 0.1 | 2.6 | GO:0015985 | energy coupled proton transport, down electrochemical gradient(GO:0015985) ATP synthesis coupled proton transport(GO:0015986) |
| 0.1 | 0.6 | GO:0034214 | protein hexamerization(GO:0034214) |
| 0.1 | 1.1 | GO:0052696 | flavonoid glucuronidation(GO:0052696) xenobiotic glucuronidation(GO:0052697) |
| 0.1 | 0.3 | GO:0000715 | nucleotide-excision repair, DNA damage recognition(GO:0000715) |
| 0.1 | 0.4 | GO:1902396 | protein localization to bicellular tight junction(GO:1902396) |
| 0.1 | 0.2 | GO:0046104 | thymidine metabolic process(GO:0046104) |
| 0.1 | 0.6 | GO:0030300 | regulation of intestinal cholesterol absorption(GO:0030300) |
| 0.1 | 0.7 | GO:1905146 | lysosomal protein catabolic process(GO:1905146) |
| 0.1 | 0.2 | GO:0006610 | ribosomal protein import into nucleus(GO:0006610) |
| 0.1 | 0.4 | GO:0006481 | C-terminal protein methylation(GO:0006481) |
| 0.1 | 0.3 | GO:0097052 | L-kynurenine metabolic process(GO:0097052) |
| 0.1 | 0.4 | GO:1901421 | positive regulation of response to alcohol(GO:1901421) |
| 0.1 | 0.3 | GO:0090673 | endothelial cell-matrix adhesion(GO:0090673) |
| 0.1 | 0.3 | GO:1901837 | negative regulation of transcription of nuclear large rRNA transcript from RNA polymerase I promoter(GO:1901837) |
| 0.1 | 0.5 | GO:0018242 | protein O-linked glycosylation via serine(GO:0018242) |
| 0.1 | 0.6 | GO:0012502 | induction of programmed cell death(GO:0012502) positive regulation of apoptotic process in other organism(GO:0044533) positive regulation by symbiont of host programmed cell death(GO:0052042) positive regulation by organism of programmed cell death in other organism involved in symbiotic interaction(GO:0052330) positive regulation by organism of apoptotic process in other organism involved in symbiotic interaction(GO:0052501) |
| 0.1 | 0.3 | GO:0002143 | tRNA wobble position uridine thiolation(GO:0002143) |
| 0.1 | 0.6 | GO:0035726 | common myeloid progenitor cell proliferation(GO:0035726) |
| 0.1 | 0.3 | GO:0043988 | histone H3-S28 phosphorylation(GO:0043988) |
| 0.1 | 0.3 | GO:0002276 | basophil activation involved in immune response(GO:0002276) |
| 0.1 | 1.2 | GO:0006388 | tRNA splicing, via endonucleolytic cleavage and ligation(GO:0006388) |
| 0.1 | 0.6 | GO:0043097 | pyrimidine-containing compound salvage(GO:0008655) pyrimidine nucleoside salvage(GO:0043097) |
| 0.1 | 0.5 | GO:1990481 | mRNA pseudouridine synthesis(GO:1990481) |
| 0.1 | 0.3 | GO:1900222 | negative regulation of beta-amyloid clearance(GO:1900222) |
| 0.1 | 0.4 | GO:0090151 | establishment of protein localization to mitochondrial membrane(GO:0090151) |
| 0.1 | 0.3 | GO:0006391 | transcription initiation from mitochondrial promoter(GO:0006391) |
| 0.1 | 0.3 | GO:0010286 | heat acclimation(GO:0010286) |
| 0.1 | 0.5 | GO:0006287 | base-excision repair, gap-filling(GO:0006287) |
| 0.1 | 0.8 | GO:0007144 | female meiosis I(GO:0007144) |
| 0.1 | 0.3 | GO:0006624 | vacuolar protein processing(GO:0006624) |
| 0.1 | 0.5 | GO:0035063 | nuclear speck organization(GO:0035063) |
| 0.1 | 0.3 | GO:0009257 | 10-formyltetrahydrofolate biosynthetic process(GO:0009257) |
| 0.1 | 1.1 | GO:0070863 | positive regulation of protein exit from endoplasmic reticulum(GO:0070863) |
| 0.1 | 5.0 | GO:0032543 | mitochondrial translation(GO:0032543) |
| 0.1 | 0.6 | GO:0031119 | tRNA pseudouridine synthesis(GO:0031119) |
| 0.1 | 0.3 | GO:1903279 | regulation of calcium:sodium antiporter activity(GO:1903279) |
| 0.1 | 0.1 | GO:0097325 | melanocyte proliferation(GO:0097325) |
| 0.1 | 0.4 | GO:1902163 | negative regulation of DNA damage response, signal transduction by p53 class mediator resulting in transcription of p21 class mediator(GO:1902163) |
| 0.1 | 0.4 | GO:0090034 | regulation of chaperone-mediated protein complex assembly(GO:0090034) positive regulation of chaperone-mediated protein complex assembly(GO:0090035) |
| 0.1 | 0.5 | GO:0048207 | vesicle coating(GO:0006901) vesicle targeting, rough ER to cis-Golgi(GO:0048207) COPII vesicle coating(GO:0048208) |
| 0.1 | 0.5 | GO:0035022 | positive regulation of Rac protein signal transduction(GO:0035022) |
| 0.1 | 0.2 | GO:1902177 | positive regulation of oxidative stress-induced intrinsic apoptotic signaling pathway(GO:1902177) |
| 0.1 | 0.3 | GO:0000479 | endonucleolytic cleavage of tricistronic rRNA transcript (SSU-rRNA, 5.8S rRNA, LSU-rRNA)(GO:0000479) |
| 0.1 | 0.4 | GO:0010636 | positive regulation of mitochondrial fusion(GO:0010636) |
| 0.1 | 0.4 | GO:1903361 | protein localization to basolateral plasma membrane(GO:1903361) |
| 0.1 | 0.6 | GO:0010936 | negative regulation of macrophage cytokine production(GO:0010936) |
| 0.1 | 0.2 | GO:0046462 | monoacylglycerol metabolic process(GO:0046462) |
| 0.1 | 0.6 | GO:0070447 | positive regulation of oligodendrocyte progenitor proliferation(GO:0070447) |
| 0.1 | 0.2 | GO:0060448 | dichotomous subdivision of terminal units involved in lung branching(GO:0060448) |
| 0.1 | 0.6 | GO:0042985 | negative regulation of amyloid precursor protein biosynthetic process(GO:0042985) |
| 0.1 | 0.2 | GO:0000320 | re-entry into mitotic cell cycle(GO:0000320) |
| 0.1 | 0.2 | GO:0043096 | adenine salvage(GO:0006168) purine nucleobase salvage(GO:0043096) adenine metabolic process(GO:0046083) adenine biosynthetic process(GO:0046084) |
| 0.1 | 0.3 | GO:0034436 | glycoprotein transport(GO:0034436) |
| 0.1 | 0.2 | GO:0006285 | base-excision repair, AP site formation(GO:0006285) |
| 0.1 | 0.8 | GO:0042866 | pyruvate biosynthetic process(GO:0042866) |
| 0.1 | 0.7 | GO:0034244 | negative regulation of transcription elongation from RNA polymerase II promoter(GO:0034244) |
| 0.1 | 1.2 | GO:0006851 | mitochondrial calcium ion transport(GO:0006851) |
| 0.1 | 0.5 | GO:1902416 | positive regulation of mRNA binding(GO:1902416) |
| 0.1 | 0.3 | GO:1904451 | regulation of hydrogen:potassium-exchanging ATPase activity(GO:1904451) positive regulation of hydrogen:potassium-exchanging ATPase activity(GO:1904453) |
| 0.1 | 0.5 | GO:0003065 | positive regulation of heart rate by epinephrine(GO:0003065) |
| 0.1 | 0.2 | GO:0046226 | coumarin catabolic process(GO:0046226) |
| 0.1 | 0.3 | GO:1901228 | positive regulation of transcription from RNA polymerase II promoter involved in heart development(GO:1901228) |
| 0.1 | 0.2 | GO:0033128 | positive regulation of reciprocal meiotic recombination(GO:0010845) negative regulation of histone phosphorylation(GO:0033128) |
| 0.1 | 0.1 | GO:0097278 | complement-dependent cytotoxicity(GO:0097278) |
| 0.1 | 0.1 | GO:0070900 | mitochondrial tRNA modification(GO:0070900) mitochondrial RNA modification(GO:1900864) |
| 0.1 | 0.5 | GO:1903265 | positive regulation of tumor necrosis factor-mediated signaling pathway(GO:1903265) |
| 0.1 | 0.5 | GO:0044789 | modulation by host of viral release from host cell(GO:0044789) positive regulation by host of viral release from host cell(GO:0044791) |
| 0.1 | 0.7 | GO:0006004 | fucose metabolic process(GO:0006004) |
| 0.1 | 0.2 | GO:0042256 | mature ribosome assembly(GO:0042256) |
| 0.1 | 0.9 | GO:0032780 | negative regulation of ATPase activity(GO:0032780) |
| 0.1 | 0.4 | GO:1903964 | monounsaturated fatty acid metabolic process(GO:1903964) monounsaturated fatty acid biosynthetic process(GO:1903966) |
| 0.1 | 0.4 | GO:0070837 | dehydroascorbic acid transport(GO:0070837) |
| 0.1 | 0.2 | GO:0006743 | ubiquinone metabolic process(GO:0006743) |
| 0.1 | 1.3 | GO:0046498 | S-adenosylhomocysteine metabolic process(GO:0046498) |
| 0.1 | 0.3 | GO:0002071 | glandular epithelial cell maturation(GO:0002071) |
| 0.1 | 0.4 | GO:0003199 | endocardial cushion to mesenchymal transition involved in heart valve formation(GO:0003199) |
| 0.1 | 0.1 | GO:2000412 | positive regulation of thymocyte migration(GO:2000412) |
| 0.1 | 0.1 | GO:0098763 | mitotic cell cycle phase(GO:0098763) |
| 0.1 | 0.5 | GO:1903333 | negative regulation of protein refolding(GO:0061084) negative regulation of protein folding(GO:1903333) |
| 0.1 | 0.2 | GO:0033306 | phytol metabolic process(GO:0033306) fatty alcohol metabolic process(GO:1903173) |
| 0.1 | 0.2 | GO:1905168 | positive regulation of double-strand break repair via homologous recombination(GO:1905168) |
| 0.1 | 0.4 | GO:0071484 | cellular response to light intensity(GO:0071484) cellular response to high light intensity(GO:0071486) retinal rod cell apoptotic process(GO:0097473) |
| 0.1 | 0.5 | GO:0044821 | meiotic telomere tethering at nuclear periphery(GO:0044821) meiotic attachment of telomere to nuclear envelope(GO:0070197) chromosome attachment to the nuclear envelope(GO:0097240) |
| 0.1 | 0.1 | GO:2000017 | positive regulation of determination of dorsal identity(GO:2000017) |
| 0.1 | 0.2 | GO:0060152 | peroxisome localization(GO:0060151) microtubule-based peroxisome localization(GO:0060152) |
| 0.1 | 0.2 | GO:0071393 | cellular response to progesterone stimulus(GO:0071393) |
| 0.1 | 0.6 | GO:0006689 | ganglioside catabolic process(GO:0006689) |
| 0.1 | 0.3 | GO:2001206 | positive regulation of osteoclast development(GO:2001206) |
| 0.1 | 0.4 | GO:0006880 | intracellular sequestering of iron ion(GO:0006880) sequestering of iron ion(GO:0097577) |
| 0.1 | 0.3 | GO:2000983 | regulation of ATP citrate synthase activity(GO:2000983) negative regulation of ATP citrate synthase activity(GO:2000984) |
| 0.1 | 0.1 | GO:0035928 | RNA import into mitochondrion(GO:0035927) rRNA import into mitochondrion(GO:0035928) |
| 0.1 | 0.4 | GO:0006543 | glutamine catabolic process(GO:0006543) |
| 0.1 | 0.3 | GO:0050823 | antigen processing and presentation of exogenous peptide antigen via MHC class I, TAP-dependent(GO:0002479) peptide stabilization(GO:0050822) peptide antigen stabilization(GO:0050823) |
| 0.1 | 0.1 | GO:2000409 | positive regulation of T cell extravasation(GO:2000409) |
| 0.1 | 0.1 | GO:0061300 | cerebellum vasculature development(GO:0061300) |
| 0.1 | 0.4 | GO:0030951 | establishment or maintenance of microtubule cytoskeleton polarity(GO:0030951) |
| 0.1 | 0.5 | GO:0090230 | regulation of centromere complex assembly(GO:0090230) regulation of kinetochore assembly(GO:0090234) |
| 0.1 | 0.1 | GO:0021679 | cerebellar molecular layer development(GO:0021679) |
| 0.1 | 0.4 | GO:1904424 | regulation of GTP binding(GO:1904424) |
| 0.1 | 0.4 | GO:0046826 | negative regulation of protein export from nucleus(GO:0046826) |
| 0.1 | 1.3 | GO:0021942 | radial glia guided migration of Purkinje cell(GO:0021942) |
| 0.1 | 0.1 | GO:0015966 | diadenosine polyphosphate biosynthetic process(GO:0015960) diadenosine tetraphosphate metabolic process(GO:0015965) diadenosine tetraphosphate biosynthetic process(GO:0015966) |
| 0.1 | 1.0 | GO:0043486 | histone exchange(GO:0043486) |
| 0.1 | 0.3 | GO:0060709 | glycogen cell differentiation involved in embryonic placenta development(GO:0060709) regulation of I-kappaB phosphorylation(GO:1903719) positive regulation of I-kappaB phosphorylation(GO:1903721) |
| 0.1 | 0.3 | GO:0061086 | negative regulation of histone H3-K27 methylation(GO:0061086) |
| 0.1 | 0.3 | GO:0006420 | arginyl-tRNA aminoacylation(GO:0006420) |
| 0.1 | 0.1 | GO:1902568 | positive regulation of eosinophil degranulation(GO:0043311) positive regulation of eosinophil activation(GO:1902568) |
| 0.1 | 0.1 | GO:0048822 | enucleate erythrocyte development(GO:0048822) |
| 0.1 | 0.3 | GO:0071449 | response to lipid hydroperoxide(GO:0006982) cellular response to lipid hydroperoxide(GO:0071449) |
| 0.1 | 0.1 | GO:0046710 | GDP metabolic process(GO:0046710) |
| 0.1 | 0.1 | GO:1901252 | regulation of intracellular transport of viral material(GO:1901252) |
| 0.1 | 0.5 | GO:0016255 | attachment of GPI anchor to protein(GO:0016255) |
| 0.1 | 0.3 | GO:0042335 | cuticle development(GO:0042335) |
| 0.1 | 0.6 | GO:0000463 | maturation of LSU-rRNA from tricistronic rRNA transcript (SSU-rRNA, 5.8S rRNA, LSU-rRNA)(GO:0000463) |
| 0.1 | 0.4 | GO:0018202 | peptidyl-histidine modification(GO:0018202) |
| 0.1 | 0.3 | GO:0033689 | negative regulation of osteoblast proliferation(GO:0033689) |
| 0.1 | 0.6 | GO:0032074 | negative regulation of nuclease activity(GO:0032074) |
| 0.1 | 0.1 | GO:2000813 | negative regulation of barbed-end actin filament capping(GO:2000813) |
| 0.1 | 0.4 | GO:0007021 | tubulin complex assembly(GO:0007021) |
| 0.1 | 1.4 | GO:0016226 | iron-sulfur cluster assembly(GO:0016226) metallo-sulfur cluster assembly(GO:0031163) |
| 0.1 | 3.7 | GO:0002181 | cytoplasmic translation(GO:0002181) |
| 0.1 | 0.1 | GO:0010520 | regulation of reciprocal meiotic recombination(GO:0010520) |
| 0.1 | 0.4 | GO:0032511 | late endosome to vacuole transport via multivesicular body sorting pathway(GO:0032511) |
| 0.1 | 0.6 | GO:0001682 | tRNA 5'-leader removal(GO:0001682) |
| 0.1 | 0.3 | GO:0009146 | purine nucleoside triphosphate catabolic process(GO:0009146) |
| 0.1 | 1.1 | GO:2001256 | regulation of store-operated calcium entry(GO:2001256) |
| 0.1 | 0.7 | GO:0006477 | protein sulfation(GO:0006477) |
| 0.1 | 4.5 | GO:0045454 | cell redox homeostasis(GO:0045454) |
| 0.1 | 1.4 | GO:0000920 | cell separation after cytokinesis(GO:0000920) |
| 0.1 | 0.2 | GO:0060988 | lipid tube assembly(GO:0060988) |
| 0.1 | 0.1 | GO:1900738 | positive regulation of phospholipase C-activating G-protein coupled receptor signaling pathway(GO:1900738) |
| 0.1 | 0.8 | GO:0061469 | regulation of type B pancreatic cell proliferation(GO:0061469) |
| 0.1 | 0.5 | GO:0071816 | tail-anchored membrane protein insertion into ER membrane(GO:0071816) |
| 0.1 | 0.2 | GO:0008582 | regulation of synaptic growth at neuromuscular junction(GO:0008582) |
| 0.1 | 0.5 | GO:0071802 | negative regulation of podosome assembly(GO:0071802) |
| 0.1 | 0.2 | GO:0018199 | peptidyl-glutamine modification(GO:0018199) |
| 0.1 | 0.1 | GO:1901563 | response to camptothecin(GO:1901563) |
| 0.1 | 0.4 | GO:1901070 | GMP biosynthetic process(GO:0006177) guanosine-containing compound biosynthetic process(GO:1901070) |
| 0.1 | 0.3 | GO:1900041 | negative regulation of interleukin-2 secretion(GO:1900041) |
| 0.1 | 0.1 | GO:0031591 | wybutosine metabolic process(GO:0031590) wybutosine biosynthetic process(GO:0031591) |
| 0.1 | 0.6 | GO:0006362 | transcription elongation from RNA polymerase I promoter(GO:0006362) |
| 0.1 | 0.2 | GO:0016131 | brassinosteroid metabolic process(GO:0016131) brassinosteroid biosynthetic process(GO:0016132) |
| 0.1 | 0.1 | GO:0033140 | negative regulation of peptidyl-serine phosphorylation of STAT protein(GO:0033140) |
| 0.1 | 0.7 | GO:0060050 | positive regulation of protein glycosylation(GO:0060050) |
| 0.1 | 1.2 | GO:2000001 | regulation of DNA damage checkpoint(GO:2000001) |
| 0.1 | 0.6 | GO:0021563 | glossopharyngeal nerve development(GO:0021563) |
| 0.1 | 0.2 | GO:0090191 | negative regulation of branching involved in ureteric bud morphogenesis(GO:0090191) |
| 0.1 | 0.2 | GO:0001180 | transcription initiation from RNA polymerase I promoter for nuclear large rRNA transcript(GO:0001180) |
| 0.1 | 0.6 | GO:0051045 | negative regulation of membrane protein ectodomain proteolysis(GO:0051045) |
| 0.1 | 0.5 | GO:0009311 | oligosaccharide metabolic process(GO:0009311) |
| 0.1 | 0.4 | GO:0043144 | snoRNA processing(GO:0043144) |
| 0.1 | 0.2 | GO:1902306 | negative regulation of sodium ion transmembrane transport(GO:1902306) negative regulation of sodium ion transmembrane transporter activity(GO:2000650) |
| 0.1 | 0.5 | GO:0051534 | negative regulation of NFAT protein import into nucleus(GO:0051534) |
| 0.1 | 0.2 | GO:0002309 | T cell proliferation involved in immune response(GO:0002309) |
| 0.1 | 0.5 | GO:1902101 | positive regulation of mitotic metaphase/anaphase transition(GO:0045842) positive regulation of mitotic sister chromatid separation(GO:1901970) positive regulation of metaphase/anaphase transition of cell cycle(GO:1902101) |
| 0.1 | 0.7 | GO:0009438 | methylglyoxal metabolic process(GO:0009438) |
| 0.1 | 0.3 | GO:0075733 | viral mRNA export from host cell nucleus(GO:0046784) intracellular transport of virus(GO:0075733) multi-organism intracellular transport(GO:1902583) |
| 0.1 | 0.5 | GO:0051715 | cytolysis in other organism(GO:0051715) |
| 0.1 | 0.2 | GO:0072752 | cellular response to rapamycin(GO:0072752) |
| 0.1 | 0.5 | GO:1902951 | negative regulation of dendritic spine maintenance(GO:1902951) |
| 0.1 | 0.3 | GO:0039534 | negative regulation of MDA-5 signaling pathway(GO:0039534) |
| 0.1 | 0.4 | GO:0035405 | histone-threonine phosphorylation(GO:0035405) |
| 0.1 | 0.2 | GO:0071846 | actin filament debranching(GO:0071846) |
| 0.1 | 0.6 | GO:0035188 | blastocyst hatching(GO:0001835) hatching(GO:0035188) organism emergence from protective structure(GO:0071684) |
| 0.1 | 0.2 | GO:0098501 | polynucleotide dephosphorylation(GO:0098501) |
| 0.1 | 0.4 | GO:0006390 | transcription from mitochondrial promoter(GO:0006390) |
| 0.1 | 0.3 | GO:0030576 | Cajal body organization(GO:0030576) |
| 0.1 | 0.2 | GO:0040030 | regulation of molecular function, epigenetic(GO:0040030) |
| 0.1 | 0.3 | GO:1904749 | regulation of protein localization to nucleolus(GO:1904749) |
| 0.1 | 0.2 | GO:0030043 | actin filament fragmentation(GO:0030043) |
| 0.1 | 0.1 | GO:0034227 | tRNA thio-modification(GO:0034227) |
| 0.1 | 0.2 | GO:1903377 | negative regulation of oxidative stress-induced neuron intrinsic apoptotic signaling pathway(GO:1903377) |
| 0.1 | 0.2 | GO:0009106 | lipoate metabolic process(GO:0009106) lipoate biosynthetic process(GO:0009107) |
| 0.1 | 0.3 | GO:0006578 | amino-acid betaine biosynthetic process(GO:0006578) |
| 0.1 | 0.3 | GO:0060287 | epithelial cilium movement involved in determination of left/right asymmetry(GO:0060287) |
| 0.1 | 0.6 | GO:0018206 | peptidyl-methionine modification(GO:0018206) |
| 0.1 | 0.2 | GO:0019853 | L-ascorbic acid biosynthetic process(GO:0019853) |
| 0.1 | 0.3 | GO:0003356 | regulation of cilium movement(GO:0003352) regulation of cilium beat frequency(GO:0003356) |
| 0.1 | 0.4 | GO:0042699 | follicle-stimulating hormone signaling pathway(GO:0042699) |
| 0.1 | 0.4 | GO:0036265 | RNA (guanine-N7)-methylation(GO:0036265) |
| 0.1 | 0.3 | GO:0000432 | regulation of transcription from RNA polymerase II promoter by glucose(GO:0000430) positive regulation of transcription from RNA polymerase II promoter by glucose(GO:0000432) positive regulation of transcription by glucose(GO:0046016) |
| 0.1 | 0.5 | GO:0031580 | membrane raft polarization(GO:0001766) membrane raft distribution(GO:0031580) |
| 0.1 | 0.4 | GO:0071025 | RNA surveillance(GO:0071025) |
| 0.1 | 0.2 | GO:0035787 | cell migration involved in kidney development(GO:0035787) cell migration involved in metanephros development(GO:0035788) metanephric mesenchymal cell migration(GO:0035789) positive regulation of metanephric mesenchymal cell migration by platelet-derived growth factor receptor-beta signaling pathway(GO:0035793) regulation of metanephric mesenchymal cell migration by platelet-derived growth factor receptor-beta signaling pathway(GO:1900238) regulation of metanephric mesenchymal cell migration(GO:2000589) positive regulation of metanephric mesenchymal cell migration(GO:2000591) |
| 0.1 | 0.4 | GO:0006012 | galactose metabolic process(GO:0006012) |
| 0.1 | 0.2 | GO:0015827 | aromatic amino acid transport(GO:0015801) tryptophan transport(GO:0015827) |
| 0.1 | 0.2 | GO:1904293 | negative regulation of ERAD pathway(GO:1904293) |
| 0.1 | 0.3 | GO:0000733 | DNA strand renaturation(GO:0000733) |
| 0.1 | 0.4 | GO:1904667 | negative regulation of ubiquitin protein ligase activity(GO:1904667) |
| 0.1 | 0.2 | GO:0033566 | gamma-tubulin complex localization(GO:0033566) |
| 0.1 | 1.1 | GO:0006418 | tRNA aminoacylation for protein translation(GO:0006418) |
| 0.1 | 0.5 | GO:0010804 | negative regulation of tumor necrosis factor-mediated signaling pathway(GO:0010804) |
| 0.1 | 0.8 | GO:0009263 | deoxyribonucleotide biosynthetic process(GO:0009263) |
| 0.1 | 0.5 | GO:0008228 | opsonization(GO:0008228) |
| 0.1 | 0.2 | GO:0060672 | epithelial cell differentiation involved in embryonic placenta development(GO:0060671) epithelial cell morphogenesis involved in placental branching(GO:0060672) |
| 0.1 | 0.3 | GO:0051005 | negative regulation of lipoprotein lipase activity(GO:0051005) |
| 0.1 | 0.2 | GO:0070417 | cellular response to cold(GO:0070417) |
| 0.1 | 0.5 | GO:1901029 | negative regulation of mitochondrial outer membrane permeabilization involved in apoptotic signaling pathway(GO:1901029) |
| 0.0 | 0.3 | GO:0071787 | endoplasmic reticulum tubular network assembly(GO:0071787) |
| 0.0 | 0.9 | GO:0009083 | branched-chain amino acid catabolic process(GO:0009083) |
| 0.0 | 0.2 | GO:1904884 | telomerase catalytic core complex assembly(GO:1904868) regulation of telomerase catalytic core complex assembly(GO:1904882) positive regulation of telomerase catalytic core complex assembly(GO:1904884) |
| 0.0 | 0.3 | GO:0006561 | proline biosynthetic process(GO:0006561) |
| 0.0 | 0.4 | GO:0060261 | positive regulation of transcription initiation from RNA polymerase II promoter(GO:0060261) |
| 0.0 | 0.7 | GO:0051151 | negative regulation of smooth muscle cell differentiation(GO:0051151) |
| 0.0 | 0.3 | GO:0042255 | ribosome assembly(GO:0042255) |
| 0.0 | 0.2 | GO:0006121 | mitochondrial electron transport, succinate to ubiquinone(GO:0006121) |
| 0.0 | 0.1 | GO:1904715 | negative regulation of chaperone-mediated autophagy(GO:1904715) |
| 0.0 | 0.5 | GO:0016998 | cell wall macromolecule catabolic process(GO:0016998) |
| 0.0 | 0.3 | GO:0015862 | uridine transport(GO:0015862) |
| 0.0 | 0.3 | GO:0034316 | negative regulation of Arp2/3 complex-mediated actin nucleation(GO:0034316) |
| 0.0 | 0.7 | GO:0060628 | regulation of ER to Golgi vesicle-mediated transport(GO:0060628) |
| 0.0 | 0.8 | GO:1900029 | positive regulation of ruffle assembly(GO:1900029) |
| 0.0 | 0.5 | GO:0019660 | glucose catabolic process to lactate(GO:0019659) glycolytic fermentation(GO:0019660) glucose catabolic process to lactate via pyruvate(GO:0019661) |
| 0.0 | 0.0 | GO:0034427 | nuclear-transcribed mRNA catabolic process, exonucleolytic, 3'-5'(GO:0034427) |
| 0.0 | 0.8 | GO:0002118 | aggressive behavior(GO:0002118) |
| 0.0 | 0.2 | GO:2000774 | positive regulation of cell aging(GO:0090343) positive regulation of cellular senescence(GO:2000774) |
| 0.0 | 0.1 | GO:0090669 | telomerase RNA stabilization(GO:0090669) |
| 0.0 | 0.3 | GO:0060309 | elastin catabolic process(GO:0060309) |
| 0.0 | 0.5 | GO:0006369 | termination of RNA polymerase II transcription(GO:0006369) |
| 0.0 | 0.1 | GO:0002314 | germinal center B cell differentiation(GO:0002314) |
| 0.0 | 0.0 | GO:0017187 | peptidyl-glutamic acid carboxylation(GO:0017187) |
| 0.0 | 0.2 | GO:0006102 | isocitrate metabolic process(GO:0006102) |
| 0.0 | 0.2 | GO:0031335 | regulation of sulfur amino acid metabolic process(GO:0031335) |
| 0.0 | 1.3 | GO:0006607 | NLS-bearing protein import into nucleus(GO:0006607) |
| 0.0 | 0.2 | GO:1904925 | positive regulation of macromitophagy(GO:1901526) positive regulation of mitophagy in response to mitochondrial depolarization(GO:1904925) |
| 0.0 | 0.3 | GO:0061502 | early endosome to recycling endosome transport(GO:0061502) |
| 0.0 | 0.1 | GO:1903537 | meiotic cell cycle process involved in oocyte maturation(GO:1903537) regulation of meiotic cell cycle process involved in oocyte maturation(GO:1903538) |
| 0.0 | 1.5 | GO:0019731 | antibacterial humoral response(GO:0019731) |
| 0.0 | 0.1 | GO:0038108 | negative regulation of appetite by leptin-mediated signaling pathway(GO:0038108) |
| 0.0 | 0.0 | GO:0035502 | metanephric part of ureteric bud development(GO:0035502) |
| 0.0 | 0.4 | GO:0045617 | negative regulation of keratinocyte differentiation(GO:0045617) |
| 0.0 | 0.8 | GO:0061179 | negative regulation of insulin secretion involved in cellular response to glucose stimulus(GO:0061179) |
| 0.0 | 0.0 | GO:0032741 | positive regulation of interleukin-18 production(GO:0032741) |
| 0.0 | 0.2 | GO:1904798 | positive regulation of core promoter binding(GO:1904798) |
| 0.0 | 0.2 | GO:1903750 | regulation of intrinsic apoptotic signaling pathway in response to hydrogen peroxide(GO:1903750) negative regulation of intrinsic apoptotic signaling pathway in response to hydrogen peroxide(GO:1903751) |
| 0.0 | 1.0 | GO:0042773 | ATP synthesis coupled electron transport(GO:0042773) |
| 0.0 | 0.2 | GO:1900060 | negative regulation of ceramide biosynthetic process(GO:1900060) |
| 0.0 | 0.5 | GO:0050859 | negative regulation of B cell receptor signaling pathway(GO:0050859) |
| 0.0 | 0.0 | GO:0001805 | type III hypersensitivity(GO:0001802) regulation of type III hypersensitivity(GO:0001803) positive regulation of type III hypersensitivity(GO:0001805) |
| 0.0 | 0.6 | GO:0038028 | insulin receptor signaling pathway via phosphatidylinositol 3-kinase(GO:0038028) |
| 0.0 | 0.3 | GO:0000492 | small nucleolar ribonucleoprotein complex assembly(GO:0000491) box C/D snoRNP assembly(GO:0000492) |
| 0.0 | 0.1 | GO:0019043 | establishment of viral latency(GO:0019043) |
| 0.0 | 0.8 | GO:0021527 | spinal cord association neuron differentiation(GO:0021527) |
| 0.0 | 0.3 | GO:0015889 | cobalamin transport(GO:0015889) |
| 0.0 | 0.3 | GO:1901028 | regulation of mitochondrial outer membrane permeabilization involved in apoptotic signaling pathway(GO:1901028) |
| 0.0 | 0.3 | GO:0045919 | positive regulation of cytolysis(GO:0045919) |
| 0.0 | 0.6 | GO:0005981 | regulation of glycogen catabolic process(GO:0005981) |
| 0.0 | 0.1 | GO:2000418 | regulation of eosinophil migration(GO:2000416) positive regulation of eosinophil migration(GO:2000418) |
| 0.0 | 0.3 | GO:0045629 | negative regulation of T-helper 2 cell differentiation(GO:0045629) |
| 0.0 | 0.2 | GO:0006556 | S-adenosylmethionine biosynthetic process(GO:0006556) |
| 0.0 | 0.6 | GO:0043615 | astrocyte cell migration(GO:0043615) |
| 0.0 | 0.2 | GO:0030309 | poly-N-acetyllactosamine metabolic process(GO:0030309) poly-N-acetyllactosamine biosynthetic process(GO:0030311) |
| 0.0 | 0.1 | GO:2001293 | fatty-acyl-CoA biosynthetic process(GO:0046949) malonyl-CoA metabolic process(GO:2001293) |
| 0.0 | 0.8 | GO:0090201 | negative regulation of release of cytochrome c from mitochondria(GO:0090201) |
| 0.0 | 7.7 | GO:0042254 | ribosome biogenesis(GO:0042254) |
| 0.0 | 0.3 | GO:0006116 | NADH oxidation(GO:0006116) |
| 0.0 | 0.1 | GO:2000295 | regulation of hydrogen peroxide catabolic process(GO:2000295) |
| 0.0 | 0.2 | GO:1901896 | positive regulation of calcium-transporting ATPase activity(GO:1901896) |
| 0.0 | 0.8 | GO:0042178 | xenobiotic catabolic process(GO:0042178) |
| 0.0 | 0.1 | GO:2000156 | regulation of retrograde vesicle-mediated transport, Golgi to ER(GO:2000156) |
| 0.0 | 0.2 | GO:2000271 | positive regulation of fibroblast apoptotic process(GO:2000271) |
| 0.0 | 0.2 | GO:0032227 | negative regulation of synaptic transmission, dopaminergic(GO:0032227) |
| 0.0 | 0.1 | GO:0035470 | positive regulation of vascular wound healing(GO:0035470) |
| 0.0 | 0.1 | GO:0001966 | thigmotaxis(GO:0001966) |
| 0.0 | 0.3 | GO:0098909 | regulation of cardiac muscle cell action potential involved in regulation of contraction(GO:0098909) |
| 0.0 | 0.2 | GO:0007000 | nucleolus organization(GO:0007000) |
| 0.0 | 0.2 | GO:0071475 | cellular hyperosmotic salinity response(GO:0071475) |
| 0.0 | 1.1 | GO:0060065 | uterus development(GO:0060065) |
| 0.0 | 0.2 | GO:0046601 | positive regulation of centriole replication(GO:0046601) |
| 0.0 | 0.5 | GO:2000096 | positive regulation of Wnt signaling pathway, planar cell polarity pathway(GO:2000096) |
| 0.0 | 0.2 | GO:0018101 | protein citrullination(GO:0018101) histone citrullination(GO:0036414) |
| 0.0 | 0.2 | GO:1904976 | response to bleomycin(GO:1904975) cellular response to bleomycin(GO:1904976) |
| 0.0 | 0.2 | GO:0019276 | UDP-N-acetylgalactosamine metabolic process(GO:0019276) |
| 0.0 | 1.1 | GO:0015991 | ATP hydrolysis coupled proton transport(GO:0015991) |
| 0.0 | 0.4 | GO:0060718 | chorionic trophoblast cell differentiation(GO:0060718) |
| 0.0 | 0.1 | GO:0048611 | ectodermal digestive tract development(GO:0007439) embryonic ectodermal digestive tract development(GO:0048611) |
| 0.0 | 0.1 | GO:0046709 | ADP catabolic process(GO:0046032) IDP metabolic process(GO:0046707) IDP catabolic process(GO:0046709) |
| 0.0 | 0.2 | GO:1903764 | regulation of potassium ion export across plasma membrane(GO:1903764) |
| 0.0 | 0.2 | GO:0009240 | isopentenyl diphosphate biosynthetic process(GO:0009240) isopentenyl diphosphate metabolic process(GO:0046490) |
| 0.0 | 0.3 | GO:0044314 | protein K27-linked ubiquitination(GO:0044314) |
| 0.0 | 0.0 | GO:0002018 | renin-angiotensin regulation of aldosterone production(GO:0002018) |
| 0.0 | 0.1 | GO:0060830 | ciliary receptor clustering involved in smoothened signaling pathway(GO:0060830) |
| 0.0 | 0.3 | GO:0022904 | respiratory electron transport chain(GO:0022904) |
| 0.0 | 0.1 | GO:0009445 | putrescine metabolic process(GO:0009445) |
| 0.0 | 0.3 | GO:0000972 | transcription-dependent tethering of RNA polymerase II gene DNA at nuclear periphery(GO:0000972) |
| 0.0 | 0.3 | GO:0045348 | positive regulation of MHC class II biosynthetic process(GO:0045348) |
| 0.0 | 0.6 | GO:0051645 | Golgi localization(GO:0051645) |
| 0.0 | 0.2 | GO:0044598 | polyketide metabolic process(GO:0030638) aminoglycoside antibiotic metabolic process(GO:0030647) daunorubicin metabolic process(GO:0044597) doxorubicin metabolic process(GO:0044598) |
| 0.0 | 0.6 | GO:0007080 | mitotic metaphase plate congression(GO:0007080) |
| 0.0 | 0.1 | GO:0044339 | canonical Wnt signaling pathway involved in osteoblast differentiation(GO:0044339) |
| 0.0 | 0.2 | GO:0036151 | phosphatidylcholine acyl-chain remodeling(GO:0036151) |
| 0.0 | 0.3 | GO:0023021 | termination of signal transduction(GO:0023021) |
| 0.0 | 0.3 | GO:1900262 | regulation of DNA-directed DNA polymerase activity(GO:1900262) positive regulation of DNA-directed DNA polymerase activity(GO:1900264) |
| 0.0 | 0.3 | GO:1903301 | positive regulation of glucokinase activity(GO:0033133) positive regulation of hexokinase activity(GO:1903301) |
| 0.0 | 0.3 | GO:0006686 | sphingomyelin biosynthetic process(GO:0006686) |
| 0.0 | 0.8 | GO:0006099 | tricarboxylic acid cycle(GO:0006099) |
| 0.0 | 0.3 | GO:0003376 | sphingosine-1-phosphate signaling pathway(GO:0003376) |
| 0.0 | 0.1 | GO:0052422 | modulation by symbiont of host molecular function(GO:0052055) modulation of catalytic activity in other organism involved in symbiotic interaction(GO:0052203) modulation by host of symbiont catalytic activity(GO:0052422) |
| 0.0 | 1.1 | GO:0000413 | protein peptidyl-prolyl isomerization(GO:0000413) |
| 0.0 | 0.1 | GO:0015855 | nucleobase transport(GO:0015851) pyrimidine nucleobase transport(GO:0015855) |
| 0.0 | 0.7 | GO:0060340 | positive regulation of type I interferon-mediated signaling pathway(GO:0060340) |
| 0.0 | 1.2 | GO:0006907 | pinocytosis(GO:0006907) |
| 0.0 | 0.6 | GO:0032402 | melanosome transport(GO:0032402) |
| 0.0 | 0.3 | GO:0010288 | response to lead ion(GO:0010288) |
| 0.0 | 0.3 | GO:0051024 | positive regulation of immunoglobulin secretion(GO:0051024) |
| 0.0 | 0.2 | GO:0016266 | O-glycan processing(GO:0016266) |
| 0.0 | 1.5 | GO:0000387 | spliceosomal snRNP assembly(GO:0000387) |
| 0.0 | 0.1 | GO:0010748 | negative regulation of plasma membrane long-chain fatty acid transport(GO:0010748) |
| 0.0 | 0.1 | GO:0051754 | meiotic sister chromatid cohesion, centromeric(GO:0051754) |
| 0.0 | 0.1 | GO:0009209 | pyrimidine ribonucleoside triphosphate biosynthetic process(GO:0009209) |
| 0.0 | 0.3 | GO:0001844 | protein insertion into mitochondrial membrane involved in apoptotic signaling pathway(GO:0001844) |
| 0.0 | 0.4 | GO:0046697 | decidualization(GO:0046697) |
| 0.0 | 0.1 | GO:0071374 | cellular response to parathyroid hormone stimulus(GO:0071374) |
| 0.0 | 0.6 | GO:0035970 | peptidyl-threonine dephosphorylation(GO:0035970) |
| 0.0 | 0.5 | GO:0051292 | nuclear pore complex assembly(GO:0051292) |
| 0.0 | 0.4 | GO:0000012 | single strand break repair(GO:0000012) |
| 0.0 | 0.5 | GO:0051131 | chaperone-mediated protein complex assembly(GO:0051131) |
| 0.0 | 0.1 | GO:0071681 | response to indole-3-methanol(GO:0071680) cellular response to indole-3-methanol(GO:0071681) |
| 0.0 | 0.1 | GO:1904058 | positive regulation of sensory perception of pain(GO:1904058) |
| 0.0 | 0.1 | GO:1903093 | regulation of protein K48-linked deubiquitination(GO:1903093) negative regulation of protein K48-linked deubiquitination(GO:1903094) negative regulation of ubiquitin-specific protease activity(GO:2000157) |
| 0.0 | 0.2 | GO:0002540 | leukotriene production involved in inflammatory response(GO:0002540) |
| 0.0 | 0.3 | GO:0000185 | activation of MAPKKK activity(GO:0000185) |
| 0.0 | 0.1 | GO:0033299 | secretion of lysosomal enzymes(GO:0033299) |
| 0.0 | 0.3 | GO:0051256 | mitotic spindle midzone assembly(GO:0051256) |
| 0.0 | 0.4 | GO:0019800 | peptide cross-linking via chondroitin 4-sulfate glycosaminoglycan(GO:0019800) |
| 0.0 | 0.6 | GO:0070262 | peptidyl-serine dephosphorylation(GO:0070262) |
| 0.0 | 0.2 | GO:0036295 | cellular response to increased oxygen levels(GO:0036295) |
| 0.0 | 0.3 | GO:0015712 | hexose phosphate transport(GO:0015712) glucose-6-phosphate transport(GO:0015760) |
| 0.0 | 0.2 | GO:0032596 | protein transport into membrane raft(GO:0032596) |
| 0.0 | 3.9 | GO:0006487 | protein N-linked glycosylation(GO:0006487) |
| 0.0 | 0.1 | GO:1903225 | negative regulation of endodermal cell differentiation(GO:1903225) |
| 0.0 | 0.1 | GO:0061042 | vascular wound healing(GO:0061042) |
| 0.0 | 0.8 | GO:0043968 | histone H2A acetylation(GO:0043968) |
| 0.0 | 0.3 | GO:0019886 | antigen processing and presentation of exogenous peptide antigen via MHC class II(GO:0019886) |
| 0.0 | 0.1 | GO:0015755 | fructose transport(GO:0015755) |
| 0.0 | 0.3 | GO:0007007 | inner mitochondrial membrane organization(GO:0007007) |
| 0.0 | 0.5 | GO:0016180 | snRNA processing(GO:0016180) |
| 0.0 | 0.1 | GO:0071985 | multivesicular body sorting pathway(GO:0071985) |
| 0.0 | 0.1 | GO:0015783 | GDP-fucose transport(GO:0015783) purine nucleotide-sugar transport(GO:0036079) |
| 0.0 | 0.1 | GO:0036091 | positive regulation of transcription from RNA polymerase II promoter in response to oxidative stress(GO:0036091) |
| 0.0 | 0.2 | GO:1904851 | positive regulation of establishment of protein localization to telomere(GO:1904851) |
| 0.0 | 0.0 | GO:1904179 | regulation of adipose tissue development(GO:1904177) positive regulation of adipose tissue development(GO:1904179) |
| 0.0 | 0.3 | GO:0032486 | Rap protein signal transduction(GO:0032486) |
| 0.0 | 1.1 | GO:0010501 | RNA secondary structure unwinding(GO:0010501) |
| 0.0 | 0.1 | GO:0090267 | positive regulation of mitotic cell cycle spindle assembly checkpoint(GO:0090267) |
| 0.0 | 1.2 | GO:0006414 | translational elongation(GO:0006414) |
| 0.0 | 0.1 | GO:0036116 | medium-chain fatty-acyl-CoA catabolic process(GO:0036114) fatty-acyl-CoA catabolic process(GO:0036115) long-chain fatty-acyl-CoA catabolic process(GO:0036116) palmitic acid metabolic process(GO:1900533) palmitic acid biosynthetic process(GO:1900535) |
| 0.0 | 0.1 | GO:0031053 | primary miRNA processing(GO:0031053) |
| 0.0 | 0.1 | GO:1905077 | negative regulation of interleukin-17 secretion(GO:1905077) |
| 0.0 | 0.3 | GO:0072015 | glomerular visceral epithelial cell development(GO:0072015) glomerular epithelial cell development(GO:0072310) |
| 0.0 | 0.1 | GO:0043038 | amino acid activation(GO:0043038) |
| 0.0 | 0.4 | GO:0042532 | negative regulation of tyrosine phosphorylation of STAT protein(GO:0042532) |
| 0.0 | 0.1 | GO:0098961 | dendritic transport of ribonucleoprotein complex(GO:0098961) dendritic transport of messenger ribonucleoprotein complex(GO:0098963) anterograde dendritic transport of messenger ribonucleoprotein complex(GO:0098964) |
| 0.0 | 0.2 | GO:0048242 | epinephrine secretion(GO:0048242) |
| 0.0 | 0.3 | GO:0006398 | mRNA 3'-end processing by stem-loop binding and cleavage(GO:0006398) |
| 0.0 | 0.2 | GO:0046668 | regulation of retinal cell programmed cell death(GO:0046668) |
| 0.0 | 0.5 | GO:0051085 | chaperone mediated protein folding requiring cofactor(GO:0051085) |
| 0.0 | 0.6 | GO:0021819 | layer formation in cerebral cortex(GO:0021819) |
| 0.0 | 0.3 | GO:0031293 | membrane protein intracellular domain proteolysis(GO:0031293) |
| 0.0 | 0.2 | GO:0043517 | positive regulation of DNA damage response, signal transduction by p53 class mediator(GO:0043517) |
| 0.0 | 0.1 | GO:0015680 | intracellular copper ion transport(GO:0015680) cellular response to manganese ion(GO:0071287) |
| 0.0 | 0.3 | GO:0032532 | regulation of microvillus length(GO:0032532) |
| 0.0 | 0.2 | GO:2000491 | positive regulation of hepatic stellate cell activation(GO:2000491) |
| 0.0 | 0.0 | GO:1903588 | regulation of blood vessel endothelial cell proliferation involved in sprouting angiogenesis(GO:1903587) negative regulation of blood vessel endothelial cell proliferation involved in sprouting angiogenesis(GO:1903588) |
| 0.0 | 0.2 | GO:0044805 | late nucleophagy(GO:0044805) |
| 0.0 | 0.2 | GO:0045541 | negative regulation of cholesterol biosynthetic process(GO:0045541) negative regulation of cholesterol metabolic process(GO:0090206) |
| 0.0 | 0.2 | GO:0019370 | leukotriene biosynthetic process(GO:0019370) |
| 0.0 | 0.0 | GO:1903487 | regulation of lactation(GO:1903487) |
| 0.0 | 0.7 | GO:0033539 | fatty acid beta-oxidation using acyl-CoA dehydrogenase(GO:0033539) |
| 0.0 | 0.1 | GO:1902167 | positive regulation of intrinsic apoptotic signaling pathway in response to DNA damage by p53 class mediator(GO:1902167) |
| 0.0 | 0.1 | GO:0046340 | diacylglycerol catabolic process(GO:0046340) |
| 0.0 | 0.2 | GO:1900147 | Schwann cell migration(GO:0036135) regulation of Schwann cell migration(GO:1900147) |
| 0.0 | 0.1 | GO:0048478 | replication fork protection(GO:0048478) |
| 0.0 | 0.1 | GO:0035799 | ureter maturation(GO:0035799) |
| 0.0 | 0.2 | GO:2000427 | positive regulation of apoptotic cell clearance(GO:2000427) |
| 0.0 | 0.0 | GO:0016344 | meiotic chromosome movement towards spindle pole(GO:0016344) chromosome movement towards spindle pole(GO:0051305) |
| 0.0 | 0.1 | GO:0043060 | meiotic metaphase I plate congression(GO:0043060) meiotic metaphase plate congression(GO:0051311) |
| 0.0 | 0.1 | GO:0046900 | tetrahydrofolylpolyglutamate metabolic process(GO:0046900) |
| 0.0 | 0.1 | GO:0006529 | asparagine biosynthetic process(GO:0006529) |
| 0.0 | 0.7 | GO:0071577 | zinc II ion transmembrane transport(GO:0071577) |
| 0.0 | 0.1 | GO:0060426 | lung vasculature development(GO:0060426) |
| 0.0 | 0.1 | GO:0060821 | inactivation of X chromosome by DNA methylation(GO:0060821) |
| 0.0 | 1.3 | GO:0006635 | fatty acid beta-oxidation(GO:0006635) |
| 0.0 | 0.3 | GO:0006558 | L-phenylalanine metabolic process(GO:0006558) erythrose 4-phosphate/phosphoenolpyruvate family amino acid metabolic process(GO:1902221) |
| 0.0 | 0.1 | GO:0045065 | cytotoxic T cell differentiation(GO:0045065) |
| 0.0 | 0.1 | GO:2000645 | negative regulation of receptor catabolic process(GO:2000645) |
| 0.0 | 0.8 | GO:0034308 | primary alcohol metabolic process(GO:0034308) |
| 0.0 | 0.1 | GO:2000679 | positive regulation of transcription regulatory region DNA binding(GO:2000679) |
| 0.0 | 0.6 | GO:0008210 | estrogen metabolic process(GO:0008210) |
| 0.0 | 0.4 | GO:0070571 | negative regulation of neuron projection regeneration(GO:0070571) |
| 0.0 | 2.4 | GO:0006413 | translational initiation(GO:0006413) |
| 0.0 | 0.1 | GO:0008050 | female courtship behavior(GO:0008050) |
| 0.0 | 0.1 | GO:0061734 | parkin-mediated mitophagy in response to mitochondrial depolarization(GO:0061734) |
| 0.0 | 0.2 | GO:0061101 | neuroendocrine cell differentiation(GO:0061101) |
| 0.0 | 0.1 | GO:0051309 | female meiosis chromosome separation(GO:0051309) |
| 0.0 | 0.2 | GO:1902572 | regulation of serine-type endopeptidase activity(GO:1900003) negative regulation of serine-type endopeptidase activity(GO:1900004) regulation of serine-type peptidase activity(GO:1902571) negative regulation of serine-type peptidase activity(GO:1902572) |
| 0.0 | 2.5 | GO:0006457 | protein folding(GO:0006457) |
| 0.0 | 0.2 | GO:1904222 | regulation of CDP-diacylglycerol-serine O-phosphatidyltransferase activity(GO:1904217) positive regulation of CDP-diacylglycerol-serine O-phosphatidyltransferase activity(GO:1904219) positive regulation of serine C-palmitoyltransferase activity(GO:1904222) |
| 0.0 | 0.1 | GO:0045204 | MAPK export from nucleus(GO:0045204) |
| 0.0 | 0.9 | GO:0002474 | antigen processing and presentation of peptide antigen via MHC class I(GO:0002474) |
| 0.0 | 0.5 | GO:2000060 | positive regulation of protein ubiquitination involved in ubiquitin-dependent protein catabolic process(GO:2000060) |
| 0.0 | 0.1 | GO:0001561 | fatty acid alpha-oxidation(GO:0001561) |
| 0.0 | 0.3 | GO:0044406 | adhesion of symbiont to host(GO:0044406) |
| 0.0 | 0.1 | GO:0090232 | positive regulation of spindle checkpoint(GO:0090232) |
| 0.0 | 0.3 | GO:0032782 | bile acid secretion(GO:0032782) |
| 0.0 | 0.1 | GO:1903575 | cornified envelope assembly(GO:1903575) |
| 0.0 | 0.3 | GO:0050755 | chemokine metabolic process(GO:0050755) |
| 0.0 | 0.1 | GO:0032954 | regulation of cytokinetic process(GO:0032954) regulation of mitotic cytokinetic process(GO:1903436) positive regulation of mitotic cytokinetic process(GO:1903438) positive regulation of mitotic cytokinesis(GO:1903490) |
| 0.0 | 1.4 | GO:0045599 | negative regulation of fat cell differentiation(GO:0045599) |
| 0.0 | 0.1 | GO:0090361 | platelet-derived growth factor production(GO:0090360) regulation of platelet-derived growth factor production(GO:0090361) |
| 0.0 | 0.0 | GO:0045650 | negative regulation of macrophage differentiation(GO:0045650) |
| 0.0 | 0.4 | GO:0050995 | negative regulation of lipid catabolic process(GO:0050995) |
| 0.0 | 0.2 | GO:1903232 | melanosome assembly(GO:1903232) |
| 0.0 | 0.1 | GO:0006740 | NADPH regeneration(GO:0006740) |
| 0.0 | 0.2 | GO:0070345 | negative regulation of fat cell proliferation(GO:0070345) |
| 0.0 | 0.2 | GO:1900121 | negative regulation of receptor binding(GO:1900121) |
| 0.0 | 0.3 | GO:0002862 | negative regulation of inflammatory response to antigenic stimulus(GO:0002862) |
| 0.0 | 0.1 | GO:0030091 | protein repair(GO:0030091) |
| 0.0 | 0.1 | GO:0032509 | endosome transport via multivesicular body sorting pathway(GO:0032509) |
| 0.0 | 0.0 | GO:0060264 | respiratory burst involved in inflammatory response(GO:0002536) regulation of respiratory burst involved in inflammatory response(GO:0060264) negative regulation of respiratory burst involved in inflammatory response(GO:0060266) |
| 0.0 | 0.1 | GO:0070164 | negative regulation of adiponectin secretion(GO:0070164) |
| 0.0 | 0.1 | GO:0072656 | maintenance of protein location in mitochondrion(GO:0072656) |
| 0.0 | 0.0 | GO:0006014 | D-ribose metabolic process(GO:0006014) |
| 0.0 | 0.2 | GO:0035873 | lactate transport(GO:0015727) lactate transmembrane transport(GO:0035873) plasma membrane lactate transport(GO:0035879) |
| 0.0 | 0.4 | GO:0048703 | embryonic viscerocranium morphogenesis(GO:0048703) |
| 0.0 | 0.1 | GO:2000536 | negative regulation of entry of bacterium into host cell(GO:2000536) |
| 0.0 | 0.1 | GO:0021678 | third ventricle development(GO:0021678) |
| 0.0 | 0.1 | GO:2000562 | negative regulation of CD4-positive, alpha-beta T cell proliferation(GO:2000562) |
| 0.0 | 0.4 | GO:0048387 | negative regulation of retinoic acid receptor signaling pathway(GO:0048387) |
| 0.0 | 0.4 | GO:0006656 | phosphatidylcholine biosynthetic process(GO:0006656) |
| 0.0 | 0.3 | GO:0044342 | type B pancreatic cell proliferation(GO:0044342) |
| 0.0 | 0.1 | GO:0001955 | blood vessel maturation(GO:0001955) |
| 0.0 | 0.2 | GO:2000346 | negative regulation of hepatocyte proliferation(GO:2000346) |
| 0.0 | 0.2 | GO:0032876 | negative regulation of DNA endoreduplication(GO:0032876) |
| 0.0 | 0.2 | GO:2000291 | regulation of myoblast proliferation(GO:2000291) |
| 0.0 | 0.3 | GO:0060670 | branching involved in labyrinthine layer morphogenesis(GO:0060670) |
| 0.0 | 0.0 | GO:1904456 | negative regulation of neuronal action potential(GO:1904456) |
| 0.0 | 0.0 | GO:0001560 | regulation of cell growth by extracellular stimulus(GO:0001560) |
| 0.0 | 0.4 | GO:0046470 | phosphatidylcholine metabolic process(GO:0046470) |
| 0.0 | 0.1 | GO:1904629 | negative regulation of interleukin-12 biosynthetic process(GO:0045083) response to diterpene(GO:1904629) cellular response to diterpene(GO:1904630) response to glucoside(GO:1904631) cellular response to glucoside(GO:1904632) |
| 0.0 | 0.0 | GO:0061309 | cardiac neural crest cell development involved in outflow tract morphogenesis(GO:0061309) |
| 0.0 | 0.0 | GO:0060528 | secretory columnal luminar epithelial cell differentiation involved in prostate glandular acinus development(GO:0060528) |
| 0.0 | 0.1 | GO:1904294 | positive regulation of ERAD pathway(GO:1904294) |
| 0.0 | 0.3 | GO:0071447 | cellular response to hydroperoxide(GO:0071447) |
| 0.0 | 0.1 | GO:0007113 | endomitotic cell cycle(GO:0007113) |
| 0.0 | 0.0 | GO:2001274 | negative regulation of glucose import in response to insulin stimulus(GO:2001274) |
| 0.0 | 0.1 | GO:0060022 | hard palate development(GO:0060022) |
| 0.0 | 0.1 | GO:0032020 | ISG15-protein conjugation(GO:0032020) |
| 0.0 | 0.6 | GO:0006805 | xenobiotic metabolic process(GO:0006805) |
| 0.0 | 0.1 | GO:0018125 | peptidyl-cysteine methylation(GO:0018125) |
| 0.0 | 0.3 | GO:0060124 | positive regulation of growth hormone secretion(GO:0060124) |
| 0.0 | 0.1 | GO:0002829 | negative regulation of type 2 immune response(GO:0002829) |
| 0.0 | 0.2 | GO:0009191 | ribonucleoside diphosphate catabolic process(GO:0009191) |
| 0.0 | 1.0 | GO:0006749 | glutathione metabolic process(GO:0006749) |
| 0.0 | 0.1 | GO:0071947 | protein deubiquitination involved in ubiquitin-dependent protein catabolic process(GO:0071947) |
| 0.0 | 0.1 | GO:2000657 | regulation of apolipoprotein binding(GO:2000656) negative regulation of apolipoprotein binding(GO:2000657) |
| 0.0 | 0.0 | GO:1902990 | mitotic telomere maintenance via semi-conservative replication(GO:1902990) |
| 0.0 | 0.1 | GO:2000909 | regulation of cholesterol import(GO:0060620) regulation of sterol import(GO:2000909) |
| 0.0 | 0.3 | GO:0016242 | negative regulation of macroautophagy(GO:0016242) |
| 0.0 | 0.0 | GO:0046125 | pyrimidine deoxyribonucleoside metabolic process(GO:0046125) |
| 0.0 | 0.1 | GO:0006114 | glycerol biosynthetic process(GO:0006114) |
| 0.0 | 0.2 | GO:2001273 | regulation of glucose import in response to insulin stimulus(GO:2001273) |
| 0.0 | 0.2 | GO:0015886 | heme transport(GO:0015886) |
| 0.0 | 0.2 | GO:0030049 | muscle filament sliding(GO:0030049) |
| 0.0 | 0.2 | GO:0090009 | primitive streak formation(GO:0090009) |
| 0.0 | 1.8 | GO:1901800 | positive regulation of proteasomal protein catabolic process(GO:1901800) |
| 0.0 | 0.6 | GO:0070979 | protein K11-linked ubiquitination(GO:0070979) |
| 0.0 | 0.2 | GO:0035902 | response to immobilization stress(GO:0035902) |
| 0.0 | 0.1 | GO:0046604 | positive regulation of mitotic centrosome separation(GO:0046604) |
| 0.0 | 0.2 | GO:0006002 | fructose 6-phosphate metabolic process(GO:0006002) |
| 0.0 | 0.1 | GO:0046607 | positive regulation of centrosome duplication(GO:0010825) positive regulation of centrosome cycle(GO:0046607) |
| 0.0 | 0.1 | GO:0071638 | negative regulation of monocyte chemotactic protein-1 production(GO:0071638) |
| 0.0 | 0.3 | GO:0070886 | positive regulation of calcineurin-NFAT signaling cascade(GO:0070886) |
| 0.0 | 0.1 | GO:0000042 | protein targeting to Golgi(GO:0000042) |
| 0.0 | 0.2 | GO:0046602 | regulation of mitotic centrosome separation(GO:0046602) |
| 0.0 | 0.2 | GO:0060693 | regulation of branching involved in salivary gland morphogenesis(GO:0060693) |
| 0.0 | 0.2 | GO:0003264 | cardioblast proliferation(GO:0003263) regulation of cardioblast proliferation(GO:0003264) |
| 0.0 | 0.1 | GO:0006048 | UDP-N-acetylglucosamine biosynthetic process(GO:0006048) |
| 0.0 | 0.6 | GO:0031146 | SCF-dependent proteasomal ubiquitin-dependent protein catabolic process(GO:0031146) |
| 0.0 | 0.0 | GO:0035359 | negative regulation of peroxisome proliferator activated receptor signaling pathway(GO:0035359) |
| 0.0 | 0.1 | GO:0097210 | response to gonadotropin-releasing hormone(GO:0097210) cellular response to gonadotropin-releasing hormone(GO:0097211) |
| 0.0 | 0.0 | GO:1901355 | response to rapamycin(GO:1901355) |
| 0.0 | 0.4 | GO:0000002 | mitochondrial genome maintenance(GO:0000002) |
| 0.0 | 0.2 | GO:0071340 | skeletal muscle acetylcholine-gated channel clustering(GO:0071340) |
| 0.0 | 0.1 | GO:0090292 | nuclear matrix organization(GO:0043578) nuclear matrix anchoring at nuclear membrane(GO:0090292) |
| 0.0 | 0.2 | GO:0043457 | regulation of cellular respiration(GO:0043457) |
| 0.0 | 0.0 | GO:0022007 | neural plate elongation(GO:0014022) convergent extension involved in neural plate elongation(GO:0022007) |
| 0.0 | 0.1 | GO:0006415 | translational termination(GO:0006415) |
| 0.0 | 0.1 | GO:0044108 | cellular alcohol metabolic process(GO:0044107) cellular alcohol biosynthetic process(GO:0044108) |
| 0.0 | 0.1 | GO:0002035 | brain renin-angiotensin system(GO:0002035) |
| 0.0 | 0.0 | GO:0001996 | positive regulation of heart rate by epinephrine-norepinephrine(GO:0001996) |
| 0.0 | 0.2 | GO:0034242 | negative regulation of syncytium formation by plasma membrane fusion(GO:0034242) |
| 0.0 | 0.1 | GO:0071044 | histone mRNA catabolic process(GO:0071044) |
| 0.0 | 0.5 | GO:0010884 | positive regulation of lipid storage(GO:0010884) |
| 0.0 | 1.6 | GO:0006888 | ER to Golgi vesicle-mediated transport(GO:0006888) |
| 0.0 | 0.1 | GO:0019627 | urea cycle(GO:0000050) urea metabolic process(GO:0019627) |
| 0.0 | 0.0 | GO:1900747 | negative regulation of vascular endothelial growth factor signaling pathway(GO:1900747) |
| 0.0 | 0.5 | GO:0048566 | embryonic digestive tract development(GO:0048566) |
| 0.0 | 0.2 | GO:0021670 | lateral ventricle development(GO:0021670) |
| 0.0 | 0.5 | GO:0009145 | purine nucleoside triphosphate biosynthetic process(GO:0009145) |
| 0.0 | 0.2 | GO:0044146 | negative regulation of growth of symbiont involved in interaction with host(GO:0044146) |
| 0.0 | 0.1 | GO:0086048 | membrane depolarization during bundle of His cell action potential(GO:0086048) |
| 0.0 | 0.1 | GO:0018160 | peptidyl-pyrromethane cofactor linkage(GO:0018160) |
| 0.0 | 0.1 | GO:0030886 | negative regulation of myeloid dendritic cell activation(GO:0030886) |
| 0.0 | 0.1 | GO:0040040 | thermosensory behavior(GO:0040040) |
| 0.0 | 0.1 | GO:1990440 | positive regulation of transcription from RNA polymerase II promoter in response to endoplasmic reticulum stress(GO:1990440) |
| 0.0 | 0.1 | GO:0071941 | nitrogen cycle metabolic process(GO:0071941) |
| 0.0 | 0.1 | GO:0040016 | embryonic cleavage(GO:0040016) |
| 0.0 | 0.1 | GO:0002268 | follicular dendritic cell activation(GO:0002266) follicular dendritic cell differentiation(GO:0002268) |
| 0.0 | 0.1 | GO:0099563 | modification of synaptic structure(GO:0099563) |
| 0.0 | 0.5 | GO:0046854 | phosphatidylinositol phosphorylation(GO:0046854) |
| 0.0 | 0.2 | GO:0060052 | neurofilament cytoskeleton organization(GO:0060052) |
| 0.0 | 0.1 | GO:1901164 | negative regulation of trophoblast cell migration(GO:1901164) |
| 0.0 | 0.2 | GO:0034498 | early endosome to Golgi transport(GO:0034498) |
| 0.0 | 0.2 | GO:1901386 | negative regulation of voltage-gated calcium channel activity(GO:1901386) |
| 0.0 | 0.1 | GO:0071712 | ER-associated misfolded protein catabolic process(GO:0071712) |
| 0.0 | 0.1 | GO:0031444 | slow-twitch skeletal muscle fiber contraction(GO:0031444) |
| 0.0 | 0.0 | GO:0086047 | membrane depolarization during Purkinje myocyte cell action potential(GO:0086047) |
| 0.0 | 0.1 | GO:0045626 | negative regulation of T-helper 1 cell differentiation(GO:0045626) |
| 0.0 | 0.1 | GO:0021664 | rhombomere formation(GO:0021594) rhombomere 3 morphogenesis(GO:0021658) rhombomere 3 formation(GO:0021660) rhombomere 5 morphogenesis(GO:0021664) rhombomere 5 formation(GO:0021666) |
| 0.0 | 0.9 | GO:2001243 | negative regulation of intrinsic apoptotic signaling pathway(GO:2001243) |
| 0.0 | 0.1 | GO:0010499 | proteasomal ubiquitin-independent protein catabolic process(GO:0010499) |
| 0.0 | 0.1 | GO:0010626 | negative regulation of Schwann cell proliferation(GO:0010626) |
| 0.0 | 0.1 | GO:0043461 | proton-transporting ATP synthase complex assembly(GO:0043461) proton-transporting ATP synthase complex biogenesis(GO:0070272) |
| 0.0 | 0.1 | GO:0009597 | detection of virus(GO:0009597) |
| 0.0 | 0.2 | GO:0033262 | regulation of nuclear cell cycle DNA replication(GO:0033262) |
| 0.0 | 0.1 | GO:0070459 | prolactin secretion(GO:0070459) |
| 0.0 | 0.2 | GO:0006654 | phosphatidic acid biosynthetic process(GO:0006654) |
| 0.0 | 0.1 | GO:0007468 | regulation of rhodopsin gene expression(GO:0007468) positive regulation of rhodopsin gene expression(GO:0045872) |
| 0.0 | 0.3 | GO:0045586 | regulation of gamma-delta T cell differentiation(GO:0045586) regulation of gamma-delta T cell activation(GO:0046643) |
| 0.0 | 1.0 | GO:0008033 | tRNA processing(GO:0008033) |
| 0.0 | 0.3 | GO:0048148 | behavioral response to cocaine(GO:0048148) |
| 0.0 | 0.1 | GO:0032917 | polyamine acetylation(GO:0032917) spermidine acetylation(GO:0032918) |
| 0.0 | 0.1 | GO:0043652 | engulfment of apoptotic cell(GO:0043652) |
| 0.0 | 0.6 | GO:0010596 | negative regulation of endothelial cell migration(GO:0010596) |
| 0.0 | 0.1 | GO:0060330 | regulation of response to interferon-gamma(GO:0060330) |
| 0.0 | 0.1 | GO:0042126 | nitrate metabolic process(GO:0042126) nitrate catabolic process(GO:0043602) nitric oxide catabolic process(GO:0046210) cellular organohalogen metabolic process(GO:0090345) cellular organofluorine metabolic process(GO:0090346) |
| 0.0 | 0.0 | GO:0045763 | negative regulation of cellular amino acid metabolic process(GO:0045763) |
| 0.0 | 0.0 | GO:0000349 | generation of catalytic spliceosome for first transesterification step(GO:0000349) |
| 0.0 | 0.0 | GO:1904616 | regulation of actin filament binding(GO:1904529) regulation of actin binding(GO:1904616) |
| 0.0 | 0.1 | GO:0045297 | mating plug formation(GO:0042628) single-organism reproductive behavior(GO:0044704) post-mating behavior(GO:0045297) |
| 0.0 | 0.1 | GO:0097343 | ripoptosome assembly(GO:0097343) ripoptosome assembly involved in necroptotic process(GO:1901026) |
| 0.0 | 0.1 | GO:0046337 | phosphatidylethanolamine metabolic process(GO:0046337) |
| 0.0 | 0.2 | GO:0007512 | adult heart development(GO:0007512) |
| 0.0 | 0.1 | GO:1904491 | protein localization to ciliary transition zone(GO:1904491) |
| 0.0 | 0.1 | GO:1903504 | regulation of mitotic cell cycle spindle assembly checkpoint(GO:0090266) regulation of mitotic spindle checkpoint(GO:1903504) |
| 0.0 | 0.0 | GO:0040031 | snRNA modification(GO:0040031) |
| 0.0 | 0.0 | GO:0045578 | negative regulation of B cell differentiation(GO:0045578) |
| 0.0 | 0.8 | GO:0042073 | intraciliary transport(GO:0042073) |
| 0.0 | 0.1 | GO:0002430 | complement receptor mediated signaling pathway(GO:0002430) |
| 0.0 | 0.1 | GO:0031665 | negative regulation of lipopolysaccharide-mediated signaling pathway(GO:0031665) |
| 0.0 | 0.1 | GO:0045086 | negative thymic T cell selection(GO:0045060) positive regulation of interleukin-2 biosynthetic process(GO:0045086) |
| 0.0 | 0.0 | GO:0097411 | hypoxia-inducible factor-1alpha signaling pathway(GO:0097411) |
| 0.0 | 0.1 | GO:0006265 | DNA topological change(GO:0006265) |
| 0.0 | 0.0 | GO:0006713 | glucocorticoid catabolic process(GO:0006713) |
| 0.0 | 0.1 | GO:0060763 | mammary duct terminal end bud growth(GO:0060763) |
| 0.0 | 0.0 | GO:1901661 | quinone metabolic process(GO:1901661) |
| 0.0 | 0.4 | GO:0061003 | positive regulation of dendritic spine morphogenesis(GO:0061003) |
| 0.0 | 0.2 | GO:0009062 | fatty acid catabolic process(GO:0009062) |
| 0.0 | 0.0 | GO:0001951 | intestinal D-glucose absorption(GO:0001951) |
| 0.0 | 0.1 | GO:0015879 | carnitine transport(GO:0015879) |
| 0.0 | 0.1 | GO:0016576 | histone dephosphorylation(GO:0016576) |
| 0.0 | 0.1 | GO:2000672 | negative regulation of motor neuron apoptotic process(GO:2000672) |
| 0.0 | 0.0 | GO:0009258 | 10-formyltetrahydrofolate catabolic process(GO:0009258) folic acid-containing compound catabolic process(GO:0009397) pteridine-containing compound catabolic process(GO:0042560) |
| 0.0 | 0.1 | GO:0060666 | dichotomous subdivision of terminal units involved in salivary gland branching(GO:0060666) |
| 0.0 | 0.0 | GO:0043519 | myosin II filament organization(GO:0031038) regulation of myosin II filament organization(GO:0043519) |
| 0.0 | 0.1 | GO:1904305 | response to carbon monoxide(GO:0034465) eye blink reflex(GO:0060082) negative regulation of gastro-intestinal system smooth muscle contraction(GO:1904305) negative regulation of small intestine smooth muscle contraction(GO:1904348) |
| 0.0 | 0.0 | GO:0055096 | lipoprotein particle mediated signaling(GO:0055095) low-density lipoprotein particle mediated signaling(GO:0055096) |
| 0.0 | 0.6 | GO:0016126 | sterol biosynthetic process(GO:0016126) |
| 0.0 | 0.1 | GO:0008343 | adult feeding behavior(GO:0008343) |
| 0.0 | 0.0 | GO:0060027 | convergent extension involved in gastrulation(GO:0060027) |
| 0.0 | 0.3 | GO:1901099 | negative regulation of signal transduction in absence of ligand(GO:1901099) negative regulation of extrinsic apoptotic signaling pathway in absence of ligand(GO:2001240) |
| 0.0 | 0.0 | GO:0046391 | 5-phosphoribose 1-diphosphate biosynthetic process(GO:0006015) 5-phosphoribose 1-diphosphate metabolic process(GO:0046391) |
| 0.0 | 0.0 | GO:0035989 | tendon development(GO:0035989) |
| 0.0 | 0.0 | GO:0071672 | positive regulation of muscle hyperplasia(GO:0014739) negative regulation of smooth muscle cell chemotaxis(GO:0071672) |
| 0.0 | 0.0 | GO:0032096 | negative regulation of response to food(GO:0032096) negative regulation of appetite(GO:0032099) |
| 0.0 | 0.1 | GO:0090045 | positive regulation of deacetylase activity(GO:0090045) |
| 0.0 | 0.0 | GO:0031860 | telomeric 3' overhang formation(GO:0031860) |
| 0.0 | 0.1 | GO:0099527 | postsynapse to nucleus signaling pathway(GO:0099527) |
| 0.0 | 0.1 | GO:1900383 | regulation of synaptic plasticity by receptor localization to synapse(GO:1900383) |
| 0.0 | 0.2 | GO:2001198 | regulation of dendritic cell differentiation(GO:2001198) negative regulation of dendritic cell differentiation(GO:2001199) |
| 0.0 | 0.1 | GO:0015772 | disaccharide transport(GO:0015766) sucrose transport(GO:0015770) oligosaccharide transport(GO:0015772) |
| 0.0 | 0.2 | GO:0030574 | collagen catabolic process(GO:0030574) |
| 0.0 | 0.3 | GO:0031424 | keratinization(GO:0031424) |
| 0.0 | 0.2 | GO:0045780 | positive regulation of bone resorption(GO:0045780) positive regulation of bone remodeling(GO:0046852) |
| 0.0 | 0.1 | GO:0050902 | leukocyte adhesive activation(GO:0050902) |
| 0.0 | 0.1 | GO:0010157 | response to chlorate(GO:0010157) |
| 0.0 | 0.0 | GO:0097401 | synaptic vesicle lumen acidification(GO:0097401) |
| 0.0 | 0.1 | GO:0097475 | motor neuron migration(GO:0097475) |
| 0.0 | 0.2 | GO:0030033 | microvillus assembly(GO:0030033) |
| 0.0 | 0.2 | GO:1900017 | positive regulation of cytokine production involved in inflammatory response(GO:1900017) |
| 0.0 | 0.0 | GO:1904954 | canonical Wnt signaling pathway involved in midbrain dopaminergic neuron differentiation(GO:1904954) |
| 0.0 | 0.2 | GO:0035428 | hexose transmembrane transport(GO:0035428) |
| 0.0 | 0.1 | GO:0006995 | cellular response to nitrogen starvation(GO:0006995) cellular response to nitrogen levels(GO:0043562) |
| 0.0 | 0.1 | GO:0039703 | viral RNA genome replication(GO:0039694) RNA replication(GO:0039703) |
| 0.0 | 0.1 | GO:0031340 | positive regulation of vesicle fusion(GO:0031340) |
| 0.0 | 0.1 | GO:0045218 | zonula adherens maintenance(GO:0045218) |
| 0.0 | 0.0 | GO:1902268 | negative regulation of polyamine transmembrane transport(GO:1902268) |
| 0.0 | 0.0 | GO:0007549 | dosage compensation(GO:0007549) dosage compensation by inactivation of X chromosome(GO:0009048) |
| 0.0 | 0.0 | GO:0010749 | regulation of nitric oxide mediated signal transduction(GO:0010749) |
| 0.0 | 0.1 | GO:0019262 | N-acetylneuraminate catabolic process(GO:0019262) |
| 0.0 | 0.2 | GO:0022027 | interkinetic nuclear migration(GO:0022027) |
| 0.0 | 0.1 | GO:0097345 | mitochondrial outer membrane permeabilization(GO:0097345) |
| 0.0 | 0.0 | GO:0002030 | inhibitory G-protein coupled receptor phosphorylation(GO:0002030) |
| 0.0 | 0.1 | GO:0051152 | positive regulation of smooth muscle cell differentiation(GO:0051152) |
| 0.0 | 0.1 | GO:0032290 | peripheral nervous system myelin formation(GO:0032290) |
| 0.0 | 0.0 | GO:0070525 | tRNA threonylcarbamoyladenosine metabolic process(GO:0070525) |
| 0.0 | 0.1 | GO:0008063 | Toll signaling pathway(GO:0008063) |
| 0.0 | 0.2 | GO:0015936 | coenzyme A metabolic process(GO:0015936) |
| 0.0 | 0.1 | GO:0050930 | induction of positive chemotaxis(GO:0050930) |
| 0.0 | 0.1 | GO:0098870 | neuronal action potential propagation(GO:0019227) action potential propagation(GO:0098870) |
| 0.0 | 0.0 | GO:0040009 | regulation of growth rate(GO:0040009) |
| 0.0 | 0.1 | GO:0032733 | positive regulation of interleukin-10 production(GO:0032733) |
| 0.0 | 0.2 | GO:0045722 | positive regulation of gluconeogenesis(GO:0045722) |
| 0.0 | 0.1 | GO:0006101 | citrate metabolic process(GO:0006101) |
| 0.0 | 0.1 | GO:1901620 | regulation of smoothened signaling pathway involved in dorsal/ventral neural tube patterning(GO:1901620) |
| 0.0 | 0.0 | GO:0032463 | negative regulation of protein homooligomerization(GO:0032463) |
| 0.0 | 0.0 | GO:0070368 | positive regulation of hepatocyte differentiation(GO:0070368) |
| 0.0 | 0.0 | GO:0042360 | vitamin E metabolic process(GO:0042360) |
| 0.0 | 0.6 | GO:0070936 | protein K48-linked ubiquitination(GO:0070936) |
| 0.0 | 0.2 | GO:0046415 | urate metabolic process(GO:0046415) |
| 0.0 | 0.0 | GO:0006501 | C-terminal protein lipidation(GO:0006501) |
| 0.0 | 0.1 | GO:2001205 | negative regulation of osteoclast development(GO:2001205) |
| 0.0 | 0.0 | GO:1902600 | hydrogen ion transmembrane transport(GO:1902600) |
| 0.0 | 0.0 | GO:0051643 | endoplasmic reticulum localization(GO:0051643) |
| 0.0 | 0.0 | GO:0034729 | histone H3-K79 methylation(GO:0034729) |
| 0.0 | 0.1 | GO:0097067 | cellular response to thyroid hormone stimulus(GO:0097067) |
| 0.0 | 0.0 | GO:0072137 | condensed mesenchymal cell proliferation(GO:0072137) |
| 0.0 | 0.1 | GO:0045579 | positive regulation of B cell differentiation(GO:0045579) |
| 0.0 | 0.1 | GO:0035635 | entry of bacterium into host cell(GO:0035635) regulation of entry of bacterium into host cell(GO:2000535) |
| 0.0 | 0.0 | GO:0051025 | negative regulation of immunoglobulin secretion(GO:0051025) |
Gene overrepresentation in cellular component category:
| Log-likelihood per target | Total log-likelihood | Term | Description |
|---|---|---|---|
| 0.5 | 1.6 | GO:0009328 | phenylalanine-tRNA ligase complex(GO:0009328) |
| 0.4 | 1.7 | GO:0002189 | ribose phosphate diphosphokinase complex(GO:0002189) |
| 0.3 | 1.4 | GO:0045273 | mitochondrial respiratory chain complex II, succinate dehydrogenase complex (ubiquinone)(GO:0005749) succinate dehydrogenase complex (ubiquinone)(GO:0045257) respiratory chain complex II(GO:0045273) succinate dehydrogenase complex(GO:0045281) fumarate reductase complex(GO:0045283) |
| 0.3 | 1.5 | GO:0034751 | aryl hydrocarbon receptor complex(GO:0034751) |
| 0.3 | 0.9 | GO:0097144 | BAX complex(GO:0097144) |
| 0.3 | 1.1 | GO:0031021 | interphase microtubule organizing center(GO:0031021) |
| 0.3 | 0.8 | GO:0031904 | endosome lumen(GO:0031904) |
| 0.3 | 3.0 | GO:0008250 | oligosaccharyltransferase complex(GO:0008250) |
| 0.2 | 1.0 | GO:0071920 | cleavage body(GO:0071920) |
| 0.2 | 2.6 | GO:0005750 | mitochondrial respiratory chain complex III(GO:0005750) |
| 0.2 | 1.4 | GO:0097452 | GAIT complex(GO:0097452) |
| 0.2 | 1.6 | GO:0031313 | extrinsic component of endosome membrane(GO:0031313) |
| 0.2 | 0.9 | GO:1990032 | parallel fiber(GO:1990032) |
| 0.2 | 1.6 | GO:0005784 | Sec61 translocon complex(GO:0005784) translocon complex(GO:0071256) |
| 0.2 | 1.1 | GO:0031510 | SUMO activating enzyme complex(GO:0031510) |
| 0.2 | 0.7 | GO:1902912 | pyruvate kinase complex(GO:1902912) |
| 0.2 | 7.4 | GO:0000314 | organellar small ribosomal subunit(GO:0000314) mitochondrial small ribosomal subunit(GO:0005763) |
| 0.2 | 2.0 | GO:0005787 | signal peptidase complex(GO:0005787) |
| 0.2 | 2.2 | GO:0016272 | prefoldin complex(GO:0016272) |
| 0.2 | 1.0 | GO:0071817 | MMXD complex(GO:0071817) |
| 0.2 | 2.5 | GO:0008540 | proteasome regulatory particle, base subcomplex(GO:0008540) |
| 0.2 | 0.8 | GO:1990452 | Parkin-FBXW7-Cul1 ubiquitin ligase complex(GO:1990452) |
| 0.2 | 0.6 | GO:0005965 | protein farnesyltransferase complex(GO:0005965) |
| 0.2 | 0.6 | GO:0031074 | nucleocytoplasmic shuttling complex(GO:0031074) |
| 0.2 | 0.9 | GO:0097057 | TRAF2-GSTP1 complex(GO:0097057) |
| 0.2 | 0.7 | GO:0001740 | Barr body(GO:0001740) |
| 0.2 | 2.8 | GO:0000276 | mitochondrial proton-transporting ATP synthase complex, coupling factor F(o)(GO:0000276) |
| 0.2 | 8.9 | GO:0005747 | mitochondrial respiratory chain complex I(GO:0005747) NADH dehydrogenase complex(GO:0030964) respiratory chain complex I(GO:0045271) |
| 0.2 | 0.8 | GO:0034365 | discoidal high-density lipoprotein particle(GO:0034365) |
| 0.2 | 1.5 | GO:0042824 | MHC class I peptide loading complex(GO:0042824) |
| 0.2 | 2.3 | GO:0005838 | proteasome regulatory particle(GO:0005838) |
| 0.2 | 0.5 | GO:0034457 | Mpp10 complex(GO:0034457) |
| 0.2 | 12.8 | GO:0022625 | cytosolic large ribosomal subunit(GO:0022625) |
| 0.2 | 0.5 | GO:0000814 | ESCRT II complex(GO:0000814) |
| 0.2 | 0.9 | GO:0032299 | ribonuclease H2 complex(GO:0032299) |
| 0.1 | 0.9 | GO:0048237 | rough endoplasmic reticulum lumen(GO:0048237) |
| 0.1 | 3.4 | GO:0046930 | pore complex(GO:0046930) |
| 0.1 | 1.9 | GO:0017101 | aminoacyl-tRNA synthetase multienzyme complex(GO:0017101) |
| 0.1 | 0.6 | GO:0032133 | chromosome passenger complex(GO:0032133) |
| 0.1 | 9.2 | GO:0000315 | organellar large ribosomal subunit(GO:0000315) mitochondrial large ribosomal subunit(GO:0005762) |
| 0.1 | 1.1 | GO:0005828 | kinetochore microtubule(GO:0005828) |
| 0.1 | 1.9 | GO:0005736 | DNA-directed RNA polymerase I complex(GO:0005736) |
| 0.1 | 0.7 | GO:0043224 | nuclear SCF ubiquitin ligase complex(GO:0043224) |
| 0.1 | 1.1 | GO:0005796 | Golgi lumen(GO:0005796) |
| 0.1 | 0.8 | GO:0097226 | sperm mitochondrial sheath(GO:0097226) |
| 0.1 | 1.3 | GO:0000788 | nuclear nucleosome(GO:0000788) |
| 0.1 | 0.3 | GO:0000835 | ER ubiquitin ligase complex(GO:0000835) Hrd1p ubiquitin ligase complex(GO:0000836) |
| 0.1 | 0.5 | GO:0033186 | CAF-1 complex(GO:0033186) |
| 0.1 | 1.8 | GO:0042612 | MHC class I protein complex(GO:0042612) |
| 0.1 | 7.5 | GO:0015935 | small ribosomal subunit(GO:0015935) |
| 0.1 | 0.9 | GO:0005638 | lamin filament(GO:0005638) |
| 0.1 | 1.3 | GO:0005753 | mitochondrial proton-transporting ATP synthase complex(GO:0005753) |
| 0.1 | 0.8 | GO:0005971 | ribonucleoside-diphosphate reductase complex(GO:0005971) |
| 0.1 | 0.5 | GO:0017133 | mitochondrial electron transfer flavoprotein complex(GO:0017133) electron transfer flavoprotein complex(GO:0045251) |
| 0.1 | 0.5 | GO:0032280 | symmetric synapse(GO:0032280) |
| 0.1 | 1.6 | GO:0034709 | methylosome(GO:0034709) |
| 0.1 | 2.2 | GO:0005852 | eukaryotic translation initiation factor 3 complex(GO:0005852) |
| 0.1 | 1.0 | GO:0031428 | box C/D snoRNP complex(GO:0031428) |
| 0.1 | 2.2 | GO:0005832 | chaperonin-containing T-complex(GO:0005832) |
| 0.1 | 0.2 | GO:0000805 | X chromosome(GO:0000805) |
| 0.1 | 3.1 | GO:0005839 | proteasome core complex(GO:0005839) |
| 0.1 | 0.3 | GO:0048269 | methionine adenosyltransferase complex(GO:0048269) |
| 0.1 | 0.2 | GO:0015934 | large ribosomal subunit(GO:0015934) |
| 0.1 | 0.9 | GO:0030891 | VCB complex(GO:0030891) |
| 0.1 | 0.4 | GO:0005850 | eukaryotic translation initiation factor 2 complex(GO:0005850) |
| 0.1 | 0.8 | GO:0030062 | mitochondrial tricarboxylic acid cycle enzyme complex(GO:0030062) |
| 0.1 | 0.8 | GO:0042406 | extrinsic component of endoplasmic reticulum membrane(GO:0042406) |
| 0.1 | 0.5 | GO:0005914 | spot adherens junction(GO:0005914) |
| 0.1 | 1.3 | GO:0000176 | nuclear exosome (RNase complex)(GO:0000176) |
| 0.1 | 0.7 | GO:0097550 | transcriptional preinitiation complex(GO:0097550) |
| 0.1 | 0.3 | GO:0042720 | mitochondrial inner membrane peptidase complex(GO:0042720) |
| 0.1 | 0.9 | GO:0045298 | tubulin complex(GO:0045298) |
| 0.1 | 0.3 | GO:0014801 | longitudinal sarcoplasmic reticulum(GO:0014801) |
| 0.1 | 0.4 | GO:0097169 | AIM2 inflammasome complex(GO:0097169) |
| 0.1 | 0.6 | GO:0000172 | ribonuclease MRP complex(GO:0000172) |
| 0.1 | 0.3 | GO:0098842 | postsynaptic early endosome(GO:0098842) |
| 0.1 | 0.3 | GO:0042721 | mitochondrial inner membrane protein insertion complex(GO:0042721) |
| 0.1 | 0.4 | GO:0005745 | m-AAA complex(GO:0005745) |
| 0.1 | 0.7 | GO:0005761 | organellar ribosome(GO:0000313) mitochondrial ribosome(GO:0005761) |
| 0.1 | 0.4 | GO:0044194 | cytolytic granule(GO:0044194) |
| 0.1 | 0.4 | GO:0016533 | cyclin-dependent protein kinase 5 holoenzyme complex(GO:0016533) |
| 0.1 | 1.3 | GO:0005662 | DNA replication factor A complex(GO:0005662) |
| 0.1 | 2.3 | GO:0032040 | small-subunit processome(GO:0032040) |
| 0.1 | 0.2 | GO:0070992 | translation initiation complex(GO:0070992) |
| 0.1 | 4.6 | GO:0042645 | nucleoid(GO:0009295) mitochondrial nucleoid(GO:0042645) |
| 0.1 | 0.3 | GO:0032156 | septin cytoskeleton(GO:0032156) |
| 0.1 | 1.4 | GO:0036513 | Derlin-1 retrotranslocation complex(GO:0036513) |
| 0.1 | 1.1 | GO:0072546 | ER membrane protein complex(GO:0072546) |
| 0.1 | 1.1 | GO:0016281 | eukaryotic translation initiation factor 4F complex(GO:0016281) |
| 0.1 | 0.5 | GO:0071458 | integral component of cytoplasmic side of endoplasmic reticulum membrane(GO:0071458) integral component of lumenal side of endoplasmic reticulum membrane(GO:0071556) lumenal side of endoplasmic reticulum membrane(GO:0098553) |
| 0.1 | 0.4 | GO:0008622 | epsilon DNA polymerase complex(GO:0008622) |
| 0.1 | 0.4 | GO:0044614 | nuclear pore cytoplasmic filaments(GO:0044614) |
| 0.1 | 0.7 | GO:0005786 | signal recognition particle, endoplasmic reticulum targeting(GO:0005786) |
| 0.1 | 0.6 | GO:0005851 | eukaryotic translation initiation factor 2B complex(GO:0005851) |
| 0.1 | 0.2 | GO:0005863 | striated muscle myosin thick filament(GO:0005863) |
| 0.1 | 0.4 | GO:0030906 | retromer, cargo-selective complex(GO:0030906) |
| 0.1 | 0.4 | GO:0017177 | glucosidase II complex(GO:0017177) |
| 0.1 | 1.0 | GO:0098799 | outer mitochondrial membrane protein complex(GO:0098799) |
| 0.1 | 1.4 | GO:0036038 | MKS complex(GO:0036038) |
| 0.1 | 0.2 | GO:0031372 | UBC13-MMS2 complex(GO:0031372) |
| 0.1 | 1.1 | GO:0005869 | dynactin complex(GO:0005869) |
| 0.1 | 0.8 | GO:0030688 | preribosome, small subunit precursor(GO:0030688) |
| 0.1 | 0.3 | GO:0097574 | lateral part of cell(GO:0097574) basolateral part of cell(GO:1990794) rod bipolar cell terminal bouton(GO:1990795) |
| 0.1 | 0.9 | GO:0000815 | ESCRT III complex(GO:0000815) |
| 0.1 | 1.2 | GO:0042555 | MCM complex(GO:0042555) |
| 0.1 | 0.5 | GO:0097025 | MPP7-DLG1-LIN7 complex(GO:0097025) |
| 0.1 | 0.7 | GO:1990726 | Lsm1-7-Pat1 complex(GO:1990726) |
| 0.1 | 4.2 | GO:0008180 | COP9 signalosome(GO:0008180) |
| 0.1 | 0.1 | GO:1990037 | Lewy body core(GO:1990037) |
| 0.1 | 1.2 | GO:0030663 | COPI-coated vesicle membrane(GO:0030663) |
| 0.1 | 0.9 | GO:0030897 | HOPS complex(GO:0030897) |
| 0.1 | 1.4 | GO:0005885 | Arp2/3 protein complex(GO:0005885) |
| 0.1 | 0.4 | GO:0071953 | elastic fiber(GO:0071953) |
| 0.1 | 1.1 | GO:0035631 | CD40 receptor complex(GO:0035631) |
| 0.1 | 0.2 | GO:0005879 | axonemal microtubule(GO:0005879) |
| 0.1 | 0.6 | GO:0045254 | pyruvate dehydrogenase complex(GO:0045254) |
| 0.1 | 0.3 | GO:0090661 | box H/ACA telomerase RNP complex(GO:0090661) |
| 0.1 | 1.0 | GO:0005862 | muscle thin filament tropomyosin(GO:0005862) |
| 0.1 | 0.7 | GO:0031371 | ubiquitin conjugating enzyme complex(GO:0031371) |
| 0.1 | 0.5 | GO:0005827 | polar microtubule(GO:0005827) |
| 0.1 | 0.5 | GO:0042765 | GPI-anchor transamidase complex(GO:0042765) |
| 0.1 | 0.8 | GO:0046540 | U4/U6 x U5 tri-snRNP complex(GO:0046540) |
| 0.1 | 0.3 | GO:0097454 | Schwann cell microvillus(GO:0097454) |
| 0.1 | 0.7 | GO:0031080 | nuclear pore outer ring(GO:0031080) |
| 0.1 | 1.8 | GO:0005782 | peroxisomal matrix(GO:0005782) microbody lumen(GO:0031907) |
| 0.1 | 0.6 | GO:0097451 | glial limiting end-foot(GO:0097451) |
| 0.1 | 0.5 | GO:0031462 | Cul2-RING ubiquitin ligase complex(GO:0031462) |
| 0.1 | 0.7 | GO:0097433 | dense body(GO:0097433) |
| 0.1 | 0.3 | GO:1990131 | EGO complex(GO:0034448) Gtr1-Gtr2 GTPase complex(GO:1990131) |
| 0.1 | 0.5 | GO:0071818 | BAT3 complex(GO:0071818) ER membrane insertion complex(GO:0072379) |
| 0.1 | 1.0 | GO:0000124 | SAGA complex(GO:0000124) |
| 0.1 | 3.1 | GO:0005788 | endoplasmic reticulum lumen(GO:0005788) |
| 0.1 | 0.9 | GO:0044754 | autolysosome(GO:0044754) |
| 0.1 | 0.4 | GO:0043527 | tRNA methyltransferase complex(GO:0043527) |
| 0.1 | 0.1 | GO:0070069 | cytochrome complex(GO:0070069) |
| 0.1 | 0.7 | GO:0033180 | proton-transporting V-type ATPase, V1 domain(GO:0033180) |
| 0.1 | 0.6 | GO:0070369 | beta-catenin-TCF7L2 complex(GO:0070369) |
| 0.1 | 0.6 | GO:0042105 | alpha-beta T cell receptor complex(GO:0042105) |
| 0.1 | 0.2 | GO:0031084 | BLOC-2 complex(GO:0031084) |
| 0.1 | 0.1 | GO:0034456 | CURI complex(GO:0032545) UTP-C complex(GO:0034456) |
| 0.1 | 0.2 | GO:0033178 | proton-transporting two-sector ATPase complex, catalytic domain(GO:0033178) |
| 0.1 | 0.5 | GO:0072669 | tRNA-splicing ligase complex(GO:0072669) |
| 0.1 | 0.6 | GO:1904115 | axon cytoplasm(GO:1904115) |
| 0.1 | 0.5 | GO:0031211 | serine C-palmitoyltransferase complex(GO:0017059) endoplasmic reticulum palmitoyltransferase complex(GO:0031211) |
| 0.1 | 0.2 | GO:0071942 | XPC complex(GO:0071942) |
| 0.1 | 0.3 | GO:0031262 | Ndc80 complex(GO:0031262) |
| 0.1 | 0.4 | GO:0089701 | U2AF(GO:0089701) |
| 0.1 | 0.8 | GO:0005797 | Golgi medial cisterna(GO:0005797) |
| 0.1 | 0.4 | GO:0030289 | protein phosphatase 4 complex(GO:0030289) |
| 0.1 | 0.4 | GO:0097136 | Bcl-2 family protein complex(GO:0097136) |
| 0.1 | 0.7 | GO:0071598 | neuronal ribonucleoprotein granule(GO:0071598) |
| 0.1 | 0.5 | GO:0042382 | paraspeckles(GO:0042382) |
| 0.0 | 1.6 | GO:0031305 | integral component of mitochondrial inner membrane(GO:0031305) |
| 0.0 | 0.5 | GO:0042587 | glycogen granule(GO:0042587) |
| 0.0 | 2.1 | GO:0005758 | mitochondrial intermembrane space(GO:0005758) |
| 0.0 | 0.4 | GO:0000445 | THO complex(GO:0000347) THO complex part of transcription export complex(GO:0000445) |
| 0.0 | 0.3 | GO:0097149 | centralspindlin complex(GO:0097149) |
| 0.0 | 0.1 | GO:1990769 | proximal neuron projection(GO:1990769) |
| 0.0 | 0.1 | GO:0070469 | respiratory chain(GO:0070469) |
| 0.0 | 0.0 | GO:0070937 | CRD-mediated mRNA stability complex(GO:0070937) |
| 0.0 | 0.5 | GO:0032797 | SMN complex(GO:0032797) |
| 0.0 | 1.3 | GO:0031362 | anchored component of external side of plasma membrane(GO:0031362) |
| 0.0 | 0.1 | GO:0048179 | activin receptor complex(GO:0048179) |
| 0.0 | 0.7 | GO:0033179 | proton-transporting V-type ATPase, V0 domain(GO:0033179) |
| 0.0 | 0.1 | GO:0005854 | nascent polypeptide-associated complex(GO:0005854) |
| 0.0 | 0.4 | GO:0000243 | commitment complex(GO:0000243) |
| 0.0 | 0.1 | GO:0005588 | collagen type V trimer(GO:0005588) |
| 0.0 | 0.8 | GO:0030061 | mitochondrial crista(GO:0030061) |
| 0.0 | 0.1 | GO:0000444 | MIS12/MIND type complex(GO:0000444) |
| 0.0 | 1.1 | GO:0035253 | ciliary rootlet(GO:0035253) |
| 0.0 | 0.7 | GO:0005689 | U12-type spliceosomal complex(GO:0005689) |
| 0.0 | 0.1 | GO:0032311 | angiogenin-PRI complex(GO:0032311) |
| 0.0 | 0.2 | GO:0005687 | U4 snRNP(GO:0005687) |
| 0.0 | 0.9 | GO:0031011 | Ino80 complex(GO:0031011) |
| 0.0 | 0.3 | GO:0005853 | eukaryotic translation elongation factor 1 complex(GO:0005853) |
| 0.0 | 0.5 | GO:0033276 | transcription factor TFTC complex(GO:0033276) |
| 0.0 | 1.3 | GO:0001741 | XY body(GO:0001741) |
| 0.0 | 0.3 | GO:0070847 | core mediator complex(GO:0070847) |
| 0.0 | 1.2 | GO:0005680 | anaphase-promoting complex(GO:0005680) |
| 0.0 | 0.2 | GO:0097058 | CRLF-CLCF1 complex(GO:0097058) |
| 0.0 | 0.2 | GO:0030991 | intraciliary transport particle A(GO:0030991) |
| 0.0 | 0.1 | GO:0098843 | postsynaptic endocytic zone(GO:0098843) |
| 0.0 | 0.2 | GO:0042719 | mitochondrial intermembrane space protein transporter complex(GO:0042719) |
| 0.0 | 0.3 | GO:0044613 | nuclear pore central transport channel(GO:0044613) |
| 0.0 | 0.2 | GO:0005663 | DNA replication factor C complex(GO:0005663) |
| 0.0 | 0.7 | GO:0005847 | mRNA cleavage and polyadenylation specificity factor complex(GO:0005847) |
| 0.0 | 0.3 | GO:0097129 | cyclin D2-CDK4 complex(GO:0097129) |
| 0.0 | 0.3 | GO:0044214 | spanning component of plasma membrane(GO:0044214) spanning component of membrane(GO:0089717) |
| 0.0 | 0.5 | GO:0042622 | photoreceptor outer segment membrane(GO:0042622) |
| 0.0 | 0.1 | GO:1990429 | Pex17p-Pex14p docking complex(GO:1990415) peroxisomal importomer complex(GO:1990429) |
| 0.0 | 1.1 | GO:0000159 | protein phosphatase type 2A complex(GO:0000159) |
| 0.0 | 0.5 | GO:0001520 | outer dense fiber(GO:0001520) |
| 0.0 | 0.2 | GO:0034684 | integrin alphav-beta5 complex(GO:0034684) |
| 0.0 | 0.6 | GO:0008290 | F-actin capping protein complex(GO:0008290) |
| 0.0 | 0.2 | GO:0000214 | tRNA-intron endonuclease complex(GO:0000214) |
| 0.0 | 0.2 | GO:0033553 | rDNA heterochromatin(GO:0033553) |
| 0.0 | 0.2 | GO:1903440 | calcitonin family receptor complex(GO:1903439) amylin receptor complex(GO:1903440) |
| 0.0 | 0.7 | GO:0031083 | BLOC-1 complex(GO:0031083) |
| 0.0 | 0.1 | GO:0071203 | WASH complex(GO:0071203) |
| 0.0 | 0.3 | GO:0005890 | sodium:potassium-exchanging ATPase complex(GO:0005890) |
| 0.0 | 0.7 | GO:0031306 | intrinsic component of mitochondrial outer membrane(GO:0031306) |
| 0.0 | 0.2 | GO:0000798 | nuclear cohesin complex(GO:0000798) |
| 0.0 | 11.6 | GO:0005743 | mitochondrial inner membrane(GO:0005743) |
| 0.0 | 0.2 | GO:0005945 | 6-phosphofructokinase complex(GO:0005945) |
| 0.0 | 0.2 | GO:0043564 | Ku70:Ku80 complex(GO:0043564) |
| 0.0 | 0.6 | GO:0046581 | intercellular canaliculus(GO:0046581) |
| 0.0 | 0.1 | GO:0030677 | ribonuclease P complex(GO:0030677) multimeric ribonuclease P complex(GO:0030681) |
| 0.0 | 0.3 | GO:0008385 | IkappaB kinase complex(GO:0008385) |
| 0.0 | 0.1 | GO:0030121 | AP-1 adaptor complex(GO:0030121) |
| 0.0 | 0.1 | GO:0031415 | NatA complex(GO:0031415) |
| 0.0 | 0.2 | GO:0030137 | COPI-coated vesicle(GO:0030137) |
| 0.0 | 0.3 | GO:0045098 | type III intermediate filament(GO:0045098) |
| 0.0 | 0.2 | GO:0033116 | endoplasmic reticulum-Golgi intermediate compartment membrane(GO:0033116) |
| 0.0 | 0.3 | GO:0071986 | Ragulator complex(GO:0071986) |
| 0.0 | 0.7 | GO:0030008 | TRAPP complex(GO:0030008) |
| 0.0 | 0.3 | GO:0030485 | smooth muscle contractile fiber(GO:0030485) |
| 0.0 | 0.3 | GO:0005883 | neurofilament(GO:0005883) |
| 0.0 | 2.0 | GO:0005793 | endoplasmic reticulum-Golgi intermediate compartment(GO:0005793) |
| 0.0 | 0.6 | GO:0044232 | organelle membrane contact site(GO:0044232) |
| 0.0 | 0.4 | GO:0000778 | condensed nuclear chromosome kinetochore(GO:0000778) |
| 0.0 | 0.6 | GO:0031143 | pseudopodium(GO:0031143) |
| 0.0 | 1.2 | GO:0005840 | ribosome(GO:0005840) |
| 0.0 | 0.8 | GO:0005614 | interstitial matrix(GO:0005614) |
| 0.0 | 3.2 | GO:0071013 | catalytic step 2 spliceosome(GO:0071013) |
| 0.0 | 0.6 | GO:0005640 | nuclear outer membrane(GO:0005640) |
| 0.0 | 0.1 | GO:0005956 | protein kinase CK2 complex(GO:0005956) |
| 0.0 | 0.1 | GO:0043540 | 6-phosphofructo-2-kinase/fructose-2,6-biphosphatase complex(GO:0043540) |
| 0.0 | 0.7 | GO:0035098 | ESC/E(Z) complex(GO:0035098) |
| 0.0 | 0.6 | GO:1902562 | NuA4 histone acetyltransferase complex(GO:0035267) H4/H2A histone acetyltransferase complex(GO:0043189) H4 histone acetyltransferase complex(GO:1902562) |
| 0.0 | 1.0 | GO:0030992 | intraciliary transport particle B(GO:0030992) |
| 0.0 | 0.3 | GO:0000796 | condensin complex(GO:0000796) |
| 0.0 | 0.6 | GO:0097546 | ciliary base(GO:0097546) |
| 0.0 | 5.0 | GO:0005777 | peroxisome(GO:0005777) microbody(GO:0042579) |
| 0.0 | 0.2 | GO:0000439 | core TFIIH complex(GO:0000439) |
| 0.0 | 0.3 | GO:0000235 | astral microtubule(GO:0000235) |
| 0.0 | 0.9 | GO:0030687 | preribosome, large subunit precursor(GO:0030687) |
| 0.0 | 0.1 | GO:0014701 | junctional sarcoplasmic reticulum membrane(GO:0014701) |
| 0.0 | 0.1 | GO:0000308 | cytoplasmic cyclin-dependent protein kinase holoenzyme complex(GO:0000308) |
| 0.0 | 0.1 | GO:0034657 | GID complex(GO:0034657) |
| 0.0 | 0.1 | GO:0043625 | delta DNA polymerase complex(GO:0043625) |
| 0.0 | 1.0 | GO:0032391 | photoreceptor connecting cilium(GO:0032391) |
| 0.0 | 0.1 | GO:0005675 | holo TFIIH complex(GO:0005675) |
| 0.0 | 0.1 | GO:0005677 | chromatin silencing complex(GO:0005677) |
| 0.0 | 0.4 | GO:0000015 | phosphopyruvate hydratase complex(GO:0000015) |
| 0.0 | 0.1 | GO:1990590 | ATF1-ATF4 transcription factor complex(GO:1990590) |
| 0.0 | 0.2 | GO:0035985 | senescence-associated heterochromatin focus(GO:0035985) |
| 0.0 | 0.3 | GO:0042613 | MHC class II protein complex(GO:0042613) |
| 0.0 | 0.1 | GO:0098831 | presynaptic active zone cytoplasmic component(GO:0098831) |
| 0.0 | 0.3 | GO:0030867 | rough endoplasmic reticulum membrane(GO:0030867) |
| 0.0 | 0.0 | GO:0033202 | DNA helicase complex(GO:0033202) |
| 0.0 | 4.4 | GO:0043209 | myelin sheath(GO:0043209) |
| 0.0 | 0.1 | GO:1990745 | GARP complex(GO:0000938) EARP complex(GO:1990745) |
| 0.0 | 0.5 | GO:0035686 | sperm fibrous sheath(GO:0035686) |
| 0.0 | 0.1 | GO:0035189 | Rb-E2F complex(GO:0035189) |
| 0.0 | 0.1 | GO:0097441 | basilar dendrite(GO:0097441) |
| 0.0 | 0.1 | GO:0097442 | CA3 pyramidal cell dendrite(GO:0097442) |
| 0.0 | 0.6 | GO:0048770 | melanosome(GO:0042470) pigment granule(GO:0048770) |
| 0.0 | 1.3 | GO:0005811 | lipid particle(GO:0005811) |
| 0.0 | 0.3 | GO:1990023 | mitotic spindle midzone(GO:1990023) |
| 0.0 | 0.3 | GO:0043240 | Fanconi anaemia nuclear complex(GO:0043240) |
| 0.0 | 0.1 | GO:0005712 | chiasma(GO:0005712) |
| 0.0 | 0.3 | GO:0005684 | U2-type spliceosomal complex(GO:0005684) |
| 0.0 | 0.0 | GO:0042643 | actomyosin, actin portion(GO:0042643) |
| 0.0 | 0.1 | GO:0033588 | Elongator holoenzyme complex(GO:0033588) |
| 0.0 | 0.3 | GO:0042582 | primary lysosome(GO:0005766) azurophil granule(GO:0042582) |
| 0.0 | 0.4 | GO:0000145 | exocyst(GO:0000145) |
| 0.0 | 1.6 | GO:0005759 | mitochondrial matrix(GO:0005759) |
| 0.0 | 24.6 | GO:0005739 | mitochondrion(GO:0005739) |
| 0.0 | 0.1 | GO:0090537 | CERF complex(GO:0090537) |
| 0.0 | 0.1 | GO:0044352 | pinosome(GO:0044352) macropinosome(GO:0044354) |
| 0.0 | 0.8 | GO:0045171 | intercellular bridge(GO:0045171) |
| 0.0 | 0.1 | GO:0043259 | laminin-10 complex(GO:0043259) |
| 0.0 | 0.1 | GO:0033257 | Bcl3/NF-kappaB2 complex(GO:0033257) |
| 0.0 | 0.2 | GO:1990124 | messenger ribonucleoprotein complex(GO:1990124) |
| 0.0 | 0.0 | GO:0098533 | ATPase dependent transmembrane transport complex(GO:0098533) |
| 0.0 | 0.1 | GO:0031390 | Ctf18 RFC-like complex(GO:0031390) |
| 0.0 | 0.2 | GO:0032593 | insulin-responsive compartment(GO:0032593) |
| 0.0 | 1.4 | GO:0019005 | SCF ubiquitin ligase complex(GO:0019005) |
| 0.0 | 0.6 | GO:0032588 | trans-Golgi network membrane(GO:0032588) |
| 0.0 | 0.4 | GO:0034364 | high-density lipoprotein particle(GO:0034364) |
| 0.0 | 0.3 | GO:0030127 | COPII vesicle coat(GO:0030127) |
| 0.0 | 0.6 | GO:0015030 | Cajal body(GO:0015030) |
| 0.0 | 0.2 | GO:0005642 | annulate lamellae(GO:0005642) |
| 0.0 | 0.1 | GO:0034992 | microtubule organizing center attachment site(GO:0034992) LINC complex(GO:0034993) |
| 0.0 | 0.1 | GO:0071438 | invadopodium membrane(GO:0071438) |
| 0.0 | 0.0 | GO:0061474 | phagolysosome membrane(GO:0061474) |
| 0.0 | 0.2 | GO:0016589 | NURF complex(GO:0016589) |
| 0.0 | 0.0 | GO:0055087 | Ski complex(GO:0055087) |
| 0.0 | 0.1 | GO:0008623 | CHRAC(GO:0008623) |
| 0.0 | 0.7 | GO:0001772 | immunological synapse(GO:0001772) |
| 0.0 | 0.1 | GO:0008537 | proteasome activator complex(GO:0008537) |
| 0.0 | 0.1 | GO:0097542 | ciliary tip(GO:0097542) |
| 0.0 | 0.1 | GO:0032021 | NELF complex(GO:0032021) |
| 0.0 | 0.0 | GO:0035354 | Toll-like receptor 1-Toll-like receptor 2 protein complex(GO:0035354) |
| 0.0 | 0.5 | GO:0005801 | cis-Golgi network(GO:0005801) |
| 0.0 | 0.2 | GO:0005915 | zonula adherens(GO:0005915) |
| 0.0 | 0.6 | GO:0016592 | mediator complex(GO:0016592) |
| 0.0 | 0.1 | GO:0008091 | spectrin(GO:0008091) |
| 0.0 | 0.1 | GO:0061700 | GATOR2 complex(GO:0061700) |
| 0.0 | 0.7 | GO:0030173 | integral component of Golgi membrane(GO:0030173) |
| 0.0 | 0.1 | GO:0070652 | HAUS complex(GO:0070652) |
| 0.0 | 0.3 | GO:0030904 | retromer complex(GO:0030904) |
| 0.0 | 0.3 | GO:0002080 | acrosomal membrane(GO:0002080) |
| 0.0 | 0.5 | GO:0043194 | axon initial segment(GO:0043194) |
| 0.0 | 1.4 | GO:0030176 | integral component of endoplasmic reticulum membrane(GO:0030176) |
| 0.0 | 0.2 | GO:0032039 | integrator complex(GO:0032039) |
| 0.0 | 0.0 | GO:0031466 | Cul5-RING ubiquitin ligase complex(GO:0031466) |
| 0.0 | 0.0 | GO:0070939 | Dsl1p complex(GO:0070939) |
| 0.0 | 0.1 | GO:0072487 | MSL complex(GO:0072487) |
| 0.0 | 0.1 | GO:0005672 | transcription factor TFIIA complex(GO:0005672) |
| 0.0 | 0.1 | GO:0097470 | ribbon synapse(GO:0097470) |
| 0.0 | 0.4 | GO:0016235 | aggresome(GO:0016235) |
| 0.0 | 0.1 | GO:0005944 | phosphatidylinositol 3-kinase complex, class IB(GO:0005944) |
| 0.0 | 0.3 | GO:0000502 | proteasome complex(GO:0000502) |
Gene overrepresentation in molecular function category:
| Log-likelihood per target | Total log-likelihood | Term | Description |
|---|---|---|---|
| 0.6 | 2.3 | GO:0036132 | 13-prostaglandin reductase activity(GO:0036132) 15-oxoprostaglandin 13-oxidase activity(GO:0047522) |
| 0.5 | 1.4 | GO:0008177 | succinate dehydrogenase (ubiquinone) activity(GO:0008177) |
| 0.4 | 1.3 | GO:0004813 | alanine-tRNA ligase activity(GO:0004813) |
| 0.4 | 1.7 | GO:0004749 | ribose phosphate diphosphokinase activity(GO:0004749) |
| 0.3 | 1.0 | GO:0036004 | GAF domain binding(GO:0036004) |
| 0.3 | 1.0 | GO:0004731 | purine-nucleoside phosphorylase activity(GO:0004731) |
| 0.3 | 4.0 | GO:0070181 | small ribosomal subunit rRNA binding(GO:0070181) |
| 0.3 | 1.3 | GO:0008260 | 3-oxoacid CoA-transferase activity(GO:0008260) |
| 0.3 | 1.0 | GO:0004756 | selenide, water dikinase activity(GO:0004756) phosphotransferase activity, paired acceptors(GO:0016781) |
| 0.3 | 3.0 | GO:0015288 | porin activity(GO:0015288) |
| 0.3 | 0.9 | GO:0004658 | propionyl-CoA carboxylase activity(GO:0004658) |
| 0.3 | 0.9 | GO:0035730 | S-nitrosoglutathione binding(GO:0035730) dinitrosyl-iron complex binding(GO:0035731) |
| 0.3 | 0.9 | GO:0004821 | histidine-tRNA ligase activity(GO:0004821) |
| 0.3 | 0.9 | GO:0019948 | SUMO activating enzyme activity(GO:0019948) |
| 0.3 | 0.8 | GO:0004088 | carbamoyl-phosphate synthase (ammonia) activity(GO:0004087) carbamoyl-phosphate synthase (glutamine-hydrolyzing) activity(GO:0004088) |
| 0.3 | 0.8 | GO:0046911 | metal chelating activity(GO:0046911) |
| 0.3 | 0.8 | GO:0070039 | rRNA (guanosine-2'-O-)-methyltransferase activity(GO:0070039) |
| 0.3 | 0.8 | GO:0004798 | thymidylate kinase activity(GO:0004798) |
| 0.2 | 0.7 | GO:0015140 | malate transmembrane transporter activity(GO:0015140) |
| 0.2 | 3.2 | GO:0043024 | ribosomal small subunit binding(GO:0043024) |
| 0.2 | 2.3 | GO:0004576 | oligosaccharyl transferase activity(GO:0004576) dolichyl-diphosphooligosaccharide-protein glycotransferase activity(GO:0004579) |
| 0.2 | 1.4 | GO:0004826 | phenylalanine-tRNA ligase activity(GO:0004826) |
| 0.2 | 1.1 | GO:0070051 | fibrinogen binding(GO:0070051) |
| 0.2 | 1.6 | GO:0036402 | proteasome-activating ATPase activity(GO:0036402) |
| 0.2 | 1.1 | GO:0033677 | DNA/RNA helicase activity(GO:0033677) |
| 0.2 | 1.1 | GO:0004719 | protein-L-isoaspartate (D-aspartate) O-methyltransferase activity(GO:0004719) |
| 0.2 | 0.7 | GO:0019797 | procollagen-proline 3-dioxygenase activity(GO:0019797) |
| 0.2 | 0.8 | GO:0031800 | type 3 metabotropic glutamate receptor binding(GO:0031800) |
| 0.2 | 1.4 | GO:0000298 | endopolyphosphatase activity(GO:0000298) diphosphoinositol-polyphosphate diphosphatase activity(GO:0008486) bis(5'-adenosyl)-hexaphosphatase activity(GO:0034431) bis(5'-adenosyl)-pentaphosphatase activity(GO:0034432) |
| 0.2 | 0.8 | GO:0016833 | oxo-acid-lyase activity(GO:0016833) |
| 0.2 | 0.6 | GO:0004739 | pyruvate dehydrogenase (acetyl-transferring) activity(GO:0004739) |
| 0.2 | 0.6 | GO:0004822 | isoleucine-tRNA ligase activity(GO:0004822) |
| 0.2 | 0.6 | GO:0016508 | long-chain-enoyl-CoA hydratase activity(GO:0016508) long-chain-3-hydroxyacyl-CoA dehydrogenase activity(GO:0016509) |
| 0.2 | 0.8 | GO:0004816 | asparagine-tRNA ligase activity(GO:0004816) |
| 0.2 | 0.8 | GO:0030519 | snoRNP binding(GO:0030519) |
| 0.2 | 3.0 | GO:0008097 | 5S rRNA binding(GO:0008097) |
| 0.2 | 0.6 | GO:0004774 | succinate-CoA ligase activity(GO:0004774) |
| 0.2 | 0.6 | GO:0046980 | peptide antigen-transporting ATPase activity(GO:0015433) tapasin binding(GO:0046980) |
| 0.2 | 0.6 | GO:0004660 | protein farnesyltransferase activity(GO:0004660) |
| 0.2 | 0.8 | GO:1990932 | 5.8S rRNA binding(GO:1990932) |
| 0.2 | 0.4 | GO:0030629 | U6 snRNA 3'-end binding(GO:0030629) |
| 0.2 | 0.6 | GO:0033149 | FFAT motif binding(GO:0033149) |
| 0.2 | 1.3 | GO:0002135 | CTP binding(GO:0002135) |
| 0.2 | 6.0 | GO:0003954 | NADH dehydrogenase activity(GO:0003954) |
| 0.2 | 1.4 | GO:0071074 | eukaryotic initiation factor eIF2 binding(GO:0071074) |
| 0.2 | 1.6 | GO:0034452 | dynactin binding(GO:0034452) |
| 0.2 | 0.5 | GO:0016900 | oxidoreductase activity, acting on the CH-OH group of donors, disulfide as acceptor(GO:0016900) vitamin-K-epoxide reductase (warfarin-sensitive) activity(GO:0047057) |
| 0.2 | 0.4 | GO:0016435 | rRNA (guanine) methyltransferase activity(GO:0016435) |
| 0.2 | 0.7 | GO:0008160 | protein tyrosine phosphatase activator activity(GO:0008160) |
| 0.2 | 1.0 | GO:0048408 | epidermal growth factor binding(GO:0048408) |
| 0.2 | 0.7 | GO:0004450 | isocitrate dehydrogenase (NADP+) activity(GO:0004450) |
| 0.2 | 0.8 | GO:0043891 | glyceraldehyde-3-phosphate dehydrogenase (NAD+) (phosphorylating) activity(GO:0004365) glyceraldehyde-3-phosphate dehydrogenase (NAD(P)+) (phosphorylating) activity(GO:0043891) |
| 0.2 | 30.5 | GO:0003735 | structural constituent of ribosome(GO:0003735) |
| 0.2 | 0.7 | GO:0072541 | peroxynitrite reductase activity(GO:0072541) |
| 0.2 | 0.5 | GO:0004001 | adenosine kinase activity(GO:0004001) |
| 0.2 | 0.8 | GO:0071987 | WD40-repeat domain binding(GO:0071987) |
| 0.2 | 3.0 | GO:0046933 | proton-transporting ATP synthase activity, rotational mechanism(GO:0046933) |
| 0.2 | 2.0 | GO:0001054 | RNA polymerase I activity(GO:0001054) |
| 0.2 | 0.6 | GO:0042978 | ornithine decarboxylase activator activity(GO:0042978) |
| 0.2 | 1.1 | GO:0004523 | RNA-DNA hybrid ribonuclease activity(GO:0004523) |
| 0.1 | 0.4 | GO:0004512 | inositol-3-phosphate synthase activity(GO:0004512) intramolecular lyase activity(GO:0016872) |
| 0.1 | 1.0 | GO:0004090 | carbonyl reductase (NADPH) activity(GO:0004090) |
| 0.1 | 1.7 | GO:1990715 | mRNA CDS binding(GO:1990715) |
| 0.1 | 2.1 | GO:0046977 | TAP binding(GO:0046977) |
| 0.1 | 0.4 | GO:0030911 | TPR domain binding(GO:0030911) |
| 0.1 | 0.8 | GO:0005047 | signal recognition particle binding(GO:0005047) |
| 0.1 | 0.7 | GO:0004430 | 1-phosphatidylinositol 4-kinase activity(GO:0004430) |
| 0.1 | 0.4 | GO:0002161 | aminoacyl-tRNA editing activity(GO:0002161) |
| 0.1 | 0.5 | GO:0033906 | hyaluronoglucuronidase activity(GO:0033906) |
| 0.1 | 0.5 | GO:0042806 | fucose binding(GO:0042806) |
| 0.1 | 0.7 | GO:0003857 | 3-hydroxyacyl-CoA dehydrogenase activity(GO:0003857) |
| 0.1 | 0.7 | GO:0004743 | pyruvate kinase activity(GO:0004743) |
| 0.1 | 1.4 | GO:0008379 | thioredoxin peroxidase activity(GO:0008379) |
| 0.1 | 0.7 | GO:0004735 | pyrroline-5-carboxylate reductase activity(GO:0004735) |
| 0.1 | 1.8 | GO:0008649 | rRNA methyltransferase activity(GO:0008649) |
| 0.1 | 0.8 | GO:0016728 | ribonucleoside-diphosphate reductase activity, thioredoxin disulfide as acceptor(GO:0004748) oxidoreductase activity, acting on CH or CH2 groups, disulfide as acceptor(GO:0016728) ribonucleoside-diphosphate reductase activity(GO:0061731) |
| 0.1 | 0.7 | GO:0008467 | [heparan sulfate]-glucosamine 3-sulfotransferase 1 activity(GO:0008467) |
| 0.1 | 1.1 | GO:0004768 | stearoyl-CoA 9-desaturase activity(GO:0004768) |
| 0.1 | 3.1 | GO:0070003 | threonine-type endopeptidase activity(GO:0004298) threonine-type peptidase activity(GO:0070003) |
| 0.1 | 0.5 | GO:0016842 | amidine-lyase activity(GO:0016842) |
| 0.1 | 0.7 | GO:0061575 | cyclin-dependent protein serine/threonine kinase activator activity(GO:0061575) |
| 0.1 | 0.1 | GO:0004145 | diamine N-acetyltransferase activity(GO:0004145) |
| 0.1 | 0.3 | GO:0030943 | mitochondrion targeting sequence binding(GO:0030943) |
| 0.1 | 1.1 | GO:0043184 | vascular endothelial growth factor receptor 2 binding(GO:0043184) |
| 0.1 | 0.6 | GO:0008475 | procollagen-lysine 5-dioxygenase activity(GO:0008475) |
| 0.1 | 1.0 | GO:0016936 | galactoside binding(GO:0016936) |
| 0.1 | 0.7 | GO:0004784 | superoxide dismutase activity(GO:0004784) oxidoreductase activity, acting on superoxide radicals as acceptor(GO:0016721) |
| 0.1 | 0.3 | GO:0035539 | 8-oxo-7,8-dihydroguanosine triphosphate pyrophosphatase activity(GO:0008413) 8-oxo-7,8-dihydrodeoxyguanosine triphosphate pyrophosphatase activity(GO:0035539) |
| 0.1 | 0.3 | GO:0008493 | tetracycline transporter activity(GO:0008493) |
| 0.1 | 0.4 | GO:0003998 | acylphosphatase activity(GO:0003998) |
| 0.1 | 0.5 | GO:0042610 | CD8 receptor binding(GO:0042610) |
| 0.1 | 0.4 | GO:0004427 | inorganic diphosphatase activity(GO:0004427) |
| 0.1 | 0.3 | GO:0005157 | macrophage colony-stimulating factor receptor binding(GO:0005157) |
| 0.1 | 0.5 | GO:0004563 | beta-N-acetylhexosaminidase activity(GO:0004563) |
| 0.1 | 1.0 | GO:0035368 | selenocysteine insertion sequence binding(GO:0035368) |
| 0.1 | 0.3 | GO:0031370 | eukaryotic initiation factor 4G binding(GO:0031370) |
| 0.1 | 0.4 | GO:0002153 | steroid receptor RNA activator RNA binding(GO:0002153) |
| 0.1 | 0.3 | GO:0042895 | antibiotic transporter activity(GO:0042895) |
| 0.1 | 0.3 | GO:0003963 | RNA-3'-phosphate cyclase activity(GO:0003963) |
| 0.1 | 0.3 | GO:0047756 | chondroitin 4-sulfotransferase activity(GO:0047756) |
| 0.1 | 0.9 | GO:0051575 | 5'-deoxyribose-5-phosphate lyase activity(GO:0051575) |
| 0.1 | 0.3 | GO:0035870 | dITP diphosphatase activity(GO:0035870) |
| 0.1 | 0.8 | GO:0016681 | ubiquinol-cytochrome-c reductase activity(GO:0008121) oxidoreductase activity, acting on diphenols and related substances as donors, cytochrome as acceptor(GO:0016681) |
| 0.1 | 0.5 | GO:0044547 | DNA topoisomerase binding(GO:0044547) |
| 0.1 | 0.4 | GO:0005093 | Rab GDP-dissociation inhibitor activity(GO:0005093) |
| 0.1 | 0.3 | GO:0070540 | stearic acid binding(GO:0070540) |
| 0.1 | 0.4 | GO:0031208 | POZ domain binding(GO:0031208) |
| 0.1 | 0.3 | GO:0019153 | protein-disulfide reductase (glutathione) activity(GO:0019153) |
| 0.1 | 0.3 | GO:0004019 | adenylosuccinate synthase activity(GO:0004019) |
| 0.1 | 0.3 | GO:0015292 | uniporter activity(GO:0015292) |
| 0.1 | 1.2 | GO:1990825 | sequence-specific mRNA binding(GO:1990825) |
| 0.1 | 0.3 | GO:0003826 | alpha-ketoacid dehydrogenase activity(GO:0003826) 3-methyl-2-oxobutanoate dehydrogenase (2-methylpropanoyl-transferring) activity(GO:0003863) |
| 0.1 | 0.4 | GO:0003976 | UDP-N-acetylglucosamine-lysosomal-enzyme N-acetylglucosaminephosphotransferase activity(GO:0003976) |
| 0.1 | 5.8 | GO:0003743 | translation initiation factor activity(GO:0003743) |
| 0.1 | 0.4 | GO:0019970 | interleukin-11 receptor activity(GO:0004921) interleukin-11 binding(GO:0019970) |
| 0.1 | 0.6 | GO:0003985 | acetyl-CoA C-acetyltransferase activity(GO:0003985) C-acetyltransferase activity(GO:0016453) |
| 0.1 | 0.6 | GO:0004614 | phosphoglucomutase activity(GO:0004614) |
| 0.1 | 0.6 | GO:0046912 | transferase activity, transferring acyl groups, acyl groups converted into alkyl on transfer(GO:0046912) |
| 0.1 | 0.5 | GO:0004652 | polynucleotide adenylyltransferase activity(GO:0004652) |
| 0.1 | 0.6 | GO:0015091 | ferric iron transmembrane transporter activity(GO:0015091) trivalent inorganic cation transmembrane transporter activity(GO:0072510) |
| 0.1 | 0.4 | GO:0008176 | tRNA (guanine-N7-)-methyltransferase activity(GO:0008176) |
| 0.1 | 0.5 | GO:0005172 | vascular endothelial growth factor receptor binding(GO:0005172) |
| 0.1 | 0.4 | GO:0044020 | histone methyltransferase activity (H4-R3 specific)(GO:0044020) |
| 0.1 | 0.3 | GO:0047316 | L-phenylalanine:pyruvate aminotransferase activity(GO:0047312) glutamine-phenylpyruvate transaminase activity(GO:0047316) L-glutamine:pyruvate aminotransferase activity(GO:0047945) |
| 0.1 | 0.5 | GO:0019770 | IgG receptor activity(GO:0019770) |
| 0.1 | 0.6 | GO:0050833 | pyruvate transmembrane transporter activity(GO:0050833) |
| 0.1 | 0.5 | GO:0097016 | L27 domain binding(GO:0097016) |
| 0.1 | 0.6 | GO:0004849 | uridine kinase activity(GO:0004849) |
| 0.1 | 0.3 | GO:0030627 | pre-mRNA 5'-splice site binding(GO:0030627) |
| 0.1 | 0.3 | GO:0008124 | 4-alpha-hydroxytetrahydrobiopterin dehydratase activity(GO:0008124) |
| 0.1 | 0.3 | GO:0017150 | tRNA dihydrouridine synthase activity(GO:0017150) |
| 0.1 | 0.2 | GO:0033592 | RNA strand annealing activity(GO:0033592) |
| 0.1 | 0.3 | GO:0004329 | formate-tetrahydrofolate ligase activity(GO:0004329) |
| 0.1 | 0.2 | GO:0046403 | polynucleotide 3'-phosphatase activity(GO:0046403) |
| 0.1 | 0.6 | GO:0070883 | pre-miRNA binding(GO:0070883) |
| 0.1 | 0.8 | GO:0051870 | methotrexate binding(GO:0051870) |
| 0.1 | 0.4 | GO:0004525 | ribonuclease III activity(GO:0004525) double-stranded RNA-specific ribonuclease activity(GO:0032296) |
| 0.1 | 0.2 | GO:0033858 | N-acetylgalactosamine kinase activity(GO:0033858) |
| 0.1 | 0.2 | GO:0001888 | glucuronyl-galactosyl-proteoglycan 4-alpha-N-acetylglucosaminyltransferase activity(GO:0001888) |
| 0.1 | 0.8 | GO:0051434 | BH3 domain binding(GO:0051434) |
| 0.1 | 0.2 | GO:0004174 | electron-transferring-flavoprotein dehydrogenase activity(GO:0004174) oxidoreductase activity, acting on the CH-NH group of donors, quinone or similar compound as acceptor(GO:0016649) |
| 0.1 | 0.2 | GO:0003999 | adenine binding(GO:0002055) adenine phosphoribosyltransferase activity(GO:0003999) |
| 0.1 | 0.2 | GO:0015173 | aromatic amino acid transmembrane transporter activity(GO:0015173) |
| 0.1 | 1.2 | GO:0015037 | peptide disulfide oxidoreductase activity(GO:0015037) |
| 0.1 | 0.1 | GO:0016401 | acyl-CoA oxidase activity(GO:0003997) palmitoyl-CoA oxidase activity(GO:0016401) |
| 0.1 | 0.3 | GO:0034437 | glycoprotein transporter activity(GO:0034437) |
| 0.1 | 0.6 | GO:0004568 | chitinase activity(GO:0004568) |
| 0.1 | 0.8 | GO:1901612 | cardiolipin binding(GO:1901612) |
| 0.1 | 0.2 | GO:0004829 | threonine-tRNA ligase activity(GO:0004829) |
| 0.1 | 0.3 | GO:0071208 | histone pre-mRNA DCP binding(GO:0071208) |
| 0.1 | 1.4 | GO:0003688 | DNA replication origin binding(GO:0003688) |
| 0.1 | 0.3 | GO:1904121 | propanoyl-CoA C-acyltransferase activity(GO:0033814) propionyl-CoA C2-trimethyltridecanoyltransferase activity(GO:0050632) phosphatidylethanolamine transporter activity(GO:1904121) |
| 0.1 | 0.2 | GO:0035851 | Krueppel-associated box domain binding(GO:0035851) |
| 0.1 | 0.2 | GO:0003881 | CDP-diacylglycerol-inositol 3-phosphatidyltransferase activity(GO:0003881) |
| 0.1 | 0.4 | GO:0017077 | oxidative phosphorylation uncoupler activity(GO:0017077) |
| 0.1 | 0.2 | GO:0042282 | hydroxymethylglutaryl-CoA reductase (NADPH) activity(GO:0004420) hydroxymethylglutaryl-CoA reductase activity(GO:0042282) |
| 0.1 | 0.2 | GO:0031753 | endothelial differentiation G-protein coupled receptor binding(GO:0031753) Edg-2 lysophosphatidic acid receptor binding(GO:0031755) |
| 0.1 | 0.4 | GO:0004814 | arginine-tRNA ligase activity(GO:0004814) |
| 0.1 | 0.7 | GO:0004526 | ribonuclease P activity(GO:0004526) |
| 0.1 | 0.5 | GO:0004769 | steroid delta-isomerase activity(GO:0004769) |
| 0.1 | 0.4 | GO:0004301 | epoxide hydrolase activity(GO:0004301) |
| 0.1 | 0.6 | GO:0002151 | G-quadruplex RNA binding(GO:0002151) |
| 0.1 | 0.7 | GO:0019788 | NEDD8 transferase activity(GO:0019788) |
| 0.1 | 0.1 | GO:0008525 | phosphatidylcholine transporter activity(GO:0008525) |
| 0.1 | 0.2 | GO:0015152 | glucose-6-phosphate transmembrane transporter activity(GO:0015152) |
| 0.1 | 0.4 | GO:0004142 | diacylglycerol cholinephosphotransferase activity(GO:0004142) |
| 0.1 | 0.4 | GO:0003880 | protein C-terminal carboxyl O-methyltransferase activity(GO:0003880) |
| 0.1 | 0.2 | GO:0047936 | glucose 1-dehydrogenase [NAD(P)] activity(GO:0047936) |
| 0.1 | 0.2 | GO:0004948 | calcitonin receptor activity(GO:0004948) |
| 0.1 | 0.2 | GO:0047661 | racemase and epimerase activity, acting on amino acids and derivatives(GO:0016855) racemase activity, acting on amino acids and derivatives(GO:0036361) amino-acid racemase activity(GO:0047661) |
| 0.1 | 0.2 | GO:0004572 | mannosyl-oligosaccharide 1,3-1,6-alpha-mannosidase activity(GO:0004572) |
| 0.1 | 0.4 | GO:0001165 | RNA polymerase I upstream control element sequence-specific DNA binding(GO:0001165) |
| 0.1 | 0.2 | GO:0051185 | coenzyme transporter activity(GO:0051185) |
| 0.1 | 1.1 | GO:1990226 | histone methyltransferase binding(GO:1990226) |
| 0.1 | 0.7 | GO:0008474 | palmitoyl-(protein) hydrolase activity(GO:0008474) palmitoyl hydrolase activity(GO:0098599) |
| 0.1 | 1.6 | GO:0003746 | translation elongation factor activity(GO:0003746) |
| 0.1 | 0.1 | GO:0043532 | angiostatin binding(GO:0043532) |
| 0.1 | 0.2 | GO:0004488 | methenyltetrahydrofolate cyclohydrolase activity(GO:0004477) methylenetetrahydrofolate dehydrogenase (NAD+) activity(GO:0004487) methylenetetrahydrofolate dehydrogenase (NADP+) activity(GO:0004488) |
| 0.1 | 0.3 | GO:0004809 | tRNA (guanine-N2-)-methyltransferase activity(GO:0004809) |
| 0.1 | 0.4 | GO:0005134 | interleukin-2 receptor binding(GO:0005134) |
| 0.1 | 1.9 | GO:0016875 | aminoacyl-tRNA ligase activity(GO:0004812) ligase activity, forming carbon-oxygen bonds(GO:0016875) ligase activity, forming aminoacyl-tRNA and related compounds(GO:0016876) |
| 0.1 | 0.4 | GO:0004359 | glutaminase activity(GO:0004359) |
| 0.1 | 1.1 | GO:0031386 | protein tag(GO:0031386) |
| 0.1 | 0.7 | GO:0016861 | intramolecular oxidoreductase activity, interconverting aldoses and ketoses(GO:0016861) |
| 0.1 | 0.3 | GO:0003696 | satellite DNA binding(GO:0003696) |
| 0.1 | 0.3 | GO:0004839 | ubiquitin activating enzyme activity(GO:0004839) |
| 0.1 | 0.5 | GO:0003923 | GPI-anchor transamidase activity(GO:0003923) |
| 0.1 | 0.3 | GO:1904408 | dihydronicotinamide riboside quinone reductase activity(GO:0001512) melatonin binding(GO:1904408) |
| 0.1 | 0.4 | GO:0008479 | queuine tRNA-ribosyltransferase activity(GO:0008479) |
| 0.1 | 0.4 | GO:1990446 | U1 snRNP binding(GO:1990446) |
| 0.1 | 0.2 | GO:0004611 | phosphoenolpyruvate carboxykinase activity(GO:0004611) phosphoenolpyruvate carboxykinase (GTP) activity(GO:0004613) |
| 0.1 | 0.3 | GO:0052901 | polyamine oxidase activity(GO:0046592) spermine:oxygen oxidoreductase (spermidine-forming) activity(GO:0052901) |
| 0.1 | 0.4 | GO:0047276 | N-acetyllactosaminide 3-alpha-galactosyltransferase activity(GO:0047276) |
| 0.1 | 0.4 | GO:0016421 | CoA carboxylase activity(GO:0016421) |
| 0.1 | 0.3 | GO:0046923 | ER retention sequence binding(GO:0046923) |
| 0.1 | 0.4 | GO:0008384 | IkappaB kinase activity(GO:0008384) |
| 0.1 | 0.3 | GO:0004051 | arachidonate 5-lipoxygenase activity(GO:0004051) |
| 0.1 | 0.3 | GO:0004758 | serine C-palmitoyltransferase activity(GO:0004758) C-palmitoyltransferase activity(GO:0016454) |
| 0.1 | 0.5 | GO:0004726 | non-membrane spanning protein tyrosine phosphatase activity(GO:0004726) |
| 0.1 | 0.2 | GO:0036461 | BLOC-2 complex binding(GO:0036461) |
| 0.1 | 0.2 | GO:0009918 | sterol delta7 reductase activity(GO:0009918) 7-dehydrocholesterol reductase activity(GO:0047598) |
| 0.1 | 0.3 | GO:0000700 | mismatch base pair DNA N-glycosylase activity(GO:0000700) |
| 0.1 | 0.1 | GO:0030337 | DNA polymerase processivity factor activity(GO:0030337) |
| 0.1 | 0.3 | GO:0052796 | exo-alpha-sialidase activity(GO:0004308) alpha-sialidase activity(GO:0016997) exo-alpha-(2->3)-sialidase activity(GO:0052794) exo-alpha-(2->6)-sialidase activity(GO:0052795) exo-alpha-(2->8)-sialidase activity(GO:0052796) |
| 0.1 | 0.3 | GO:0004724 | magnesium-dependent protein serine/threonine phosphatase activity(GO:0004724) |
| 0.1 | 0.4 | GO:0052650 | NADP-retinol dehydrogenase activity(GO:0052650) |
| 0.1 | 1.1 | GO:0009982 | pseudouridine synthase activity(GO:0009982) |
| 0.1 | 0.1 | GO:0008410 | CoA-transferase activity(GO:0008410) |
| 0.1 | 0.5 | GO:0046974 | histone methyltransferase activity (H3-K9 specific)(GO:0046974) |
| 0.1 | 0.6 | GO:0000774 | adenyl-nucleotide exchange factor activity(GO:0000774) |
| 0.1 | 0.5 | GO:1990829 | C-rich single-stranded DNA binding(GO:1990829) |
| 0.1 | 0.9 | GO:0016864 | protein disulfide isomerase activity(GO:0003756) intramolecular oxidoreductase activity, transposing S-S bonds(GO:0016864) |
| 0.1 | 0.7 | GO:0016783 | sulfurtransferase activity(GO:0016783) |
| 0.1 | 0.2 | GO:0016206 | catechol O-methyltransferase activity(GO:0016206) |
| 0.1 | 0.2 | GO:0008532 | N-acetyllactosaminide beta-1,3-N-acetylglucosaminyltransferase activity(GO:0008532) |
| 0.1 | 0.3 | GO:0004382 | guanosine-diphosphatase activity(GO:0004382) |
| 0.1 | 0.2 | GO:0008967 | phosphoglycolate phosphatase activity(GO:0008967) |
| 0.1 | 0.5 | GO:0004300 | enoyl-CoA hydratase activity(GO:0004300) |
| 0.1 | 1.4 | GO:0019843 | rRNA binding(GO:0019843) |
| 0.1 | 0.6 | GO:0042500 | aspartic endopeptidase activity, intramembrane cleaving(GO:0042500) |
| 0.1 | 0.4 | GO:0030628 | pre-mRNA 3'-splice site binding(GO:0030628) |
| 0.1 | 0.2 | GO:0008113 | peptide-methionine (S)-S-oxide reductase activity(GO:0008113) |
| 0.1 | 0.2 | GO:0004616 | phosphogluconate dehydrogenase (decarboxylating) activity(GO:0004616) |
| 0.1 | 0.2 | GO:0016890 | site-specific endodeoxyribonuclease activity, specific for altered base(GO:0016890) |
| 0.1 | 0.4 | GO:0000099 | sulfur amino acid transmembrane transporter activity(GO:0000099) |
| 0.1 | 1.2 | GO:0016805 | dipeptidase activity(GO:0016805) |
| 0.1 | 0.3 | GO:0070404 | NADH binding(GO:0070404) |
| 0.1 | 0.4 | GO:0043199 | sulfate binding(GO:0043199) |
| 0.1 | 0.3 | GO:0005143 | interleukin-12 receptor binding(GO:0005143) |
| 0.1 | 0.4 | GO:0019784 | NEDD8-specific protease activity(GO:0019784) |
| 0.1 | 0.5 | GO:0001075 | transcription factor activity, RNA polymerase II core promoter sequence-specific binding involved in preinitiation complex assembly(GO:0001075) |
| 0.1 | 0.2 | GO:0008199 | ferric iron binding(GO:0008199) |
| 0.1 | 0.2 | GO:0034235 | GPI anchor binding(GO:0034235) |
| 0.1 | 0.2 | GO:0061628 | H3K27me3 modified histone binding(GO:0061628) |
| 0.1 | 2.1 | GO:0004364 | glutathione transferase activity(GO:0004364) |
| 0.1 | 0.2 | GO:0046573 | lactonohydrolase activity(GO:0046573) acyl-L-homoserine-lactone lactonohydrolase activity(GO:0102007) |
| 0.1 | 0.2 | GO:0019136 | deoxynucleoside kinase activity(GO:0019136) |
| 0.1 | 0.4 | GO:0044729 | hemi-methylated DNA-binding(GO:0044729) |
| 0.1 | 0.3 | GO:0035252 | UDP-xylosyltransferase activity(GO:0035252) |
| 0.0 | 0.3 | GO:1990050 | phosphatidic acid transporter activity(GO:1990050) |
| 0.0 | 0.1 | GO:0055056 | D-glucose transmembrane transporter activity(GO:0055056) |
| 0.0 | 0.3 | GO:0003938 | IMP dehydrogenase activity(GO:0003938) |
| 0.0 | 0.5 | GO:0016423 | tRNA (guanine) methyltransferase activity(GO:0016423) |
| 0.0 | 0.5 | GO:0003796 | lysozyme activity(GO:0003796) |
| 0.0 | 0.1 | GO:0031177 | phosphopantetheine binding(GO:0031177) |
| 0.0 | 1.2 | GO:0008253 | 5'-nucleotidase activity(GO:0008253) |
| 0.0 | 0.3 | GO:0032405 | MutLalpha complex binding(GO:0032405) |
| 0.0 | 0.1 | GO:0051538 | 3 iron, 4 sulfur cluster binding(GO:0051538) |
| 0.0 | 0.6 | GO:0016846 | carbon-sulfur lyase activity(GO:0016846) |
| 0.0 | 0.5 | GO:0003909 | DNA ligase activity(GO:0003909) DNA ligase (ATP) activity(GO:0003910) |
| 0.0 | 0.1 | GO:0004560 | alpha-L-fucosidase activity(GO:0004560) fucosidase activity(GO:0015928) |
| 0.0 | 1.8 | GO:0044183 | protein binding involved in protein folding(GO:0044183) |
| 0.0 | 0.1 | GO:0004008 | copper-exporting ATPase activity(GO:0004008) copper-transporting ATPase activity(GO:0043682) |
| 0.0 | 1.1 | GO:0070628 | proteasome binding(GO:0070628) |
| 0.0 | 0.2 | GO:0070991 | medium-chain-acyl-CoA dehydrogenase activity(GO:0070991) |
| 0.0 | 0.1 | GO:0010698 | acetyltransferase activator activity(GO:0010698) |
| 0.0 | 0.4 | GO:0052629 | phosphatidylinositol-3,5-bisphosphate 3-phosphatase activity(GO:0052629) |
| 0.0 | 0.8 | GO:0004033 | aldo-keto reductase (NADP) activity(GO:0004033) |
| 0.0 | 0.2 | GO:0070326 | very-low-density lipoprotein particle receptor binding(GO:0070326) |
| 0.0 | 0.2 | GO:0043812 | phosphatidylinositol-4-phosphate phosphatase activity(GO:0043812) |
| 0.0 | 1.1 | GO:0005351 | sugar:proton symporter activity(GO:0005351) |
| 0.0 | 0.2 | GO:0051021 | GDP-dissociation inhibitor binding(GO:0051021) |
| 0.0 | 0.1 | GO:0047134 | protein-disulfide reductase activity(GO:0047134) |
| 0.0 | 1.0 | GO:0017127 | cholesterol transporter activity(GO:0017127) |
| 0.0 | 0.2 | GO:0004982 | N-formyl peptide receptor activity(GO:0004982) |
| 0.0 | 0.1 | GO:0005017 | platelet-derived growth factor-activated receptor activity(GO:0005017) |
| 0.0 | 0.2 | GO:0004045 | aminoacyl-tRNA hydrolase activity(GO:0004045) |
| 0.0 | 0.2 | GO:0033797 | selenate reductase activity(GO:0033797) |
| 0.0 | 3.3 | GO:0051082 | unfolded protein binding(GO:0051082) |
| 0.0 | 0.3 | GO:0052654 | branched-chain-amino-acid transaminase activity(GO:0004084) L-leucine transaminase activity(GO:0052654) L-valine transaminase activity(GO:0052655) L-isoleucine transaminase activity(GO:0052656) |
| 0.0 | 0.3 | GO:0019808 | polyamine binding(GO:0019808) |
| 0.0 | 0.6 | GO:0051400 | BH domain binding(GO:0051400) |
| 0.0 | 0.5 | GO:0005347 | ATP transmembrane transporter activity(GO:0005347) ADP transmembrane transporter activity(GO:0015217) |
| 0.0 | 0.8 | GO:0004861 | cyclin-dependent protein serine/threonine kinase inhibitor activity(GO:0004861) |
| 0.0 | 1.2 | GO:0051537 | 2 iron, 2 sulfur cluster binding(GO:0051537) |
| 0.0 | 0.7 | GO:0016500 | protein-hormone receptor activity(GO:0016500) |
| 0.0 | 3.0 | GO:0004722 | protein serine/threonine phosphatase activity(GO:0004722) |
| 0.0 | 0.3 | GO:0004865 | protein serine/threonine phosphatase inhibitor activity(GO:0004865) |
| 0.0 | 0.8 | GO:0015926 | glucosidase activity(GO:0015926) |
| 0.0 | 0.1 | GO:0030622 | U4atac snRNA binding(GO:0030622) |
| 0.0 | 0.2 | GO:0030144 | alpha-1,6-mannosylglycoprotein 6-beta-N-acetylglucosaminyltransferase activity(GO:0030144) |
| 0.0 | 0.2 | GO:0043023 | ribosomal large subunit binding(GO:0043023) |
| 0.0 | 0.4 | GO:0035184 | histone threonine kinase activity(GO:0035184) |
| 0.0 | 1.4 | GO:0050750 | low-density lipoprotein particle receptor binding(GO:0050750) |
| 0.0 | 1.3 | GO:0071949 | FAD binding(GO:0071949) |
| 0.0 | 0.2 | GO:0004668 | protein-arginine deiminase activity(GO:0004668) |
| 0.0 | 1.9 | GO:0009055 | electron carrier activity(GO:0009055) |
| 0.0 | 0.4 | GO:0034450 | ubiquitin-ubiquitin ligase activity(GO:0034450) |
| 0.0 | 0.5 | GO:0031628 | opioid receptor binding(GO:0031628) |
| 0.0 | 0.6 | GO:0031432 | titin binding(GO:0031432) |
| 0.0 | 2.0 | GO:0019003 | GDP binding(GO:0019003) |
| 0.0 | 0.2 | GO:0015129 | lactate transmembrane transporter activity(GO:0015129) |
| 0.0 | 1.6 | GO:0015020 | glucuronosyltransferase activity(GO:0015020) |
| 0.0 | 1.6 | GO:0016765 | transferase activity, transferring alkyl or aryl (other than methyl) groups(GO:0016765) |
| 0.0 | 0.2 | GO:0030156 | benzodiazepine receptor binding(GO:0030156) |
| 0.0 | 0.3 | GO:0030235 | nitric-oxide synthase regulator activity(GO:0030235) |
| 0.0 | 0.2 | GO:0004452 | isopentenyl-diphosphate delta-isomerase activity(GO:0004452) |
| 0.0 | 3.1 | GO:0051087 | chaperone binding(GO:0051087) |
| 0.0 | 0.2 | GO:0005052 | peroxisome matrix targeting signal-1 binding(GO:0005052) |
| 0.0 | 0.2 | GO:0033188 | sphingomyelin synthase activity(GO:0033188) ceramide cholinephosphotransferase activity(GO:0047493) |
| 0.0 | 0.2 | GO:0003960 | NADPH:quinone reductase activity(GO:0003960) |
| 0.0 | 0.1 | GO:0019776 | Atg8 ligase activity(GO:0019776) |
| 0.0 | 1.2 | GO:0046961 | proton-transporting ATPase activity, rotational mechanism(GO:0046961) |
| 0.0 | 1.3 | GO:0004003 | ATP-dependent DNA helicase activity(GO:0004003) |
| 0.0 | 0.3 | GO:0043515 | kinetochore binding(GO:0043515) |
| 0.0 | 1.4 | GO:0031492 | nucleosomal DNA binding(GO:0031492) |
| 0.0 | 0.1 | GO:0016422 | mRNA (2'-O-methyladenosine-N6-)-methyltransferase activity(GO:0016422) |
| 0.0 | 0.2 | GO:0030292 | protein tyrosine kinase inhibitor activity(GO:0030292) |
| 0.0 | 1.0 | GO:0004622 | lysophospholipase activity(GO:0004622) |
| 0.0 | 0.3 | GO:0004366 | glycerol-3-phosphate O-acyltransferase activity(GO:0004366) |
| 0.0 | 0.4 | GO:0030346 | protein phosphatase 2B binding(GO:0030346) |
| 0.0 | 0.2 | GO:1990381 | ubiquitin-specific protease binding(GO:1990381) |
| 0.0 | 1.7 | GO:0003755 | peptidyl-prolyl cis-trans isomerase activity(GO:0003755) |
| 0.0 | 0.6 | GO:0055106 | ligase regulator activity(GO:0055103) ubiquitin-protein transferase regulator activity(GO:0055106) |
| 0.0 | 0.2 | GO:0000213 | tRNA-intron endonuclease activity(GO:0000213) |
| 0.0 | 0.1 | GO:0003883 | CTP synthase activity(GO:0003883) |
| 0.0 | 0.6 | GO:0043560 | insulin receptor substrate binding(GO:0043560) |
| 0.0 | 0.1 | GO:0086038 | calcium:sodium antiporter activity involved in regulation of cardiac muscle cell membrane potential(GO:0086038) |
| 0.0 | 0.3 | GO:0005094 | Rho GDP-dissociation inhibitor activity(GO:0005094) |
| 0.0 | 0.3 | GO:0004416 | hydroxyacylglutathione hydrolase activity(GO:0004416) |
| 0.0 | 0.3 | GO:0004791 | thioredoxin-disulfide reductase activity(GO:0004791) |
| 0.0 | 0.2 | GO:0015226 | amino-acid betaine transmembrane transporter activity(GO:0015199) carnitine transmembrane transporter activity(GO:0015226) |
| 0.0 | 0.4 | GO:0004459 | L-lactate dehydrogenase activity(GO:0004459) |
| 0.0 | 0.1 | GO:0071796 | K6-linked polyubiquitin binding(GO:0071796) |
| 0.0 | 1.1 | GO:0004012 | phospholipid-translocating ATPase activity(GO:0004012) |
| 0.0 | 0.6 | GO:0035174 | histone serine kinase activity(GO:0035174) |
| 0.0 | 0.2 | GO:0003872 | 6-phosphofructokinase activity(GO:0003872) |
| 0.0 | 0.1 | GO:0003977 | UDP-N-acetylglucosamine diphosphorylase activity(GO:0003977) |
| 0.0 | 0.8 | GO:0098641 | cadherin binding involved in cell-cell adhesion(GO:0098641) |
| 0.0 | 0.1 | GO:0004176 | ATP-dependent peptidase activity(GO:0004176) |
| 0.0 | 0.1 | GO:0016230 | sphingomyelin phosphodiesterase activator activity(GO:0016230) |
| 0.0 | 0.1 | GO:0005457 | GDP-fucose transmembrane transporter activity(GO:0005457) purine nucleotide-sugar transmembrane transporter activity(GO:0036080) |
| 0.0 | 0.2 | GO:0005173 | stem cell factor receptor binding(GO:0005173) |
| 0.0 | 0.5 | GO:0031418 | L-ascorbic acid binding(GO:0031418) |
| 0.0 | 0.9 | GO:0031489 | myosin V binding(GO:0031489) |
| 0.0 | 0.5 | GO:0023026 | MHC class II protein complex binding(GO:0023026) |
| 0.0 | 0.1 | GO:0008476 | protein-tyrosine sulfotransferase activity(GO:0008476) |
| 0.0 | 0.1 | GO:0005168 | neurotrophin TRKA receptor binding(GO:0005168) |
| 0.0 | 0.5 | GO:0016929 | SUMO-specific protease activity(GO:0016929) |
| 0.0 | 0.2 | GO:0051032 | nucleic acid transmembrane transporter activity(GO:0051032) RNA transmembrane transporter activity(GO:0051033) |
| 0.0 | 0.2 | GO:0046624 | sphingolipid transporter activity(GO:0046624) |
| 0.0 | 0.3 | GO:0043142 | single-stranded DNA-dependent ATPase activity(GO:0043142) |
| 0.0 | 0.4 | GO:0019911 | structural constituent of myelin sheath(GO:0019911) |
| 0.0 | 0.4 | GO:0071933 | Arp2/3 complex binding(GO:0071933) |
| 0.0 | 0.1 | GO:0005345 | purine nucleobase transmembrane transporter activity(GO:0005345) pyrimidine nucleobase transmembrane transporter activity(GO:0005350) nucleobase transmembrane transporter activity(GO:0015205) |
| 0.0 | 0.1 | GO:1990460 | leptin receptor binding(GO:1990460) |
| 0.0 | 0.2 | GO:0030550 | acetylcholine receptor inhibitor activity(GO:0030550) |
| 0.0 | 0.1 | GO:0016838 | carbon-oxygen lyase activity, acting on phosphates(GO:0016838) |
| 0.0 | 0.3 | GO:0046527 | glucosyltransferase activity(GO:0046527) |
| 0.0 | 0.2 | GO:0003839 | gamma-glutamylcyclotransferase activity(GO:0003839) |
| 0.0 | 0.1 | GO:0004448 | isocitrate dehydrogenase activity(GO:0004448) isocitrate dehydrogenase (NAD+) activity(GO:0004449) |
| 0.0 | 0.1 | GO:0004345 | glucose-6-phosphate dehydrogenase activity(GO:0004345) |
| 0.0 | 0.4 | GO:0047391 | alkylglycerophosphoethanolamine phosphodiesterase activity(GO:0047391) |
| 0.0 | 0.6 | GO:0003841 | 1-acylglycerol-3-phosphate O-acyltransferase activity(GO:0003841) |
| 0.0 | 0.1 | GO:0061505 | DNA topoisomerase type II (ATP-hydrolyzing) activity(GO:0003918) DNA topoisomerase II activity(GO:0061505) |
| 0.0 | 0.1 | GO:0032137 | guanine/thymine mispair binding(GO:0032137) |
| 0.0 | 3.4 | GO:0008565 | protein transporter activity(GO:0008565) |
| 0.0 | 0.1 | GO:0004066 | asparagine synthase (glutamine-hydrolyzing) activity(GO:0004066) |
| 0.0 | 0.4 | GO:0015924 | mannosyl-oligosaccharide mannosidase activity(GO:0015924) |
| 0.0 | 0.1 | GO:0052593 | tryptamine:oxygen oxidoreductase (deaminating) activity(GO:0052593) aminoacetone:oxygen oxidoreductase(deaminating) activity(GO:0052594) aliphatic-amine oxidase activity(GO:0052595) phenethylamine:oxygen oxidoreductase (deaminating) activity(GO:0052596) |
| 0.0 | 0.2 | GO:0003995 | acyl-CoA dehydrogenase activity(GO:0003995) |
| 0.0 | 0.1 | GO:0045127 | N-acetylglucosamine kinase activity(GO:0045127) |
| 0.0 | 0.1 | GO:0030348 | syntaxin-3 binding(GO:0030348) |
| 0.0 | 0.2 | GO:0043423 | 3-phosphoinositide-dependent protein kinase binding(GO:0043423) |
| 0.0 | 0.5 | GO:0010314 | phosphatidylinositol-5-phosphate binding(GO:0010314) |
| 0.0 | 0.1 | GO:0016426 | tRNA (adenine) methyltransferase activity(GO:0016426) |
| 0.0 | 0.4 | GO:0019203 | carbohydrate phosphatase activity(GO:0019203) sugar-phosphatase activity(GO:0050308) |
| 0.0 | 0.1 | GO:0030151 | molybdenum ion binding(GO:0030151) |
| 0.0 | 0.2 | GO:0016300 | tRNA (uracil) methyltransferase activity(GO:0016300) |
| 0.0 | 0.2 | GO:0034511 | U3 snoRNA binding(GO:0034511) |
| 0.0 | 0.0 | GO:0004549 | tRNA-specific ribonuclease activity(GO:0004549) |
| 0.0 | 0.1 | GO:0031728 | CCR3 chemokine receptor binding(GO:0031728) |
| 0.0 | 0.1 | GO:0015087 | cobalt ion transmembrane transporter activity(GO:0015087) |
| 0.0 | 0.2 | GO:0047288 | monosialoganglioside sialyltransferase activity(GO:0047288) |
| 0.0 | 1.6 | GO:0070035 | ATP-dependent helicase activity(GO:0008026) purine NTP-dependent helicase activity(GO:0070035) |
| 0.0 | 0.2 | GO:0004887 | thyroid hormone receptor activity(GO:0004887) |
| 0.0 | 0.2 | GO:0031802 | type 5 metabotropic glutamate receptor binding(GO:0031802) |
| 0.0 | 0.2 | GO:0031685 | adenosine receptor binding(GO:0031685) |
| 0.0 | 1.4 | GO:0044390 | ubiquitin-like protein conjugating enzyme binding(GO:0044390) |
| 0.0 | 0.1 | GO:0016671 | oxidoreductase activity, acting on a sulfur group of donors, disulfide as acceptor(GO:0016671) peptide-methionine (R)-S-oxide reductase activity(GO:0033743) |
| 0.0 | 0.1 | GO:0036042 | long-chain fatty acyl-CoA binding(GO:0036042) |
| 0.0 | 0.4 | GO:0004634 | phosphopyruvate hydratase activity(GO:0004634) |
| 0.0 | 0.5 | GO:0097602 | cullin family protein binding(GO:0097602) |
| 0.0 | 0.2 | GO:0070891 | lipoteichoic acid binding(GO:0070891) |
| 0.0 | 0.1 | GO:0043262 | adenosine-diphosphatase activity(GO:0043262) |
| 0.0 | 0.1 | GO:0035173 | histone kinase activity(GO:0035173) |
| 0.0 | 0.3 | GO:0070053 | thrombospondin receptor activity(GO:0070053) |
| 0.0 | 1.2 | GO:0016853 | isomerase activity(GO:0016853) |
| 0.0 | 0.3 | GO:0039706 | co-receptor binding(GO:0039706) |
| 0.0 | 0.1 | GO:0008568 | microtubule-severing ATPase activity(GO:0008568) |
| 0.0 | 0.5 | GO:0016832 | aldehyde-lyase activity(GO:0016832) |
| 0.0 | 0.2 | GO:0008494 | translation activator activity(GO:0008494) |
| 0.0 | 0.0 | GO:0032356 | oxidized DNA binding(GO:0032356) |
| 0.0 | 0.1 | GO:1900750 | glutathione binding(GO:0043295) oligopeptide binding(GO:1900750) |
| 0.0 | 0.1 | GO:0030171 | voltage-gated proton channel activity(GO:0030171) |
| 0.0 | 0.2 | GO:0015181 | arginine transmembrane transporter activity(GO:0015181) |
| 0.0 | 1.0 | GO:0061631 | ubiquitin conjugating enzyme activity(GO:0061631) |
| 0.0 | 0.1 | GO:0042602 | riboflavin reductase (NADPH) activity(GO:0042602) |
| 0.0 | 0.1 | GO:0001847 | opsonin receptor activity(GO:0001847) |
| 0.0 | 0.1 | GO:0044715 | 8-oxo-dGDP phosphatase activity(GO:0044715) |
| 0.0 | 0.0 | GO:0031798 | type 1 metabotropic glutamate receptor binding(GO:0031798) |
| 0.0 | 0.2 | GO:0005519 | cytoskeletal regulatory protein binding(GO:0005519) |
| 0.0 | 0.1 | GO:0097506 | uracil DNA N-glycosylase activity(GO:0004844) deaminated base DNA N-glycosylase activity(GO:0097506) |
| 0.0 | 0.4 | GO:0004653 | polypeptide N-acetylgalactosaminyltransferase activity(GO:0004653) |
| 0.0 | 1.6 | GO:0003725 | double-stranded RNA binding(GO:0003725) |
| 0.0 | 2.6 | GO:0004222 | metalloendopeptidase activity(GO:0004222) |
| 0.0 | 0.6 | GO:0008432 | JUN kinase binding(GO:0008432) |
| 0.0 | 0.1 | GO:0000828 | inositol hexakisphosphate kinase activity(GO:0000828) inositol hexakisphosphate 5-kinase activity(GO:0000832) inositol hexakisphosphate 1-kinase activity(GO:0052723) inositol hexakisphosphate 3-kinase activity(GO:0052724) |
| 0.0 | 0.4 | GO:0008191 | metalloendopeptidase inhibitor activity(GO:0008191) |
| 0.0 | 0.3 | GO:0015643 | toxic substance binding(GO:0015643) |
| 0.0 | 0.2 | GO:0019198 | transmembrane receptor protein tyrosine phosphatase activity(GO:0005001) transmembrane receptor protein phosphatase activity(GO:0019198) |
| 0.0 | 0.1 | GO:0016361 | activin receptor activity, type I(GO:0016361) |
| 0.0 | 0.3 | GO:0043522 | leucine zipper domain binding(GO:0043522) |
| 0.0 | 0.1 | GO:0008641 | small protein activating enzyme activity(GO:0008641) |
| 0.0 | 0.8 | GO:0005385 | zinc ion transmembrane transporter activity(GO:0005385) |
| 0.0 | 0.1 | GO:0015232 | heme transporter activity(GO:0015232) |
| 0.0 | 0.2 | GO:0019158 | fructokinase activity(GO:0008865) mannokinase activity(GO:0019158) |
| 0.0 | 0.3 | GO:0005041 | low-density lipoprotein receptor activity(GO:0005041) |
| 0.0 | 0.1 | GO:0032422 | purine-rich negative regulatory element binding(GO:0032422) |
| 0.0 | 0.0 | GO:0071820 | N-box binding(GO:0071820) |
| 0.0 | 0.2 | GO:0003810 | protein-glutamine gamma-glutamyltransferase activity(GO:0003810) |
| 0.0 | 0.1 | GO:0008428 | ribonuclease inhibitor activity(GO:0008428) |
| 0.0 | 0.3 | GO:0008603 | cAMP-dependent protein kinase regulator activity(GO:0008603) |
| 0.0 | 0.1 | GO:0008321 | Ral guanyl-nucleotide exchange factor activity(GO:0008321) |
| 0.0 | 0.1 | GO:0015295 | solute:proton symporter activity(GO:0015295) |
| 0.0 | 0.2 | GO:0000062 | fatty-acyl-CoA binding(GO:0000062) |
| 0.0 | 0.1 | GO:0001094 | TFIID-class transcription factor binding(GO:0001094) |
| 0.0 | 0.6 | GO:0003899 | DNA-directed RNA polymerase activity(GO:0003899) RNA polymerase activity(GO:0034062) |
| 0.0 | 0.3 | GO:0017025 | TBP-class protein binding(GO:0017025) |
| 0.0 | 0.2 | GO:0016175 | superoxide-generating NADPH oxidase activity(GO:0016175) |
| 0.0 | 0.2 | GO:0008454 | alpha-1,3-mannosylglycoprotein 4-beta-N-acetylglucosaminyltransferase activity(GO:0008454) |
| 0.0 | 0.0 | GO:0086062 | voltage-gated sodium channel activity involved in Purkinje myocyte action potential(GO:0086062) |
| 0.0 | 0.1 | GO:0004594 | pantothenate kinase activity(GO:0004594) |
| 0.0 | 0.4 | GO:0005523 | tropomyosin binding(GO:0005523) |
| 0.0 | 0.0 | GO:0035243 | protein-arginine omega-N symmetric methyltransferase activity(GO:0035243) |
| 0.0 | 0.1 | GO:0046899 | nucleoside triphosphate adenylate kinase activity(GO:0046899) |
| 0.0 | 5.9 | GO:0004175 | endopeptidase activity(GO:0004175) |
| 0.0 | 0.0 | GO:0035717 | chemokine (C-C motif) ligand 7 binding(GO:0035717) |
| 0.0 | 0.1 | GO:0008158 | hedgehog receptor activity(GO:0008158) |
| 0.0 | 0.0 | GO:0016647 | oxidoreductase activity, acting on the CH-NH group of donors, oxygen as acceptor(GO:0016647) |
| 0.0 | 0.1 | GO:0047023 | androsterone dehydrogenase activity(GO:0047023) |
| 0.0 | 0.1 | GO:0031697 | beta-1 adrenergic receptor binding(GO:0031697) |
| 0.0 | 0.0 | GO:0032552 | deoxyribonucleotide binding(GO:0032552) |
| 0.0 | 0.8 | GO:0015485 | cholesterol binding(GO:0015485) |
| 0.0 | 0.0 | GO:0050436 | microfibril binding(GO:0050436) |
| 0.0 | 0.1 | GO:0004305 | ethanolamine kinase activity(GO:0004305) |
| 0.0 | 2.2 | GO:0004867 | serine-type endopeptidase inhibitor activity(GO:0004867) |
| 0.0 | 0.1 | GO:0042609 | CD4 receptor binding(GO:0042609) |
| 0.0 | 0.7 | GO:0016763 | transferase activity, transferring pentosyl groups(GO:0016763) |
| 0.0 | 0.0 | GO:0016174 | NAD(P)H oxidase activity(GO:0016174) |
| 0.0 | 0.1 | GO:0010858 | calcium-dependent protein kinase inhibitor activity(GO:0008427) calcium-dependent protein kinase regulator activity(GO:0010858) |
| 0.0 | 0.1 | GO:0047874 | dolichyldiphosphatase activity(GO:0047874) |
| 0.0 | 0.5 | GO:0043539 | protein serine/threonine kinase activator activity(GO:0043539) |
| 0.0 | 0.0 | GO:0005174 | CD40 receptor binding(GO:0005174) |
| 0.0 | 0.4 | GO:0004707 | MAP kinase activity(GO:0004707) |
| 0.0 | 0.1 | GO:0047372 | acylglycerol lipase activity(GO:0047372) |
| 0.0 | 0.1 | GO:0008597 | calcium-dependent protein serine/threonine phosphatase regulator activity(GO:0008597) |
| 0.0 | 0.1 | GO:0004647 | phosphoserine phosphatase activity(GO:0004647) |
| 0.0 | 0.1 | GO:0000293 | ferric-chelate reductase activity(GO:0000293) |
| 0.0 | 0.0 | GO:0016155 | formyltetrahydrofolate dehydrogenase activity(GO:0016155) |
| 0.0 | 0.9 | GO:0045502 | dynein binding(GO:0045502) |
| 0.0 | 0.6 | GO:0030145 | manganese ion binding(GO:0030145) |
| 0.0 | 0.0 | GO:0055100 | adiponectin binding(GO:0055100) |
| 0.0 | 0.1 | GO:0005146 | leukemia inhibitory factor receptor binding(GO:0005146) |
| 0.0 | 0.1 | GO:0008526 | phosphatidylinositol transporter activity(GO:0008526) |
| 0.0 | 0.4 | GO:0017134 | fibroblast growth factor binding(GO:0017134) |
| 0.0 | 0.0 | GO:0070095 | fructose-6-phosphate binding(GO:0070095) |
| 0.0 | 0.5 | GO:0048020 | CCR chemokine receptor binding(GO:0048020) |
| 0.0 | 0.0 | GO:0002060 | purine nucleobase binding(GO:0002060) |
| 0.0 | 0.6 | GO:0016776 | phosphotransferase activity, phosphate group as acceptor(GO:0016776) |
| 0.0 | 0.1 | GO:0098505 | G-rich strand telomeric DNA binding(GO:0098505) |
| 0.0 | 3.4 | GO:0008233 | peptidase activity(GO:0008233) |
| 0.0 | 0.1 | GO:0008294 | calcium- and calmodulin-responsive adenylate cyclase activity(GO:0008294) |
| 0.0 | 0.1 | GO:0032050 | clathrin heavy chain binding(GO:0032050) |
| 0.0 | 0.1 | GO:0030983 | mismatched DNA binding(GO:0030983) |
| 0.0 | 0.1 | GO:0019104 | DNA N-glycosylase activity(GO:0019104) |
| 0.0 | 0.2 | GO:0042288 | MHC class I protein binding(GO:0042288) |
| 0.0 | 0.0 | GO:0008073 | ornithine decarboxylase inhibitor activity(GO:0008073) |
| 0.0 | 0.1 | GO:0015368 | calcium:cation antiporter activity(GO:0015368) |
| 0.0 | 0.2 | GO:0035497 | cAMP response element binding(GO:0035497) |
| 0.0 | 0.1 | GO:0061133 | endopeptidase activator activity(GO:0061133) |
| 0.0 | 0.1 | GO:0060072 | large conductance calcium-activated potassium channel activity(GO:0060072) |
| 0.0 | 0.0 | GO:0004340 | glucokinase activity(GO:0004340) hexokinase activity(GO:0004396) |
| 0.0 | 0.1 | GO:0008376 | acetylgalactosaminyltransferase activity(GO:0008376) |
| 0.0 | 0.1 | GO:0001226 | RNA polymerase II transcription corepressor binding(GO:0001226) |
| 0.0 | 0.1 | GO:0031419 | cobalamin binding(GO:0031419) |
| 0.0 | 0.1 | GO:0010484 | H3 histone acetyltransferase activity(GO:0010484) |
| 0.0 | 0.2 | GO:0005176 | ErbB-2 class receptor binding(GO:0005176) |
| 0.0 | 0.0 | GO:0032190 | acrosin binding(GO:0032190) |
| 0.0 | 0.0 | GO:0008431 | vitamin E binding(GO:0008431) |
| 0.0 | 0.1 | GO:0003886 | DNA (cytosine-5-)-methyltransferase activity(GO:0003886) |
| 0.0 | 0.0 | GO:0015275 | stretch-activated, cation-selective, calcium channel activity(GO:0015275) |
| 0.0 | 0.0 | GO:0004510 | tryptophan 5-monooxygenase activity(GO:0004510) |
| 0.0 | 0.1 | GO:0071535 | RING-like zinc finger domain binding(GO:0071535) |
| 0.0 | 0.1 | GO:0070097 | delta-catenin binding(GO:0070097) |
| 0.0 | 0.1 | GO:0033038 | bitter taste receptor activity(GO:0033038) |
| 0.0 | 0.1 | GO:0051731 | polynucleotide 5'-hydroxyl-kinase activity(GO:0051731) |
| 0.0 | 0.2 | GO:0005161 | platelet-derived growth factor receptor binding(GO:0005161) |
| 0.0 | 0.0 | GO:0003986 | acetyl-CoA hydrolase activity(GO:0003986) |
| 0.0 | 0.2 | GO:0004745 | retinol dehydrogenase activity(GO:0004745) |
Gene overrepresentation in curated gene sets: canonical pathways category:
| Log-likelihood per target | Total log-likelihood | Term | Description |
|---|---|---|---|
| 0.1 | 4.7 | PID AURORA B PATHWAY | Aurora B signaling |
| 0.1 | 2.5 | PID ARF6 DOWNSTREAM PATHWAY | Arf6 downstream pathway |
| 0.1 | 1.9 | PID HIF1A PATHWAY | Hypoxic and oxygen homeostasis regulation of HIF-1-alpha |
| 0.1 | 1.5 | PID RANBP2 PATHWAY | Sumoylation by RanBP2 regulates transcriptional repression |
| 0.1 | 0.4 | PID IFNG PATHWAY | IFN-gamma pathway |
| 0.1 | 0.1 | SIG IL4RECEPTOR IN B LYPHOCYTES | Genes related to IL4 rceptor signaling in B lymphocytes |
| 0.1 | 7.0 | PID MYC ACTIV PATHWAY | Validated targets of C-MYC transcriptional activation |
| 0.0 | 2.2 | PID ATR PATHWAY | ATR signaling pathway |
| 0.0 | 1.8 | PID FOXM1 PATHWAY | FOXM1 transcription factor network |
| 0.0 | 2.1 | PID MAPK TRK PATHWAY | Trk receptor signaling mediated by the MAPK pathway |
| 0.0 | 0.5 | PID TCR RAS PATHWAY | Ras signaling in the CD4+ TCR pathway |
| 0.0 | 1.7 | PID ALPHA SYNUCLEIN PATHWAY | Alpha-synuclein signaling |
| 0.0 | 0.2 | ST DIFFERENTIATION PATHWAY IN PC12 CELLS | Differentiation Pathway in PC12 Cells; this is a specific case of PAC1 Receptor Pathway. |
| 0.0 | 0.2 | PID WNT CANONICAL PATHWAY | Canonical Wnt signaling pathway |
| 0.0 | 2.1 | SIG REGULATION OF THE ACTIN CYTOSKELETON BY RHO GTPASES | Genes related to regulation of the actin cytoskeleton |
| 0.0 | 0.6 | PID P53 REGULATION PATHWAY | p53 pathway |
| 0.0 | 1.2 | PID TRAIL PATHWAY | TRAIL signaling pathway |
| 0.0 | 0.1 | ST G ALPHA S PATHWAY | G alpha s Pathway |
| 0.0 | 1.6 | PID NCADHERIN PATHWAY | N-cadherin signaling events |
| 0.0 | 2.2 | PID HEDGEHOG GLI PATHWAY | Hedgehog signaling events mediated by Gli proteins |
| 0.0 | 0.6 | SA TRKA RECEPTOR | The TrkA receptor binds nerve growth factor to activate MAP kinase pathways and promote cell growth. |
| 0.0 | 1.0 | PID IL12 STAT4 PATHWAY | IL12 signaling mediated by STAT4 |
| 0.0 | 0.4 | PID SMAD2 3PATHWAY | Regulation of cytoplasmic and nuclear SMAD2/3 signaling |
| 0.0 | 1.0 | PID LIS1 PATHWAY | Lissencephaly gene (LIS1) in neuronal migration and development |
| 0.0 | 0.2 | ST INTERLEUKIN 4 PATHWAY | Interleukin 4 (IL-4) Pathway |
| 0.0 | 0.4 | SA B CELL RECEPTOR COMPLEXES | Antigen binding to B cell receptors activates protein tyrosine kinases, such as the Src family, which ultimate activate MAP kinases. |
| 0.0 | 0.2 | PID VEGF VEGFR PATHWAY | VEGF and VEGFR signaling network |
| 0.0 | 0.2 | ST ERK1 ERK2 MAPK PATHWAY | ERK1/ERK2 MAPK Pathway |
| 0.0 | 0.5 | PID ERBB1 RECEPTOR PROXIMAL PATHWAY | EGF receptor (ErbB1) signaling pathway |
| 0.0 | 0.3 | PID IL3 PATHWAY | IL3-mediated signaling events |
| 0.0 | 0.3 | PID AP1 PATHWAY | AP-1 transcription factor network |
| 0.0 | 0.5 | PID AURORA A PATHWAY | Aurora A signaling |
| 0.0 | 0.5 | ST T CELL SIGNAL TRANSDUCTION | T Cell Signal Transduction |
| 0.0 | 0.4 | PID SYNDECAN 2 PATHWAY | Syndecan-2-mediated signaling events |
| 0.0 | 1.0 | PID INTEGRIN3 PATHWAY | Beta3 integrin cell surface interactions |
| 0.0 | 0.1 | ST TYPE I INTERFERON PATHWAY | Type I Interferon (alpha/beta IFN) Pathway |
| 0.0 | 0.4 | PID DNA PK PATHWAY | DNA-PK pathway in nonhomologous end joining |
| 0.0 | 0.5 | PID ANGIOPOIETIN RECEPTOR PATHWAY | Angiopoietin receptor Tie2-mediated signaling |
| 0.0 | 0.2 | PID BETA CATENIN DEG PATHWAY | Degradation of beta catenin |
| 0.0 | 0.2 | PID ERB GENOMIC PATHWAY | Validated nuclear estrogen receptor beta network |
| 0.0 | 0.5 | PID PI3KCI PATHWAY | Class I PI3K signaling events |
| 0.0 | 0.2 | ST INTERFERON GAMMA PATHWAY | Interferon gamma pathway. |
| 0.0 | 0.3 | PID IL2 PI3K PATHWAY | IL2 signaling events mediated by PI3K |
| 0.0 | 0.5 | ST P38 MAPK PATHWAY | p38 MAPK Pathway |
| 0.0 | 3.4 | NABA ECM REGULATORS | Genes encoding enzymes and their regulators involved in the remodeling of the extracellular matrix |
| 0.0 | 0.5 | PID SYNDECAN 1 PATHWAY | Syndecan-1-mediated signaling events |
| 0.0 | 0.2 | PID ATF2 PATHWAY | ATF-2 transcription factor network |
| 0.0 | 0.5 | PID IL12 2PATHWAY | IL12-mediated signaling events |
| 0.0 | 0.4 | PID RAS PATHWAY | Regulation of Ras family activation |
| 0.0 | 0.5 | SIG PIP3 SIGNALING IN CARDIAC MYOCTES | Genes related to PIP3 signaling in cardiac myocytes |
| 0.0 | 0.4 | PID TCPTP PATHWAY | Signaling events mediated by TCPTP |
| 0.0 | 0.1 | ST GAQ PATHWAY | G alpha q Pathway |
| 0.0 | 0.1 | PID UPA UPAR PATHWAY | Urokinase-type plasminogen activator (uPA) and uPAR-mediated signaling |
| 0.0 | 0.1 | PID THROMBIN PAR4 PATHWAY | PAR4-mediated thrombin signaling events |
| 0.0 | 0.1 | PID INTEGRIN A9B1 PATHWAY | Alpha9 beta1 integrin signaling events |
Gene overrepresentation in curated gene sets: REACTOME pathways category:
| Log-likelihood per target | Total log-likelihood | Term | Description |
|---|---|---|---|
| 0.2 | 23.6 | REACTOME PEPTIDE CHAIN ELONGATION | Genes involved in Peptide chain elongation |
| 0.2 | 3.7 | REACTOME FORMATION OF ATP BY CHEMIOSMOTIC COUPLING | Genes involved in Formation of ATP by chemiosmotic coupling |
| 0.2 | 13.4 | REACTOME RESPIRATORY ELECTRON TRANSPORT | Genes involved in Respiratory electron transport |
| 0.2 | 6.2 | REACTOME SRP DEPENDENT COTRANSLATIONAL PROTEIN TARGETING TO MEMBRANE | Genes involved in SRP-dependent cotranslational protein targeting to membrane |
| 0.2 | 10.0 | REACTOME ER PHAGOSOME PATHWAY | Genes involved in ER-Phagosome pathway |
| 0.2 | 4.5 | REACTOME CYTOSOLIC TRNA AMINOACYLATION | Genes involved in Cytosolic tRNA aminoacylation |
| 0.1 | 2.3 | REACTOME MITOCHONDRIAL FATTY ACID BETA OXIDATION | Genes involved in Mitochondrial Fatty Acid Beta-Oxidation |
| 0.1 | 2.1 | REACTOME RNA POL I PROMOTER OPENING | Genes involved in RNA Polymerase I Promoter Opening |
| 0.1 | 4.3 | REACTOME SYNTHESIS AND INTERCONVERSION OF NUCLEOTIDE DI AND TRIPHOSPHATES | Genes involved in Synthesis and interconversion of nucleotide di- and triphosphates |
| 0.1 | 5.1 | REACTOME PREFOLDIN MEDIATED TRANSFER OF SUBSTRATE TO CCT TRIC | Genes involved in Prefoldin mediated transfer of substrate to CCT/TriC |
| 0.1 | 0.8 | REACTOME POST CHAPERONIN TUBULIN FOLDING PATHWAY | Genes involved in Post-chaperonin tubulin folding pathway |
| 0.1 | 1.1 | REACTOME MRNA DECAY BY 3 TO 5 EXORIBONUCLEASE | Genes involved in mRNA Decay by 3' to 5' Exoribonuclease |
| 0.1 | 0.5 | REACTOME SIGNALING BY WNT | Genes involved in Signaling by Wnt |
| 0.1 | 1.8 | REACTOME MITOCHONDRIAL TRNA AMINOACYLATION | Genes involved in Mitochondrial tRNA aminoacylation |
| 0.1 | 5.2 | REACTOME TRANSLATION | Genes involved in Translation |
| 0.1 | 1.0 | REACTOME COPI MEDIATED TRANSPORT | Genes involved in COPI Mediated Transport |
| 0.1 | 2.0 | REACTOME RNA POL I TRANSCRIPTION TERMINATION | Genes involved in RNA Polymerase I Transcription Termination |
| 0.1 | 1.5 | REACTOME CITRIC ACID CYCLE TCA CYCLE | Genes involved in Citric acid cycle (TCA cycle) |
| 0.1 | 1.1 | REACTOME REMOVAL OF THE FLAP INTERMEDIATE FROM THE C STRAND | Genes involved in Removal of the Flap Intermediate from the C-strand |
| 0.1 | 1.8 | REACTOME TETRAHYDROBIOPTERIN BH4 SYNTHESIS RECYCLING SALVAGE AND REGULATION | Genes involved in Tetrahydrobiopterin (BH4) synthesis, recycling, salvage and regulation |
| 0.1 | 4.1 | REACTOME MITOCHONDRIAL PROTEIN IMPORT | Genes involved in Mitochondrial Protein Import |
| 0.1 | 0.7 | REACTOME SCF BETA TRCP MEDIATED DEGRADATION OF EMI1 | Genes involved in SCF-beta-TrCP mediated degradation of Emi1 |
| 0.1 | 1.9 | REACTOME PURINE SALVAGE | Genes involved in Purine salvage |
| 0.1 | 0.4 | REACTOME RESPIRATORY ELECTRON TRANSPORT ATP SYNTHESIS BY CHEMIOSMOTIC COUPLING AND HEAT PRODUCTION BY UNCOUPLING PROTEINS | Genes involved in Respiratory electron transport, ATP synthesis by chemiosmotic coupling, and heat production by uncoupling proteins. |
| 0.1 | 1.6 | REACTOME GRB2 SOS PROVIDES LINKAGE TO MAPK SIGNALING FOR INTERGRINS | Genes involved in GRB2:SOS provides linkage to MAPK signaling for Intergrins |
| 0.1 | 1.1 | REACTOME UNWINDING OF DNA | Genes involved in Unwinding of DNA |
| 0.1 | 2.2 | REACTOME CHOLESTEROL BIOSYNTHESIS | Genes involved in Cholesterol biosynthesis |
| 0.1 | 0.4 | REACTOME RNA POL I TRANSCRIPTION INITIATION | Genes involved in RNA Polymerase I Transcription Initiation |
| 0.1 | 1.1 | REACTOME N GLYCAN TRIMMING IN THE ER AND CALNEXIN CALRETICULIN CYCLE | Genes involved in N-glycan trimming in the ER and Calnexin/Calreticulin cycle |
| 0.1 | 0.6 | REACTOME MICRORNA MIRNA BIOGENESIS | Genes involved in MicroRNA (miRNA) Biogenesis |
| 0.1 | 0.6 | REACTOME REGULATION OF ORNITHINE DECARBOXYLASE ODC | Genes involved in Regulation of ornithine decarboxylase (ODC) |
| 0.1 | 0.8 | REACTOME DEPOSITION OF NEW CENPA CONTAINING NUCLEOSOMES AT THE CENTROMERE | Genes involved in Deposition of New CENPA-containing Nucleosomes at the Centromere |
| 0.1 | 1.5 | REACTOME PYRUVATE METABOLISM | Genes involved in Pyruvate metabolism |
| 0.1 | 1.5 | REACTOME BRANCHED CHAIN AMINO ACID CATABOLISM | Genes involved in Branched-chain amino acid catabolism |
| 0.1 | 0.3 | REACTOME INFLUENZA VIRAL RNA TRANSCRIPTION AND REPLICATION | Genes involved in Influenza Viral RNA Transcription and Replication |
| 0.1 | 1.1 | REACTOME DEADENYLATION OF MRNA | Genes involved in Deadenylation of mRNA |
| 0.1 | 0.6 | REACTOME TRANSLOCATION OF ZAP 70 TO IMMUNOLOGICAL SYNAPSE | Genes involved in Translocation of ZAP-70 to Immunological synapse |
| 0.1 | 1.1 | REACTOME HDL MEDIATED LIPID TRANSPORT | Genes involved in HDL-mediated lipid transport |
| 0.1 | 6.7 | REACTOME MITOTIC PROMETAPHASE | Genes involved in Mitotic Prometaphase |
| 0.1 | 1.0 | REACTOME METABOLISM OF POLYAMINES | Genes involved in Metabolism of polyamines |
| 0.1 | 1.0 | REACTOME VITAMIN B5 PANTOTHENATE METABOLISM | Genes involved in Vitamin B5 (pantothenate) metabolism |
| 0.1 | 1.0 | REACTOME FACILITATIVE NA INDEPENDENT GLUCOSE TRANSPORTERS | Genes involved in Facilitative Na+-independent glucose transporters |
| 0.1 | 0.6 | REACTOME NEGATIVE REGULATION OF THE PI3K AKT NETWORK | Genes involved in Negative regulation of the PI3K/AKT network |
| 0.1 | 0.6 | REACTOME HYALURONAN UPTAKE AND DEGRADATION | Genes involved in Hyaluronan uptake and degradation |
| 0.1 | 1.0 | REACTOME PECAM1 INTERACTIONS | Genes involved in PECAM1 interactions |
| 0.1 | 0.9 | REACTOME PURINE RIBONUCLEOSIDE MONOPHOSPHATE BIOSYNTHESIS | Genes involved in Purine ribonucleoside monophosphate biosynthesis |
| 0.0 | 0.7 | REACTOME RAF MAP KINASE CASCADE | Genes involved in RAF/MAP kinase cascade |
| 0.0 | 0.6 | REACTOME BASE FREE SUGAR PHOSPHATE REMOVAL VIA THE SINGLE NUCLEOTIDE REPLACEMENT PATHWAY | Genes involved in Base-free sugar-phosphate removal via the single-nucleotide replacement pathway |
| 0.0 | 0.6 | REACTOME SLBP DEPENDENT PROCESSING OF REPLICATION DEPENDENT HISTONE PRE MRNAS | Genes involved in SLBP Dependent Processing of Replication-Dependent Histone Pre-mRNAs |
| 0.0 | 0.3 | REACTOME APOBEC3G MEDIATED RESISTANCE TO HIV1 INFECTION | Genes involved in APOBEC3G mediated resistance to HIV-1 infection |
| 0.0 | 1.6 | REACTOME PYRIMIDINE METABOLISM | Genes involved in Pyrimidine metabolism |
| 0.0 | 0.8 | REACTOME AUTODEGRADATION OF CDH1 BY CDH1 APC C | Genes involved in Autodegradation of Cdh1 by Cdh1:APC/C |
| 0.0 | 1.7 | REACTOME RNA POL II TRANSCRIPTION PRE INITIATION AND PROMOTER OPENING | Genes involved in RNA Polymerase II Transcription Pre-Initiation And Promoter Opening |
| 0.0 | 0.3 | REACTOME PYRUVATE METABOLISM AND CITRIC ACID TCA CYCLE | Genes involved in Pyruvate metabolism and Citric Acid (TCA) cycle |
| 0.0 | 0.5 | REACTOME ADVANCED GLYCOSYLATION ENDPRODUCT RECEPTOR SIGNALING | Genes involved in Advanced glycosylation endproduct receptor signaling |
| 0.0 | 0.2 | REACTOME INFLUENZA LIFE CYCLE | Genes involved in Influenza Life Cycle |
| 0.0 | 0.8 | REACTOME SYNTHESIS OF PIPS AT THE EARLY ENDOSOME MEMBRANE | Genes involved in Synthesis of PIPs at the early endosome membrane |
| 0.0 | 2.1 | REACTOME GLUCONEOGENESIS | Genes involved in Gluconeogenesis |
| 0.0 | 1.1 | REACTOME AMINO ACID SYNTHESIS AND INTERCONVERSION TRANSAMINATION | Genes involved in Amino acid synthesis and interconversion (transamination) |
| 0.0 | 0.3 | REACTOME APOPTOSIS INDUCED DNA FRAGMENTATION | Genes involved in Apoptosis induced DNA fragmentation |
| 0.0 | 0.4 | REACTOME ACETYLCHOLINE NEUROTRANSMITTER RELEASE CYCLE | Genes involved in Acetylcholine Neurotransmitter Release Cycle |
| 0.0 | 1.0 | REACTOME MRNA SPLICING MINOR PATHWAY | Genes involved in mRNA Splicing - Minor Pathway |
| 0.0 | 0.4 | REACTOME CYCLIN A B1 ASSOCIATED EVENTS DURING G2 M TRANSITION | Genes involved in Cyclin A/B1 associated events during G2/M transition |
| 0.0 | 1.2 | REACTOME PTM GAMMA CARBOXYLATION HYPUSINE FORMATION AND ARYLSULFATASE ACTIVATION | Genes involved in PTM: gamma carboxylation, hypusine formation and arylsulfatase activation |
| 0.0 | 0.1 | REACTOME REGULATION OF HYPOXIA INDUCIBLE FACTOR HIF BY OXYGEN | Genes involved in Regulation of Hypoxia-inducible Factor (HIF) by Oxygen |
| 0.0 | 1.3 | REACTOME TGF BETA RECEPTOR SIGNALING ACTIVATES SMADS | Genes involved in TGF-beta receptor signaling activates SMADs |
| 0.0 | 0.3 | REACTOME ENOS ACTIVATION AND REGULATION | Genes involved in eNOS activation and regulation |
| 0.0 | 0.1 | REACTOME RIP MEDIATED NFKB ACTIVATION VIA DAI | Genes involved in RIP-mediated NFkB activation via DAI |
| 0.0 | 0.2 | REACTOME CD28 DEPENDENT VAV1 PATHWAY | Genes involved in CD28 dependent Vav1 pathway |
| 0.0 | 1.1 | REACTOME INTERACTIONS OF VPR WITH HOST CELLULAR PROTEINS | Genes involved in Interactions of Vpr with host cellular proteins |
| 0.0 | 0.9 | REACTOME RAP1 SIGNALLING | Genes involved in Rap1 signalling |
| 0.0 | 0.6 | REACTOME TIE2 SIGNALING | Genes involved in Tie2 Signaling |
| 0.0 | 0.5 | REACTOME ORGANIC CATION ANION ZWITTERION TRANSPORT | Genes involved in Organic cation/anion/zwitterion transport |
| 0.0 | 0.2 | REACTOME CELL SURFACE INTERACTIONS AT THE VASCULAR WALL | Genes involved in Cell surface interactions at the vascular wall |
| 0.0 | 1.7 | REACTOME GLUTATHIONE CONJUGATION | Genes involved in Glutathione conjugation |
| 0.0 | 0.9 | REACTOME KINESINS | Genes involved in Kinesins |
| 0.0 | 0.2 | REACTOME INHIBITION OF REPLICATION INITIATION OF DAMAGED DNA BY RB1 E2F1 | Genes involved in Inhibition of replication initiation of damaged DNA by RB1/E2F1 |
| 0.0 | 0.1 | REACTOME DIGESTION OF DIETARY CARBOHYDRATE | Genes involved in Digestion of dietary carbohydrate |
| 0.0 | 0.5 | REACTOME GLUCOSE TRANSPORT | Genes involved in Glucose transport |
| 0.0 | 0.3 | REACTOME G2 M DNA DAMAGE CHECKPOINT | Genes involved in G2/M DNA damage checkpoint |
| 0.0 | 0.2 | REACTOME CREATION OF C4 AND C2 ACTIVATORS | Genes involved in Creation of C4 and C2 activators |
| 0.0 | 1.2 | REACTOME NEGATIVE REGULATORS OF RIG I MDA5 SIGNALING | Genes involved in Negative regulators of RIG-I/MDA5 signaling |
| 0.0 | 0.5 | REACTOME REGULATION OF APOPTOSIS | Genes involved in Regulation of Apoptosis |
| 0.0 | 0.6 | REACTOME SEMA3A PAK DEPENDENT AXON REPULSION | Genes involved in Sema3A PAK dependent Axon repulsion |
| 0.0 | 0.1 | REACTOME CONVERSION FROM APC C CDC20 TO APC C CDH1 IN LATE ANAPHASE | Genes involved in Conversion from APC/C:Cdc20 to APC/C:Cdh1 in late anaphase |
| 0.0 | 0.5 | REACTOME MRNA DECAY BY 5 TO 3 EXORIBONUCLEASE | Genes involved in mRNA Decay by 5' to 3' Exoribonuclease |
| 0.0 | 0.2 | REACTOME VEGF LIGAND RECEPTOR INTERACTIONS | Genes involved in VEGF ligand-receptor interactions |
| 0.0 | 0.5 | REACTOME APOPTOTIC CLEAVAGE OF CELL ADHESION PROTEINS | Genes involved in Apoptotic cleavage of cell adhesion proteins |
| 0.0 | 0.1 | REACTOME VIF MEDIATED DEGRADATION OF APOBEC3G | Genes involved in Vif-mediated degradation of APOBEC3G |
| 0.0 | 0.1 | REACTOME APC C CDH1 MEDIATED DEGRADATION OF CDC20 AND OTHER APC C CDH1 TARGETED PROTEINS IN LATE MITOSIS EARLY G1 | Genes involved in APC/C:Cdh1 mediated degradation of Cdc20 and other APC/C:Cdh1 targeted proteins in late mitosis/early G1 |
| 0.0 | 0.3 | REACTOME REGULATION OF IFNG SIGNALING | Genes involved in Regulation of IFNG signaling |
| 0.0 | 0.2 | REACTOME INITIAL TRIGGERING OF COMPLEMENT | Genes involved in Initial triggering of complement |
| 0.0 | 0.7 | REACTOME ZINC TRANSPORTERS | Genes involved in Zinc transporters |
| 0.0 | 0.6 | REACTOME EXTENSION OF TELOMERES | Genes involved in Extension of Telomeres |
| 0.0 | 1.2 | REACTOME ACTIVATION OF CHAPERONE GENES BY XBP1S | Genes involved in Activation of Chaperone Genes by XBP1(S) |
| 0.0 | 1.4 | REACTOME STRIATED MUSCLE CONTRACTION | Genes involved in Striated Muscle Contraction |
| 0.0 | 0.9 | REACTOME ANTIVIRAL MECHANISM BY IFN STIMULATED GENES | Genes involved in Antiviral mechanism by IFN-stimulated genes |
| 0.0 | 0.2 | REACTOME GLOBAL GENOMIC NER GG NER | Genes involved in Global Genomic NER (GG-NER) |
| 0.0 | 0.6 | REACTOME DEGRADATION OF THE EXTRACELLULAR MATRIX | Genes involved in Degradation of the extracellular matrix |
| 0.0 | 0.1 | REACTOME ACTIVATION OF CHAPERONE GENES BY ATF6 ALPHA | Genes involved in Activation of Chaperone Genes by ATF6-alpha |
| 0.0 | 1.2 | REACTOME ION TRANSPORT BY P TYPE ATPASES | Genes involved in Ion transport by P-type ATPases |
| 0.0 | 0.3 | REACTOME DOWNREGULATION OF SMAD2 3 SMAD4 TRANSCRIPTIONAL ACTIVITY | Genes involved in Downregulation of SMAD2/3:SMAD4 transcriptional activity |
| 0.0 | 4.0 | REACTOME ANTIGEN PROCESSING UBIQUITINATION PROTEASOME DEGRADATION | Genes involved in Antigen processing: Ubiquitination & Proteasome degradation |
| 0.0 | 0.6 | REACTOME MEIOTIC RECOMBINATION | Genes involved in Meiotic Recombination |
| 0.0 | 0.1 | REACTOME SYNTHESIS OF PE | Genes involved in Synthesis of PE |
| 0.0 | 0.0 | REACTOME DNA REPLICATION | Genes involved in DNA Replication |
| 0.0 | 0.0 | REACTOME ACTIVATION OF IRF3 IRF7 MEDIATED BY TBK1 IKK EPSILON | Genes involved in Activation of IRF3/IRF7 mediated by TBK1/IKK epsilon |
| 0.0 | 0.8 | REACTOME ADP SIGNALLING THROUGH P2RY12 | Genes involved in ADP signalling through P2Y purinoceptor 12 |
| 0.0 | 0.3 | REACTOME ANTIGEN PROCESSING CROSS PRESENTATION | Genes involved in Antigen processing-Cross presentation |
| 0.0 | 0.2 | REACTOME GAP JUNCTION DEGRADATION | Genes involved in Gap junction degradation |
| 0.0 | 0.7 | REACTOME METABOLISM OF STEROID HORMONES AND VITAMINS A AND D | Genes involved in Metabolism of steroid hormones and vitamins A and D |
| 0.0 | 0.9 | REACTOME IMMUNOREGULATORY INTERACTIONS BETWEEN A LYMPHOID AND A NON LYMPHOID CELL | Genes involved in Immunoregulatory interactions between a Lymphoid and a non-Lymphoid cell |
| 0.0 | 0.4 | REACTOME CHONDROITIN SULFATE BIOSYNTHESIS | Genes involved in Chondroitin sulfate biosynthesis |
| 0.0 | 0.7 | REACTOME PHASE II CONJUGATION | Genes involved in Phase II conjugation |
| 0.0 | 0.5 | REACTOME INSULIN RECEPTOR RECYCLING | Genes involved in Insulin receptor recycling |
| 0.0 | 0.1 | REACTOME OXYGEN DEPENDENT PROLINE HYDROXYLATION OF HYPOXIA INDUCIBLE FACTOR ALPHA | Genes involved in Oxygen-dependent Proline Hydroxylation of Hypoxia-inducible Factor Alpha |
| 0.0 | 0.3 | REACTOME FANCONI ANEMIA PATHWAY | Genes involved in Fanconi Anemia pathway |
| 0.0 | 0.2 | REACTOME S PHASE | Genes involved in S Phase |
| 0.0 | 0.3 | REACTOME GLYCOGEN BREAKDOWN GLYCOGENOLYSIS | Genes involved in Glycogen breakdown (glycogenolysis) |
| 0.0 | 0.7 | REACTOME REGULATION OF WATER BALANCE BY RENAL AQUAPORINS | Genes involved in Regulation of Water Balance by Renal Aquaporins |
| 0.0 | 0.1 | REACTOME INTEGRATION OF PROVIRUS | Genes involved in Integration of provirus |
| 0.0 | 0.0 | REACTOME XENOBIOTICS | Genes involved in Xenobiotics |
| 0.0 | 0.5 | REACTOME GLYCOSPHINGOLIPID METABOLISM | Genes involved in Glycosphingolipid metabolism |
| 0.0 | 0.3 | REACTOME TRAFFICKING OF GLUR2 CONTAINING AMPA RECEPTORS | Genes involved in Trafficking of GluR2-containing AMPA receptors |
| 0.0 | 0.4 | REACTOME BASIGIN INTERACTIONS | Genes involved in Basigin interactions |
| 0.0 | 0.2 | REACTOME TRAFFICKING AND PROCESSING OF ENDOSOMAL TLR | Genes involved in Trafficking and processing of endosomal TLR |
| 0.0 | 0.2 | REACTOME IONOTROPIC ACTIVITY OF KAINATE RECEPTORS | Genes involved in Ionotropic activity of Kainate Receptors |
| 0.0 | 0.1 | REACTOME BETA DEFENSINS | Genes involved in Beta defensins |
| 0.0 | 0.1 | REACTOME SIGNALLING TO P38 VIA RIT AND RIN | Genes involved in Signalling to p38 via RIT and RIN |
| 0.0 | 0.3 | REACTOME ALPHA LINOLENIC ACID ALA METABOLISM | Genes involved in alpha-linolenic acid (ALA) metabolism |
| 0.0 | 0.2 | REACTOME REGULATION OF GENE EXPRESSION IN BETA CELLS | Genes involved in Regulation of gene expression in beta cells |
| 0.0 | 0.3 | REACTOME TRANSPORT OF MATURE TRANSCRIPT TO CYTOPLASM | Genes involved in Transport of Mature Transcript to Cytoplasm |
| 0.0 | 0.2 | REACTOME PURINE CATABOLISM | Genes involved in Purine catabolism |
| 0.0 | 0.1 | REACTOME TRAF6 MEDIATED INDUCTION OF TAK1 COMPLEX | Genes involved in TRAF6 mediated induction of TAK1 complex |
| 0.0 | 0.1 | REACTOME CDT1 ASSOCIATION WITH THE CDC6 ORC ORIGIN COMPLEX | Genes involved in CDT1 association with the CDC6:ORC:origin complex |
| 0.0 | 0.2 | REACTOME METABOLISM OF NON CODING RNA | Genes involved in Metabolism of non-coding RNA |