Project
2D miR_HR1_12
Navigation
Downloads
Results for GAUCAGA
Z-value: 0.20
Motif logo

miRNA associated with seed GAUCAGA
| Name | miRBASE accession |
|---|---|
|
mmu-miR-383-5p.1
|
MIMAT0000748 |
Activity profile of GAUCAGA motif
Sorted Z-values of GAUCAGA motif
| Promoter | Log-likelihood | Transcript | Gene | Gene Info |
|---|---|---|---|---|
| chr11_-_86201144 | 0.17 |
ENSMUST00000044423.3
|
Brip1
|
BRCA1 interacting protein C-terminal helicase 1 |
| chr4_-_91372028 | 0.13 |
ENSMUST00000107110.1
ENSMUST00000008633.8 ENSMUST00000107118.1 |
Elavl2
|
ELAV (embryonic lethal, abnormal vision, Drosophila)-like 2 (Hu antigen B) |
| chr7_+_100227311 | 0.10 |
ENSMUST00000084935.3
|
Pgm2l1
|
phosphoglucomutase 2-like 1 |
| chr15_-_98953541 | 0.08 |
ENSMUST00000097014.5
|
Tuba1a
|
tubulin, alpha 1A |
| chr10_-_127522428 | 0.08 |
ENSMUST00000026470.4
|
Shmt2
|
serine hydroxymethyltransferase 2 (mitochondrial) |
| chr19_-_60874526 | 0.08 |
ENSMUST00000025961.6
|
Prdx3
|
peroxiredoxin 3 |
| chr7_-_30612731 | 0.07 |
ENSMUST00000006476.4
|
Upk1a
|
uroplakin 1A |
| chr3_-_144570136 | 0.05 |
ENSMUST00000043325.7
|
Hs2st1
|
heparan sulfate 2-O-sulfotransferase 1 |
| chr6_-_72439549 | 0.05 |
ENSMUST00000059472.8
|
Mat2a
|
methionine adenosyltransferase II, alpha |
| chr1_-_177796451 | 0.05 |
ENSMUST00000016105.8
|
Adss
|
adenylosuccinate synthetase, non muscle |
| chrX_+_134601179 | 0.05 |
ENSMUST00000074950.4
ENSMUST00000113203.1 ENSMUST00000113202.1 |
Hnrnph2
|
heterogeneous nuclear ribonucleoprotein H2 |
| chr15_+_103240405 | 0.05 |
ENSMUST00000036004.9
ENSMUST00000087351.7 |
Hnrnpa1
|
heterogeneous nuclear ribonucleoprotein A1 |
| chr6_+_8948608 | 0.03 |
ENSMUST00000160300.1
|
Nxph1
|
neurexophilin 1 |
| chr15_-_98534221 | 0.03 |
ENSMUST00000116400.2
ENSMUST00000023727.10 |
Kansl2
|
KAT8 regulatory NSL complex subunit 2 |
| chr8_-_122974793 | 0.03 |
ENSMUST00000098334.5
|
Ankrd11
|
ankyrin repeat domain 11 |
| chr12_+_85473883 | 0.03 |
ENSMUST00000021674.6
|
Fos
|
FBJ osteosarcoma oncogene |
| chr4_-_99829180 | 0.03 |
ENSMUST00000146258.1
|
Itgb3bp
|
integrin beta 3 binding protein (beta3-endonexin) |
| chr11_-_61579637 | 0.03 |
ENSMUST00000147501.1
ENSMUST00000146455.1 ENSMUST00000108711.1 ENSMUST00000108712.1 ENSMUST00000001063.8 ENSMUST00000108713.1 ENSMUST00000179936.1 ENSMUST00000178202.1 |
Epn2
|
epsin 2 |
| chr7_+_110018301 | 0.03 |
ENSMUST00000084731.3
|
Ipo7
|
importin 7 |
| chr5_+_108065742 | 0.03 |
ENSMUST00000081567.4
ENSMUST00000170319.1 ENSMUST00000112626.1 |
Mtf2
|
metal response element binding transcription factor 2 |
| chr2_+_102658640 | 0.03 |
ENSMUST00000080210.3
|
Slc1a2
|
solute carrier family 1 (glial high affinity glutamate transporter), member 2 |
| chr6_+_30401866 | 0.03 |
ENSMUST00000068240.6
ENSMUST00000068259.6 |
Klhdc10
|
kelch domain containing 10 |
| chr15_-_96642883 | 0.02 |
ENSMUST00000088452.4
|
Slc38a1
|
solute carrier family 38, member 1 |
| chr10_+_76531593 | 0.02 |
ENSMUST00000048678.6
|
Lss
|
lanosterol synthase |
| chr14_-_46788267 | 0.02 |
ENSMUST00000015903.4
|
Cnih1
|
cornichon homolog 1 (Drosophila) |
| chr2_+_119897212 | 0.02 |
ENSMUST00000046717.6
ENSMUST00000110774.1 ENSMUST00000110773.2 ENSMUST00000079934.5 ENSMUST00000156510.1 |
Mga
|
MAX gene associated |
| chr8_+_88199194 | 0.02 |
ENSMUST00000119033.1
ENSMUST00000066748.3 ENSMUST00000118952.1 |
Papd5
|
PAP associated domain containing 5 |
| chr12_-_51691883 | 0.02 |
ENSMUST00000013130.8
ENSMUST00000169503.1 |
Strn3
|
striatin, calmodulin binding protein 3 |
| chr12_+_80518990 | 0.02 |
ENSMUST00000021558.6
|
Galnt16
|
UDP-N-acetyl-alpha-D-galactosamine:polypeptide N-acetylgalactosaminyltransferase 16 |
| chr6_+_146724957 | 0.02 |
ENSMUST00000001675.7
ENSMUST00000111644.1 |
Stk38l
|
serine/threonine kinase 38 like |
| chr9_+_54286479 | 0.02 |
ENSMUST00000056740.5
|
Gldn
|
gliomedin |
| chr6_-_99266494 | 0.02 |
ENSMUST00000113326.2
|
Foxp1
|
forkhead box P1 |
| chr10_+_106470281 | 0.01 |
ENSMUST00000029404.9
ENSMUST00000169303.1 |
Ppfia2
|
protein tyrosine phosphatase, receptor type, f polypeptide (PTPRF), interacting protein (liprin), alpha 2 |
| chr15_-_37007382 | 0.01 |
ENSMUST00000078976.7
|
Zfp706
|
zinc finger protein 706 |
| chr2_+_49619277 | 0.01 |
ENSMUST00000028102.7
|
Kif5c
|
kinesin family member 5C |
| chr5_+_115011111 | 0.01 |
ENSMUST00000031530.5
|
Sppl3
|
signal peptide peptidase 3 |
| chr12_-_27342696 | 0.01 |
ENSMUST00000079063.5
|
Sox11
|
SRY-box containing gene 11 |
| chr15_+_54571358 | 0.01 |
ENSMUST00000025356.2
|
Mal2
|
mal, T cell differentiation protein 2 |
| chr19_-_29648355 | 0.01 |
ENSMUST00000159692.1
|
Ermp1
|
endoplasmic reticulum metallopeptidase 1 |
| chr2_+_155775333 | 0.01 |
ENSMUST00000029141.5
|
Mmp24
|
matrix metallopeptidase 24 |
| chr13_-_98891036 | 0.01 |
ENSMUST00000109399.2
|
Tnpo1
|
transportin 1 |
| chr18_+_73573044 | 0.01 |
ENSMUST00000091852.4
|
Mex3c
|
mex3 homolog C (C. elegans) |
| chr13_-_111490111 | 0.01 |
ENSMUST00000047627.7
|
Gpbp1
|
GC-rich promoter binding protein 1 |
| chr16_-_92826004 | 0.01 |
ENSMUST00000023673.7
|
Runx1
|
runt related transcription factor 1 |
| chr7_-_111082997 | 0.01 |
ENSMUST00000161051.1
ENSMUST00000160132.1 ENSMUST00000106666.3 ENSMUST00000162415.1 |
Eif4g2
|
eukaryotic translation initiation factor 4, gamma 2 |
| chr1_+_55131231 | 0.01 |
ENSMUST00000162364.1
ENSMUST00000159311.1 |
Mob4
|
MOB family member 4, phocein |
| chr9_+_101074727 | 0.01 |
ENSMUST00000085177.3
|
Msl2
|
male-specific lethal 2 homolog (Drosophila) |
| chrX_+_75416628 | 0.01 |
ENSMUST00000033544.7
|
Brcc3
|
BRCA1/BRCA2-containing complex, subunit 3 |
| chr15_-_76918010 | 0.01 |
ENSMUST00000048854.7
|
Zfp647
|
zinc finger protein 647 |
| chr18_-_38284391 | 0.01 |
ENSMUST00000025311.5
|
Pcdh12
|
protocadherin 12 |
| chr2_-_60963192 | 0.01 |
ENSMUST00000028347.6
|
Rbms1
|
RNA binding motif, single stranded interacting protein 1 |
| chr9_+_40269430 | 0.01 |
ENSMUST00000171835.2
|
Scn3b
|
sodium channel, voltage-gated, type III, beta |
| chr14_+_84443553 | 0.01 |
ENSMUST00000071370.5
|
Pcdh17
|
protocadherin 17 |
| chr18_+_11839220 | 0.00 |
ENSMUST00000171109.1
ENSMUST00000046948.8 |
Cables1
|
CDK5 and Abl enzyme substrate 1 |
| chr17_-_27167759 | 0.00 |
ENSMUST00000025046.2
|
Ip6k3
|
inositol hexaphosphate kinase 3 |
| chr9_+_44604844 | 0.00 |
ENSMUST00000170489.1
|
Ddx6
|
DEAD (Asp-Glu-Ala-Asp) box polypeptide 6 |
| chr15_-_66831625 | 0.00 |
ENSMUST00000164163.1
|
Sla
|
src-like adaptor |
| chr17_-_10319324 | 0.00 |
ENSMUST00000097414.3
ENSMUST00000042296.7 |
Qk
|
quaking |
| chr11_-_116853083 | 0.00 |
ENSMUST00000092404.6
|
Srsf2
|
serine/arginine-rich splicing factor 2 |
| chr6_-_35539765 | 0.00 |
ENSMUST00000031866.5
|
Mtpn
|
myotrophin |
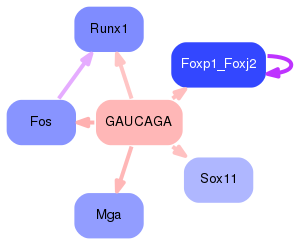
Network of associatons between targets according to the STRING database.

First level regulatory network of GAUCAGA
Gene Ontology Analysis
Gene overrepresentation in biological process category:
| Log-likelihood per target | Total log-likelihood | Term | Description |
|---|---|---|---|
| 0.1 | 0.2 | GO:0010705 | meiotic DNA double-strand break processing involved in reciprocal meiotic recombination(GO:0010705) double-strand break repair involved in meiotic recombination(GO:1990918) |
| 0.0 | 0.1 | GO:0044208 | 'de novo' AMP biosynthetic process(GO:0044208) |
| 0.0 | 0.1 | GO:0006564 | L-serine biosynthetic process(GO:0006564) |
| 0.0 | 0.1 | GO:0018171 | peptidyl-cysteine oxidation(GO:0018171) |
| 0.0 | 0.1 | GO:0030202 | heparin metabolic process(GO:0030202) |
| 0.0 | 0.1 | GO:0006556 | S-adenosylmethionine biosynthetic process(GO:0006556) |
Gene overrepresentation in cellular component category:
| Log-likelihood per target | Total log-likelihood | Term | Description |
|---|---|---|---|
| 0.0 | 0.1 | GO:0070552 | BRISC complex(GO:0070552) |
| 0.0 | 0.1 | GO:0048269 | methionine adenosyltransferase complex(GO:0048269) |
Gene overrepresentation in molecular function category:
| Log-likelihood per target | Total log-likelihood | Term | Description |
|---|---|---|---|
| 0.0 | 0.1 | GO:0008732 | threonine aldolase activity(GO:0004793) L-allo-threonine aldolase activity(GO:0008732) |
| 0.0 | 0.1 | GO:0004614 | phosphoglucomutase activity(GO:0004614) |