Project
2D miR_HR1_12
Navigation
Downloads
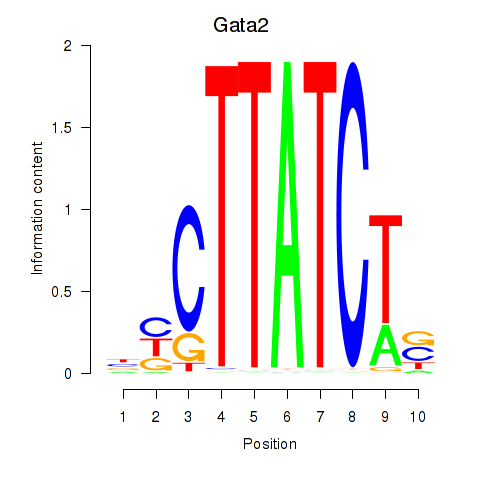
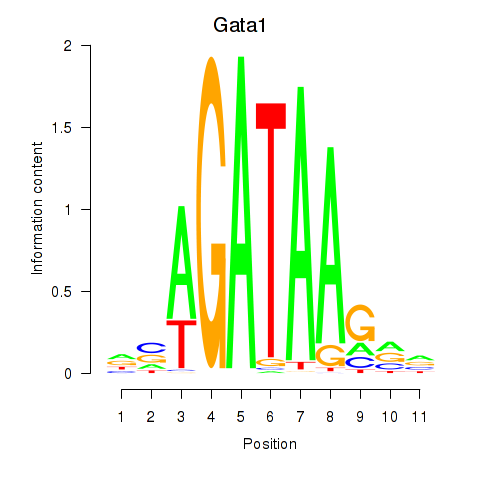
Results for Gata2_Gata1
Z-value: 1.75
Motif logo
Transcription factors associated with Gata2_Gata1
| Gene Symbol | Gene ID | Gene Info |
|---|---|---|
|
Gata2
|
ENSMUSG00000015053.8 | GATA binding protein 2 |
|
Gata1
|
ENSMUSG00000031162.8 | GATA binding protein 1 |
Activity-expression correlation:
| Gene | Promoter | Pearson corr. coef. | P-value | Plot |
|---|---|---|---|---|
| Gata2 | mm10_v2_chr6_+_88198656_88198675 | 0.19 | 5.5e-01 | Click! |
Activity profile of Gata2_Gata1 motif
Sorted Z-values of Gata2_Gata1 motif
| Promoter | Log-likelihood | Transcript | Gene | Gene Info |
|---|---|---|---|---|
| chr19_+_58670358 | 5.40 |
ENSMUST00000057270.7
|
Pnlip
|
pancreatic lipase |
| chr2_+_164403194 | 4.93 |
ENSMUST00000017151.1
|
Rbpjl
|
recombination signal binding protein for immunoglobulin kappa J region-like |
| chr6_+_30639218 | 4.86 |
ENSMUST00000031806.9
|
Cpa1
|
carboxypeptidase A1, pancreatic |
| chr5_+_115466234 | 4.01 |
ENSMUST00000145785.1
ENSMUST00000031495.4 ENSMUST00000112071.1 ENSMUST00000125568.1 |
Pla2g1b
|
phospholipase A2, group IB, pancreas |
| chr6_+_30541582 | 4.01 |
ENSMUST00000096066.4
|
Cpa2
|
carboxypeptidase A2, pancreatic |
| chr17_-_26199008 | 3.89 |
ENSMUST00000142410.1
ENSMUST00000120333.1 ENSMUST00000039113.7 |
Pdia2
|
protein disulfide isomerase associated 2 |
| chr6_-_136922169 | 3.76 |
ENSMUST00000032343.6
|
Erp27
|
endoplasmic reticulum protein 27 |
| chr6_+_41392356 | 3.76 |
ENSMUST00000049079.7
|
Gm5771
|
predicted gene 5771 |
| chr6_+_41302265 | 3.47 |
ENSMUST00000031913.4
|
Try4
|
trypsin 4 |
| chr9_+_46228580 | 3.31 |
ENSMUST00000034588.8
|
Apoa1
|
apolipoprotein A-I |
| chr4_-_137430517 | 3.30 |
ENSMUST00000102522.4
|
Cela3b
|
chymotrypsin-like elastase family, member 3B |
| chr3_+_135825788 | 3.10 |
ENSMUST00000167390.1
|
Slc39a8
|
solute carrier family 39 (metal ion transporter), member 8 |
| chr6_+_41458923 | 3.07 |
ENSMUST00000031910.7
|
Prss1
|
protease, serine, 1 (trypsin 1) |
| chr4_-_137409777 | 3.06 |
ENSMUST00000024200.6
|
Gm13011
|
predicted gene 13011 |
| chr1_-_173333503 | 3.01 |
ENSMUST00000038227.4
|
Darc
|
Duffy blood group, chemokine receptor |
| chr17_-_28560704 | 2.97 |
ENSMUST00000114785.1
ENSMUST00000025062.3 |
Clps
|
colipase, pancreatic |
| chr3_+_135826075 | 2.49 |
ENSMUST00000029810.5
|
Slc39a8
|
solute carrier family 39 (metal ion transporter), member 8 |
| chr7_+_110627650 | 2.46 |
ENSMUST00000033054.8
|
Adm
|
adrenomedullin |
| chr14_+_30886476 | 2.42 |
ENSMUST00000006703.6
ENSMUST00000078490.5 ENSMUST00000120269.2 |
Itih4
|
inter alpha-trypsin inhibitor, heavy chain 4 |
| chr7_-_4522427 | 2.42 |
ENSMUST00000098859.3
|
Tnni3
|
troponin I, cardiac 3 |
| chr4_+_41760454 | 2.39 |
ENSMUST00000108040.1
|
Il11ra1
|
interleukin 11 receptor, alpha chain 1 |
| chr1_-_74885322 | 2.36 |
ENSMUST00000159232.1
ENSMUST00000068631.3 |
Fev
|
FEV (ETS oncogene family) |
| chrX_-_107403295 | 2.25 |
ENSMUST00000033591.5
|
Itm2a
|
integral membrane protein 2A |
| chr17_-_31144271 | 2.22 |
ENSMUST00000024826.7
|
Tff2
|
trefoil factor 2 (spasmolytic protein 1) |
| chr3_+_122895072 | 2.22 |
ENSMUST00000023820.5
|
Fabp2
|
fatty acid binding protein 2, intestinal |
| chr7_+_28540863 | 2.17 |
ENSMUST00000119180.2
|
Sycn
|
syncollin |
| chr4_+_134864536 | 2.11 |
ENSMUST00000030627.7
|
Rhd
|
Rh blood group, D antigen |
| chr11_+_90030295 | 2.00 |
ENSMUST00000092788.3
|
Tmem100
|
transmembrane protein 100 |
| chr4_+_40920047 | 1.89 |
ENSMUST00000030122.4
|
Spink4
|
serine peptidase inhibitor, Kazal type 4 |
| chr7_-_100662315 | 1.82 |
ENSMUST00000151123.1
ENSMUST00000107047.2 |
Plekhb1
|
pleckstrin homology domain containing, family B (evectins) member 1 |
| chr4_+_135728116 | 1.79 |
ENSMUST00000102546.3
|
Il22ra1
|
interleukin 22 receptor, alpha 1 |
| chr4_+_150148905 | 1.78 |
ENSMUST00000059893.7
|
Slc2a7
|
solute carrier family 2 (facilitated glucose transporter), member 7 |
| chr8_+_13037308 | 1.73 |
ENSMUST00000063820.5
ENSMUST00000033821.4 |
F10
|
coagulation factor X |
| chr14_+_30886521 | 1.72 |
ENSMUST00000168782.1
|
Itih4
|
inter alpha-trypsin inhibitor, heavy chain 4 |
| chr7_-_100662414 | 1.70 |
ENSMUST00000079176.6
|
Plekhb1
|
pleckstrin homology domain containing, family B (evectins) member 1 |
| chr1_-_136960427 | 1.65 |
ENSMUST00000027649.7
|
Nr5a2
|
nuclear receptor subfamily 5, group A, member 2 |
| chr8_+_13037802 | 1.61 |
ENSMUST00000152034.1
ENSMUST00000128418.1 |
F10
|
coagulation factor X |
| chr6_-_41314700 | 1.56 |
ENSMUST00000064324.5
|
Try5
|
trypsin 5 |
| chr7_-_119459266 | 1.56 |
ENSMUST00000033255.5
|
Gp2
|
glycoprotein 2 (zymogen granule membrane) |
| chr3_-_75270073 | 1.45 |
ENSMUST00000039047.4
|
Serpini2
|
serine (or cysteine) peptidase inhibitor, clade I, member 2 |
| chr7_+_123462274 | 1.36 |
ENSMUST00000033023.3
|
Aqp8
|
aquaporin 8 |
| chr6_+_125552948 | 1.28 |
ENSMUST00000112254.1
ENSMUST00000112253.1 ENSMUST00000001995.7 |
Vwf
|
Von Willebrand factor homolog |
| chrX_+_140907602 | 1.26 |
ENSMUST00000033806.4
|
Vsig1
|
V-set and immunoglobulin domain containing 1 |
| chr11_+_70505244 | 1.26 |
ENSMUST00000019063.2
|
Tm4sf5
|
transmembrane 4 superfamily member 5 |
| chr7_-_99238564 | 1.25 |
ENSMUST00000064231.7
|
Mogat2
|
monoacylglycerol O-acyltransferase 2 |
| chr10_-_62342674 | 1.24 |
ENSMUST00000143179.1
ENSMUST00000130422.1 |
Hk1
|
hexokinase 1 |
| chr3_-_20242173 | 1.20 |
ENSMUST00000001921.1
|
Cpa3
|
carboxypeptidase A3, mast cell |
| chr3_-_84479418 | 1.13 |
ENSMUST00000091002.1
|
Fhdc1
|
FH2 domain containing 1 |
| chr8_+_84701430 | 1.10 |
ENSMUST00000037165.4
|
Lyl1
|
lymphoblastomic leukemia 1 |
| chr1_-_162866502 | 1.10 |
ENSMUST00000046049.7
|
Fmo1
|
flavin containing monooxygenase 1 |
| chr13_+_38345716 | 1.09 |
ENSMUST00000171970.1
|
Bmp6
|
bone morphogenetic protein 6 |
| chr11_+_87760533 | 1.08 |
ENSMUST00000039627.5
ENSMUST00000100644.3 |
Bzrap1
|
benzodiazepine receptor associated protein 1 |
| chr14_+_55560904 | 1.08 |
ENSMUST00000072530.4
ENSMUST00000128490.1 |
Dcaf11
|
DDB1 and CUL4 associated factor 11 |
| chr14_+_55561060 | 1.05 |
ENSMUST00000117701.1
|
Dcaf11
|
DDB1 and CUL4 associated factor 11 |
| chr2_-_103303179 | 1.02 |
ENSMUST00000090475.3
|
Ehf
|
ets homologous factor |
| chr19_-_11081088 | 1.02 |
ENSMUST00000025636.6
|
Ms4a8a
|
membrane-spanning 4-domains, subfamily A, member 8A |
| chr2_-_77170592 | 1.00 |
ENSMUST00000164114.2
ENSMUST00000049544.7 |
Ccdc141
|
coiled-coil domain containing 141 |
| chr7_-_139582790 | 0.95 |
ENSMUST00000106095.2
|
Nkx6-2
|
NK6 homeobox 2 |
| chr13_-_91388079 | 0.94 |
ENSMUST00000181054.1
|
A830009L08Rik
|
RIKEN cDNA A830009L08 gene |
| chr15_+_55307743 | 0.91 |
ENSMUST00000023053.5
ENSMUST00000110221.2 ENSMUST00000110217.3 |
Col14a1
|
collagen, type XIV, alpha 1 |
| chr19_-_6015152 | 0.90 |
ENSMUST00000025891.8
|
Capn1
|
calpain 1 |
| chr2_-_103303158 | 0.89 |
ENSMUST00000111176.2
|
Ehf
|
ets homologous factor |
| chr19_-_6015769 | 0.89 |
ENSMUST00000164843.1
|
Capn1
|
calpain 1 |
| chr16_+_45093611 | 0.88 |
ENSMUST00000099498.2
|
Ccdc80
|
coiled-coil domain containing 80 |
| chr14_+_27000362 | 0.88 |
ENSMUST00000035433.8
|
Hesx1
|
homeobox gene expressed in ES cells |
| chr10_+_80019621 | 0.85 |
ENSMUST00000043311.6
|
Hmha1
|
histocompatibility (minor) HA-1 |
| chr8_+_105269788 | 0.85 |
ENSMUST00000036127.2
ENSMUST00000163734.2 |
Hsf4
|
heat shock transcription factor 4 |
| chr4_+_133553370 | 0.82 |
ENSMUST00000042706.2
|
Nr0b2
|
nuclear receptor subfamily 0, group B, member 2 |
| chr16_+_45094036 | 0.81 |
ENSMUST00000061050.5
|
Ccdc80
|
coiled-coil domain containing 80 |
| chr19_-_46672883 | 0.80 |
ENSMUST00000026012.7
|
Cyp17a1
|
cytochrome P450, family 17, subfamily a, polypeptide 1 |
| chr19_-_40187277 | 0.79 |
ENSMUST00000051846.6
|
Cyp2c70
|
cytochrome P450, family 2, subfamily c, polypeptide 70 |
| chr7_-_30856178 | 0.78 |
ENSMUST00000094583.1
|
Ffar3
|
free fatty acid receptor 3 |
| chr2_-_52558539 | 0.78 |
ENSMUST00000102760.3
ENSMUST00000102761.2 |
Cacnb4
|
calcium channel, voltage-dependent, beta 4 subunit |
| chr2_+_70474923 | 0.75 |
ENSMUST00000100043.2
|
Sp5
|
trans-acting transcription factor 5 |
| chr6_-_122609964 | 0.70 |
ENSMUST00000032211.4
|
Gdf3
|
growth differentiation factor 3 |
| chr17_-_84682932 | 0.70 |
ENSMUST00000066175.3
|
Abcg5
|
ATP-binding cassette, sub-family G (WHITE), member 5 |
| chr2_+_103957976 | 0.70 |
ENSMUST00000156813.1
ENSMUST00000170926.1 |
Lmo2
|
LIM domain only 2 |
| chr6_-_125380793 | 0.69 |
ENSMUST00000042647.6
|
Plekhg6
|
pleckstrin homology domain containing, family G (with RhoGef domain) member 6 |
| chr13_+_42301270 | 0.67 |
ENSMUST00000021796.7
|
Edn1
|
endothelin 1 |
| chr17_+_84683113 | 0.66 |
ENSMUST00000045714.8
|
Abcg8
|
ATP-binding cassette, sub-family G (WHITE), member 8 |
| chr18_+_76059458 | 0.65 |
ENSMUST00000167921.1
|
Zbtb7c
|
zinc finger and BTB domain containing 7C |
| chr3_+_79884576 | 0.64 |
ENSMUST00000145992.1
|
Fam198b
|
family with sequence similarity 198, member B |
| chr4_+_119637704 | 0.64 |
ENSMUST00000024015.2
|
Guca2a
|
guanylate cyclase activator 2a (guanylin) |
| chr3_-_107221722 | 0.62 |
ENSMUST00000029504.8
|
Cym
|
chymosin |
| chr14_+_55560480 | 0.60 |
ENSMUST00000121622.1
ENSMUST00000143431.1 ENSMUST00000150481.1 |
Dcaf11
|
DDB1 and CUL4 associated factor 11 |
| chr2_+_69135799 | 0.58 |
ENSMUST00000041865.7
|
Nostrin
|
nitric oxide synthase trafficker |
| chrX_-_73869804 | 0.58 |
ENSMUST00000066576.5
ENSMUST00000114430.1 |
L1cam
|
L1 cell adhesion molecule |
| chr7_+_28833975 | 0.54 |
ENSMUST00000066723.8
|
Lgals4
|
lectin, galactose binding, soluble 4 |
| chr1_+_45311538 | 0.54 |
ENSMUST00000087883.6
|
Col3a1
|
collagen, type III, alpha 1 |
| chr19_-_10678001 | 0.53 |
ENSMUST00000025647.5
|
Pga5
|
pepsinogen 5, group I |
| chr3_-_59262825 | 0.53 |
ENSMUST00000050360.7
|
P2ry12
|
purinergic receptor P2Y, G-protein coupled 12 |
| chr4_-_138326234 | 0.52 |
ENSMUST00000105817.3
ENSMUST00000030536.6 |
Pink1
|
PTEN induced putative kinase 1 |
| chr11_+_110399115 | 0.52 |
ENSMUST00000020949.5
ENSMUST00000100260.1 |
Map2k6
|
mitogen-activated protein kinase kinase 6 |
| chr8_+_105269837 | 0.51 |
ENSMUST00000172525.1
ENSMUST00000174837.1 ENSMUST00000173859.1 |
Hsf4
|
heat shock transcription factor 4 |
| chr7_+_110773658 | 0.49 |
ENSMUST00000143786.1
|
Ampd3
|
adenosine monophosphate deaminase 3 |
| chr2_+_169633517 | 0.49 |
ENSMUST00000109157.1
|
Tshz2
|
teashirt zinc finger family member 2 |
| chr11_-_102469839 | 0.48 |
ENSMUST00000103086.3
|
Itga2b
|
integrin alpha 2b |
| chrX_-_7572843 | 0.45 |
ENSMUST00000132788.1
|
Ppp1r3f
|
protein phosphatase 1, regulatory (inhibitor) subunit 3F |
| chr14_-_54577578 | 0.44 |
ENSMUST00000054487.8
|
Ajuba
|
ajuba LIM protein |
| chr16_-_44016387 | 0.44 |
ENSMUST00000036174.3
|
Gramd1c
|
GRAM domain containing 1C |
| chr11_-_99438143 | 0.44 |
ENSMUST00000017743.2
|
Krt20
|
keratin 20 |
| chr14_-_52279238 | 0.42 |
ENSMUST00000167116.1
ENSMUST00000100631.4 |
Rab2b
|
RAB2B, member RAS oncogene family |
| chr9_-_53536608 | 0.40 |
ENSMUST00000150244.1
|
Atm
|
ataxia telangiectasia mutated homolog (human) |
| chr3_+_105904377 | 0.40 |
ENSMUST00000000574.1
|
Adora3
|
adenosine A3 receptor |
| chr8_+_84908731 | 0.39 |
ENSMUST00000134569.1
|
Dnase2a
|
deoxyribonuclease II alpha |
| chr19_-_7019423 | 0.38 |
ENSMUST00000040772.8
|
Fermt3
|
fermitin family homolog 3 (Drosophila) |
| chr9_+_110052016 | 0.37 |
ENSMUST00000164930.1
ENSMUST00000163979.1 |
Map4
|
microtubule-associated protein 4 |
| chr10_+_53337686 | 0.37 |
ENSMUST00000046221.6
ENSMUST00000163319.1 |
Pln
|
phospholamban |
| chr19_-_37176055 | 0.37 |
ENSMUST00000142973.1
ENSMUST00000154376.1 |
Cpeb3
|
cytoplasmic polyadenylation element binding protein 3 |
| chr19_+_38264761 | 0.36 |
ENSMUST00000087252.5
|
Lgi1
|
leucine-rich repeat LGI family, member 1 |
| chrX_+_73757069 | 0.36 |
ENSMUST00000002079.6
|
Plxnb3
|
plexin B3 |
| chr14_-_41069074 | 0.35 |
ENSMUST00000022316.4
|
Dydc2
|
DPY30 domain containing 2 |
| chr2_-_77170534 | 0.34 |
ENSMUST00000111833.2
|
Ccdc141
|
coiled-coil domain containing 141 |
| chr14_-_55560340 | 0.33 |
ENSMUST00000066106.3
|
A730061H03Rik
|
RIKEN cDNA A730061H03 gene |
| chr11_+_95337012 | 0.33 |
ENSMUST00000037502.6
|
Fam117a
|
family with sequence similarity 117, member A |
| chr3_+_3634145 | 0.33 |
ENSMUST00000108394.1
|
Hnf4g
|
hepatocyte nuclear factor 4, gamma |
| chr10_-_26078987 | 0.32 |
ENSMUST00000066049.6
|
Tmem200a
|
transmembrane protein 200A |
| chr19_+_11747548 | 0.32 |
ENSMUST00000025585.3
|
Gif
|
gastric intrinsic factor |
| chrX_+_150547375 | 0.32 |
ENSMUST00000066337.6
ENSMUST00000112715.1 |
Alas2
|
aminolevulinic acid synthase 2, erythroid |
| chr6_-_122856151 | 0.32 |
ENSMUST00000042081.8
|
C3ar1
|
complement component 3a receptor 1 |
| chr19_+_10015016 | 0.31 |
ENSMUST00000137637.1
ENSMUST00000149967.1 |
Rab3il1
|
RAB3A interacting protein (rabin3)-like 1 |
| chr4_-_59438633 | 0.31 |
ENSMUST00000040166.7
ENSMUST00000107544.1 |
Susd1
|
sushi domain containing 1 |
| chr2_-_60722636 | 0.31 |
ENSMUST00000028348.2
ENSMUST00000112517.1 |
Itgb6
|
integrin beta 6 |
| chr17_-_35046539 | 0.31 |
ENSMUST00000007250.7
|
Msh5
|
mutS homolog 5 (E. coli) |
| chr16_-_95459245 | 0.31 |
ENSMUST00000176345.1
ENSMUST00000121809.2 ENSMUST00000118113.1 ENSMUST00000122199.1 |
Erg
|
avian erythroblastosis virus E-26 (v-ets) oncogene related |
| chr11_+_96024540 | 0.29 |
ENSMUST00000103157.3
|
Gip
|
gastric inhibitory polypeptide |
| chr12_+_95692212 | 0.29 |
ENSMUST00000057324.3
|
Flrt2
|
fibronectin leucine rich transmembrane protein 2 |
| chr10_-_115185015 | 0.28 |
ENSMUST00000006949.8
|
Tph2
|
tryptophan hydroxylase 2 |
| chr8_+_105636509 | 0.28 |
ENSMUST00000005841.9
|
Ctcf
|
CCCTC-binding factor |
| chr8_-_110039330 | 0.28 |
ENSMUST00000109222.2
|
Chst4
|
carbohydrate (chondroitin 6/keratan) sulfotransferase 4 |
| chr11_+_67586520 | 0.27 |
ENSMUST00000108682.2
|
Gas7
|
growth arrest specific 7 |
| chr18_+_7869159 | 0.27 |
ENSMUST00000170932.1
ENSMUST00000167020.1 |
Wac
|
WW domain containing adaptor with coiled-coil |
| chr11_-_113709520 | 0.26 |
ENSMUST00000173655.1
ENSMUST00000100248.4 |
Cpsf4l
|
cleavage and polyadenylation specific factor 4-like |
| chr8_+_84901928 | 0.26 |
ENSMUST00000067060.7
|
Klf1
|
Kruppel-like factor 1 (erythroid) |
| chr10_-_34096507 | 0.25 |
ENSMUST00000069125.6
|
Fam26e
|
family with sequence similarity 26, member E |
| chr14_+_75455957 | 0.25 |
ENSMUST00000164848.1
|
Siah3
|
seven in absentia homolog 3 (Drosophila) |
| chr10_+_116177217 | 0.24 |
ENSMUST00000148731.1
|
Ptprr
|
protein tyrosine phosphatase, receptor type, R |
| chr1_+_75507077 | 0.23 |
ENSMUST00000037330.4
|
Inha
|
inhibin alpha |
| chr8_-_84044982 | 0.22 |
ENSMUST00000061923.4
|
Rln3
|
relaxin 3 |
| chr11_-_86357570 | 0.22 |
ENSMUST00000043624.8
|
Med13
|
mediator complex subunit 13 |
| chr8_+_84908680 | 0.21 |
ENSMUST00000145292.1
|
Dnase2a
|
deoxyribonuclease II alpha |
| chr3_-_144819494 | 0.20 |
ENSMUST00000029929.7
|
Clca2
|
chloride channel calcium activated 2 |
| chr17_+_84683131 | 0.20 |
ENSMUST00000171915.1
|
Abcg8
|
ATP-binding cassette, sub-family G (WHITE), member 8 |
| chr1_+_131744011 | 0.20 |
ENSMUST00000049027.3
|
Slc26a9
|
solute carrier family 26, member 9 |
| chr5_+_24364804 | 0.20 |
ENSMUST00000030834.4
ENSMUST00000115090.1 |
Nos3
|
nitric oxide synthase 3, endothelial cell |
| chr11_+_97801917 | 0.20 |
ENSMUST00000127033.2
|
Lasp1
|
LIM and SH3 protein 1 |
| chr8_+_84908560 | 0.19 |
ENSMUST00000003910.6
ENSMUST00000109744.1 |
Dnase2a
|
deoxyribonuclease II alpha |
| chr1_+_180942500 | 0.19 |
ENSMUST00000159436.1
|
Tmem63a
|
transmembrane protein 63a |
| chr6_-_136941887 | 0.18 |
ENSMUST00000111891.1
|
Arhgdib
|
Rho, GDP dissociation inhibitor (GDI) beta |
| chr18_+_57142782 | 0.18 |
ENSMUST00000139892.1
|
Megf10
|
multiple EGF-like-domains 10 |
| chr16_-_48771956 | 0.18 |
ENSMUST00000170861.1
|
Trat1
|
T cell receptor associated transmembrane adaptor 1 |
| chr7_-_135528645 | 0.17 |
ENSMUST00000053716.7
|
Clrn3
|
clarin 3 |
| chr10_+_116177351 | 0.17 |
ENSMUST00000155606.1
ENSMUST00000128399.1 |
Ptprr
|
protein tyrosine phosphatase, receptor type, R |
| chr10_+_90576777 | 0.17 |
ENSMUST00000183136.1
ENSMUST00000182595.1 |
Anks1b
|
ankyrin repeat and sterile alpha motif domain containing 1B |
| chr2_-_36104060 | 0.17 |
ENSMUST00000112961.3
ENSMUST00000112966.3 |
Lhx6
|
LIM homeobox protein 6 |
| chr14_-_13284638 | 0.16 |
ENSMUST00000060526.4
|
Gm5087
|
predicted gene 5087 |
| chr3_+_89136133 | 0.16 |
ENSMUST00000047111.6
|
Pklr
|
pyruvate kinase liver and red blood cell |
| chr1_-_132367879 | 0.16 |
ENSMUST00000142609.1
|
Tmcc2
|
transmembrane and coiled-coil domains 2 |
| chr12_-_25096080 | 0.15 |
ENSMUST00000020974.6
|
Id2
|
inhibitor of DNA binding 2 |
| chr4_-_119190005 | 0.15 |
ENSMUST00000138395.1
ENSMUST00000156746.1 |
Ermap
|
erythroblast membrane-associated protein |
| chr4_-_14621805 | 0.15 |
ENSMUST00000042221.7
|
Slc26a7
|
solute carrier family 26, member 7 |
| chr2_+_169632996 | 0.15 |
ENSMUST00000109159.2
|
Tshz2
|
teashirt zinc finger family member 2 |
| chrX_+_10252305 | 0.15 |
ENSMUST00000049910.6
|
Otc
|
ornithine transcarbamylase |
| chr16_+_25801907 | 0.14 |
ENSMUST00000040231.6
ENSMUST00000115306.1 ENSMUST00000115304.1 ENSMUST00000115305.1 |
Trp63
|
transformation related protein 63 |
| chr10_-_80421847 | 0.14 |
ENSMUST00000156244.1
|
Tcf3
|
transcription factor 3 |
| chr10_-_62327757 | 0.14 |
ENSMUST00000139228.1
|
Hk1
|
hexokinase 1 |
| chr2_+_91118136 | 0.14 |
ENSMUST00000169776.1
ENSMUST00000111430.3 ENSMUST00000137942.1 |
Mybpc3
|
myosin binding protein C, cardiac |
| chr6_+_15185439 | 0.14 |
ENSMUST00000118133.1
|
Foxp2
|
forkhead box P2 |
| chr17_-_85688252 | 0.14 |
ENSMUST00000024947.7
ENSMUST00000163568.2 |
Six2
|
sine oculis-related homeobox 2 |
| chr7_-_119895446 | 0.13 |
ENSMUST00000098080.2
|
Dcun1d3
|
DCN1, defective in cullin neddylation 1, domain containing 3 (S. cerevisiae) |
| chr4_-_119189949 | 0.12 |
ENSMUST00000124626.1
|
Ermap
|
erythroblast membrane-associated protein |
| chr8_-_39642669 | 0.12 |
ENSMUST00000026021.6
ENSMUST00000170091.1 |
Msr1
|
macrophage scavenger receptor 1 |
| chr10_+_90576708 | 0.12 |
ENSMUST00000182430.1
ENSMUST00000182960.1 ENSMUST00000182045.1 ENSMUST00000182083.1 |
Anks1b
|
ankyrin repeat and sterile alpha motif domain containing 1B |
| chr11_+_118428493 | 0.11 |
ENSMUST00000017590.2
|
C1qtnf1
|
C1q and tumor necrosis factor related protein 1 |
| chr10_+_5593718 | 0.11 |
ENSMUST00000051809.8
|
Myct1
|
myc target 1 |
| chr3_+_79884496 | 0.11 |
ENSMUST00000118853.1
|
Fam198b
|
family with sequence similarity 198, member B |
| chr8_+_34115030 | 0.11 |
ENSMUST00000095345.3
|
Mboat4
|
membrane bound O-acyltransferase domain containing 4 |
| chr15_-_101940255 | 0.11 |
ENSMUST00000023799.7
|
Krt79
|
keratin 79 |
| chr3_+_79885930 | 0.10 |
ENSMUST00000029567.8
|
Fam198b
|
family with sequence similarity 198, member B |
| chr10_+_90576872 | 0.10 |
ENSMUST00000182550.1
ENSMUST00000099364.5 |
Anks1b
|
ankyrin repeat and sterile alpha motif domain containing 1B |
| chr3_-_30013156 | 0.10 |
ENSMUST00000172694.1
|
Mecom
|
MDS1 and EVI1 complex locus |
| chr3_-_30140407 | 0.10 |
ENSMUST00000108271.3
|
Mecom
|
MDS1 and EVI1 complex locus |
| chr13_-_8871751 | 0.09 |
ENSMUST00000175958.1
|
Wdr37
|
WD repeat domain 37 |
| chrX_+_166238901 | 0.09 |
ENSMUST00000112235.1
|
Gpm6b
|
glycoprotein m6b |
| chr10_+_90576252 | 0.08 |
ENSMUST00000182427.1
ENSMUST00000182053.1 ENSMUST00000182113.1 |
Anks1b
|
ankyrin repeat and sterile alpha motif domain containing 1B |
| chr10_+_90576678 | 0.08 |
ENSMUST00000182284.1
|
Anks1b
|
ankyrin repeat and sterile alpha motif domain containing 1B |
| chr10_+_90576570 | 0.08 |
ENSMUST00000182786.1
ENSMUST00000182600.1 |
Anks1b
|
ankyrin repeat and sterile alpha motif domain containing 1B |
| chr10_-_83648631 | 0.08 |
ENSMUST00000146876.2
ENSMUST00000176294.1 |
Appl2
|
adaptor protein, phosphotyrosine interaction, PH domain and leucine zipper containing 2 |
| chr9_-_77251829 | 0.08 |
ENSMUST00000184322.1
ENSMUST00000184316.1 |
Mlip
|
muscular LMNA-interacting protein |
| chr4_-_14621494 | 0.08 |
ENSMUST00000149633.1
|
Slc26a7
|
solute carrier family 26, member 7 |
| chr4_-_46404224 | 0.07 |
ENSMUST00000107764.2
|
Hemgn
|
hemogen |
| chr1_-_138175283 | 0.07 |
ENSMUST00000182755.1
ENSMUST00000183262.1 ENSMUST00000027645.7 ENSMUST00000112036.2 ENSMUST00000182283.1 |
Ptprc
|
protein tyrosine phosphatase, receptor type, C |
| chr11_-_99322943 | 0.07 |
ENSMUST00000038004.2
|
Krt25
|
keratin 25 |
| chr9_-_77251871 | 0.07 |
ENSMUST00000183955.1
|
Mlip
|
muscular LMNA-interacting protein |
| chr16_+_44943678 | 0.07 |
ENSMUST00000114613.2
ENSMUST00000114612.1 ENSMUST00000077178.6 ENSMUST00000048479.7 ENSMUST00000114611.3 ENSMUST00000164007.1 ENSMUST00000171779.1 |
Cd200r3
|
CD200 receptor 3 |
| chr5_+_64812336 | 0.06 |
ENSMUST00000166409.1
|
Klf3
|
Kruppel-like factor 3 (basic) |
| chr11_-_26591729 | 0.06 |
ENSMUST00000109504.1
|
Vrk2
|
vaccinia related kinase 2 |
| chr15_+_80623499 | 0.06 |
ENSMUST00000043149.7
|
Grap2
|
GRB2-related adaptor protein 2 |
| chr3_+_89136572 | 0.05 |
ENSMUST00000107482.3
ENSMUST00000127058.1 |
Pklr
|
pyruvate kinase liver and red blood cell |
| chr1_+_75450699 | 0.05 |
ENSMUST00000037708.9
|
Asic4
|
acid-sensing (proton-gated) ion channel family member 4 |
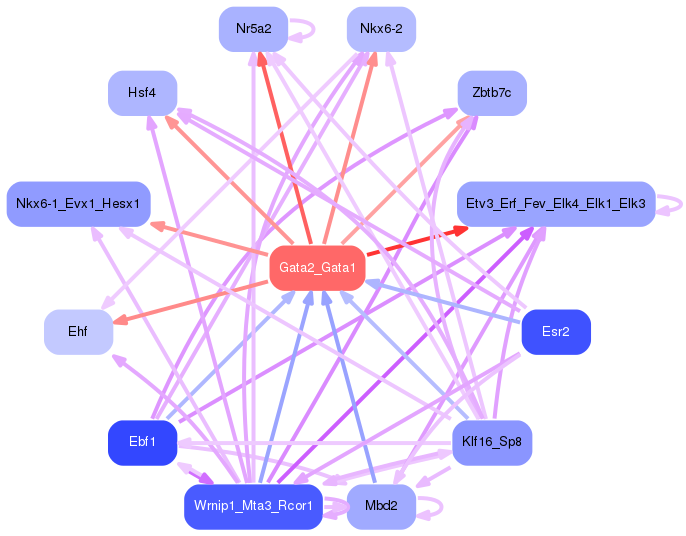
Network of associatons between targets according to the STRING database.

First level regulatory network of Gata2_Gata1
Gene Ontology Analysis
Gene overrepresentation in biological process category:
| Log-likelihood per target | Total log-likelihood | Term | Description |
|---|---|---|---|
| 1.3 | 4.0 | GO:0044240 | multicellular organism lipid catabolic process(GO:0044240) |
| 0.8 | 10.3 | GO:0030299 | intestinal cholesterol absorption(GO:0030299) |
| 0.6 | 2.4 | GO:0001980 | regulation of systemic arterial blood pressure by ischemic conditions(GO:0001980) |
| 0.6 | 5.6 | GO:0070574 | cadmium ion transport(GO:0015691) cadmium ion transmembrane transport(GO:0070574) |
| 0.5 | 3.2 | GO:0060586 | multicellular organismal iron ion homeostasis(GO:0060586) |
| 0.4 | 1.3 | GO:0046462 | monoacylglycerol metabolic process(GO:0046462) |
| 0.4 | 4.5 | GO:2001214 | positive regulation of vasculogenesis(GO:2001214) |
| 0.4 | 2.3 | GO:0002317 | plasma cell differentiation(GO:0002317) |
| 0.4 | 2.2 | GO:0060455 | negative regulation of gastric acid secretion(GO:0060455) |
| 0.3 | 1.6 | GO:0002386 | immune response in mucosal-associated lymphoid tissue(GO:0002386) |
| 0.3 | 2.4 | GO:0051611 | regulation of serotonin uptake(GO:0051611) |
| 0.3 | 0.5 | GO:0060414 | aorta smooth muscle tissue morphogenesis(GO:0060414) |
| 0.3 | 0.8 | GO:0002879 | positive regulation of acute inflammatory response to non-antigenic stimulus(GO:0002879) |
| 0.2 | 1.7 | GO:0061113 | pancreas morphogenesis(GO:0061113) |
| 0.2 | 1.4 | GO:0061718 | NADH regeneration(GO:0006735) canonical glycolysis(GO:0061621) glucose catabolic process to pyruvate(GO:0061718) |
| 0.2 | 1.4 | GO:0015722 | canalicular bile acid transport(GO:0015722) |
| 0.2 | 0.9 | GO:0030916 | otic vesicle formation(GO:0030916) |
| 0.2 | 0.7 | GO:0060585 | regulation of prostaglandin-endoperoxide synthase activity(GO:0060584) positive regulation of prostaglandin-endoperoxide synthase activity(GO:0060585) |
| 0.2 | 1.1 | GO:0001955 | blood vessel maturation(GO:0001955) |
| 0.1 | 17.4 | GO:0007586 | digestion(GO:0007586) |
| 0.1 | 0.3 | GO:0070094 | positive regulation of glucagon secretion(GO:0070094) |
| 0.1 | 0.7 | GO:0048859 | formation of anatomical boundary(GO:0048859) |
| 0.1 | 0.1 | GO:0048807 | female genitalia morphogenesis(GO:0048807) squamous basal epithelial stem cell differentiation involved in prostate gland acinus development(GO:0060529) |
| 0.1 | 1.8 | GO:0097264 | self proteolysis(GO:0097264) |
| 0.1 | 1.0 | GO:0021912 | regulation of transcription from RNA polymerase II promoter involved in spinal cord motor neuron fate specification(GO:0021912) |
| 0.1 | 0.4 | GO:1904884 | pre-B cell allelic exclusion(GO:0002331) signal transduction involved in G2 DNA damage checkpoint(GO:0072425) signal transduction involved in mitotic G2 DNA damage checkpoint(GO:0072434) telomerase catalytic core complex assembly(GO:1904868) regulation of telomerase catalytic core complex assembly(GO:1904882) positive regulation of telomerase catalytic core complex assembly(GO:1904884) |
| 0.1 | 0.5 | GO:1904139 | microglial cell migration(GO:1904124) regulation of microglial cell migration(GO:1904139) |
| 0.1 | 0.5 | GO:0036482 | neuron intrinsic apoptotic signaling pathway in response to hydrogen peroxide(GO:0036482) positive regulation of mitochondrial electron transport, NADH to ubiquinone(GO:1902958) regulation of hydrogen peroxide-induced neuron intrinsic apoptotic signaling pathway(GO:1903383) negative regulation of hydrogen peroxide-induced neuron intrinsic apoptotic signaling pathway(GO:1903384) |
| 0.1 | 0.4 | GO:0002182 | cytoplasmic translational elongation(GO:0002182) regulation of cytoplasmic translational elongation(GO:1900247) negative regulation of cytoplasmic translational elongation(GO:1900248) |
| 0.1 | 1.2 | GO:0002002 | regulation of angiotensin levels in blood(GO:0002002) |
| 0.1 | 4.1 | GO:0030212 | hyaluronan metabolic process(GO:0030212) |
| 0.1 | 2.3 | GO:0046697 | decidualization(GO:0046697) |
| 0.1 | 0.2 | GO:0032277 | negative regulation of gonadotropin secretion(GO:0032277) negative regulation of follicle-stimulating hormone secretion(GO:0046882) |
| 0.1 | 3.5 | GO:1902175 | regulation of oxidative stress-induced intrinsic apoptotic signaling pathway(GO:1902175) |
| 0.1 | 0.3 | GO:0040030 | regulation of molecular function, epigenetic(GO:0040030) |
| 0.1 | 0.4 | GO:0010593 | negative regulation of lamellipodium assembly(GO:0010593) |
| 0.1 | 1.1 | GO:0070995 | NADPH oxidation(GO:0070995) |
| 0.1 | 1.0 | GO:0033631 | cell-cell adhesion mediated by integrin(GO:0033631) |
| 0.1 | 0.2 | GO:0061030 | epithelial cell differentiation involved in mammary gland alveolus development(GO:0061030) |
| 0.1 | 0.4 | GO:0051012 | microtubule sliding(GO:0051012) |
| 0.1 | 0.7 | GO:1903025 | regulation of RNA polymerase II regulatory region sequence-specific DNA binding(GO:1903025) |
| 0.1 | 0.8 | GO:0098870 | neuronal action potential propagation(GO:0019227) action potential propagation(GO:0098870) |
| 0.1 | 0.4 | GO:0038128 | ERBB2 signaling pathway(GO:0038128) |
| 0.1 | 0.8 | GO:0019373 | epoxygenase P450 pathway(GO:0019373) |
| 0.1 | 0.3 | GO:0002461 | tolerance induction dependent upon immune response(GO:0002461) |
| 0.1 | 0.4 | GO:0035331 | negative regulation of hippo signaling(GO:0035331) |
| 0.1 | 0.2 | GO:1903215 | negative regulation of protein targeting to mitochondrion(GO:1903215) |
| 0.1 | 0.5 | GO:0032264 | purine nucleotide salvage(GO:0032261) IMP salvage(GO:0032264) |
| 0.1 | 0.7 | GO:0097067 | cellular response to thyroid hormone stimulus(GO:0097067) |
| 0.1 | 0.5 | GO:0032308 | positive regulation of prostaglandin secretion(GO:0032308) |
| 0.1 | 1.3 | GO:0033169 | histone H3-K9 demethylation(GO:0033169) |
| 0.1 | 0.3 | GO:0071894 | histone H2B conserved C-terminal lysine ubiquitination(GO:0071894) |
| 0.1 | 0.3 | GO:0015889 | cobalamin transport(GO:0015889) |
| 0.1 | 0.8 | GO:0042448 | progesterone metabolic process(GO:0042448) |
| 0.1 | 0.6 | GO:1900383 | regulation of synaptic plasticity by receptor localization to synapse(GO:1900383) |
| 0.1 | 0.3 | GO:0003199 | endocardial cushion to mesenchymal transition involved in heart valve formation(GO:0003199) |
| 0.1 | 0.2 | GO:0003100 | regulation of systemic arterial blood pressure by endothelin(GO:0003100) regulation of muscle hyperplasia(GO:0014738) muscle hyperplasia(GO:0014900) positive regulation of guanylate cyclase activity(GO:0031284) |
| 0.0 | 0.2 | GO:0014719 | skeletal muscle satellite cell activation(GO:0014719) |
| 0.0 | 0.4 | GO:0086023 | adrenergic receptor signaling pathway involved in heart process(GO:0086023) |
| 0.0 | 0.4 | GO:0002441 | histamine production involved in inflammatory response(GO:0002349) histamine secretion involved in inflammatory response(GO:0002441) histamine secretion by mast cell(GO:0002553) |
| 0.0 | 0.3 | GO:0038044 | transforming growth factor-beta secretion(GO:0038044) |
| 0.0 | 0.8 | GO:0006309 | apoptotic DNA fragmentation(GO:0006309) |
| 0.0 | 0.5 | GO:2000465 | regulation of glycogen (starch) synthase activity(GO:2000465) |
| 0.0 | 0.2 | GO:0001920 | negative regulation of receptor recycling(GO:0001920) |
| 0.0 | 0.4 | GO:0006348 | chromatin silencing at telomere(GO:0006348) |
| 0.0 | 0.1 | GO:0097168 | condensed mesenchymal cell proliferation(GO:0072137) mesenchymal stem cell proliferation(GO:0097168) positive regulation of chondrocyte proliferation(GO:1902732) |
| 0.0 | 0.2 | GO:0021853 | cerebral cortex GABAergic interneuron migration(GO:0021853) interneuron migration(GO:1904936) |
| 0.0 | 3.4 | GO:0051897 | positive regulation of protein kinase B signaling(GO:0051897) |
| 0.0 | 0.3 | GO:0061343 | cell adhesion involved in heart morphogenesis(GO:0061343) |
| 0.0 | 0.3 | GO:1901162 | serotonin biosynthetic process(GO:0042427) primary amino compound biosynthetic process(GO:1901162) |
| 0.0 | 1.3 | GO:0051642 | centrosome localization(GO:0051642) |
| 0.0 | 0.3 | GO:0006477 | protein sulfation(GO:0006477) |
| 0.0 | 0.2 | GO:0042866 | pyruvate biosynthetic process(GO:0042866) |
| 0.0 | 1.8 | GO:0050829 | defense response to Gram-negative bacterium(GO:0050829) |
| 0.0 | 0.3 | GO:0051026 | chiasma assembly(GO:0051026) |
| 0.0 | 0.6 | GO:0036342 | post-anal tail morphogenesis(GO:0036342) |
| 0.0 | 0.2 | GO:1901164 | negative regulation of trophoblast cell migration(GO:1901164) |
| 0.0 | 0.3 | GO:0042541 | hemoglobin biosynthetic process(GO:0042541) |
| 0.0 | 0.1 | GO:0002326 | B cell lineage commitment(GO:0002326) |
| 0.0 | 0.3 | GO:0043249 | erythrocyte maturation(GO:0043249) |
| 0.0 | 0.9 | GO:0048873 | homeostasis of number of cells within a tissue(GO:0048873) |
| 0.0 | 0.5 | GO:0045109 | intermediate filament organization(GO:0045109) |
| 0.0 | 0.1 | GO:0010886 | positive regulation of cholesterol storage(GO:0010886) |
| 0.0 | 0.1 | GO:0042450 | arginine biosynthetic process via ornithine(GO:0042450) |
| 0.0 | 0.0 | GO:0071600 | otic vesicle morphogenesis(GO:0071600) |
| 0.0 | 3.1 | GO:0010466 | negative regulation of peptidase activity(GO:0010466) |
| 0.0 | 1.6 | GO:0030168 | platelet activation(GO:0030168) |
| 0.0 | 0.2 | GO:0008272 | sulfate transport(GO:0008272) |
| 0.0 | 0.1 | GO:0071688 | striated muscle myosin thick filament assembly(GO:0071688) |
| 0.0 | 0.1 | GO:0098789 | pre-mRNA cleavage required for polyadenylation(GO:0098789) |
| 0.0 | 0.1 | GO:0090336 | positive regulation of brown fat cell differentiation(GO:0090336) |
Gene overrepresentation in cellular component category:
| Log-likelihood per target | Total log-likelihood | Term | Description |
|---|---|---|---|
| 0.7 | 3.3 | GO:0034365 | discoidal high-density lipoprotein particle(GO:0034365) |
| 0.6 | 2.4 | GO:1990584 | cardiac Troponin complex(GO:1990584) |
| 0.5 | 1.6 | GO:0043190 | ATP-binding cassette (ABC) transporter complex(GO:0043190) |
| 0.5 | 1.4 | GO:0046691 | intracellular canaliculus(GO:0046691) |
| 0.2 | 2.2 | GO:0045179 | apical cortex(GO:0045179) |
| 0.1 | 1.1 | GO:0033093 | Weibel-Palade body(GO:0033093) |
| 0.1 | 0.3 | GO:0034685 | integrin alphav-beta6 complex(GO:0034685) |
| 0.1 | 2.6 | GO:0005614 | interstitial matrix(GO:0005614) |
| 0.1 | 0.2 | GO:0034673 | inhibin-betaglycan-ActRII complex(GO:0034673) inhibin A complex(GO:0043512) |
| 0.1 | 2.7 | GO:0080008 | Cul4-RING E3 ubiquitin ligase complex(GO:0080008) |
| 0.1 | 0.1 | GO:0005863 | striated muscle myosin thick filament(GO:0005863) |
| 0.1 | 0.5 | GO:0005742 | mitochondrial outer membrane translocase complex(GO:0005742) |
| 0.1 | 1.4 | GO:0097228 | sperm principal piece(GO:0097228) |
| 0.0 | 0.5 | GO:0098643 | fibrillar collagen trimer(GO:0005583) banded collagen fibril(GO:0098643) |
| 0.0 | 0.6 | GO:0044294 | dendritic growth cone(GO:0044294) |
| 0.0 | 3.0 | GO:0001750 | photoreceptor outer segment(GO:0001750) |
| 0.0 | 4.6 | GO:0072562 | blood microparticle(GO:0072562) |
| 0.0 | 40.3 | GO:0005615 | extracellular space(GO:0005615) |
| 0.0 | 1.6 | GO:0030667 | secretory granule membrane(GO:0030667) |
| 0.0 | 0.4 | GO:0048188 | Set1C/COMPASS complex(GO:0048188) |
| 0.0 | 0.8 | GO:0005891 | voltage-gated calcium channel complex(GO:0005891) |
| 0.0 | 0.4 | GO:0030014 | CCR4-NOT complex(GO:0030014) messenger ribonucleoprotein complex(GO:1990124) |
| 0.0 | 2.0 | GO:0043204 | perikaryon(GO:0043204) |
| 0.0 | 1.4 | GO:0031225 | anchored component of membrane(GO:0031225) |
Gene overrepresentation in molecular function category:
| Log-likelihood per target | Total log-likelihood | Term | Description |
|---|---|---|---|
| 0.8 | 3.3 | GO:0070653 | high-density lipoprotein particle receptor binding(GO:0070653) |
| 0.8 | 2.4 | GO:0030172 | troponin C binding(GO:0030172) |
| 0.6 | 2.4 | GO:0019970 | interleukin-11 receptor activity(GO:0004921) interleukin-11 binding(GO:0019970) |
| 0.6 | 1.8 | GO:0042015 | interleukin-20 binding(GO:0042015) |
| 0.5 | 4.0 | GO:0047498 | calcium-dependent phospholipase A2 activity(GO:0047498) |
| 0.4 | 1.3 | GO:0003846 | 2-acylglycerol O-acyltransferase activity(GO:0003846) |
| 0.4 | 3.9 | GO:0031545 | peptidyl-proline 4-dioxygenase activity(GO:0031545) |
| 0.3 | 10.1 | GO:0004181 | metallocarboxypeptidase activity(GO:0004181) |
| 0.3 | 2.2 | GO:0005324 | long-chain fatty acid transporter activity(GO:0005324) |
| 0.3 | 5.4 | GO:0004806 | triglyceride lipase activity(GO:0004806) |
| 0.2 | 0.8 | GO:0004531 | deoxyribonuclease II activity(GO:0004531) |
| 0.2 | 2.2 | GO:0045236 | CXCR chemokine receptor binding(GO:0045236) |
| 0.2 | 4.1 | GO:0005540 | hyaluronic acid binding(GO:0005540) |
| 0.2 | 5.6 | GO:0005385 | zinc ion transmembrane transporter activity(GO:0005385) |
| 0.2 | 1.4 | GO:0019158 | fructokinase activity(GO:0008865) mannokinase activity(GO:0019158) |
| 0.2 | 0.7 | GO:0031708 | endothelin B receptor binding(GO:0031708) |
| 0.2 | 1.1 | GO:0004499 | N,N-dimethylaniline monooxygenase activity(GO:0004499) |
| 0.2 | 0.5 | GO:2001069 | glycogen binding(GO:2001069) |
| 0.1 | 0.4 | GO:0004677 | DNA-dependent protein kinase activity(GO:0004677) |
| 0.1 | 0.6 | GO:0010853 | cyclase activator activity(GO:0010853) guanylate cyclase activator activity(GO:0030250) |
| 0.1 | 0.3 | GO:0016748 | succinyltransferase activity(GO:0016748) |
| 0.1 | 1.4 | GO:0015250 | water channel activity(GO:0015250) |
| 0.1 | 16.9 | GO:0004252 | serine-type endopeptidase activity(GO:0004252) |
| 0.1 | 0.5 | GO:0070051 | fibrinogen binding(GO:0070051) |
| 0.1 | 2.1 | GO:0008519 | ammonium transmembrane transporter activity(GO:0008519) |
| 0.1 | 1.3 | GO:0019865 | immunoglobulin binding(GO:0019865) |
| 0.1 | 1.1 | GO:0070700 | BMP receptor binding(GO:0070700) |
| 0.1 | 0.9 | GO:0001609 | G-protein coupled adenosine receptor activity(GO:0001609) |
| 0.1 | 0.5 | GO:0016936 | galactoside binding(GO:0016936) |
| 0.1 | 0.6 | GO:0033691 | sialic acid binding(GO:0033691) |
| 0.1 | 0.2 | GO:0004743 | pyruvate kinase activity(GO:0004743) |
| 0.1 | 1.8 | GO:0004198 | calcium-dependent cysteine-type endopeptidase activity(GO:0004198) |
| 0.1 | 0.3 | GO:0004510 | tryptophan 5-monooxygenase activity(GO:0004510) |
| 0.1 | 0.2 | GO:0034617 | tetrahydrobiopterin binding(GO:0034617) |
| 0.1 | 0.5 | GO:0055131 | C3HC4-type RING finger domain binding(GO:0055131) |
| 0.1 | 0.5 | GO:0003876 | AMP deaminase activity(GO:0003876) adenosine-phosphate deaminase activity(GO:0047623) |
| 0.1 | 0.4 | GO:0042030 | ATPase inhibitor activity(GO:0042030) |
| 0.1 | 1.6 | GO:0008395 | steroid hydroxylase activity(GO:0008395) |
| 0.1 | 1.7 | GO:0001968 | fibronectin binding(GO:0001968) |
| 0.1 | 0.3 | GO:0001517 | N-acetylglucosamine 6-O-sulfotransferase activity(GO:0001517) |
| 0.0 | 1.2 | GO:0004190 | aspartic-type endopeptidase activity(GO:0004190) aspartic-type peptidase activity(GO:0070001) |
| 0.0 | 0.3 | GO:0004875 | complement receptor activity(GO:0004875) |
| 0.0 | 0.8 | GO:0008331 | high voltage-gated calcium channel activity(GO:0008331) |
| 0.0 | 1.1 | GO:0017127 | cholesterol transporter activity(GO:0017127) |
| 0.0 | 0.4 | GO:0051022 | Rho GDP-dissociation inhibitor binding(GO:0051022) |
| 0.0 | 0.3 | GO:0031419 | cobalamin binding(GO:0031419) |
| 0.0 | 0.5 | GO:0048407 | platelet-derived growth factor binding(GO:0048407) |
| 0.0 | 3.2 | GO:0005179 | hormone activity(GO:0005179) |
| 0.0 | 3.1 | GO:0004867 | serine-type endopeptidase inhibitor activity(GO:0004867) |
| 0.0 | 0.8 | GO:0042975 | peroxisome proliferator activated receptor binding(GO:0042975) |
| 0.0 | 0.4 | GO:0019531 | oxalate transmembrane transporter activity(GO:0019531) |
| 0.0 | 0.3 | GO:0030983 | mismatched DNA binding(GO:0030983) |
| 0.0 | 0.4 | GO:0035925 | mRNA 3'-UTR AU-rich region binding(GO:0035925) |
| 0.0 | 0.7 | GO:0070888 | E-box binding(GO:0070888) |
| 0.0 | 0.4 | GO:0045294 | alpha-catenin binding(GO:0045294) |
| 0.0 | 0.2 | GO:0001849 | complement component C1q binding(GO:0001849) |
| 0.0 | 0.5 | GO:0004708 | MAP kinase kinase activity(GO:0004708) |
| 0.0 | 1.3 | GO:0001540 | beta-amyloid binding(GO:0001540) |
| 0.0 | 0.2 | GO:0005094 | Rho GDP-dissociation inhibitor activity(GO:0005094) |
| 0.0 | 0.3 | GO:0045499 | chemorepellent activity(GO:0045499) |
| 0.0 | 0.7 | GO:0005160 | transforming growth factor beta receptor binding(GO:0005160) |
| 0.0 | 1.6 | GO:0003823 | antigen binding(GO:0003823) |
| 0.0 | 10.0 | GO:0000978 | RNA polymerase II core promoter proximal region sequence-specific DNA binding(GO:0000978) |
| 0.0 | 0.4 | GO:0042800 | histone methyltransferase activity (H3-K4 specific)(GO:0042800) |
| 0.0 | 0.1 | GO:0016743 | carboxyl- or carbamoyltransferase activity(GO:0016743) |
| 0.0 | 0.6 | GO:0046875 | ephrin receptor binding(GO:0046875) |
| 0.0 | 0.2 | GO:0005229 | intracellular calcium activated chloride channel activity(GO:0005229) |
| 0.0 | 1.4 | GO:0001227 | transcriptional repressor activity, RNA polymerase II transcription regulatory region sequence-specific binding(GO:0001227) |
Gene overrepresentation in curated gene sets: canonical pathways category:
| Log-likelihood per target | Total log-likelihood | Term | Description |
|---|---|---|---|
| 0.1 | 13.3 | NABA ECM REGULATORS | Genes encoding enzymes and their regulators involved in the remodeling of the extracellular matrix |
| 0.1 | 0.5 | PID ANTHRAX PATHWAY | Cellular roles of Anthrax toxin |
| 0.1 | 0.8 | PID ERB GENOMIC PATHWAY | Validated nuclear estrogen receptor beta network |
| 0.0 | 3.6 | PID FCER1 PATHWAY | Fc-epsilon receptor I signaling in mast cells |
| 0.0 | 2.9 | PID ERA GENOMIC PATHWAY | Validated nuclear estrogen receptor alpha network |
| 0.0 | 1.7 | PID PTP1B PATHWAY | Signaling events mediated by PTP1B |
| 0.0 | 2.5 | PID HIF1 TFPATHWAY | HIF-1-alpha transcription factor network |
| 0.0 | 0.3 | PID INTEGRIN5 PATHWAY | Beta5 beta6 beta7 and beta8 integrin cell surface interactions |
| 0.0 | 1.2 | NABA COLLAGENS | Genes encoding collagen proteins |
| 0.0 | 0.6 | PID INTEGRIN3 PATHWAY | Beta3 integrin cell surface interactions |
| 0.0 | 0.4 | PID NFKAPPAB CANONICAL PATHWAY | Canonical NF-kappaB pathway |
| 0.0 | 0.7 | PID HNF3B PATHWAY | FOXA2 and FOXA3 transcription factor networks |
| 0.0 | 0.2 | PID VEGFR1 PATHWAY | VEGFR1 specific signals |
| 0.0 | 0.9 | PID RHOA REG PATHWAY | Regulation of RhoA activity |
Gene overrepresentation in curated gene sets: REACTOME pathways category:
| Log-likelihood per target | Total log-likelihood | Term | Description |
|---|---|---|---|
| 0.3 | 5.6 | REACTOME ZINC TRANSPORTERS | Genes involved in Zinc transporters |
| 0.2 | 8.7 | REACTOME METABOLISM OF STEROID HORMONES AND VITAMINS A AND D | Genes involved in Metabolism of steroid hormones and vitamins A and D |
| 0.2 | 3.3 | REACTOME COMMON PATHWAY | Genes involved in Common Pathway |
| 0.2 | 4.0 | REACTOME ACYL CHAIN REMODELLING OF PI | Genes involved in Acyl chain remodelling of PI |
| 0.2 | 4.9 | REACTOME ABCA TRANSPORTERS IN LIPID HOMEOSTASIS | Genes involved in ABCA transporters in lipid homeostasis |
| 0.1 | 1.4 | REACTOME PASSIVE TRANSPORT BY AQUAPORINS | Genes involved in Passive Transport by Aquaporins |
| 0.1 | 1.8 | REACTOME P130CAS LINKAGE TO MAPK SIGNALING FOR INTEGRINS | Genes involved in p130Cas linkage to MAPK signaling for integrins |
| 0.1 | 1.7 | REACTOME FACILITATIVE NA INDEPENDENT GLUCOSE TRANSPORTERS | Genes involved in Facilitative Na+-independent glucose transporters |
| 0.1 | 1.6 | REACTOME DEGRADATION OF THE EXTRACELLULAR MATRIX | Genes involved in Degradation of the extracellular matrix |
| 0.0 | 0.9 | REACTOME NUCLEOTIDE LIKE PURINERGIC RECEPTORS | Genes involved in Nucleotide-like (purinergic) receptors |
| 0.0 | 0.4 | REACTOME G2 M DNA DAMAGE CHECKPOINT | Genes involved in G2/M DNA damage checkpoint |
| 0.0 | 1.1 | REACTOME PHASE1 FUNCTIONALIZATION OF COMPOUNDS | Genes involved in Phase 1 - Functionalization of compounds |
| 0.0 | 1.5 | REACTOME REGULATION OF BETA CELL DEVELOPMENT | Genes involved in Regulation of beta-cell development |
| 0.0 | 4.1 | REACTOME PEPTIDE LIGAND BINDING RECEPTORS | Genes involved in Peptide ligand-binding receptors |
| 0.0 | 0.5 | REACTOME PURINE SALVAGE | Genes involved in Purine salvage |
| 0.0 | 2.7 | REACTOME CLASS B 2 SECRETIN FAMILY RECEPTORS | Genes involved in Class B/2 (Secretin family receptors) |
| 0.0 | 0.2 | REACTOME GLYCOPROTEIN HORMONES | Genes involved in Glycoprotein hormones |
| 0.0 | 0.5 | REACTOME ACTIVATED TAK1 MEDIATES P38 MAPK ACTIVATION | Genes involved in activated TAK1 mediates p38 MAPK activation |
| 0.0 | 0.3 | REACTOME MEIOSIS | Genes involved in Meiosis |
| 0.0 | 1.1 | REACTOME NCAM1 INTERACTIONS | Genes involved in NCAM1 interactions |
| 0.0 | 0.9 | REACTOME EXTRACELLULAR MATRIX ORGANIZATION | Genes involved in Extracellular matrix organization |
| 0.0 | 0.3 | REACTOME AMINE DERIVED HORMONES | Genes involved in Amine-derived hormones |
| 0.0 | 0.4 | REACTOME OTHER SEMAPHORIN INTERACTIONS | Genes involved in Other semaphorin interactions |
| 0.0 | 0.6 | REACTOME RECYCLING PATHWAY OF L1 | Genes involved in Recycling pathway of L1 |
| 0.0 | 0.4 | REACTOME STRIATED MUSCLE CONTRACTION | Genes involved in Striated Muscle Contraction |
| 0.0 | 0.2 | REACTOME TETRAHYDROBIOPTERIN BH4 SYNTHESIS RECYCLING SALVAGE AND REGULATION | Genes involved in Tetrahydrobiopterin (BH4) synthesis, recycling, salvage and regulation |
| 0.0 | 0.3 | REACTOME INTEGRIN CELL SURFACE INTERACTIONS | Genes involved in Integrin cell surface interactions |
| 0.0 | 0.5 | REACTOME GLUCOSE TRANSPORT | Genes involved in Glucose transport |