Project
2D miR_HR1_12
Navigation
Downloads
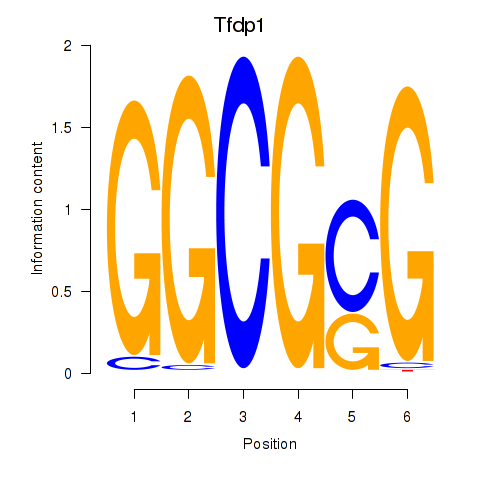
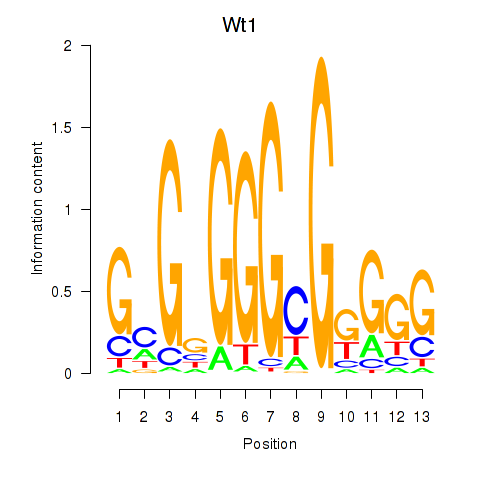
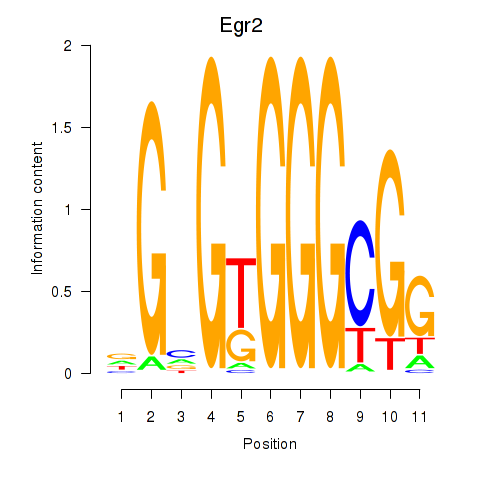
Results for Tfdp1_Wt1_Egr2
Z-value: 4.94
Motif logo
Transcription factors associated with Tfdp1_Wt1_Egr2
| Gene Symbol | Gene ID | Gene Info |
|---|---|---|
|
Tfdp1
|
ENSMUSG00000038482.10 | transcription factor Dp 1 |
|
Wt1
|
ENSMUSG00000016458.7 | Wilms tumor 1 homolog |
|
Egr2
|
ENSMUSG00000037868.9 | early growth response 2 |
Activity-expression correlation:
| Gene | Promoter | Pearson corr. coef. | P-value | Plot |
|---|---|---|---|---|
| Tfdp1 | mm10_v2_chr8_+_13339656_13339674 | 0.90 | 5.7e-05 | Click! |
| Egr2 | mm10_v2_chr10_+_67535493_67535583 | 0.66 | 2.0e-02 | Click! |
| Wt1 | mm10_v2_chr2_+_105127200_105127222 | 0.37 | 2.3e-01 | Click! |
Activity profile of Tfdp1_Wt1_Egr2 motif
Sorted Z-values of Tfdp1_Wt1_Egr2 motif
| Promoter | Log-likelihood | Transcript | Gene | Gene Info |
|---|---|---|---|---|
| chr12_-_108275409 | 23.60 |
ENSMUST00000136175.1
|
Ccdc85c
|
coiled-coil domain containing 85C |
| chr11_+_77930800 | 21.16 |
ENSMUST00000093995.3
ENSMUST00000000646.7 |
Sez6
|
seizure related gene 6 |
| chr9_+_55326913 | 20.64 |
ENSMUST00000085754.3
ENSMUST00000034862.4 |
AI118078
|
expressed sequence AI118078 |
| chr7_-_38107490 | 13.93 |
ENSMUST00000108023.3
|
Ccne1
|
cyclin E1 |
| chr12_+_109453455 | 13.61 |
ENSMUST00000109844.4
ENSMUST00000109842.2 ENSMUST00000109843.1 ENSMUST00000109846.4 ENSMUST00000173539.1 ENSMUST00000109841.2 |
Dlk1
|
delta-like 1 homolog (Drosophila) |
| chr9_-_31913462 | 13.52 |
ENSMUST00000116615.3
|
Barx2
|
BarH-like homeobox 2 |
| chr7_-_127026479 | 13.21 |
ENSMUST00000032916.4
|
Maz
|
MYC-associated zinc finger protein (purine-binding transcription factor) |
| chr10_+_40883819 | 12.87 |
ENSMUST00000105509.1
|
Wasf1
|
WAS protein family, member 1 |
| chr13_-_55329723 | 12.23 |
ENSMUST00000021941.7
|
Mxd3
|
Max dimerization protein 3 |
| chr5_+_110286306 | 11.96 |
ENSMUST00000007296.5
ENSMUST00000112482.1 |
Pole
|
polymerase (DNA directed), epsilon |
| chr12_-_112929415 | 11.69 |
ENSMUST00000075827.3
|
Jag2
|
jagged 2 |
| chr12_-_5375682 | 11.45 |
ENSMUST00000020958.8
|
Klhl29
|
kelch-like 29 |
| chr4_+_122995944 | 11.22 |
ENSMUST00000106252.2
|
Mycl
|
v-myc myelocytomatosis viral oncogene homolog, lung carcinoma derived (avian) |
| chr17_-_24251382 | 10.89 |
ENSMUST00000115390.3
|
Ccnf
|
cyclin F |
| chr4_+_11191726 | 10.73 |
ENSMUST00000029866.9
ENSMUST00000108324.3 |
Ccne2
|
cyclin E2 |
| chr11_+_119942763 | 10.48 |
ENSMUST00000026436.3
ENSMUST00000106231.1 ENSMUST00000075180.5 ENSMUST00000103021.3 ENSMUST00000106233.1 |
Baiap2
|
brain-specific angiogenesis inhibitor 1-associated protein 2 |
| chr9_-_97018823 | 10.48 |
ENSMUST00000055433.4
|
Spsb4
|
splA/ryanodine receptor domain and SOCS box containing 4 |
| chr19_+_6084983 | 10.43 |
ENSMUST00000025704.2
|
Cdca5
|
cell division cycle associated 5 |
| chr19_+_7268296 | 10.20 |
ENSMUST00000066646.4
|
Rcor2
|
REST corepressor 2 |
| chr7_-_34812677 | 9.99 |
ENSMUST00000078686.6
|
Chst8
|
carbohydrate (N-acetylgalactosamine 4-0) sulfotransferase 8 |
| chr9_-_21760275 | 9.94 |
ENSMUST00000098942.4
|
Spc24
|
SPC24, NDC80 kinetochore complex component, homolog (S. cerevisiae) |
| chr6_+_120666388 | 9.74 |
ENSMUST00000112686.1
|
Cecr2
|
cat eye syndrome chromosome region, candidate 2 |
| chr4_+_122996035 | 9.52 |
ENSMUST00000030407.7
|
Mycl
|
v-myc myelocytomatosis viral oncogene homolog, lung carcinoma derived (avian) |
| chr2_-_181135103 | 9.48 |
ENSMUST00000149964.2
ENSMUST00000103050.3 ENSMUST00000081528.6 ENSMUST00000049792.8 ENSMUST00000103048.3 ENSMUST00000103047.3 ENSMUST00000129073.1 ENSMUST00000144592.1 ENSMUST00000139458.1 ENSMUST00000154164.1 ENSMUST00000123336.1 ENSMUST00000129361.1 ENSMUST00000103051.2 |
Kcnq2
|
potassium voltage-gated channel, subfamily Q, member 2 |
| chr10_-_80577285 | 9.43 |
ENSMUST00000038558.8
|
Klf16
|
Kruppel-like factor 16 |
| chr2_+_139678178 | 9.08 |
ENSMUST00000184404.1
ENSMUST00000099307.3 |
Ism1
|
isthmin 1 homolog (zebrafish) |
| chr7_-_48881596 | 9.08 |
ENSMUST00000119223.1
|
E2f8
|
E2F transcription factor 8 |
| chr17_-_25727364 | 8.99 |
ENSMUST00000170070.1
ENSMUST00000048054.7 |
Chtf18
|
CTF18, chromosome transmission fidelity factor 18 |
| chr11_-_77489666 | 8.94 |
ENSMUST00000037593.7
ENSMUST00000092892.3 |
Ankrd13b
|
ankyrin repeat domain 13b |
| chr1_-_9700209 | 8.73 |
ENSMUST00000088658.4
|
Mybl1
|
myeloblastosis oncogene-like 1 |
| chr19_+_38055002 | 8.68 |
ENSMUST00000096096.4
ENSMUST00000116506.1 ENSMUST00000169673.1 |
Cep55
|
centrosomal protein 55 |
| chr12_-_11265768 | 8.67 |
ENSMUST00000166117.1
|
Gen1
|
Gen homolog 1, endonuclease (Drosophila) |
| chr2_+_127336152 | 8.63 |
ENSMUST00000028846.6
|
Dusp2
|
dual specificity phosphatase 2 |
| chr8_-_123859423 | 8.42 |
ENSMUST00000034452.5
|
Ccsap
|
centriole, cilia and spindle associated protein |
| chr17_+_25717171 | 8.23 |
ENSMUST00000172002.1
|
Gng13
|
guanine nucleotide binding protein (G protein), gamma 13 |
| chr9_+_106453838 | 8.19 |
ENSMUST00000024260.6
|
Pcbp4
|
poly(rC) binding protein 4 |
| chr2_-_152398046 | 8.19 |
ENSMUST00000063332.8
ENSMUST00000182625.1 |
Sox12
|
SRY-box containing gene 12 |
| chr4_+_127169131 | 8.18 |
ENSMUST00000046659.7
|
Dlgap3
|
discs, large (Drosophila) homolog-associated protein 3 |
| chr2_+_30066419 | 8.17 |
ENSMUST00000067996.6
|
Set
|
SET nuclear oncogene |
| chr14_+_3412614 | 8.13 |
ENSMUST00000170123.1
|
Gm10409
|
predicted gene 10409 |
| chr2_+_154791344 | 8.10 |
ENSMUST00000140713.1
ENSMUST00000137333.1 |
Raly
a
|
hnRNP-associated with lethal yellow nonagouti |
| chr14_-_31830402 | 7.79 |
ENSMUST00000014640.7
|
Ankrd28
|
ankyrin repeat domain 28 |
| chr4_+_46450892 | 7.75 |
ENSMUST00000102926.4
|
Anp32b
|
acidic (leucine-rich) nuclear phosphoprotein 32 family, member B |
| chr2_+_91922178 | 7.74 |
ENSMUST00000170432.1
|
Chrm4
|
cholinergic receptor, muscarinic 4 |
| chr19_+_18670780 | 7.74 |
ENSMUST00000025632.9
|
2410127L17Rik
|
RIKEN cDNA 2410127L17 gene |
| chr7_-_48881032 | 7.74 |
ENSMUST00000058745.8
|
E2f8
|
E2F transcription factor 8 |
| chr15_-_82212796 | 7.72 |
ENSMUST00000179269.1
|
AI848285
|
expressed sequence AI848285 |
| chr13_+_55445301 | 7.64 |
ENSMUST00000001115.8
ENSMUST00000099482.3 |
Grk6
|
G protein-coupled receptor kinase 6 |
| chr2_-_181135220 | 7.57 |
ENSMUST00000016491.7
|
Kcnq2
|
potassium voltage-gated channel, subfamily Q, member 2 |
| chr16_+_93883895 | 7.52 |
ENSMUST00000023666.4
ENSMUST00000117099.1 ENSMUST00000142316.1 |
Chaf1b
|
chromatin assembly factor 1, subunit B (p60) |
| chr14_+_45351473 | 7.52 |
ENSMUST00000111835.2
|
Styx
|
serine/threonine/tyrosine interaction protein |
| chr2_-_122369130 | 7.43 |
ENSMUST00000151130.1
ENSMUST00000125826.1 |
Shf
|
Src homology 2 domain containing F |
| chr17_+_46297406 | 7.35 |
ENSMUST00000061722.6
ENSMUST00000166280.1 |
Dlk2
|
delta-like 2 homolog (Drosophila) |
| chr17_-_45686120 | 7.32 |
ENSMUST00000143907.1
ENSMUST00000127065.1 |
Tmem63b
|
transmembrane protein 63b |
| chr5_+_36868467 | 7.31 |
ENSMUST00000031003.7
|
Ppp2r2c
|
protein phosphatase 2 (formerly 2A), regulatory subunit B (PR 52), gamma isoform |
| chr6_+_134929089 | 7.24 |
ENSMUST00000183867.1
ENSMUST00000184991.1 ENSMUST00000183905.1 |
RP23-45G16.5
|
RP23-45G16.5 |
| chr7_+_27258725 | 7.23 |
ENSMUST00000079258.6
|
Numbl
|
numb-like |
| chr5_-_135251209 | 7.16 |
ENSMUST00000062572.2
|
Fzd9
|
frizzled homolog 9 (Drosophila) |
| chr6_+_134929118 | 7.15 |
ENSMUST00000185152.1
ENSMUST00000184504.1 |
RP23-45G16.5
|
RP23-45G16.5 |
| chr9_-_24503127 | 7.15 |
ENSMUST00000142064.1
ENSMUST00000170356.1 |
Dpy19l1
|
dpy-19-like 1 (C. elegans) |
| chr1_+_92831614 | 7.05 |
ENSMUST00000045970.6
|
Gpc1
|
glypican 1 |
| chr6_-_148946146 | 7.04 |
ENSMUST00000132696.1
|
Fam60a
|
family with sequence similarity 60, member A |
| chr2_-_102451792 | 7.02 |
ENSMUST00000099678.3
|
Fjx1
|
four jointed box 1 (Drosophila) |
| chr8_+_57511833 | 7.00 |
ENSMUST00000067925.6
|
Hmgb2
|
high mobility group box 2 |
| chr7_+_141061274 | 6.96 |
ENSMUST00000048002.5
|
B4galnt4
|
beta-1,4-N-acetyl-galactosaminyl transferase 4 |
| chr17_+_46297917 | 6.95 |
ENSMUST00000166617.1
ENSMUST00000170271.1 |
Dlk2
|
delta-like 2 homolog (Drosophila) |
| chr11_-_72411695 | 6.95 |
ENSMUST00000108500.1
ENSMUST00000050226.6 |
Smtnl2
|
smoothelin-like 2 |
| chr16_+_35983424 | 6.91 |
ENSMUST00000173555.1
|
Kpna1
|
karyopherin (importin) alpha 1 |
| chrX_+_73639414 | 6.89 |
ENSMUST00000019701.8
|
Dusp9
|
dual specificity phosphatase 9 |
| chr5_-_20882072 | 6.81 |
ENSMUST00000118174.1
|
Phtf2
|
putative homeodomain transcription factor 2 |
| chr11_-_4947991 | 6.80 |
ENSMUST00000093369.4
|
Nefh
|
neurofilament, heavy polypeptide |
| chr1_-_33907721 | 6.76 |
ENSMUST00000115161.1
ENSMUST00000062289.8 |
Bend6
|
BEN domain containing 6 |
| chr5_-_8422582 | 6.72 |
ENSMUST00000168500.1
ENSMUST00000002368.9 |
Dbf4
|
DBF4 homolog (S. cerevisiae) |
| chr5_-_136244865 | 6.69 |
ENSMUST00000005188.9
|
Sh2b2
|
SH2B adaptor protein 2 |
| chr7_-_133123312 | 6.68 |
ENSMUST00000171022.1
ENSMUST00000163601.1 ENSMUST00000165534.1 ENSMUST00000033269.8 ENSMUST00000124096.1 |
Ctbp2
Fgfr2
|
C-terminal binding protein 2 fibroblast growth factor receptor 2 |
| chr4_+_52439235 | 6.66 |
ENSMUST00000117280.1
ENSMUST00000102915.3 ENSMUST00000142227.1 |
Smc2
|
structural maintenance of chromosomes 2 |
| chr5_-_96161990 | 6.65 |
ENSMUST00000155901.1
|
Cnot6l
|
CCR4-NOT transcription complex, subunit 6-like |
| chr11_+_79660532 | 6.64 |
ENSMUST00000155381.1
|
Rab11fip4
|
RAB11 family interacting protein 4 (class II) |
| chr4_+_11191354 | 6.61 |
ENSMUST00000170901.1
|
Ccne2
|
cyclin E2 |
| chr17_-_45685973 | 6.58 |
ENSMUST00000145873.1
|
Tmem63b
|
transmembrane protein 63b |
| chr8_-_84800024 | 6.54 |
ENSMUST00000126806.1
ENSMUST00000076715.6 |
Nfix
|
nuclear factor I/X |
| chr7_-_133123160 | 6.53 |
ENSMUST00000166439.1
|
Ctbp2
|
C-terminal binding protein 2 |
| chr3_-_69044697 | 6.51 |
ENSMUST00000136512.1
ENSMUST00000143454.1 ENSMUST00000107802.1 |
Trim59
|
tripartite motif-containing 59 |
| chr2_+_163054682 | 6.49 |
ENSMUST00000018005.3
|
Mybl2
|
myeloblastosis oncogene-like 2 |
| chr2_+_167062934 | 6.46 |
ENSMUST00000125674.1
|
1500012F01Rik
|
RIKEN cDNA 1500012F01 gene |
| chr15_+_78428564 | 6.45 |
ENSMUST00000166142.2
ENSMUST00000162517.1 ENSMUST00000089414.4 |
Kctd17
|
potassium channel tetramerisation domain containing 17 |
| chr15_+_84680974 | 6.44 |
ENSMUST00000065499.4
|
Prr5
|
proline rich 5 (renal) |
| chr4_-_57300362 | 6.42 |
ENSMUST00000153926.1
|
Ptpn3
|
protein tyrosine phosphatase, non-receptor type 3 |
| chr17_+_31564749 | 6.41 |
ENSMUST00000175806.1
ENSMUST00000097352.3 |
Pknox1
|
Pbx/knotted 1 homeobox |
| chr12_-_102704896 | 6.41 |
ENSMUST00000178697.1
ENSMUST00000046518.5 |
Itpk1
|
inositol 1,3,4-triphosphate 5/6 kinase |
| chr1_+_180641330 | 6.34 |
ENSMUST00000085804.5
|
Lin9
|
lin-9 homolog (C. elegans) |
| chr13_-_69611421 | 6.27 |
ENSMUST00000091514.5
|
Srd5a1
|
steroid 5 alpha-reductase 1 |
| chrX_+_71556874 | 6.26 |
ENSMUST00000123100.1
|
Hmgb3
|
high mobility group box 3 |
| chr12_-_11150305 | 6.23 |
ENSMUST00000055673.1
|
Kcns3
|
potassium voltage-gated channel, delayed-rectifier, subfamily S, member 3 |
| chr9_-_106656081 | 6.18 |
ENSMUST00000023959.7
|
Grm2
|
glutamate receptor, metabotropic 2 |
| chr4_-_43499608 | 6.10 |
ENSMUST00000136005.1
ENSMUST00000054538.6 |
Arhgef39
|
Rho guanine nucleotide exchange factor (GEF) 39 |
| chr5_-_53213447 | 6.10 |
ENSMUST00000031090.6
|
Sel1l3
|
sel-1 suppressor of lin-12-like 3 (C. elegans) |
| chr10_-_5805412 | 6.09 |
ENSMUST00000019907.7
|
Fbxo5
|
F-box protein 5 |
| chr4_+_48585135 | 6.07 |
ENSMUST00000030032.6
|
Tmeff1
|
transmembrane protein with EGF-like and two follistatin-like domains 1 |
| chr4_+_48585193 | 6.05 |
ENSMUST00000107703.1
|
Tmeff1
|
transmembrane protein with EGF-like and two follistatin-like domains 1 |
| chr5_-_110286159 | 6.04 |
ENSMUST00000031472.5
|
Pxmp2
|
peroxisomal membrane protein 2 |
| chr4_-_129121699 | 5.99 |
ENSMUST00000135763.1
ENSMUST00000149763.1 ENSMUST00000164649.1 |
Hpca
|
hippocalcin |
| chr17_+_27556641 | 5.93 |
ENSMUST00000119486.1
ENSMUST00000118599.1 |
Hmga1
|
high mobility group AT-hook 1 |
| chr5_-_124249758 | 5.91 |
ENSMUST00000162812.1
|
Pitpnm2
|
phosphatidylinositol transfer protein, membrane-associated 2 |
| chr17_+_56304313 | 5.89 |
ENSMUST00000113035.1
ENSMUST00000113039.2 ENSMUST00000142387.1 |
Uhrf1
|
ubiquitin-like, containing PHD and RING finger domains, 1 |
| chr17_+_27556613 | 5.88 |
ENSMUST00000117600.1
ENSMUST00000114888.3 |
Hmga1
|
high mobility group AT-hook 1 |
| chr7_+_100227311 | 5.88 |
ENSMUST00000084935.3
|
Pgm2l1
|
phosphoglucomutase 2-like 1 |
| chr17_+_25717489 | 5.86 |
ENSMUST00000115108.3
|
Gng13
|
guanine nucleotide binding protein (G protein), gamma 13 |
| chr15_+_82274935 | 5.82 |
ENSMUST00000023095.6
|
Sept3
|
septin 3 |
| chr1_-_192855723 | 5.81 |
ENSMUST00000155579.1
|
Sertad4
|
SERTA domain containing 4 |
| chr10_+_128232065 | 5.78 |
ENSMUST00000055539.4
ENSMUST00000105244.1 ENSMUST00000105243.2 ENSMUST00000125289.1 ENSMUST00000105242.1 |
Timeless
|
timeless circadian clock 1 |
| chr7_-_78577771 | 5.77 |
ENSMUST00000039438.7
|
Ntrk3
|
neurotrophic tyrosine kinase, receptor, type 3 |
| chr2_-_129297205 | 5.77 |
ENSMUST00000052708.6
|
Ckap2l
|
cytoskeleton associated protein 2-like |
| chr2_+_125247190 | 5.75 |
ENSMUST00000082122.7
|
Dut
|
deoxyuridine triphosphatase |
| chr4_-_83486178 | 5.72 |
ENSMUST00000130626.1
|
Psip1
|
PC4 and SFRS1 interacting protein 1 |
| chr8_-_53638945 | 5.68 |
ENSMUST00000047768.4
|
Neil3
|
nei like 3 (E. coli) |
| chr7_+_126847908 | 5.65 |
ENSMUST00000147257.1
ENSMUST00000139174.1 |
Doc2a
|
double C2, alpha |
| chr2_-_146511899 | 5.64 |
ENSMUST00000131824.1
|
Ralgapa2
|
Ral GTPase activating protein, alpha subunit 2 (catalytic) |
| chr3_-_54735001 | 5.61 |
ENSMUST00000153224.1
|
Exosc8
|
exosome component 8 |
| chr15_+_78913916 | 5.54 |
ENSMUST00000089378.4
|
Pdxp
|
pyridoxal (pyridoxine, vitamin B6) phosphatase |
| chr7_+_46396439 | 5.54 |
ENSMUST00000025202.6
|
Kcnc1
|
potassium voltage gated channel, Shaw-related subfamily, member 1 |
| chr17_+_26414820 | 5.53 |
ENSMUST00000182897.1
ENSMUST00000183077.1 ENSMUST00000053020.7 |
Neurl1b
|
neuralized homolog 1b (Drosophila) |
| chr4_-_133753611 | 5.52 |
ENSMUST00000145664.2
ENSMUST00000105897.3 |
Arid1a
|
AT rich interactive domain 1A (SWI-like) |
| chr9_+_95559817 | 5.51 |
ENSMUST00000079597.5
|
Paqr9
|
progestin and adipoQ receptor family member IX |
| chr5_-_96161742 | 5.50 |
ENSMUST00000129646.1
ENSMUST00000113005.2 ENSMUST00000154500.1 ENSMUST00000141383.1 |
Cnot6l
|
CCR4-NOT transcription complex, subunit 6-like |
| chr7_+_29289300 | 5.49 |
ENSMUST00000048187.4
|
Ppp1r14a
|
protein phosphatase 1, regulatory (inhibitor) subunit 14A |
| chr13_-_73937761 | 5.49 |
ENSMUST00000022053.8
|
Trip13
|
thyroid hormone receptor interactor 13 |
| chr5_-_107987003 | 5.48 |
ENSMUST00000145239.1
ENSMUST00000031198.4 |
Fam69a
|
family with sequence similarity 69, member A |
| chr15_+_82275197 | 5.45 |
ENSMUST00000116423.1
|
Sept3
|
septin 3 |
| chr2_+_72476159 | 5.45 |
ENSMUST00000102691.4
|
Cdca7
|
cell division cycle associated 7 |
| chr5_-_115194283 | 5.42 |
ENSMUST00000112113.1
|
Cabp1
|
calcium binding protein 1 |
| chr8_-_84800344 | 5.33 |
ENSMUST00000099070.3
|
Nfix
|
nuclear factor I/X |
| chr5_+_142702091 | 5.31 |
ENSMUST00000058418.7
|
Slc29a4
|
solute carrier family 29 (nucleoside transporters), member 4 |
| chr17_+_27556668 | 5.31 |
ENSMUST00000117254.1
ENSMUST00000118570.1 |
Hmga1
|
high mobility group AT-hook 1 |
| chr11_+_3202684 | 5.30 |
ENSMUST00000125637.1
|
Eif4enif1
|
eukaryotic translation initiation factor 4E nuclear import factor 1 |
| chr13_-_107022027 | 5.30 |
ENSMUST00000117539.1
ENSMUST00000122233.1 ENSMUST00000022204.9 ENSMUST00000159772.1 |
Kif2a
|
kinesin family member 2A |
| chr3_+_104638658 | 5.28 |
ENSMUST00000046212.1
|
Slc16a1
|
solute carrier family 16 (monocarboxylic acid transporters), member 1 |
| chr9_+_119402444 | 5.28 |
ENSMUST00000035093.8
ENSMUST00000165044.1 |
Acvr2b
|
activin receptor IIB |
| chr2_-_102186322 | 5.27 |
ENSMUST00000111222.1
ENSMUST00000058790.5 |
Ldlrad3
|
low density lipoprotein receptor class A domain containing 3 |
| chr8_+_83997613 | 5.27 |
ENSMUST00000095228.3
|
Samd1
|
sterile alpha motif domain containing 1 |
| chr18_+_56707725 | 5.26 |
ENSMUST00000025486.8
|
Lmnb1
|
lamin B1 |
| chr17_+_83350925 | 5.26 |
ENSMUST00000096766.4
ENSMUST00000112363.2 ENSMUST00000049503.8 |
Eml4
|
echinoderm microtubule associated protein like 4 |
| chr7_-_4778141 | 5.24 |
ENSMUST00000094892.5
|
Il11
|
interleukin 11 |
| chr10_+_40883469 | 5.23 |
ENSMUST00000019975.7
|
Wasf1
|
WAS protein family, member 1 |
| chr7_-_25250720 | 5.20 |
ENSMUST00000116343.2
ENSMUST00000045847.8 |
Erf
|
Ets2 repressor factor |
| chr7_+_80294450 | 5.18 |
ENSMUST00000163812.2
ENSMUST00000047558.7 ENSMUST00000174199.1 ENSMUST00000173824.1 ENSMUST00000174172.1 |
Prc1
|
protein regulator of cytokinesis 1 |
| chr9_-_44721383 | 5.16 |
ENSMUST00000148929.1
ENSMUST00000123406.1 |
Phldb1
|
pleckstrin homology-like domain, family B, member 1 |
| chr4_-_133967235 | 5.16 |
ENSMUST00000123234.1
|
Hmgn2
|
high mobility group nucleosomal binding domain 2 |
| chr14_+_3652030 | 5.15 |
ENSMUST00000167430.1
|
Gm3020
|
predicted gene 3020 |
| chr3_+_88532314 | 5.14 |
ENSMUST00000172699.1
|
Mex3a
|
mex3 homolog A (C. elegans) |
| chr5_-_8422695 | 5.11 |
ENSMUST00000171808.1
|
Dbf4
|
DBF4 homolog (S. cerevisiae) |
| chr15_+_26309039 | 5.10 |
ENSMUST00000140840.1
ENSMUST00000152841.1 |
March11
|
membrane-associated ring finger (C3HC4) 11 |
| chr2_+_31245801 | 5.09 |
ENSMUST00000000199.7
|
Ncs1
|
neuronal calcium sensor 1 |
| chr6_-_85513586 | 5.07 |
ENSMUST00000095759.3
|
Egr4
|
early growth response 4 |
| chr15_-_36608959 | 5.06 |
ENSMUST00000001809.8
|
Pabpc1
|
poly(A) binding protein, cytoplasmic 1 |
| chr11_-_120824098 | 5.05 |
ENSMUST00000055655.7
|
Fasn
|
fatty acid synthase |
| chr14_+_5501674 | 5.05 |
ENSMUST00000181562.1
|
Gm3488
|
predicted gene, 3488 |
| chr17_-_86145139 | 5.03 |
ENSMUST00000095187.3
|
Srbd1
|
S1 RNA binding domain 1 |
| chr2_+_158768083 | 5.02 |
ENSMUST00000029183.2
|
Fam83d
|
family with sequence similarity 83, member D |
| chr17_-_26201328 | 5.00 |
ENSMUST00000025019.2
|
Arhgdig
|
Rho GDP dissociation inhibitor (GDI) gamma |
| chr14_-_65833963 | 4.98 |
ENSMUST00000022613.9
|
Esco2
|
establishment of cohesion 1 homolog 2 (S. cerevisiae) |
| chr17_-_45595842 | 4.96 |
ENSMUST00000164618.1
ENSMUST00000097317.3 ENSMUST00000170113.1 |
Slc29a1
|
solute carrier family 29 (nucleoside transporters), member 1 |
| chr5_-_138171248 | 4.94 |
ENSMUST00000153867.1
|
Mcm7
|
minichromosome maintenance deficient 7 (S. cerevisiae) |
| chr3_+_137864487 | 4.94 |
ENSMUST00000041045.7
|
H2afz
|
H2A histone family, member Z |
| chr1_+_72824482 | 4.92 |
ENSMUST00000047328.4
|
Igfbp2
|
insulin-like growth factor binding protein 2 |
| chrX_-_142966709 | 4.91 |
ENSMUST00000041317.2
|
Ammecr1
|
Alport syndrome, mental retardation, midface hypoplasia and elliptocytosis chromosomal region gene 1 |
| chr1_+_172481788 | 4.90 |
ENSMUST00000127052.1
|
Igsf9
|
immunoglobulin superfamily, member 9 |
| chr12_+_113156403 | 4.88 |
ENSMUST00000049271.8
|
4930427A07Rik
|
RIKEN cDNA 4930427A07 gene |
| chr7_-_4812351 | 4.86 |
ENSMUST00000079496.7
|
Ube2s
|
ubiquitin-conjugating enzyme E2S |
| chr6_+_50110186 | 4.86 |
ENSMUST00000166318.1
ENSMUST00000036236.8 ENSMUST00000036225.8 |
Mpp6
|
membrane protein, palmitoylated 6 (MAGUK p55 subfamily member 6) |
| chr6_-_47594967 | 4.86 |
ENSMUST00000081721.6
ENSMUST00000114618.1 ENSMUST00000114616.1 |
Ezh2
|
enhancer of zeste homolog 2 (Drosophila) |
| chr3_+_137864573 | 4.85 |
ENSMUST00000174561.1
ENSMUST00000173790.1 |
H2afz
|
H2A histone family, member Z |
| chr2_-_136387929 | 4.82 |
ENSMUST00000035264.2
ENSMUST00000077200.3 |
Pak7
|
p21 protein (Cdc42/Rac)-activated kinase 7 |
| chr1_+_134962553 | 4.82 |
ENSMUST00000027687.7
|
Ube2t
|
ubiquitin-conjugating enzyme E2T (putative) |
| chr11_-_88718165 | 4.79 |
ENSMUST00000107908.1
|
Msi2
|
musashi RNA-binding protein 2 |
| chr11_+_117849286 | 4.79 |
ENSMUST00000093906.4
|
Birc5
|
baculoviral IAP repeat-containing 5 |
| chr4_+_126556935 | 4.78 |
ENSMUST00000048391.8
|
Clspn
|
claspin |
| chr7_+_13278778 | 4.78 |
ENSMUST00000098814.4
ENSMUST00000146998.1 ENSMUST00000185145.1 |
Lig1
|
ligase I, DNA, ATP-dependent |
| chr7_+_126759601 | 4.77 |
ENSMUST00000050201.4
ENSMUST00000057669.9 |
Mapk3
|
mitogen-activated protein kinase 3 |
| chr2_+_153031852 | 4.76 |
ENSMUST00000037235.6
|
Xkr7
|
X Kell blood group precursor related family member 7 homolog |
| chr13_-_69533839 | 4.74 |
ENSMUST00000044081.7
|
Papd7
|
PAP associated domain containing 7 |
| chr9_-_61946768 | 4.72 |
ENSMUST00000034815.7
|
Kif23
|
kinesin family member 23 |
| chr18_+_84088077 | 4.71 |
ENSMUST00000060223.2
|
Zadh2
|
zinc binding alcohol dehydrogenase, domain containing 2 |
| chr5_+_120649188 | 4.71 |
ENSMUST00000156722.1
|
Rasal1
|
RAS protein activator like 1 (GAP1 like) |
| chr11_+_78178651 | 4.70 |
ENSMUST00000092880.7
ENSMUST00000127587.1 ENSMUST00000108338.1 |
Tlcd1
|
TLC domain containing 1 |
| chr5_+_30711564 | 4.69 |
ENSMUST00000114729.1
|
Dpysl5
|
dihydropyrimidinase-like 5 |
| chr4_+_48585276 | 4.69 |
ENSMUST00000123476.1
|
Tmeff1
|
transmembrane protein with EGF-like and two follistatin-like domains 1 |
| chr3_+_10012548 | 4.69 |
ENSMUST00000029046.8
|
Fabp5
|
fatty acid binding protein 5, epidermal |
| chr4_-_136956784 | 4.69 |
ENSMUST00000030420.8
|
Epha8
|
Eph receptor A8 |
| chr4_-_129121234 | 4.68 |
ENSMUST00000030572.3
|
Hpca
|
hippocalcin |
| chr3_+_22076644 | 4.66 |
ENSMUST00000063988.8
|
Tbl1xr1
|
transducin (beta)-like 1X-linked receptor 1 |
| chr17_-_74294834 | 4.66 |
ENSMUST00000078459.6
|
Memo1
|
mediator of cell motility 1 |
| chr11_+_117849223 | 4.64 |
ENSMUST00000081387.4
|
Birc5
|
baculoviral IAP repeat-containing 5 |
| chr5_-_149051604 | 4.62 |
ENSMUST00000093196.4
|
Hmgb1
|
high mobility group box 1 |
| chr12_+_111166485 | 4.60 |
ENSMUST00000139162.1
|
Traf3
|
TNF receptor-associated factor 3 |
| chr5_-_138171813 | 4.60 |
ENSMUST00000155902.1
ENSMUST00000148879.1 |
Mcm7
|
minichromosome maintenance deficient 7 (S. cerevisiae) |
| chr17_-_70851189 | 4.59 |
ENSMUST00000059775.8
|
Tgif1
|
TGFB-induced factor homeobox 1 |
| chr5_+_37242025 | 4.59 |
ENSMUST00000114158.2
|
Crmp1
|
collapsin response mediator protein 1 |
| chr8_+_122568001 | 4.58 |
ENSMUST00000006760.2
|
Cdt1
|
chromatin licensing and DNA replication factor 1 |
| chr9_-_22389113 | 4.58 |
ENSMUST00000040912.7
|
Anln
|
anillin, actin binding protein |
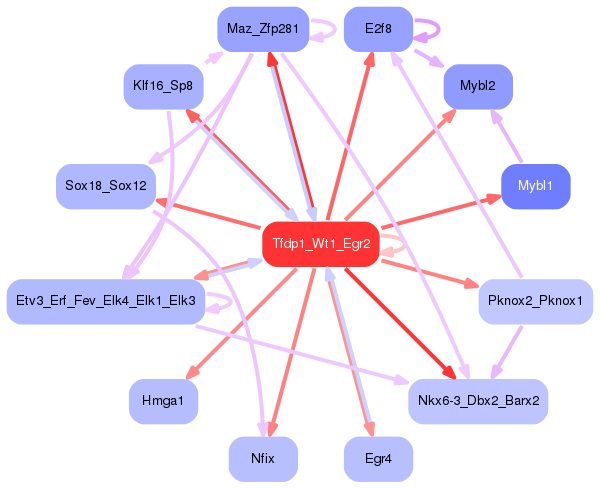
Network of associatons between targets according to the STRING database.

First level regulatory network of Tfdp1_Wt1_Egr2
Gene Ontology Analysis
Gene overrepresentation in biological process category:
| Log-likelihood per target | Total log-likelihood | Term | Description |
|---|---|---|---|
| 6.9 | 20.6 | GO:0032877 | positive regulation of DNA endoreduplication(GO:0032877) |
| 4.5 | 18.0 | GO:0006272 | leading strand elongation(GO:0006272) |
| 4.5 | 17.9 | GO:1904008 | response to monosodium glutamate(GO:1904008) cellular response to monosodium glutamate(GO:1904009) |
| 4.1 | 24.5 | GO:0031536 | positive regulation of exit from mitosis(GO:0031536) |
| 3.3 | 9.9 | GO:0048691 | positive regulation of sprouting of injured axon(GO:0048687) positive regulation of axon extension involved in regeneration(GO:0048691) |
| 3.3 | 9.8 | GO:0006226 | dUMP biosynthetic process(GO:0006226) |
| 3.2 | 9.7 | GO:1902162 | regulation of DNA damage response, signal transduction by p53 class mediator resulting in transcription of p21 class mediator(GO:1902162) |
| 3.1 | 9.2 | GO:0035519 | protein K29-linked ubiquitination(GO:0035519) |
| 3.0 | 11.9 | GO:0099527 | postsynapse to nucleus signaling pathway(GO:0099527) |
| 2.9 | 20.6 | GO:1990416 | cellular response to brain-derived neurotrophic factor stimulus(GO:1990416) |
| 2.9 | 14.5 | GO:0007089 | traversing start control point of mitotic cell cycle(GO:0007089) |
| 2.8 | 8.4 | GO:0060365 | fibroblast growth factor receptor signaling pathway involved in negative regulation of apoptotic process in bone marrow(GO:0035602) fibroblast growth factor receptor signaling pathway involved in hemopoiesis(GO:0035603) fibroblast growth factor receptor signaling pathway involved in positive regulation of cell proliferation in bone marrow(GO:0035604) coronal suture morphogenesis(GO:0060365) |
| 2.8 | 8.3 | GO:0072382 | minus-end-directed vesicle transport along microtubule(GO:0072382) |
| 2.6 | 7.9 | GO:0002270 | plasmacytoid dendritic cell activation(GO:0002270) positive regulation of glycogen catabolic process(GO:0045819) |
| 2.6 | 7.7 | GO:0033693 | neurofilament bundle assembly(GO:0033693) |
| 2.6 | 20.5 | GO:0010032 | meiotic chromosome condensation(GO:0010032) |
| 2.5 | 7.5 | GO:0061300 | cerebellum vasculature development(GO:0061300) |
| 2.5 | 7.5 | GO:0045204 | MAPK export from nucleus(GO:0045204) |
| 2.5 | 7.4 | GO:1990523 | bone regeneration(GO:1990523) |
| 2.4 | 7.2 | GO:0021849 | neuroblast division in subventricular zone(GO:0021849) |
| 2.4 | 11.9 | GO:0070934 | CRD-mediated mRNA stabilization(GO:0070934) |
| 2.4 | 7.1 | GO:0000912 | assembly of actomyosin apparatus involved in cytokinesis(GO:0000912) actomyosin contractile ring assembly(GO:0000915) actomyosin contractile ring organization(GO:0044837) |
| 2.3 | 23.5 | GO:0006268 | DNA unwinding involved in DNA replication(GO:0006268) |
| 2.3 | 6.9 | GO:1904274 | tricellular tight junction assembly(GO:1904274) |
| 2.2 | 13.3 | GO:0042276 | error-prone translesion synthesis(GO:0042276) |
| 2.2 | 4.4 | GO:1904170 | regulation of bleb assembly(GO:1904170) |
| 2.2 | 4.4 | GO:0009957 | epidermal cell fate specification(GO:0009957) |
| 2.2 | 19.8 | GO:1900264 | regulation of DNA-directed DNA polymerase activity(GO:1900262) positive regulation of DNA-directed DNA polymerase activity(GO:1900264) |
| 2.2 | 6.6 | GO:0010360 | negative regulation of anion channel activity(GO:0010360) |
| 2.2 | 6.5 | GO:1903438 | regulation of cytokinetic process(GO:0032954) regulation of mitotic cytokinetic process(GO:1903436) positive regulation of mitotic cytokinetic process(GO:1903438) positive regulation of mitotic cytokinesis(GO:1903490) |
| 2.1 | 8.5 | GO:0044268 | multicellular organismal protein metabolic process(GO:0044268) |
| 2.1 | 12.7 | GO:0045585 | regulation of cytotoxic T cell differentiation(GO:0045583) positive regulation of cytotoxic T cell differentiation(GO:0045585) |
| 2.1 | 6.2 | GO:0043396 | corticotropin-releasing hormone secretion(GO:0043396) regulation of corticotropin-releasing hormone secretion(GO:0043397) positive regulation of corticotropin-releasing hormone secretion(GO:0051466) |
| 2.0 | 6.1 | GO:0071707 | immunoglobulin heavy chain V-D-J recombination(GO:0071707) |
| 2.0 | 60.8 | GO:0006270 | DNA replication initiation(GO:0006270) |
| 2.0 | 18.0 | GO:0090267 | positive regulation of mitotic cell cycle spindle assembly checkpoint(GO:0090267) |
| 2.0 | 6.0 | GO:0034473 | U1 snRNA 3'-end processing(GO:0034473) U5 snRNA 3'-end processing(GO:0034476) |
| 2.0 | 7.9 | GO:1904800 | regulation of neuron remodeling(GO:1904799) negative regulation of neuron remodeling(GO:1904800) |
| 1.9 | 3.9 | GO:0000448 | cleavage in ITS2 between 5.8S rRNA and LSU-rRNA of tricistronic rRNA transcript (SSU-rRNA, 5.8S rRNA, LSU-rRNA)(GO:0000448) |
| 1.9 | 5.8 | GO:1904975 | response to bleomycin(GO:1904975) cellular response to bleomycin(GO:1904976) |
| 1.9 | 7.5 | GO:0051643 | endoplasmic reticulum localization(GO:0051643) |
| 1.9 | 7.4 | GO:1904616 | regulation of actin filament binding(GO:1904529) regulation of actin binding(GO:1904616) |
| 1.9 | 5.6 | GO:1901355 | response to rapamycin(GO:1901355) |
| 1.8 | 5.5 | GO:0040030 | regulation of molecular function, epigenetic(GO:0040030) |
| 1.8 | 5.5 | GO:0010705 | meiotic DNA double-strand break processing involved in reciprocal meiotic recombination(GO:0010705) |
| 1.8 | 1.8 | GO:0048320 | axial mesoderm formation(GO:0048320) |
| 1.8 | 12.7 | GO:0031508 | pericentric heterochromatin assembly(GO:0031508) |
| 1.8 | 12.5 | GO:0006369 | termination of RNA polymerase II transcription(GO:0006369) |
| 1.8 | 5.3 | GO:0033566 | gamma-tubulin complex localization(GO:0033566) |
| 1.8 | 16.0 | GO:0010826 | negative regulation of centrosome duplication(GO:0010826) negative regulation of centrosome cycle(GO:0046606) |
| 1.8 | 5.3 | GO:2001226 | negative regulation of chloride transport(GO:2001226) |
| 1.8 | 15.8 | GO:0010606 | positive regulation of cytoplasmic mRNA processing body assembly(GO:0010606) |
| 1.7 | 5.2 | GO:1990705 | cholangiocyte proliferation(GO:1990705) |
| 1.7 | 5.2 | GO:0071930 | negative regulation of transcription involved in G1/S transition of mitotic cell cycle(GO:0071930) |
| 1.7 | 5.2 | GO:0009826 | unidimensional cell growth(GO:0009826) |
| 1.7 | 5.2 | GO:0030200 | heparan sulfate proteoglycan catabolic process(GO:0030200) |
| 1.7 | 8.4 | GO:1903527 | positive regulation of membrane tubulation(GO:1903527) |
| 1.7 | 1.7 | GO:0032972 | regulation of muscle filament sliding speed(GO:0032972) |
| 1.7 | 6.7 | GO:0042822 | pyridoxal phosphate metabolic process(GO:0042822) |
| 1.7 | 6.7 | GO:0000415 | negative regulation of histone H3-K36 methylation(GO:0000415) |
| 1.7 | 1.7 | GO:0010825 | positive regulation of centrosome duplication(GO:0010825) |
| 1.6 | 13.1 | GO:0007144 | female meiosis I(GO:0007144) |
| 1.6 | 11.5 | GO:0001842 | neural fold formation(GO:0001842) |
| 1.6 | 4.9 | GO:0016131 | brassinosteroid metabolic process(GO:0016131) brassinosteroid biosynthetic process(GO:0016132) |
| 1.6 | 6.5 | GO:0000189 | MAPK import into nucleus(GO:0000189) |
| 1.6 | 12.4 | GO:0060120 | auditory receptor cell fate commitment(GO:0009912) inner ear receptor cell fate commitment(GO:0060120) |
| 1.6 | 7.8 | GO:0045578 | negative regulation of B cell differentiation(GO:0045578) |
| 1.6 | 4.7 | GO:0070650 | actin filament bundle distribution(GO:0070650) |
| 1.5 | 7.7 | GO:0007197 | adenylate cyclase-inhibiting G-protein coupled acetylcholine receptor signaling pathway(GO:0007197) phospholipase C-activating G-protein coupled acetylcholine receptor signaling pathway(GO:0007207) |
| 1.5 | 3.1 | GO:0051309 | female meiosis chromosome separation(GO:0051309) |
| 1.5 | 4.6 | GO:0043504 | mitochondrial DNA repair(GO:0043504) |
| 1.5 | 9.2 | GO:2000980 | regulation of auditory receptor cell differentiation(GO:0045607) regulation of mechanoreceptor differentiation(GO:0045631) regulation of inner ear receptor cell differentiation(GO:2000980) |
| 1.5 | 9.1 | GO:0006452 | translational frameshifting(GO:0006452) positive regulation of translational termination(GO:0045905) |
| 1.5 | 12.0 | GO:0000395 | mRNA 5'-splice site recognition(GO:0000395) |
| 1.5 | 1.5 | GO:1900110 | negative regulation of histone H3-K9 dimethylation(GO:1900110) |
| 1.5 | 5.9 | GO:0018317 | protein C-linked glycosylation(GO:0018103) peptidyl-tryptophan modification(GO:0018211) protein C-linked glycosylation via tryptophan(GO:0018317) protein C-linked glycosylation via 2'-alpha-mannosyl-L-tryptophan(GO:0018406) |
| 1.5 | 5.8 | GO:2000384 | regulation of ectoderm development(GO:2000383) negative regulation of ectoderm development(GO:2000384) |
| 1.4 | 8.6 | GO:0006543 | glutamine catabolic process(GO:0006543) |
| 1.4 | 12.8 | GO:0006362 | transcription elongation from RNA polymerase I promoter(GO:0006362) |
| 1.4 | 11.3 | GO:0000055 | ribosomal large subunit export from nucleus(GO:0000055) |
| 1.4 | 8.5 | GO:2000672 | negative regulation of motor neuron apoptotic process(GO:2000672) |
| 1.4 | 9.8 | GO:0033567 | DNA replication, Okazaki fragment processing(GO:0033567) |
| 1.4 | 4.2 | GO:1901491 | negative regulation of lymphangiogenesis(GO:1901491) |
| 1.4 | 4.1 | GO:0045041 | protein import into mitochondrial intermembrane space(GO:0045041) |
| 1.4 | 4.1 | GO:0060821 | inactivation of X chromosome by DNA methylation(GO:0060821) |
| 1.4 | 4.1 | GO:0099578 | regulation of translation at synapse, modulating synaptic transmission(GO:0099547) regulation of translation at postsynapse, modulating synaptic transmission(GO:0099578) positive regulation of intracellular transport of viral material(GO:1901254) |
| 1.4 | 6.8 | GO:0051661 | maintenance of centrosome location(GO:0051661) |
| 1.3 | 4.0 | GO:0070843 | misfolded protein transport(GO:0070843) polyubiquitinated protein transport(GO:0070844) polyubiquitinated misfolded protein transport(GO:0070845) Hsp90 deacetylation(GO:0070846) |
| 1.3 | 4.0 | GO:0090235 | regulation of metaphase plate congression(GO:0090235) |
| 1.3 | 11.9 | GO:0000492 | box C/D snoRNP assembly(GO:0000492) |
| 1.3 | 3.9 | GO:0071947 | protein deubiquitination involved in ubiquitin-dependent protein catabolic process(GO:0071947) |
| 1.3 | 11.8 | GO:0048386 | positive regulation of retinoic acid receptor signaling pathway(GO:0048386) |
| 1.3 | 9.2 | GO:0015862 | uridine transport(GO:0015862) |
| 1.3 | 6.4 | GO:0030951 | establishment or maintenance of microtubule cytoskeleton polarity(GO:0030951) |
| 1.3 | 6.4 | GO:0001922 | B-1 B cell homeostasis(GO:0001922) |
| 1.3 | 7.6 | GO:0045875 | negative regulation of sister chromatid cohesion(GO:0045875) |
| 1.3 | 1.3 | GO:0046832 | negative regulation of nucleobase-containing compound transport(GO:0032240) negative regulation of RNA export from nucleus(GO:0046832) |
| 1.3 | 5.1 | GO:0097360 | chorionic trophoblast cell proliferation(GO:0097360) regulation of chorionic trophoblast cell proliferation(GO:1901382) |
| 1.3 | 12.5 | GO:0042637 | catagen(GO:0042637) |
| 1.2 | 7.5 | GO:0044806 | G-quadruplex DNA unwinding(GO:0044806) |
| 1.2 | 4.9 | GO:0072137 | condensed mesenchymal cell proliferation(GO:0072137) |
| 1.2 | 3.7 | GO:2001160 | regulation of histone H3-K79 methylation(GO:2001160) |
| 1.2 | 7.3 | GO:0098838 | reduced folate transmembrane transport(GO:0098838) |
| 1.2 | 19.4 | GO:0051988 | regulation of attachment of spindle microtubules to kinetochore(GO:0051988) |
| 1.2 | 7.2 | GO:0034080 | CENP-A containing nucleosome assembly(GO:0034080) CENP-A containing chromatin organization(GO:0061641) |
| 1.2 | 1.2 | GO:0097049 | motor neuron apoptotic process(GO:0097049) |
| 1.2 | 3.6 | GO:0051754 | meiotic sister chromatid cohesion, centromeric(GO:0051754) |
| 1.2 | 8.3 | GO:0098535 | de novo centriole assembly(GO:0098535) |
| 1.2 | 1.2 | GO:0072368 | regulation of lipid transport by negative regulation of transcription from RNA polymerase II promoter(GO:0072368) |
| 1.2 | 8.2 | GO:0070314 | G1 to G0 transition(GO:0070314) |
| 1.2 | 2.3 | GO:0010046 | response to mycotoxin(GO:0010046) |
| 1.2 | 4.6 | GO:0043973 | histone H3-K4 acetylation(GO:0043973) |
| 1.1 | 3.4 | GO:0010615 | positive regulation of cardiac muscle adaptation(GO:0010615) positive regulation of cardiac muscle hypertrophy in response to stress(GO:1903244) |
| 1.1 | 6.8 | GO:0019985 | translesion synthesis(GO:0019985) |
| 1.1 | 1.1 | GO:0043634 | polyadenylation-dependent ncRNA catabolic process(GO:0043634) |
| 1.1 | 3.4 | GO:1904049 | negative regulation of spontaneous neurotransmitter secretion(GO:1904049) |
| 1.1 | 4.5 | GO:0002143 | tRNA wobble position uridine thiolation(GO:0002143) |
| 1.1 | 5.6 | GO:0015888 | thiamine transport(GO:0015888) |
| 1.1 | 8.9 | GO:0006390 | transcription from mitochondrial promoter(GO:0006390) |
| 1.1 | 6.7 | GO:0036123 | histone H3-K9 dimethylation(GO:0036123) |
| 1.1 | 1.1 | GO:0055015 | ventricular cardiac muscle cell development(GO:0055015) |
| 1.1 | 4.4 | GO:0072221 | distal convoluted tubule development(GO:0072025) metanephric distal convoluted tubule development(GO:0072221) metanephric distal tubule development(GO:0072235) |
| 1.1 | 1.1 | GO:0046166 | glyceraldehyde-3-phosphate biosynthetic process(GO:0046166) |
| 1.1 | 3.3 | GO:0019389 | glucuronoside metabolic process(GO:0019389) |
| 1.1 | 1.1 | GO:0045077 | negative regulation of interferon-gamma biosynthetic process(GO:0045077) |
| 1.1 | 27.1 | GO:0006978 | DNA damage response, signal transduction by p53 class mediator resulting in transcription of p21 class mediator(GO:0006978) |
| 1.1 | 1.1 | GO:0034729 | histone H3-K79 methylation(GO:0034729) |
| 1.1 | 8.6 | GO:0046826 | negative regulation of protein export from nucleus(GO:0046826) |
| 1.1 | 2.2 | GO:0000973 | posttranscriptional tethering of RNA polymerase II gene DNA at nuclear periphery(GO:0000973) |
| 1.1 | 7.5 | GO:0060613 | fat pad development(GO:0060613) |
| 1.1 | 4.3 | GO:0003360 | brainstem development(GO:0003360) |
| 1.1 | 8.5 | GO:2000232 | regulation of rRNA processing(GO:2000232) |
| 1.1 | 3.2 | GO:0000212 | meiotic spindle organization(GO:0000212) |
| 1.1 | 4.2 | GO:0070086 | ubiquitin-dependent endocytosis(GO:0070086) |
| 1.1 | 10.5 | GO:0035520 | monoubiquitinated protein deubiquitination(GO:0035520) |
| 1.0 | 17.7 | GO:0031571 | mitotic G1 DNA damage checkpoint(GO:0031571) |
| 1.0 | 10.4 | GO:1902036 | regulation of hematopoietic stem cell differentiation(GO:1902036) |
| 1.0 | 6.3 | GO:1903519 | apoptotic process involved in mammary gland involution(GO:0060057) positive regulation of apoptotic process involved in mammary gland involution(GO:0060058) positive regulation of apoptotic process involved in morphogenesis(GO:1902339) regulation of mammary gland involution(GO:1903519) positive regulation of mammary gland involution(GO:1903521) positive regulation of apoptotic process involved in development(GO:1904747) |
| 1.0 | 5.2 | GO:0032902 | nerve growth factor production(GO:0032902) |
| 1.0 | 2.1 | GO:0019230 | proprioception(GO:0019230) |
| 1.0 | 3.1 | GO:1902498 | regulation of protein autoubiquitination(GO:1902498) |
| 1.0 | 1.0 | GO:1904849 | positive regulation of cell chemotaxis to fibroblast growth factor(GO:1904849) positive regulation of endothelial cell chemotaxis to fibroblast growth factor(GO:2000546) |
| 1.0 | 1.0 | GO:0030214 | hyaluronan catabolic process(GO:0030214) |
| 1.0 | 3.1 | GO:0001180 | transcription initiation from RNA polymerase I promoter for nuclear large rRNA transcript(GO:0001180) |
| 1.0 | 3.0 | GO:0043096 | purine nucleobase salvage(GO:0043096) |
| 1.0 | 4.0 | GO:0010510 | regulation of acetyl-CoA biosynthetic process from pyruvate(GO:0010510) |
| 1.0 | 5.0 | GO:0030421 | defecation(GO:0030421) |
| 1.0 | 7.0 | GO:0051725 | protein de-ADP-ribosylation(GO:0051725) |
| 1.0 | 3.0 | GO:0060912 | cardiac cell fate specification(GO:0060912) |
| 1.0 | 7.9 | GO:0032020 | ISG15-protein conjugation(GO:0032020) |
| 1.0 | 4.9 | GO:0030920 | N-terminal peptidyl-serine acetylation(GO:0017198) N-terminal peptidyl-glutamic acid acetylation(GO:0018002) peptidyl-serine acetylation(GO:0030920) |
| 1.0 | 7.8 | GO:0061484 | hematopoietic stem cell homeostasis(GO:0061484) |
| 1.0 | 32.1 | GO:0006284 | base-excision repair(GO:0006284) |
| 1.0 | 2.9 | GO:1900045 | negative regulation of protein K63-linked ubiquitination(GO:1900045) negative regulation of protein polyubiquitination(GO:1902915) |
| 1.0 | 3.9 | GO:0034421 | post-translational protein acetylation(GO:0034421) |
| 1.0 | 2.9 | GO:0000720 | pyrimidine dimer repair by nucleotide-excision repair(GO:0000720) |
| 1.0 | 34.6 | GO:0045746 | negative regulation of Notch signaling pathway(GO:0045746) |
| 1.0 | 2.9 | GO:0015881 | creatine transport(GO:0015881) |
| 1.0 | 2.9 | GO:1904464 | regulation of matrix metallopeptidase secretion(GO:1904464) matrix metallopeptidase secretion(GO:1990773) |
| 1.0 | 1.9 | GO:1903537 | meiotic cell cycle process involved in oocyte maturation(GO:1903537) regulation of meiotic cell cycle process involved in oocyte maturation(GO:1903538) |
| 1.0 | 6.7 | GO:2001032 | regulation of double-strand break repair via nonhomologous end joining(GO:2001032) |
| 0.9 | 9.5 | GO:0033504 | floor plate development(GO:0033504) |
| 0.9 | 2.8 | GO:0097401 | synaptic vesicle lumen acidification(GO:0097401) |
| 0.9 | 1.9 | GO:0060454 | positive regulation of gastric acid secretion(GO:0060454) |
| 0.9 | 3.7 | GO:0070829 | heterochromatin maintenance(GO:0070829) |
| 0.9 | 5.6 | GO:0046654 | tetrahydrofolate biosynthetic process(GO:0046654) |
| 0.9 | 2.8 | GO:0033313 | meiotic cell cycle checkpoint(GO:0033313) |
| 0.9 | 3.7 | GO:0009446 | putrescine biosynthetic process(GO:0009446) |
| 0.9 | 10.2 | GO:0010216 | maintenance of DNA methylation(GO:0010216) |
| 0.9 | 5.6 | GO:0045654 | positive regulation of megakaryocyte differentiation(GO:0045654) |
| 0.9 | 5.6 | GO:0006344 | maintenance of chromatin silencing(GO:0006344) |
| 0.9 | 0.9 | GO:0002188 | translation reinitiation(GO:0002188) |
| 0.9 | 4.6 | GO:0033140 | negative regulation of peptidyl-serine phosphorylation of STAT protein(GO:0033140) |
| 0.9 | 2.8 | GO:0098869 | cellular oxidant detoxification(GO:0098869) |
| 0.9 | 5.5 | GO:2000767 | positive regulation of cytoplasmic translation(GO:2000767) |
| 0.9 | 2.7 | GO:0070634 | transepithelial ammonium transport(GO:0070634) |
| 0.9 | 3.6 | GO:0090521 | glomerular visceral epithelial cell migration(GO:0090521) |
| 0.9 | 2.7 | GO:0048743 | positive regulation of skeletal muscle fiber development(GO:0048743) |
| 0.9 | 3.6 | GO:0000019 | regulation of mitotic recombination(GO:0000019) |
| 0.9 | 2.7 | GO:0060010 | Sertoli cell fate commitment(GO:0060010) |
| 0.9 | 4.5 | GO:0071475 | cellular hyperosmotic salinity response(GO:0071475) |
| 0.9 | 3.6 | GO:0019919 | peptidyl-arginine methylation, to asymmetrical-dimethyl arginine(GO:0019919) |
| 0.9 | 2.7 | GO:2000118 | regulation of sodium-dependent phosphate transport(GO:2000118) |
| 0.9 | 0.9 | GO:1901608 | regulation of vesicle transport along microtubule(GO:1901608) |
| 0.9 | 3.5 | GO:0072697 | protein localization to cell cortex(GO:0072697) |
| 0.9 | 4.4 | GO:0021637 | trigeminal nerve morphogenesis(GO:0021636) trigeminal nerve structural organization(GO:0021637) semaphorin-plexin signaling pathway involved in axon guidance(GO:1902287) |
| 0.9 | 0.9 | GO:0030422 | production of siRNA involved in RNA interference(GO:0030422) |
| 0.9 | 5.3 | GO:0060178 | regulation of exocyst localization(GO:0060178) |
| 0.9 | 5.2 | GO:0031120 | snRNA pseudouridine synthesis(GO:0031120) |
| 0.9 | 7.9 | GO:0033314 | mitotic DNA replication checkpoint(GO:0033314) |
| 0.9 | 3.5 | GO:0060025 | regulation of synaptic activity(GO:0060025) |
| 0.9 | 8.7 | GO:0000920 | cell separation after cytokinesis(GO:0000920) |
| 0.9 | 3.5 | GO:0016340 | calcium-dependent cell-matrix adhesion(GO:0016340) |
| 0.9 | 0.9 | GO:0033128 | negative regulation of histone phosphorylation(GO:0033128) |
| 0.9 | 2.6 | GO:1902951 | negative regulation of dendritic spine maintenance(GO:1902951) |
| 0.9 | 2.6 | GO:0018008 | N-terminal peptidyl-glycine N-myristoylation(GO:0018008) |
| 0.9 | 37.8 | GO:0021680 | cerebellar Purkinje cell layer development(GO:0021680) |
| 0.9 | 0.9 | GO:0015772 | disaccharide transport(GO:0015766) sucrose transport(GO:0015770) oligosaccharide transport(GO:0015772) |
| 0.9 | 2.6 | GO:1900673 | olefin metabolic process(GO:1900673) |
| 0.8 | 4.2 | GO:0051964 | negative regulation of synapse assembly(GO:0051964) |
| 0.8 | 5.1 | GO:0032796 | uropod organization(GO:0032796) |
| 0.8 | 3.4 | GO:1904694 | negative regulation of vascular smooth muscle contraction(GO:1904694) |
| 0.8 | 7.5 | GO:0038203 | TORC2 signaling(GO:0038203) |
| 0.8 | 2.5 | GO:1903070 | negative regulation of ER-associated ubiquitin-dependent protein catabolic process(GO:1903070) |
| 0.8 | 3.3 | GO:0001978 | regulation of systemic arterial blood pressure by carotid sinus baroreceptor feedback(GO:0001978) |
| 0.8 | 1.7 | GO:0016321 | female meiosis chromosome segregation(GO:0016321) |
| 0.8 | 3.3 | GO:0090266 | regulation of mitotic cell cycle spindle assembly checkpoint(GO:0090266) regulation of mitotic spindle checkpoint(GO:1903504) |
| 0.8 | 2.5 | GO:0009298 | GDP-mannose biosynthetic process(GO:0009298) |
| 0.8 | 0.8 | GO:0046078 | dUMP metabolic process(GO:0046078) |
| 0.8 | 3.3 | GO:0035331 | negative regulation of hippo signaling(GO:0035331) |
| 0.8 | 2.4 | GO:0051977 | lysophospholipid transport(GO:0051977) |
| 0.8 | 1.6 | GO:0046881 | positive regulation of follicle-stimulating hormone secretion(GO:0046881) |
| 0.8 | 4.0 | GO:0045876 | positive regulation of sister chromatid cohesion(GO:0045876) |
| 0.8 | 1.6 | GO:0071603 | endothelial cell-cell adhesion(GO:0071603) |
| 0.8 | 4.7 | GO:0034214 | protein hexamerization(GO:0034214) |
| 0.8 | 18.1 | GO:0040034 | regulation of development, heterochronic(GO:0040034) |
| 0.8 | 2.4 | GO:0040010 | positive regulation of growth rate(GO:0040010) |
| 0.8 | 0.8 | GO:0039519 | modulation by virus of host autophagy(GO:0039519) |
| 0.8 | 3.1 | GO:0006348 | chromatin silencing at telomere(GO:0006348) |
| 0.8 | 3.1 | GO:0031860 | telomeric 3' overhang formation(GO:0031860) |
| 0.8 | 3.1 | GO:0060709 | glycogen cell differentiation involved in embryonic placenta development(GO:0060709) |
| 0.8 | 2.3 | GO:0072194 | kidney smooth muscle tissue development(GO:0072194) |
| 0.8 | 8.4 | GO:0019368 | fatty acid elongation, saturated fatty acid(GO:0019367) fatty acid elongation, unsaturated fatty acid(GO:0019368) fatty acid elongation, monounsaturated fatty acid(GO:0034625) fatty acid elongation, polyunsaturated fatty acid(GO:0034626) |
| 0.8 | 13.7 | GO:0060081 | membrane hyperpolarization(GO:0060081) |
| 0.8 | 2.3 | GO:0009173 | UMP biosynthetic process(GO:0006222) pyrimidine ribonucleoside monophosphate metabolic process(GO:0009173) pyrimidine ribonucleoside monophosphate biosynthetic process(GO:0009174) UMP metabolic process(GO:0046049) |
| 0.8 | 8.3 | GO:0006610 | ribosomal protein import into nucleus(GO:0006610) |
| 0.8 | 3.8 | GO:0031022 | nuclear migration along microfilament(GO:0031022) |
| 0.8 | 1.5 | GO:0035026 | leading edge cell differentiation(GO:0035026) |
| 0.7 | 15.7 | GO:2000052 | positive regulation of non-canonical Wnt signaling pathway(GO:2000052) |
| 0.7 | 7.5 | GO:0006398 | mRNA 3'-end processing by stem-loop binding and cleavage(GO:0006398) |
| 0.7 | 4.5 | GO:0015015 | heparan sulfate proteoglycan biosynthetic process, enzymatic modification(GO:0015015) |
| 0.7 | 3.0 | GO:0036518 | chemorepulsion of dopaminergic neuron axon(GO:0036518) |
| 0.7 | 3.7 | GO:2000623 | regulation of nuclear-transcribed mRNA catabolic process, nonsense-mediated decay(GO:2000622) negative regulation of nuclear-transcribed mRNA catabolic process, nonsense-mediated decay(GO:2000623) |
| 0.7 | 1.5 | GO:0008295 | spermidine biosynthetic process(GO:0008295) |
| 0.7 | 11.8 | GO:0043248 | proteasome assembly(GO:0043248) |
| 0.7 | 4.4 | GO:0010668 | ectodermal cell differentiation(GO:0010668) |
| 0.7 | 8.1 | GO:0008063 | Toll signaling pathway(GO:0008063) |
| 0.7 | 0.7 | GO:0016078 | tRNA catabolic process(GO:0016078) |
| 0.7 | 2.2 | GO:0035616 | histone H2B conserved C-terminal lysine deubiquitination(GO:0035616) |
| 0.7 | 2.2 | GO:0051030 | snRNA transport(GO:0051030) |
| 0.7 | 5.8 | GO:0033262 | regulation of nuclear cell cycle DNA replication(GO:0033262) |
| 0.7 | 2.9 | GO:0003349 | epicardium-derived cardiac endothelial cell differentiation(GO:0003349) |
| 0.7 | 2.9 | GO:0010286 | heat acclimation(GO:0010286) |
| 0.7 | 2.9 | GO:2001245 | regulation of phosphatidylcholine biosynthetic process(GO:2001245) |
| 0.7 | 5.7 | GO:0070327 | thyroid hormone transport(GO:0070327) |
| 0.7 | 2.1 | GO:0019405 | alditol catabolic process(GO:0019405) |
| 0.7 | 2.1 | GO:1902569 | regulation of activation of JAK2 kinase activity(GO:0010534) activation of JAK2 kinase activity(GO:0042977) negative regulation of activation of JAK2 kinase activity(GO:1902569) |
| 0.7 | 5.7 | GO:0051409 | response to nitrosative stress(GO:0051409) |
| 0.7 | 3.6 | GO:0006596 | polyamine biosynthetic process(GO:0006596) |
| 0.7 | 3.5 | GO:0006177 | GMP biosynthetic process(GO:0006177) |
| 0.7 | 0.7 | GO:0061193 | taste bud development(GO:0061193) |
| 0.7 | 2.1 | GO:0060160 | negative regulation of dopamine receptor signaling pathway(GO:0060160) |
| 0.7 | 2.8 | GO:0018027 | peptidyl-lysine dimethylation(GO:0018027) |
| 0.7 | 5.6 | GO:0090286 | cytoskeletal anchoring at nuclear membrane(GO:0090286) |
| 0.7 | 2.8 | GO:0051684 | maintenance of Golgi location(GO:0051684) |
| 0.7 | 2.1 | GO:0006532 | aspartate biosynthetic process(GO:0006532) aspartate catabolic process(GO:0006533) |
| 0.7 | 2.1 | GO:0098974 | postsynaptic actin cytoskeleton organization(GO:0098974) |
| 0.7 | 2.1 | GO:0032916 | positive regulation of transforming growth factor beta3 production(GO:0032916) |
| 0.7 | 2.1 | GO:1990034 | calcium ion export from cell(GO:1990034) |
| 0.7 | 2.8 | GO:0071043 | CUT catabolic process(GO:0071034) CUT metabolic process(GO:0071043) |
| 0.7 | 4.2 | GO:1990035 | calcium ion import across plasma membrane(GO:0098703) calcium ion import into cell(GO:1990035) |
| 0.7 | 1.4 | GO:1904742 | regulation of telomeric DNA binding(GO:1904742) |
| 0.7 | 1.4 | GO:0032911 | negative regulation of transforming growth factor beta1 production(GO:0032911) |
| 0.7 | 4.1 | GO:0035360 | positive regulation of peroxisome proliferator activated receptor signaling pathway(GO:0035360) |
| 0.7 | 5.5 | GO:0060136 | embryonic process involved in female pregnancy(GO:0060136) |
| 0.7 | 3.4 | GO:0019042 | viral latency(GO:0019042) |
| 0.7 | 2.1 | GO:0042706 | eye photoreceptor cell fate commitment(GO:0042706) photoreceptor cell fate commitment(GO:0046552) camera-type eye photoreceptor cell fate commitment(GO:0060220) |
| 0.7 | 11.0 | GO:0070262 | peptidyl-serine dephosphorylation(GO:0070262) |
| 0.7 | 4.1 | GO:0090073 | positive regulation of protein homodimerization activity(GO:0090073) |
| 0.7 | 6.8 | GO:0035879 | lactate transport(GO:0015727) lactate transmembrane transport(GO:0035873) plasma membrane lactate transport(GO:0035879) |
| 0.7 | 4.8 | GO:0007135 | meiosis II(GO:0007135) |
| 0.7 | 8.2 | GO:0098789 | pre-mRNA cleavage required for polyadenylation(GO:0098789) |
| 0.7 | 2.7 | GO:0032792 | negative regulation of CREB transcription factor activity(GO:0032792) |
| 0.7 | 1.4 | GO:0046599 | regulation of centriole replication(GO:0046599) |
| 0.7 | 2.0 | GO:0046061 | dATP catabolic process(GO:0046061) |
| 0.7 | 4.0 | GO:0043928 | exonucleolytic nuclear-transcribed mRNA catabolic process involved in deadenylation-dependent decay(GO:0043928) |
| 0.7 | 0.7 | GO:0035992 | tendon cell differentiation(GO:0035990) tendon formation(GO:0035992) |
| 0.7 | 7.4 | GO:0045719 | negative regulation of glycogen biosynthetic process(GO:0045719) |
| 0.7 | 0.7 | GO:2000793 | cell proliferation involved in heart valve development(GO:2000793) |
| 0.7 | 5.4 | GO:0018026 | peptidyl-lysine monomethylation(GO:0018026) |
| 0.7 | 1.3 | GO:0000056 | ribosomal small subunit export from nucleus(GO:0000056) |
| 0.7 | 2.7 | GO:1901300 | positive regulation of hydrogen peroxide-mediated programmed cell death(GO:1901300) |
| 0.7 | 2.7 | GO:0035606 | peptidyl-cysteine S-trans-nitrosylation(GO:0035606) |
| 0.7 | 4.0 | GO:0008635 | activation of cysteine-type endopeptidase activity involved in apoptotic process by cytochrome c(GO:0008635) |
| 0.7 | 4.0 | GO:0045218 | zonula adherens maintenance(GO:0045218) |
| 0.7 | 1.3 | GO:0048254 | snoRNA localization(GO:0048254) |
| 0.7 | 5.9 | GO:0051045 | negative regulation of membrane protein ectodomain proteolysis(GO:0051045) |
| 0.7 | 2.0 | GO:0000722 | telomere maintenance via recombination(GO:0000722) |
| 0.7 | 5.3 | GO:0016560 | protein import into peroxisome matrix, docking(GO:0016560) |
| 0.7 | 1.3 | GO:0090309 | positive regulation of methylation-dependent chromatin silencing(GO:0090309) |
| 0.7 | 2.6 | GO:0046125 | pyrimidine deoxyribonucleoside metabolic process(GO:0046125) |
| 0.7 | 2.0 | GO:1900740 | regulation of protein insertion into mitochondrial membrane involved in apoptotic signaling pathway(GO:1900739) positive regulation of protein insertion into mitochondrial membrane involved in apoptotic signaling pathway(GO:1900740) |
| 0.7 | 4.6 | GO:0007296 | vitellogenesis(GO:0007296) |
| 0.7 | 1.3 | GO:0000454 | snoRNA guided rRNA pseudouridine synthesis(GO:0000454) |
| 0.6 | 1.3 | GO:0042264 | peptidyl-aspartic acid hydroxylation(GO:0042264) |
| 0.6 | 1.9 | GO:0072733 | response to staurosporine(GO:0072733) cellular response to staurosporine(GO:0072734) |
| 0.6 | 2.6 | GO:0031125 | rRNA 3'-end processing(GO:0031125) |
| 0.6 | 1.3 | GO:1904057 | negative regulation of sensory perception of pain(GO:1904057) |
| 0.6 | 2.6 | GO:0072061 | inner medullary collecting duct development(GO:0072061) |
| 0.6 | 1.3 | GO:0031335 | regulation of sulfur amino acid metabolic process(GO:0031335) |
| 0.6 | 1.9 | GO:0090297 | positive regulation of mitochondrial DNA replication(GO:0090297) regulation of cardiolipin metabolic process(GO:1900208) positive regulation of cardiolipin metabolic process(GO:1900210) stress-induced mitochondrial fusion(GO:1990046) |
| 0.6 | 2.6 | GO:0006438 | valyl-tRNA aminoacylation(GO:0006438) |
| 0.6 | 12.7 | GO:0000028 | ribosomal small subunit assembly(GO:0000028) |
| 0.6 | 1.9 | GO:0006435 | threonyl-tRNA aminoacylation(GO:0006435) |
| 0.6 | 1.9 | GO:1905223 | epicardium morphogenesis(GO:1905223) |
| 0.6 | 1.9 | GO:1902219 | negative regulation of intrinsic apoptotic signaling pathway in response to osmotic stress(GO:1902219) |
| 0.6 | 1.9 | GO:0007084 | mitotic nuclear envelope reassembly(GO:0007084) |
| 0.6 | 1.3 | GO:0071169 | establishment of protein localization to chromatin(GO:0071169) |
| 0.6 | 24.3 | GO:1902808 | positive regulation of cell cycle G1/S phase transition(GO:1902808) |
| 0.6 | 1.9 | GO:0045360 | regulation of interleukin-1 biosynthetic process(GO:0045360) positive regulation of interleukin-1 biosynthetic process(GO:0045362) |
| 0.6 | 0.6 | GO:0031990 | mRNA export from nucleus in response to heat stress(GO:0031990) |
| 0.6 | 2.4 | GO:0071596 | ubiquitin-dependent protein catabolic process via the N-end rule pathway(GO:0071596) |
| 0.6 | 8.5 | GO:1904814 | regulation of protein localization to chromosome, telomeric region(GO:1904814) |
| 0.6 | 7.3 | GO:0007064 | mitotic sister chromatid cohesion(GO:0007064) |
| 0.6 | 2.4 | GO:0034724 | DNA replication-independent nucleosome organization(GO:0034724) |
| 0.6 | 1.8 | GO:0045636 | positive regulation of melanocyte differentiation(GO:0045636) positive regulation of neuroepithelial cell differentiation(GO:1902913) |
| 0.6 | 1.8 | GO:0060648 | mammary gland bud morphogenesis(GO:0060648) |
| 0.6 | 0.6 | GO:0097107 | postsynaptic density organization(GO:0097106) postsynaptic density assembly(GO:0097107) |
| 0.6 | 3.6 | GO:0007258 | JUN phosphorylation(GO:0007258) |
| 0.6 | 4.2 | GO:0035735 | intraciliary transport involved in cilium morphogenesis(GO:0035735) |
| 0.6 | 1.8 | GO:1905000 | regulation of membrane repolarization during atrial cardiac muscle cell action potential(GO:1905000) |
| 0.6 | 1.1 | GO:1902174 | positive regulation of keratinocyte apoptotic process(GO:1902174) |
| 0.6 | 2.9 | GO:0006741 | NADP biosynthetic process(GO:0006741) |
| 0.6 | 8.0 | GO:0032467 | positive regulation of cytokinesis(GO:0032467) |
| 0.6 | 9.1 | GO:0007252 | I-kappaB phosphorylation(GO:0007252) |
| 0.6 | 3.4 | GO:0043983 | histone H4-K12 acetylation(GO:0043983) |
| 0.6 | 2.9 | GO:0000731 | DNA synthesis involved in DNA repair(GO:0000731) |
| 0.6 | 1.7 | GO:0042776 | mitochondrial ATP synthesis coupled proton transport(GO:0042776) |
| 0.6 | 2.8 | GO:0031848 | protection from non-homologous end joining at telomere(GO:0031848) |
| 0.6 | 13.7 | GO:0051764 | actin crosslink formation(GO:0051764) |
| 0.6 | 1.7 | GO:0035507 | regulation of myosin-light-chain-phosphatase activity(GO:0035507) |
| 0.6 | 0.6 | GO:0006999 | nuclear pore organization(GO:0006999) |
| 0.6 | 3.4 | GO:0035087 | siRNA loading onto RISC involved in RNA interference(GO:0035087) |
| 0.6 | 5.7 | GO:0006020 | inositol metabolic process(GO:0006020) |
| 0.6 | 3.4 | GO:0009082 | branched-chain amino acid biosynthetic process(GO:0009082) leucine biosynthetic process(GO:0009098) valine biosynthetic process(GO:0009099) |
| 0.6 | 2.2 | GO:0090271 | positive regulation of fibroblast growth factor production(GO:0090271) |
| 0.6 | 0.6 | GO:0002191 | cap-dependent translational initiation(GO:0002191) |
| 0.6 | 5.6 | GO:0071372 | cellular response to follicle-stimulating hormone stimulus(GO:0071372) |
| 0.6 | 1.7 | GO:0000965 | mitochondrial RNA 3'-end processing(GO:0000965) |
| 0.5 | 4.4 | GO:0048742 | regulation of skeletal muscle fiber development(GO:0048742) |
| 0.5 | 4.4 | GO:1900029 | positive regulation of ruffle assembly(GO:1900029) |
| 0.5 | 2.2 | GO:1904528 | regulation of microtubule plus-end binding(GO:1903031) positive regulation of microtubule plus-end binding(GO:1903033) positive regulation of microtubule binding(GO:1904528) |
| 0.5 | 6.5 | GO:0006388 | tRNA splicing, via endonucleolytic cleavage and ligation(GO:0006388) |
| 0.5 | 1.1 | GO:0060623 | regulation of chromosome condensation(GO:0060623) |
| 0.5 | 7.1 | GO:0031581 | hemidesmosome assembly(GO:0031581) |
| 0.5 | 1.1 | GO:0014707 | branchiomeric skeletal muscle development(GO:0014707) |
| 0.5 | 4.9 | GO:0007080 | mitotic metaphase plate congression(GO:0007080) |
| 0.5 | 1.6 | GO:0097534 | lymphoid lineage cell migration(GO:0097534) lymphoid lineage cell migration into thymus(GO:0097535) |
| 0.5 | 1.6 | GO:0006269 | DNA replication, synthesis of RNA primer(GO:0006269) |
| 0.5 | 2.7 | GO:1903347 | negative regulation of bicellular tight junction assembly(GO:1903347) |
| 0.5 | 2.7 | GO:0071105 | response to interleukin-11(GO:0071105) |
| 0.5 | 0.5 | GO:0035562 | negative regulation of chromatin binding(GO:0035562) |
| 0.5 | 2.1 | GO:0060857 | establishment of glial blood-brain barrier(GO:0060857) |
| 0.5 | 2.1 | GO:0051310 | metaphase plate congression(GO:0051310) |
| 0.5 | 5.8 | GO:0018231 | peptidyl-L-cysteine S-palmitoylation(GO:0018230) peptidyl-S-diacylglycerol-L-cysteine biosynthetic process from peptidyl-cysteine(GO:0018231) |
| 0.5 | 1.0 | GO:0072343 | pancreatic stellate cell proliferation(GO:0072343) regulation of pancreatic stellate cell proliferation(GO:2000229) |
| 0.5 | 0.5 | GO:0021965 | spinal cord ventral commissure morphogenesis(GO:0021965) |
| 0.5 | 0.5 | GO:0061738 | late endosomal microautophagy(GO:0061738) |
| 0.5 | 3.1 | GO:1903182 | regulation of SUMO transferase activity(GO:1903182) positive regulation of SUMO transferase activity(GO:1903755) |
| 0.5 | 0.5 | GO:0060526 | prostate glandular acinus morphogenesis(GO:0060526) prostate epithelial cord arborization involved in prostate glandular acinus morphogenesis(GO:0060527) |
| 0.5 | 1.6 | GO:1902226 | regulation of macrophage colony-stimulating factor signaling pathway(GO:1902226) regulation of response to macrophage colony-stimulating factor(GO:1903969) regulation of cellular response to macrophage colony-stimulating factor stimulus(GO:1903972) |
| 0.5 | 1.5 | GO:0070889 | platelet alpha granule organization(GO:0070889) |
| 0.5 | 5.7 | GO:0001682 | tRNA 5'-leader removal(GO:0001682) |
| 0.5 | 0.5 | GO:0006550 | isoleucine catabolic process(GO:0006550) |
| 0.5 | 1.5 | GO:0006546 | glycine catabolic process(GO:0006546) glycine decarboxylation via glycine cleavage system(GO:0019464) |
| 0.5 | 4.6 | GO:1902415 | regulation of mRNA binding(GO:1902415) regulation of RNA binding(GO:1905214) |
| 0.5 | 3.0 | GO:0035864 | response to potassium ion(GO:0035864) cellular response to potassium ion(GO:0035865) |
| 0.5 | 4.6 | GO:0030540 | female genitalia development(GO:0030540) |
| 0.5 | 0.5 | GO:1900368 | regulation of RNA interference(GO:1900368) |
| 0.5 | 1.5 | GO:0030327 | prenylated protein catabolic process(GO:0030327) |
| 0.5 | 1.0 | GO:0034392 | negative regulation of smooth muscle cell apoptotic process(GO:0034392) |
| 0.5 | 1.5 | GO:0006189 | 'de novo' IMP biosynthetic process(GO:0006189) |
| 0.5 | 2.0 | GO:0002949 | tRNA threonylcarbamoyladenosine modification(GO:0002949) |
| 0.5 | 3.5 | GO:0016480 | negative regulation of transcription from RNA polymerase III promoter(GO:0016480) |
| 0.5 | 10.5 | GO:0046033 | AMP metabolic process(GO:0046033) |
| 0.5 | 1.5 | GO:0051095 | regulation of helicase activity(GO:0051095) positive regulation of helicase activity(GO:0051096) |
| 0.5 | 1.0 | GO:0036292 | DNA rewinding(GO:0036292) |
| 0.5 | 3.0 | GO:0038018 | Wnt receptor catabolic process(GO:0038018) |
| 0.5 | 9.0 | GO:0009303 | rRNA transcription(GO:0009303) |
| 0.5 | 8.4 | GO:0051298 | centrosome duplication(GO:0051298) |
| 0.5 | 2.5 | GO:0061303 | cornea development in camera-type eye(GO:0061303) |
| 0.5 | 2.0 | GO:0070318 | positive regulation of G0 to G1 transition(GO:0070318) |
| 0.5 | 1.5 | GO:0006244 | pyrimidine nucleotide catabolic process(GO:0006244) pyrimidine deoxyribonucleotide catabolic process(GO:0009223) |
| 0.5 | 1.0 | GO:1902969 | mitotic DNA replication(GO:1902969) |
| 0.5 | 1.0 | GO:0045914 | negative regulation of catecholamine metabolic process(GO:0045914) negative regulation of dopamine metabolic process(GO:0045963) |
| 0.5 | 8.2 | GO:0000338 | protein deneddylation(GO:0000338) |
| 0.5 | 7.3 | GO:0034776 | response to histamine(GO:0034776) |
| 0.5 | 1.0 | GO:0000715 | nucleotide-excision repair, DNA damage recognition(GO:0000715) |
| 0.5 | 1.4 | GO:0043686 | co-translational protein modification(GO:0043686) |
| 0.5 | 1.4 | GO:0070973 | protein localization to endoplasmic reticulum exit site(GO:0070973) |
| 0.5 | 1.9 | GO:0042796 | snRNA transcription from RNA polymerase III promoter(GO:0042796) |
| 0.5 | 1.9 | GO:2000543 | positive regulation of gastrulation(GO:2000543) |
| 0.5 | 16.6 | GO:0000387 | spliceosomal snRNP assembly(GO:0000387) |
| 0.5 | 6.2 | GO:2000324 | positive regulation of glucocorticoid receptor signaling pathway(GO:2000324) |
| 0.5 | 2.8 | GO:0061087 | positive regulation of histone H3-K27 methylation(GO:0061087) |
| 0.5 | 1.9 | GO:0006384 | transcription initiation from RNA polymerase III promoter(GO:0006384) |
| 0.5 | 1.4 | GO:0006931 | substrate-dependent cell migration, cell attachment to substrate(GO:0006931) |
| 0.5 | 8.9 | GO:0010569 | regulation of double-strand break repair via homologous recombination(GO:0010569) |
| 0.5 | 0.5 | GO:0021943 | formation of radial glial scaffolds(GO:0021943) |
| 0.5 | 1.9 | GO:0019853 | L-ascorbic acid biosynthetic process(GO:0019853) |
| 0.5 | 6.1 | GO:0001522 | pseudouridine synthesis(GO:0001522) |
| 0.5 | 1.4 | GO:0002184 | cytoplasmic translational termination(GO:0002184) |
| 0.5 | 0.9 | GO:0002361 | CD4-positive, CD25-positive, alpha-beta regulatory T cell differentiation(GO:0002361) |
| 0.5 | 0.5 | GO:0009162 | deoxyribonucleoside monophosphate metabolic process(GO:0009162) |
| 0.5 | 1.4 | GO:0033260 | nuclear DNA replication(GO:0033260) |
| 0.5 | 5.1 | GO:0006301 | postreplication repair(GO:0006301) |
| 0.5 | 1.4 | GO:0042851 | L-alanine metabolic process(GO:0042851) |
| 0.5 | 0.9 | GO:0009786 | regulation of asymmetric cell division(GO:0009786) |
| 0.5 | 1.9 | GO:0044339 | canonical Wnt signaling pathway involved in osteoblast differentiation(GO:0044339) |
| 0.5 | 4.6 | GO:0001731 | formation of translation preinitiation complex(GO:0001731) |
| 0.5 | 0.5 | GO:0060399 | positive regulation of growth hormone receptor signaling pathway(GO:0060399) |
| 0.5 | 4.1 | GO:0061029 | eyelid development in camera-type eye(GO:0061029) |
| 0.5 | 1.4 | GO:1903660 | transforming growth factor beta activation(GO:0036363) regulation of complement-dependent cytotoxicity(GO:1903659) negative regulation of complement-dependent cytotoxicity(GO:1903660) |
| 0.5 | 3.2 | GO:0046490 | isopentenyl diphosphate biosynthetic process(GO:0009240) isopentenyl diphosphate metabolic process(GO:0046490) |
| 0.5 | 1.8 | GO:1902514 | regulation of calcium ion transmembrane transport via high voltage-gated calcium channel(GO:1902514) |
| 0.5 | 1.8 | GO:0035524 | proline transmembrane transport(GO:0035524) |
| 0.5 | 0.9 | GO:0021553 | olfactory nerve development(GO:0021553) |
| 0.5 | 2.3 | GO:0006207 | 'de novo' pyrimidine nucleobase biosynthetic process(GO:0006207) pyrimidine nucleobase biosynthetic process(GO:0019856) |
| 0.5 | 5.0 | GO:1903546 | protein localization to photoreceptor outer segment(GO:1903546) |
| 0.4 | 0.9 | GO:0021698 | cerebellar cortex structural organization(GO:0021698) |
| 0.4 | 6.3 | GO:0030953 | astral microtubule organization(GO:0030953) |
| 0.4 | 0.4 | GO:0060468 | prevention of polyspermy(GO:0060468) |
| 0.4 | 1.3 | GO:2000686 | regulation of rubidium ion transmembrane transporter activity(GO:2000686) |
| 0.4 | 0.4 | GO:1904046 | negative regulation of vascular endothelial growth factor production(GO:1904046) |
| 0.4 | 0.9 | GO:0070358 | actin polymerization-dependent cell motility(GO:0070358) |
| 0.4 | 2.2 | GO:0006498 | N-terminal protein lipidation(GO:0006498) |
| 0.4 | 1.8 | GO:0031053 | primary miRNA processing(GO:0031053) |
| 0.4 | 2.2 | GO:1902961 | positive regulation of aspartic-type endopeptidase activity involved in amyloid precursor protein catabolic process(GO:1902961) positive regulation of aspartic-type peptidase activity(GO:1905247) |
| 0.4 | 0.4 | GO:0006166 | purine ribonucleoside salvage(GO:0006166) |
| 0.4 | 6.1 | GO:0031297 | replication fork processing(GO:0031297) |
| 0.4 | 2.2 | GO:0042138 | meiotic DNA double-strand break formation(GO:0042138) |
| 0.4 | 2.6 | GO:0006265 | DNA topological change(GO:0006265) |
| 0.4 | 1.3 | GO:0045110 | intermediate filament bundle assembly(GO:0045110) |
| 0.4 | 4.3 | GO:0035435 | phosphate ion transmembrane transport(GO:0035435) |
| 0.4 | 0.4 | GO:0090069 | regulation of ribosome biogenesis(GO:0090069) |
| 0.4 | 2.6 | GO:0030578 | PML body organization(GO:0030578) |
| 0.4 | 1.7 | GO:0035927 | RNA import into mitochondrion(GO:0035927) |
| 0.4 | 1.3 | GO:0006703 | estrogen biosynthetic process(GO:0006703) |
| 0.4 | 4.7 | GO:0098953 | receptor diffusion trapping(GO:0098953) postsynaptic neurotransmitter receptor diffusion trapping(GO:0098970) neurotransmitter receptor diffusion trapping(GO:0099628) |
| 0.4 | 1.7 | GO:0015825 | L-serine transport(GO:0015825) |
| 0.4 | 0.4 | GO:0071332 | cellular response to fructose stimulus(GO:0071332) |
| 0.4 | 10.7 | GO:0000154 | rRNA modification(GO:0000154) |
| 0.4 | 2.1 | GO:0051490 | negative regulation of filopodium assembly(GO:0051490) |
| 0.4 | 0.8 | GO:2001027 | negative regulation of endothelial cell chemotaxis(GO:2001027) |
| 0.4 | 2.1 | GO:0007253 | cytoplasmic sequestering of NF-kappaB(GO:0007253) |
| 0.4 | 1.3 | GO:0098917 | retrograde trans-synaptic signaling(GO:0098917) |
| 0.4 | 1.3 | GO:0002940 | tRNA N2-guanine methylation(GO:0002940) |
| 0.4 | 2.1 | GO:0061072 | iris morphogenesis(GO:0061072) |
| 0.4 | 0.8 | GO:0043490 | malate-aspartate shuttle(GO:0043490) |
| 0.4 | 1.7 | GO:0051365 | cellular response to potassium ion starvation(GO:0051365) |
| 0.4 | 1.2 | GO:0046952 | ketone body catabolic process(GO:0046952) |
| 0.4 | 2.1 | GO:0070495 | regulation of thrombin receptor signaling pathway(GO:0070494) negative regulation of thrombin receptor signaling pathway(GO:0070495) |
| 0.4 | 1.2 | GO:0000972 | transcription-dependent tethering of RNA polymerase II gene DNA at nuclear periphery(GO:0000972) |
| 0.4 | 3.3 | GO:0010587 | miRNA catabolic process(GO:0010587) |
| 0.4 | 1.6 | GO:0060800 | regulation of cell differentiation involved in embryonic placenta development(GO:0060800) |
| 0.4 | 0.4 | GO:0030860 | regulation of polarized epithelial cell differentiation(GO:0030860) |
| 0.4 | 2.9 | GO:0002227 | innate immune response in mucosa(GO:0002227) |
| 0.4 | 4.1 | GO:0034508 | centromere complex assembly(GO:0034508) |
| 0.4 | 1.2 | GO:1901097 | negative regulation of autophagosome maturation(GO:1901097) |
| 0.4 | 2.0 | GO:0042908 | xenobiotic transport(GO:0042908) |
| 0.4 | 1.6 | GO:0061073 | ciliary body morphogenesis(GO:0061073) |
| 0.4 | 4.5 | GO:0048387 | negative regulation of retinoic acid receptor signaling pathway(GO:0048387) |
| 0.4 | 0.4 | GO:0035246 | peptidyl-arginine N-methylation(GO:0035246) |
| 0.4 | 0.4 | GO:0035887 | aortic smooth muscle cell differentiation(GO:0035887) |
| 0.4 | 1.2 | GO:0061341 | non-canonical Wnt signaling pathway involved in heart development(GO:0061341) planar cell polarity pathway involved in heart morphogenesis(GO:0061346) |
| 0.4 | 1.6 | GO:0045112 | integrin biosynthetic process(GO:0045112) |
| 0.4 | 1.2 | GO:0003165 | Purkinje myocyte development(GO:0003165) |
| 0.4 | 1.2 | GO:1903644 | regulation of chaperone-mediated protein folding(GO:1903644) |
| 0.4 | 1.2 | GO:0021785 | branchiomotor neuron axon guidance(GO:0021785) |
| 0.4 | 1.2 | GO:0002541 | activation of plasma proteins involved in acute inflammatory response(GO:0002541) |
| 0.4 | 4.4 | GO:0061470 | T follicular helper cell differentiation(GO:0061470) |
| 0.4 | 7.2 | GO:0043567 | regulation of insulin-like growth factor receptor signaling pathway(GO:0043567) |
| 0.4 | 0.4 | GO:0072104 | renal system vasculature morphogenesis(GO:0061438) kidney vasculature morphogenesis(GO:0061439) glomerulus vasculature morphogenesis(GO:0072103) glomerular capillary formation(GO:0072104) |
| 0.4 | 1.6 | GO:1901842 | negative regulation of high voltage-gated calcium channel activity(GO:1901842) |
| 0.4 | 3.2 | GO:0021527 | spinal cord association neuron differentiation(GO:0021527) |
| 0.4 | 1.2 | GO:0060994 | regulation of transcription from RNA polymerase II promoter involved in kidney development(GO:0060994) |
| 0.4 | 9.9 | GO:0000070 | mitotic sister chromatid segregation(GO:0000070) |
| 0.4 | 0.4 | GO:0018201 | peptidyl-glycine modification(GO:0018201) |
| 0.4 | 1.6 | GO:0033326 | cerebrospinal fluid secretion(GO:0033326) |
| 0.4 | 4.3 | GO:0043615 | astrocyte cell migration(GO:0043615) |
| 0.4 | 2.3 | GO:0030300 | regulation of intestinal cholesterol absorption(GO:0030300) |
| 0.4 | 0.4 | GO:0048022 | negative regulation of melanin biosynthetic process(GO:0048022) negative regulation of secondary metabolite biosynthetic process(GO:1900377) |
| 0.4 | 1.2 | GO:0000101 | sulfur amino acid transport(GO:0000101) |
| 0.4 | 6.9 | GO:0031577 | spindle checkpoint(GO:0031577) |
| 0.4 | 5.0 | GO:0046132 | pyrimidine ribonucleotide metabolic process(GO:0009218) pyrimidine ribonucleotide biosynthetic process(GO:0009220) pyrimidine ribonucleoside biosynthetic process(GO:0046132) |
| 0.4 | 0.8 | GO:0009106 | lipoate metabolic process(GO:0009106) |
| 0.4 | 1.9 | GO:2001023 | regulation of response to drug(GO:2001023) |
| 0.4 | 0.8 | GO:0072711 | cellular response to hydroxyurea(GO:0072711) |
| 0.4 | 3.8 | GO:0046784 | viral mRNA export from host cell nucleus(GO:0046784) |
| 0.4 | 4.9 | GO:0060766 | negative regulation of androgen receptor signaling pathway(GO:0060766) |
| 0.4 | 4.5 | GO:0018206 | peptidyl-methionine modification(GO:0018206) |
| 0.4 | 4.1 | GO:0002051 | osteoblast fate commitment(GO:0002051) |
| 0.4 | 2.2 | GO:0014850 | response to muscle activity(GO:0014850) |
| 0.4 | 1.1 | GO:0046168 | glycerol-3-phosphate catabolic process(GO:0046168) |
| 0.4 | 0.7 | GO:0036228 | protein targeting to nuclear inner membrane(GO:0036228) |
| 0.4 | 0.4 | GO:0090154 | positive regulation of sphingolipid biosynthetic process(GO:0090154) positive regulation of ceramide biosynthetic process(GO:2000304) |
| 0.4 | 7.0 | GO:0050650 | chondroitin sulfate proteoglycan biosynthetic process(GO:0050650) |
| 0.4 | 1.1 | GO:1990859 | cellular response to endothelin(GO:1990859) |
| 0.4 | 6.3 | GO:0043968 | histone H2A acetylation(GO:0043968) |
| 0.4 | 0.4 | GO:0051542 | elastin biosynthetic process(GO:0051542) |
| 0.4 | 11.0 | GO:0034723 | DNA replication-dependent nucleosome assembly(GO:0006335) DNA replication-dependent nucleosome organization(GO:0034723) |
| 0.4 | 0.4 | GO:1903377 | negative regulation of oxidative stress-induced neuron intrinsic apoptotic signaling pathway(GO:1903377) |
| 0.4 | 1.1 | GO:0010836 | negative regulation of protein ADP-ribosylation(GO:0010836) telomere assembly(GO:0032202) |
| 0.4 | 3.6 | GO:0048935 | peripheral nervous system neuron differentiation(GO:0048934) peripheral nervous system neuron development(GO:0048935) |
| 0.4 | 1.1 | GO:0006678 | glucosylceramide metabolic process(GO:0006678) |
| 0.4 | 0.4 | GO:0003221 | right ventricular cardiac muscle tissue morphogenesis(GO:0003221) |
| 0.4 | 1.4 | GO:1903964 | monounsaturated fatty acid metabolic process(GO:1903964) monounsaturated fatty acid biosynthetic process(GO:1903966) |
| 0.4 | 0.7 | GO:0002326 | B cell lineage commitment(GO:0002326) |
| 0.4 | 1.8 | GO:1902455 | negative regulation of stem cell population maintenance(GO:1902455) |
| 0.4 | 1.1 | GO:0006553 | lysine metabolic process(GO:0006553) |
| 0.4 | 2.9 | GO:1904259 | regulation of basement membrane assembly involved in embryonic body morphogenesis(GO:1904259) positive regulation of basement membrane assembly involved in embryonic body morphogenesis(GO:1904261) basement membrane assembly involved in embryonic body morphogenesis(GO:2001197) |
| 0.4 | 3.2 | GO:0019359 | NAD biosynthetic process(GO:0009435) nicotinamide nucleotide biosynthetic process(GO:0019359) |
| 0.4 | 0.7 | GO:0021764 | amygdala development(GO:0021764) |
| 0.4 | 0.7 | GO:0060594 | mammary gland specification(GO:0060594) |
| 0.4 | 0.4 | GO:0072095 | regulation of branch elongation involved in ureteric bud branching(GO:0072095) |
| 0.4 | 8.9 | GO:0006084 | acetyl-CoA metabolic process(GO:0006084) |
| 0.4 | 1.4 | GO:0098887 | neurotransmitter receptor transport, endosome to postsynaptic membrane(GO:0098887) |
| 0.4 | 1.4 | GO:0035405 | histone-threonine phosphorylation(GO:0035405) |
| 0.4 | 0.7 | GO:0046855 | inositol phosphate dephosphorylation(GO:0046855) |
| 0.4 | 0.7 | GO:0031145 | anaphase-promoting complex-dependent catabolic process(GO:0031145) |
| 0.4 | 3.2 | GO:0045947 | negative regulation of translational initiation(GO:0045947) |
| 0.3 | 24.1 | GO:0051225 | spindle assembly(GO:0051225) |
| 0.3 | 1.4 | GO:0036265 | RNA (guanine-N7)-methylation(GO:0036265) |
| 0.3 | 1.0 | GO:0002329 | pre-B cell differentiation(GO:0002329) |
| 0.3 | 1.4 | GO:0042117 | monocyte activation(GO:0042117) |
| 0.3 | 1.0 | GO:0042420 | dopamine catabolic process(GO:0042420) |
| 0.3 | 0.7 | GO:0060392 | negative regulation of SMAD protein import into nucleus(GO:0060392) |
| 0.3 | 0.7 | GO:0061152 | trachea submucosa development(GO:0061152) trachea gland development(GO:0061153) |
| 0.3 | 2.4 | GO:0030382 | sperm mitochondrion organization(GO:0030382) |
| 0.3 | 5.2 | GO:0000188 | inactivation of MAPK activity(GO:0000188) |
| 0.3 | 2.4 | GO:0033045 | regulation of sister chromatid segregation(GO:0033045) |
| 0.3 | 2.4 | GO:0055003 | cardiac myofibril assembly(GO:0055003) |
| 0.3 | 12.4 | GO:0045724 | positive regulation of cilium assembly(GO:0045724) |
| 0.3 | 7.6 | GO:0048745 | smooth muscle tissue development(GO:0048745) |
| 0.3 | 5.1 | GO:0042407 | cristae formation(GO:0042407) |
| 0.3 | 3.8 | GO:0031665 | negative regulation of lipopolysaccharide-mediated signaling pathway(GO:0031665) |
| 0.3 | 0.3 | GO:0099543 | trans-synaptic signaling by soluble gas(GO:0099543) trans-synaptic signaling by nitric oxide(GO:0099548) |
| 0.3 | 0.3 | GO:0070346 | positive regulation of fat cell proliferation(GO:0070346) |
| 0.3 | 3.4 | GO:0033089 | positive regulation of T cell differentiation in thymus(GO:0033089) positive regulation of thymocyte aggregation(GO:2000400) |
| 0.3 | 5.1 | GO:0030866 | cortical actin cytoskeleton organization(GO:0030866) |
| 0.3 | 1.0 | GO:0046013 | T cell homeostatic proliferation(GO:0001777) regulation of T cell homeostatic proliferation(GO:0046013) |
| 0.3 | 1.0 | GO:0070537 | histone H2A K63-linked deubiquitination(GO:0070537) |
| 0.3 | 0.3 | GO:0070827 | chromatin maintenance(GO:0070827) |
| 0.3 | 1.3 | GO:2000795 | negative regulation of epithelial cell proliferation involved in lung morphogenesis(GO:2000795) |
| 0.3 | 0.7 | GO:0002439 | chronic inflammatory response to antigenic stimulus(GO:0002439) |
| 0.3 | 2.0 | GO:0003065 | positive regulation of heart rate by epinephrine(GO:0003065) |
| 0.3 | 1.3 | GO:1904627 | response to phorbol 13-acetate 12-myristate(GO:1904627) cellular response to phorbol 13-acetate 12-myristate(GO:1904628) |
| 0.3 | 0.7 | GO:1990928 | response to amino acid starvation(GO:1990928) |
| 0.3 | 1.0 | GO:0044861 | protein transport into plasma membrane raft(GO:0044861) |
| 0.3 | 2.3 | GO:0010764 | negative regulation of fibroblast migration(GO:0010764) |
| 0.3 | 0.7 | GO:0072717 | response to actinomycin D(GO:0072716) cellular response to actinomycin D(GO:0072717) |
| 0.3 | 2.0 | GO:0032204 | regulation of telomere maintenance(GO:0032204) |
| 0.3 | 2.0 | GO:1990573 | potassium ion import across plasma membrane(GO:1990573) |
| 0.3 | 1.6 | GO:0051983 | regulation of chromosome segregation(GO:0051983) |
| 0.3 | 2.3 | GO:0001915 | negative regulation of T cell mediated cytotoxicity(GO:0001915) |
| 0.3 | 1.3 | GO:0022616 | DNA strand elongation involved in DNA replication(GO:0006271) DNA strand elongation(GO:0022616) |
| 0.3 | 1.3 | GO:1901165 | positive regulation of trophoblast cell migration(GO:1901165) |
| 0.3 | 0.3 | GO:1900157 | regulation of bone mineralization involved in bone maturation(GO:1900157) |
| 0.3 | 1.0 | GO:2001206 | positive regulation of osteoclast development(GO:2001206) |
| 0.3 | 2.3 | GO:0006477 | protein sulfation(GO:0006477) |
| 0.3 | 3.6 | GO:1904754 | positive regulation of vascular associated smooth muscle cell migration(GO:1904754) |
| 0.3 | 0.3 | GO:0060528 | secretory columnal luminar epithelial cell differentiation involved in prostate glandular acinus development(GO:0060528) |
| 0.3 | 1.0 | GO:0032508 | DNA duplex unwinding(GO:0032508) |
| 0.3 | 1.0 | GO:1902035 | positive regulation of hematopoietic stem cell proliferation(GO:1902035) |
| 0.3 | 1.3 | GO:1905098 | negative regulation of guanyl-nucleotide exchange factor activity(GO:1905098) |
| 0.3 | 5.5 | GO:0051352 | negative regulation of ligase activity(GO:0051352) negative regulation of ubiquitin-protein transferase activity(GO:0051444) |
| 0.3 | 3.5 | GO:0006123 | mitochondrial electron transport, cytochrome c to oxygen(GO:0006123) |
| 0.3 | 1.0 | GO:0033145 | positive regulation of intracellular steroid hormone receptor signaling pathway(GO:0033145) |
| 0.3 | 1.3 | GO:0006421 | asparaginyl-tRNA aminoacylation(GO:0006421) |
| 0.3 | 0.3 | GO:0021526 | medial motor column neuron differentiation(GO:0021526) |
| 0.3 | 2.2 | GO:0030948 | negative regulation of vascular endothelial growth factor receptor signaling pathway(GO:0030948) |
| 0.3 | 0.3 | GO:0021648 | vestibulocochlear nerve morphogenesis(GO:0021648) |
| 0.3 | 1.6 | GO:0061179 | negative regulation of insulin secretion involved in cellular response to glucose stimulus(GO:0061179) |
| 0.3 | 0.3 | GO:0000414 | regulation of histone H3-K36 methylation(GO:0000414) |
| 0.3 | 0.6 | GO:0090009 | primitive streak formation(GO:0090009) |
| 0.3 | 1.5 | GO:0070932 | histone H3 deacetylation(GO:0070932) |
| 0.3 | 2.2 | GO:0006729 | tetrahydrobiopterin biosynthetic process(GO:0006729) |
| 0.3 | 0.9 | GO:0006537 | glutamate biosynthetic process(GO:0006537) |
| 0.3 | 4.9 | GO:0007614 | short-term memory(GO:0007614) |
| 0.3 | 2.1 | GO:0045721 | negative regulation of gluconeogenesis(GO:0045721) |
| 0.3 | 0.9 | GO:0001698 | gastrin-induced gastric acid secretion(GO:0001698) |
| 0.3 | 0.3 | GO:0035413 | positive regulation of catenin import into nucleus(GO:0035413) |
| 0.3 | 0.9 | GO:0097498 | endothelial tube lumen extension(GO:0097498) |
| 0.3 | 0.3 | GO:0030952 | establishment or maintenance of cytoskeleton polarity(GO:0030952) |
| 0.3 | 1.8 | GO:1900748 | positive regulation of vascular endothelial growth factor signaling pathway(GO:1900748) |
| 0.3 | 5.7 | GO:0007216 | G-protein coupled glutamate receptor signaling pathway(GO:0007216) |
| 0.3 | 2.4 | GO:0048149 | behavioral response to ethanol(GO:0048149) |
| 0.3 | 3.0 | GO:0021540 | corpus callosum morphogenesis(GO:0021540) |
| 0.3 | 11.4 | GO:0042274 | ribosomal small subunit biogenesis(GO:0042274) |
| 0.3 | 1.5 | GO:0043654 | recognition of apoptotic cell(GO:0043654) |
| 0.3 | 3.3 | GO:0032957 | inositol trisphosphate metabolic process(GO:0032957) |
| 0.3 | 3.6 | GO:0032927 | positive regulation of activin receptor signaling pathway(GO:0032927) |
| 0.3 | 3.6 | GO:0042403 | thyroid hormone metabolic process(GO:0042403) |
| 0.3 | 3.0 | GO:0002082 | regulation of oxidative phosphorylation(GO:0002082) |
| 0.3 | 3.0 | GO:0051292 | nuclear pore complex assembly(GO:0051292) |
| 0.3 | 1.5 | GO:1902775 | mitochondrial large ribosomal subunit assembly(GO:1902775) |
| 0.3 | 2.7 | GO:0006003 | fructose 2,6-bisphosphate metabolic process(GO:0006003) |
| 0.3 | 0.3 | GO:0030997 | regulation of centriole-centriole cohesion(GO:0030997) |
| 0.3 | 0.9 | GO:0033153 | somatic diversification of T cell receptor genes(GO:0002568) somatic recombination of T cell receptor gene segments(GO:0002681) T cell receptor V(D)J recombination(GO:0033153) |
| 0.3 | 0.9 | GO:0070535 | histone H2A K63-linked ubiquitination(GO:0070535) |
| 0.3 | 2.9 | GO:0043518 | negative regulation of DNA damage response, signal transduction by p53 class mediator(GO:0043518) |
| 0.3 | 5.0 | GO:0008340 | determination of adult lifespan(GO:0008340) |
| 0.3 | 1.2 | GO:0000466 | maturation of 5.8S rRNA from tricistronic rRNA transcript (SSU-rRNA, 5.8S rRNA, LSU-rRNA)(GO:0000466) |
| 0.3 | 0.9 | GO:1990927 | calcium ion regulated lysosome exocytosis(GO:1990927) |
| 0.3 | 4.6 | GO:0016486 | peptide hormone processing(GO:0016486) |
| 0.3 | 1.2 | GO:0003050 | regulation of systemic arterial blood pressure by atrial natriuretic peptide(GO:0003050) |
| 0.3 | 6.4 | GO:0000305 | response to oxygen radical(GO:0000305) |
| 0.3 | 5.2 | GO:1901663 | quinone biosynthetic process(GO:1901663) |
| 0.3 | 1.4 | GO:0036120 | cellular response to platelet-derived growth factor stimulus(GO:0036120) |
| 0.3 | 1.2 | GO:0010815 | bradykinin catabolic process(GO:0010815) |
| 0.3 | 3.2 | GO:0070389 | chaperone cofactor-dependent protein refolding(GO:0070389) |
| 0.3 | 1.4 | GO:0000098 | sulfur amino acid catabolic process(GO:0000098) |
| 0.3 | 0.9 | GO:1900273 | positive regulation of long-term synaptic potentiation(GO:1900273) |
| 0.3 | 0.6 | GO:0051799 | negative regulation of hair follicle development(GO:0051799) |
| 0.3 | 13.8 | GO:0006414 | translational elongation(GO:0006414) |
| 0.3 | 2.3 | GO:0006607 | NLS-bearing protein import into nucleus(GO:0006607) |
| 0.3 | 5.4 | GO:0006261 | DNA-dependent DNA replication(GO:0006261) |
| 0.3 | 0.3 | GO:0030167 | proteoglycan catabolic process(GO:0030167) |
| 0.3 | 2.3 | GO:0021860 | pyramidal neuron development(GO:0021860) |
| 0.3 | 0.6 | GO:0001880 | Mullerian duct regression(GO:0001880) |
| 0.3 | 4.2 | GO:0030150 | protein import into mitochondrial matrix(GO:0030150) |
| 0.3 | 0.8 | GO:0015960 | diadenosine polyphosphate biosynthetic process(GO:0015960) diadenosine tetraphosphate metabolic process(GO:0015965) diadenosine tetraphosphate biosynthetic process(GO:0015966) |
| 0.3 | 1.1 | GO:0030576 | Cajal body organization(GO:0030576) |
| 0.3 | 1.1 | GO:0097298 | regulation of nucleus size(GO:0097298) |
| 0.3 | 4.5 | GO:0071392 | cellular response to estradiol stimulus(GO:0071392) |
| 0.3 | 3.4 | GO:0043923 | positive regulation by host of viral transcription(GO:0043923) |
| 0.3 | 0.3 | GO:0016080 | synaptic vesicle targeting(GO:0016080) |
| 0.3 | 0.3 | GO:0070427 | nucleotide-binding oligomerization domain containing 1 signaling pathway(GO:0070427) |
| 0.3 | 2.8 | GO:0075509 | receptor-mediated endocytosis of virus by host cell(GO:0019065) endocytosis involved in viral entry into host cell(GO:0075509) |
| 0.3 | 1.1 | GO:0060903 | positive regulation of meiosis I(GO:0060903) |
| 0.3 | 5.6 | GO:0048026 | positive regulation of mRNA splicing, via spliceosome(GO:0048026) |
| 0.3 | 1.1 | GO:0002315 | marginal zone B cell differentiation(GO:0002315) |
| 0.3 | 0.3 | GO:1900104 | hyaluranon cable assembly(GO:0036118) regulation of hyaluranon cable assembly(GO:1900104) positive regulation of hyaluranon cable assembly(GO:1900106) |
| 0.3 | 0.8 | GO:0014022 | neural plate elongation(GO:0014022) convergent extension involved in neural plate elongation(GO:0022007) |
| 0.3 | 0.8 | GO:0006592 | ornithine biosynthetic process(GO:0006592) |
| 0.3 | 1.6 | GO:0070986 | left/right axis specification(GO:0070986) |
| 0.3 | 2.5 | GO:0009644 | response to high light intensity(GO:0009644) |
| 0.3 | 1.4 | GO:1901029 | negative regulation of mitochondrial outer membrane permeabilization involved in apoptotic signaling pathway(GO:1901029) |
| 0.3 | 3.0 | GO:0033601 | positive regulation of mammary gland epithelial cell proliferation(GO:0033601) |
| 0.3 | 3.0 | GO:0042118 | endothelial cell activation(GO:0042118) |
| 0.3 | 0.8 | GO:0016256 | N-glycan processing to lysosome(GO:0016256) |
| 0.3 | 0.5 | GO:0000707 | meiotic DNA recombinase assembly(GO:0000707) |
| 0.3 | 2.2 | GO:2000144 | positive regulation of DNA-templated transcription, initiation(GO:2000144) |
| 0.3 | 3.5 | GO:0009263 | deoxyribonucleotide biosynthetic process(GO:0009263) |
| 0.3 | 2.7 | GO:0090557 | establishment of endothelial intestinal barrier(GO:0090557) |
| 0.3 | 1.1 | GO:0070272 | proton-transporting ATP synthase complex assembly(GO:0043461) proton-transporting ATP synthase complex biogenesis(GO:0070272) |
| 0.3 | 1.9 | GO:0006108 | malate metabolic process(GO:0006108) |
| 0.3 | 0.3 | GO:1904526 | regulation of microtubule binding(GO:1904526) |
| 0.3 | 3.2 | GO:0032465 | regulation of cytokinesis(GO:0032465) |
| 0.3 | 0.3 | GO:0097201 | negative regulation of transcription from RNA polymerase II promoter in response to stress(GO:0097201) |
| 0.3 | 0.8 | GO:0006669 | sphinganine-1-phosphate biosynthetic process(GO:0006669) |
| 0.3 | 4.8 | GO:0046597 | negative regulation of viral entry into host cell(GO:0046597) |
| 0.3 | 5.3 | GO:0071108 | protein K48-linked deubiquitination(GO:0071108) |
| 0.3 | 0.8 | GO:0046032 | ADP catabolic process(GO:0046032) |
| 0.3 | 2.1 | GO:0051126 | negative regulation of Arp2/3 complex-mediated actin nucleation(GO:0034316) negative regulation of actin nucleation(GO:0051126) |
| 0.3 | 0.3 | GO:1904579 | response to thapsigargin(GO:1904578) cellular response to thapsigargin(GO:1904579) |
| 0.3 | 2.9 | GO:0042756 | drinking behavior(GO:0042756) |
| 0.3 | 1.6 | GO:0097264 | self proteolysis(GO:0097264) |
| 0.3 | 1.8 | GO:0043981 | histone H4-K5 acetylation(GO:0043981) histone H4-K8 acetylation(GO:0043982) |
| 0.3 | 0.8 | GO:1902626 | assembly of large subunit precursor of preribosome(GO:1902626) |
| 0.3 | 1.0 | GO:1903265 | positive regulation of tumor necrosis factor-mediated signaling pathway(GO:1903265) |
| 0.3 | 0.5 | GO:0010944 | negative regulation of transcription by competitive promoter binding(GO:0010944) |
| 0.3 | 1.8 | GO:0016185 | synaptic vesicle budding from presynaptic endocytic zone membrane(GO:0016185) |
| 0.3 | 1.0 | GO:0090283 | regulation of protein glycosylation in Golgi(GO:0090283) |
| 0.3 | 0.5 | GO:0031161 | phosphatidylinositol catabolic process(GO:0031161) |
| 0.3 | 0.3 | GO:0060577 | pulmonary vein morphogenesis(GO:0060577) |
| 0.3 | 0.5 | GO:0060729 | intestinal epithelial structure maintenance(GO:0060729) |
| 0.3 | 0.5 | GO:0002528 | regulation of vascular permeability involved in acute inflammatory response(GO:0002528) |
| 0.3 | 1.0 | GO:0060134 | prepulse inhibition(GO:0060134) |
| 0.3 | 3.0 | GO:0010259 | multicellular organism aging(GO:0010259) |
| 0.3 | 3.8 | GO:1902043 | positive regulation of extrinsic apoptotic signaling pathway via death domain receptors(GO:1902043) |
| 0.3 | 1.0 | GO:0046040 | IMP metabolic process(GO:0046040) |
| 0.3 | 1.0 | GO:0006420 | arginyl-tRNA aminoacylation(GO:0006420) |
| 0.2 | 1.0 | GO:0040001 | establishment of mitotic spindle localization(GO:0040001) |
| 0.2 | 1.0 | GO:0060155 | platelet dense granule organization(GO:0060155) |
| 0.2 | 2.7 | GO:0006337 | nucleosome disassembly(GO:0006337) |
| 0.2 | 4.2 | GO:0008156 | negative regulation of DNA replication(GO:0008156) |
| 0.2 | 1.5 | GO:0032929 | negative regulation of superoxide anion generation(GO:0032929) |
| 0.2 | 1.0 | GO:0006616 | SRP-dependent cotranslational protein targeting to membrane, translocation(GO:0006616) |
| 0.2 | 1.0 | GO:0003222 | ventricular trabecula myocardium morphogenesis(GO:0003222) |
| 0.2 | 2.2 | GO:0006104 | succinyl-CoA metabolic process(GO:0006104) |
| 0.2 | 0.5 | GO:0071677 | positive regulation of mononuclear cell migration(GO:0071677) |
| 0.2 | 1.0 | GO:0000819 | sister chromatid segregation(GO:0000819) |
| 0.2 | 12.5 | GO:0042273 | ribosomal large subunit biogenesis(GO:0042273) |
| 0.2 | 1.7 | GO:0042866 | pyruvate biosynthetic process(GO:0042866) |
| 0.2 | 5.0 | GO:0033622 | integrin activation(GO:0033622) |
| 0.2 | 0.7 | GO:0061537 | glycine secretion(GO:0061536) glycine secretion, neurotransmission(GO:0061537) |
| 0.2 | 1.2 | GO:1904352 | positive regulation of protein catabolic process in the vacuole(GO:1904352) |
| 0.2 | 3.3 | GO:0000002 | mitochondrial genome maintenance(GO:0000002) |
| 0.2 | 0.2 | GO:0036089 | cleavage furrow formation(GO:0036089) |
| 0.2 | 1.9 | GO:0030261 | chromosome condensation(GO:0030261) |
| 0.2 | 0.2 | GO:0003245 | cardiac muscle tissue growth involved in heart morphogenesis(GO:0003245) |
| 0.2 | 1.4 | GO:0016446 | somatic diversification of immune receptors via somatic mutation(GO:0002566) somatic hypermutation of immunoglobulin genes(GO:0016446) |
| 0.2 | 2.1 | GO:0031441 | negative regulation of mRNA 3'-end processing(GO:0031441) |
| 0.2 | 0.7 | GO:0036353 | histone H2A-K119 monoubiquitination(GO:0036353) |
| 0.2 | 0.9 | GO:0043516 | regulation of DNA damage response, signal transduction by p53 class mediator(GO:0043516) |
| 0.2 | 0.7 | GO:0032200 | telomere maintenance(GO:0000723) telomere organization(GO:0032200) |
| 0.2 | 0.7 | GO:0075525 | viral translational termination-reinitiation(GO:0075525) |
| 0.2 | 0.9 | GO:0019323 | pentose catabolic process(GO:0019323) |
| 0.2 | 0.5 | GO:0032570 | response to progesterone(GO:0032570) |
| 0.2 | 1.1 | GO:0000738 | DNA catabolic process, exonucleolytic(GO:0000738) |
| 0.2 | 1.5 | GO:0015842 | aminergic neurotransmitter loading into synaptic vesicle(GO:0015842) |
| 0.2 | 20.1 | GO:0065004 | protein-DNA complex assembly(GO:0065004) |
| 0.2 | 2.0 | GO:0090136 | epithelial cell-cell adhesion(GO:0090136) |
| 0.2 | 1.1 | GO:0006627 | protein processing involved in protein targeting to mitochondrion(GO:0006627) |
| 0.2 | 0.4 | GO:0002946 | tRNA C5-cytosine methylation(GO:0002946) |
| 0.2 | 0.7 | GO:1904245 | regulation of polynucleotide adenylyltransferase activity(GO:1904245) |
| 0.2 | 0.4 | GO:0060556 | vitamin D biosynthetic process(GO:0042368) regulation of vitamin D biosynthetic process(GO:0060556) |
| 0.2 | 0.2 | GO:2000286 | receptor internalization involved in canonical Wnt signaling pathway(GO:2000286) |
| 0.2 | 0.7 | GO:0060907 | positive regulation of macrophage cytokine production(GO:0060907) |
| 0.2 | 1.5 | GO:0032380 | regulation of intracellular lipid transport(GO:0032377) regulation of intracellular sterol transport(GO:0032380) regulation of intracellular cholesterol transport(GO:0032383) |
| 0.2 | 0.2 | GO:0038001 | paracrine signaling(GO:0038001) |
| 0.2 | 1.3 | GO:2000786 | positive regulation of autophagosome assembly(GO:2000786) |
| 0.2 | 0.6 | GO:1901533 | negative regulation of hematopoietic progenitor cell differentiation(GO:1901533) |
| 0.2 | 1.5 | GO:0051534 | negative regulation of NFAT protein import into nucleus(GO:0051534) |
| 0.2 | 0.8 | GO:0006529 | asparagine biosynthetic process(GO:0006529) |
| 0.2 | 0.4 | GO:0007398 | ectoderm development(GO:0007398) |
| 0.2 | 0.6 | GO:0030202 | heparin metabolic process(GO:0030202) |
| 0.2 | 1.1 | GO:1990086 | lens fiber cell apoptotic process(GO:1990086) |
| 0.2 | 1.5 | GO:0006353 | DNA-templated transcription, termination(GO:0006353) |
| 0.2 | 0.2 | GO:0000963 | mitochondrial RNA processing(GO:0000963) |
| 0.2 | 0.6 | GO:0033577 | protein glycosylation in endoplasmic reticulum(GO:0033577) |
| 0.2 | 0.2 | GO:0010499 | proteasomal ubiquitin-independent protein catabolic process(GO:0010499) |
| 0.2 | 1.7 | GO:0006346 | methylation-dependent chromatin silencing(GO:0006346) |
| 0.2 | 0.6 | GO:0006657 | CDP-choline pathway(GO:0006657) |
| 0.2 | 0.4 | GO:0043323 | positive regulation of natural killer cell degranulation(GO:0043323) |
| 0.2 | 0.2 | GO:1901992 | positive regulation of mitotic cell cycle phase transition(GO:1901992) |
| 0.2 | 2.5 | GO:0032933 | response to sterol depletion(GO:0006991) SREBP signaling pathway(GO:0032933) cellular response to sterol depletion(GO:0071501) |
| 0.2 | 3.1 | GO:0097094 | craniofacial suture morphogenesis(GO:0097094) |
| 0.2 | 1.8 | GO:0006120 | mitochondrial electron transport, NADH to ubiquinone(GO:0006120) |
| 0.2 | 1.4 | GO:0051571 | positive regulation of histone H3-K4 methylation(GO:0051571) |
| 0.2 | 3.6 | GO:0002347 | response to tumor cell(GO:0002347) |
| 0.2 | 0.4 | GO:2000209 | regulation of anoikis(GO:2000209) |
| 0.2 | 1.4 | GO:0042045 | epithelial fluid transport(GO:0042045) |
| 0.2 | 6.7 | GO:0034644 | cellular response to UV(GO:0034644) |
| 0.2 | 0.2 | GO:0016128 | phytosteroid metabolic process(GO:0016128) phytosteroid biosynthetic process(GO:0016129) |
| 0.2 | 0.4 | GO:0060830 | ciliary receptor clustering involved in smoothened signaling pathway(GO:0060830) |
| 0.2 | 1.4 | GO:0034975 | protein folding in endoplasmic reticulum(GO:0034975) |
| 0.2 | 0.4 | GO:0021942 | radial glia guided migration of Purkinje cell(GO:0021942) |
| 0.2 | 1.7 | GO:0045060 | negative thymic T cell selection(GO:0045060) |
| 0.2 | 0.6 | GO:2000556 | regulation of T-helper 1 cell cytokine production(GO:2000554) positive regulation of T-helper 1 cell cytokine production(GO:2000556) |
| 0.2 | 1.0 | GO:0045292 | mRNA cis splicing, via spliceosome(GO:0045292) |
| 0.2 | 0.4 | GO:0043497 | regulation of protein heterodimerization activity(GO:0043497) |
| 0.2 | 0.6 | GO:0021798 | forebrain dorsal/ventral pattern formation(GO:0021798) |
| 0.2 | 11.6 | GO:0021987 | cerebral cortex development(GO:0021987) |
| 0.2 | 1.0 | GO:0051531 | NFAT protein import into nucleus(GO:0051531) |
| 0.2 | 0.4 | GO:0000054 | ribosomal subunit export from nucleus(GO:0000054) ribosome localization(GO:0033750) establishment of ribosome localization(GO:0033753) |
| 0.2 | 0.8 | GO:0032790 | ribosome disassembly(GO:0032790) |
| 0.2 | 2.8 | GO:0016180 | snRNA processing(GO:0016180) |
| 0.2 | 5.7 | GO:0032543 | mitochondrial translation(GO:0032543) |
| 0.2 | 1.1 | GO:0070193 | synaptonemal complex assembly(GO:0007130) synaptonemal complex organization(GO:0070193) |
| 0.2 | 1.1 | GO:2000491 | positive regulation of hepatic stellate cell activation(GO:2000491) |
| 0.2 | 0.7 | GO:0061091 | regulation of phospholipid translocation(GO:0061091) positive regulation of phospholipid translocation(GO:0061092) |
| 0.2 | 9.2 | GO:0000380 | alternative mRNA splicing, via spliceosome(GO:0000380) |
| 0.2 | 10.1 | GO:0042254 | ribosome biogenesis(GO:0042254) |
| 0.2 | 0.5 | GO:0051967 | negative regulation of synaptic transmission, glutamatergic(GO:0051967) |
| 0.2 | 1.5 | GO:0080111 | DNA demethylation(GO:0080111) |
| 0.2 | 0.7 | GO:0009249 | protein lipoylation(GO:0009249) |
| 0.2 | 2.0 | GO:0006924 | activation-induced cell death of T cells(GO:0006924) |
| 0.2 | 0.5 | GO:0046294 | formaldehyde catabolic process(GO:0046294) |
| 0.2 | 0.9 | GO:0090224 | regulation of spindle organization(GO:0090224) |
| 0.2 | 1.2 | GO:0070673 | response to interleukin-18(GO:0070673) |
| 0.2 | 0.2 | GO:0090365 | regulation of mRNA modification(GO:0090365) |
| 0.2 | 1.8 | GO:0070208 | protein heterotrimerization(GO:0070208) |
| 0.2 | 0.7 | GO:2000291 | regulation of myoblast proliferation(GO:2000291) |
| 0.2 | 0.3 | GO:0044828 | negative regulation by host of viral genome replication(GO:0044828) |
| 0.2 | 2.8 | GO:0050962 | detection of light stimulus involved in visual perception(GO:0050908) detection of light stimulus involved in sensory perception(GO:0050962) |
| 0.2 | 0.3 | GO:1904874 | positive regulation of telomerase RNA localization to Cajal body(GO:1904874) |
| 0.2 | 4.3 | GO:0071427 | mRNA export from nucleus(GO:0006406) mRNA-containing ribonucleoprotein complex export from nucleus(GO:0071427) |
| 0.2 | 0.7 | GO:0033206 | meiotic cytokinesis(GO:0033206) |
| 0.2 | 0.5 | GO:0033563 | dorsal/ventral axon guidance(GO:0033563) |
| 0.2 | 1.0 | GO:1902895 | positive regulation of pri-miRNA transcription from RNA polymerase II promoter(GO:1902895) |
| 0.2 | 1.0 | GO:0071955 | recycling endosome to Golgi transport(GO:0071955) |
| 0.2 | 0.9 | GO:2000078 | positive regulation of type B pancreatic cell development(GO:2000078) |
| 0.2 | 0.2 | GO:0098914 | membrane repolarization during atrial cardiac muscle cell action potential(GO:0098914) |
| 0.2 | 5.5 | GO:0007026 | negative regulation of microtubule depolymerization(GO:0007026) |
| 0.2 | 1.2 | GO:0070493 | thrombin receptor signaling pathway(GO:0070493) |
| 0.2 | 0.7 | GO:0006379 | mRNA cleavage(GO:0006379) |
| 0.2 | 0.2 | GO:0097195 | pilomotor reflex(GO:0097195) |
| 0.2 | 0.8 | GO:0010757 | negative regulation of plasminogen activation(GO:0010757) |
| 0.2 | 0.8 | GO:0014886 | transition between slow and fast fiber(GO:0014886) |
| 0.2 | 1.7 | GO:0048671 | negative regulation of collateral sprouting(GO:0048671) |
| 0.2 | 0.5 | GO:0070198 | protein localization to chromosome, telomeric region(GO:0070198) |
| 0.2 | 0.8 | GO:0007020 | microtubule nucleation(GO:0007020) |
| 0.2 | 0.2 | GO:0003419 | growth plate cartilage chondrocyte proliferation(GO:0003419) |
| 0.2 | 0.5 | GO:0048733 | sebaceous gland development(GO:0048733) |
| 0.2 | 1.3 | GO:0016191 | synaptic vesicle uncoating(GO:0016191) |
| 0.2 | 0.7 | GO:2001224 | positive regulation of neuron migration(GO:2001224) |
| 0.2 | 4.4 | GO:0002181 | cytoplasmic translation(GO:0002181) |
| 0.2 | 0.6 | GO:0014846 | esophagus smooth muscle contraction(GO:0014846) glial cell-derived neurotrophic factor receptor signaling pathway(GO:0035860) |
| 0.2 | 0.3 | GO:0070094 | positive regulation of glucagon secretion(GO:0070094) |
| 0.2 | 0.3 | GO:0070487 | monocyte aggregation(GO:0070487) |
| 0.2 | 4.9 | GO:0006352 | DNA-templated transcription, initiation(GO:0006352) |
| 0.2 | 0.6 | GO:0060979 | vasculogenesis involved in coronary vascular morphogenesis(GO:0060979) |
| 0.2 | 1.0 | GO:0097428 | protein maturation by iron-sulfur cluster transfer(GO:0097428) |
| 0.2 | 0.6 | GO:0043435 | response to corticotropin-releasing hormone(GO:0043435) cellular response to corticotropin-releasing hormone stimulus(GO:0071376) |
| 0.2 | 0.9 | GO:0048711 | positive regulation of astrocyte differentiation(GO:0048711) |
| 0.2 | 1.3 | GO:0036260 | 7-methylguanosine RNA capping(GO:0009452) RNA capping(GO:0036260) |
| 0.2 | 0.6 | GO:0019276 | UDP-N-acetylgalactosamine metabolic process(GO:0019276) |
| 0.2 | 4.2 | GO:0006418 | tRNA aminoacylation for protein translation(GO:0006418) |
| 0.2 | 1.9 | GO:0070269 | pyroptosis(GO:0070269) |
| 0.2 | 0.3 | GO:0014012 | peripheral nervous system axon regeneration(GO:0014012) |
| 0.2 | 8.6 | GO:0006413 | translational initiation(GO:0006413) |
| 0.2 | 1.1 | GO:0005513 | detection of calcium ion(GO:0005513) |
| 0.2 | 0.6 | GO:0045602 | negative regulation of endothelial cell differentiation(GO:0045602) |
| 0.2 | 0.8 | GO:1900246 | positive regulation of RIG-I signaling pathway(GO:1900246) |
| 0.2 | 0.9 | GO:0050965 | detection of temperature stimulus involved in sensory perception(GO:0050961) detection of temperature stimulus involved in sensory perception of pain(GO:0050965) |
| 0.2 | 0.3 | GO:0038026 | reelin-mediated signaling pathway(GO:0038026) |
| 0.2 | 0.2 | GO:0045085 | negative regulation of interleukin-2 biosynthetic process(GO:0045085) |
| 0.2 | 1.1 | GO:0032471 | negative regulation of endoplasmic reticulum calcium ion concentration(GO:0032471) |
| 0.2 | 0.5 | GO:0022028 | tangential migration from the subventricular zone to the olfactory bulb(GO:0022028) |
| 0.2 | 0.6 | GO:0006415 | translational termination(GO:0006415) |
| 0.2 | 1.8 | GO:0031340 | positive regulation of vesicle fusion(GO:0031340) |
| 0.2 | 0.5 | GO:0006551 | leucine metabolic process(GO:0006551) |
| 0.2 | 1.4 | GO:0031163 | iron-sulfur cluster assembly(GO:0016226) metallo-sulfur cluster assembly(GO:0031163) |
| 0.2 | 0.2 | GO:0032056 | positive regulation of translation in response to stress(GO:0032056) |
| 0.2 | 0.6 | GO:0019673 | GDP-mannose metabolic process(GO:0019673) |
| 0.2 | 1.4 | GO:0050765 | negative regulation of phagocytosis(GO:0050765) |
| 0.2 | 1.2 | GO:0006817 | phosphate ion transport(GO:0006817) |
| 0.1 | 0.4 | GO:0060179 | male mating behavior(GO:0060179) |
| 0.1 | 0.1 | GO:1903313 | positive regulation of mRNA metabolic process(GO:1903313) |
| 0.1 | 0.3 | GO:0060279 | regulation of ovulation(GO:0060278) positive regulation of ovulation(GO:0060279) |
| 0.1 | 0.9 | GO:0036006 | response to macrophage colony-stimulating factor(GO:0036005) cellular response to macrophage colony-stimulating factor stimulus(GO:0036006) |
| 0.1 | 0.6 | GO:0051388 | positive regulation of neurotrophin TRK receptor signaling pathway(GO:0051388) |
| 0.1 | 1.5 | GO:1901976 | regulation of cell cycle checkpoint(GO:1901976) |
| 0.1 | 0.3 | GO:0001757 | somite specification(GO:0001757) |
| 0.1 | 0.1 | GO:1901857 | positive regulation of cellular respiration(GO:1901857) |
| 0.1 | 6.5 | GO:0051058 | negative regulation of small GTPase mediated signal transduction(GO:0051058) |
| 0.1 | 0.1 | GO:0071421 | manganese ion transmembrane transport(GO:0071421) |
| 0.1 | 0.4 | GO:1903624 | regulation of DNA catabolic process(GO:1903624) |
| 0.1 | 1.6 | GO:0031639 | plasminogen activation(GO:0031639) |
| 0.1 | 0.3 | GO:0021776 | smoothened signaling pathway involved in ventral spinal cord interneuron specification(GO:0021775) smoothened signaling pathway involved in spinal cord motor neuron cell fate specification(GO:0021776) |
| 0.1 | 1.3 | GO:0003356 | regulation of cilium movement(GO:0003352) regulation of cilium beat frequency(GO:0003356) |
| 0.1 | 2.1 | GO:0060338 | regulation of type I interferon-mediated signaling pathway(GO:0060338) |
| 0.1 | 0.7 | GO:0019896 | axonal transport of mitochondrion(GO:0019896) |
| 0.1 | 0.1 | GO:2000468 | regulation of peroxidase activity(GO:2000468) |
| 0.1 | 0.4 | GO:0042723 | thiamine metabolic process(GO:0006772) thiamine-containing compound metabolic process(GO:0042723) |
| 0.1 | 6.4 | GO:0071897 | DNA biosynthetic process(GO:0071897) |
| 0.1 | 0.6 | GO:1903553 | positive regulation of extracellular exosome assembly(GO:1903553) |
| 0.1 | 0.8 | GO:2001269 | positive regulation of cysteine-type endopeptidase activity involved in apoptotic signaling pathway(GO:2001269) |
| 0.1 | 0.6 | GO:0032780 | negative regulation of ATPase activity(GO:0032780) |
| 0.1 | 0.3 | GO:1901421 | positive regulation of response to alcohol(GO:1901421) |
| 0.1 | 0.4 | GO:1904338 | regulation of dopaminergic neuron differentiation(GO:1904338) |
| 0.1 | 0.6 | GO:0044376 | RNA polymerase II complex import to nucleus(GO:0044376) RNA polymerase III complex localization to nucleus(GO:1990022) |
| 0.1 | 0.1 | GO:0016479 | negative regulation of transcription from RNA polymerase I promoter(GO:0016479) |
| 0.1 | 1.2 | GO:0045792 | negative regulation of cell size(GO:0045792) |
| 0.1 | 0.5 | GO:1900107 | regulation of nodal signaling pathway(GO:1900107) |
| 0.1 | 0.5 | GO:0007113 | endomitotic cell cycle(GO:0007113) |
| 0.1 | 0.4 | GO:0006528 | asparagine metabolic process(GO:0006528) |
| 0.1 | 0.7 | GO:0035720 | intraciliary anterograde transport(GO:0035720) |
| 0.1 | 0.3 | GO:0051771 | negative regulation of nitric-oxide synthase biosynthetic process(GO:0051771) |
| 0.1 | 1.7 | GO:0031115 | negative regulation of microtubule polymerization(GO:0031115) |
| 0.1 | 1.4 | GO:0039694 | viral RNA genome replication(GO:0039694) RNA replication(GO:0039703) |
| 0.1 | 4.0 | GO:0032981 | NADH dehydrogenase complex assembly(GO:0010257) mitochondrial respiratory chain complex I assembly(GO:0032981) mitochondrial respiratory chain complex I biogenesis(GO:0097031) |
| 0.1 | 0.9 | GO:0034453 | microtubule anchoring(GO:0034453) |
| 0.1 | 0.3 | GO:0018171 | peptidyl-cysteine oxidation(GO:0018171) |
| 0.1 | 0.5 | GO:2001270 | regulation of cysteine-type endopeptidase activity involved in execution phase of apoptosis(GO:2001270) negative regulation of cysteine-type endopeptidase activity involved in execution phase of apoptosis(GO:2001271) |
| 0.1 | 0.4 | GO:1902513 | regulation of organelle transport along microtubule(GO:1902513) |
| 0.1 | 0.1 | GO:0090034 | regulation of chaperone-mediated protein complex assembly(GO:0090034) positive regulation of chaperone-mediated protein complex assembly(GO:0090035) |
| 0.1 | 0.4 | GO:0044028 | DNA hypomethylation(GO:0044028) hypomethylation of CpG island(GO:0044029) |
| 0.1 | 3.7 | GO:0046839 | phospholipid dephosphorylation(GO:0046839) phosphatidylinositol dephosphorylation(GO:0046856) |
| 0.1 | 1.0 | GO:0008347 | glial cell migration(GO:0008347) |
| 0.1 | 1.1 | GO:1901223 | negative regulation of NIK/NF-kappaB signaling(GO:1901223) |
| 0.1 | 0.1 | GO:0061158 | 3'-UTR-mediated mRNA destabilization(GO:0061158) |
| 0.1 | 0.4 | GO:2000651 | positive regulation of sodium ion transmembrane transporter activity(GO:2000651) |
| 0.1 | 0.5 | GO:0006547 | histidine metabolic process(GO:0006547) |
| 0.1 | 4.3 | GO:0043966 | histone H3 acetylation(GO:0043966) |
| 0.1 | 0.7 | GO:0060052 | neurofilament cytoskeleton organization(GO:0060052) |
| 0.1 | 0.4 | GO:1902277 | negative regulation of pancreatic amylase secretion(GO:1902277) |
| 0.1 | 0.9 | GO:0000012 | single strand break repair(GO:0000012) |
| 0.1 | 0.4 | GO:0002644 | negative regulation of tolerance induction(GO:0002644) |
| 0.1 | 0.5 | GO:0050862 | positive regulation of T cell receptor signaling pathway(GO:0050862) |
| 0.1 | 1.1 | GO:0071786 | endoplasmic reticulum tubular network organization(GO:0071786) |
| 0.1 | 0.7 | GO:1905050 | positive regulation of metallopeptidase activity(GO:1905050) |
| 0.1 | 0.6 | GO:1905150 | regulation of voltage-gated sodium channel activity(GO:1905150) |
| 0.1 | 0.4 | GO:0043984 | histone H4-K16 acetylation(GO:0043984) |
| 0.1 | 0.4 | GO:0008334 | histone mRNA metabolic process(GO:0008334) |
| 0.1 | 4.0 | GO:0050909 | sensory perception of taste(GO:0050909) |
| 0.1 | 0.3 | GO:2000561 | CD4-positive, alpha-beta T cell proliferation(GO:0035739) regulation of CD4-positive, alpha-beta T cell proliferation(GO:2000561) negative regulation of CD4-positive, alpha-beta T cell proliferation(GO:2000562) |
| 0.1 | 1.8 | GO:0015813 | L-glutamate transport(GO:0015813) |
| 0.1 | 0.9 | GO:0016926 | protein desumoylation(GO:0016926) |
| 0.1 | 0.5 | GO:0007016 | cytoskeletal anchoring at plasma membrane(GO:0007016) |
| 0.1 | 0.1 | GO:0051204 | protein insertion into mitochondrial membrane(GO:0051204) |
| 0.1 | 0.2 | GO:0042795 | snRNA transcription from RNA polymerase II promoter(GO:0042795) |
| 0.1 | 0.9 | GO:0048642 | negative regulation of skeletal muscle tissue development(GO:0048642) |
| 0.1 | 2.1 | GO:0061099 | negative regulation of protein tyrosine kinase activity(GO:0061099) |
| 0.1 | 4.4 | GO:0000245 | spliceosomal complex assembly(GO:0000245) |
| 0.1 | 4.3 | GO:0006779 | porphyrin-containing compound biosynthetic process(GO:0006779) |
| 0.1 | 0.4 | GO:1903027 | regulation of opsonization(GO:1903027) positive regulation of opsonization(GO:1903028) |
| 0.1 | 1.2 | GO:0060148 | positive regulation of posttranscriptional gene silencing(GO:0060148) |
| 0.1 | 0.3 | GO:0060157 | urinary bladder development(GO:0060157) |
| 0.1 | 0.4 | GO:0032506 | cytokinetic process(GO:0032506) |
| 0.1 | 1.3 | GO:0042534 | tumor necrosis factor biosynthetic process(GO:0042533) regulation of tumor necrosis factor biosynthetic process(GO:0042534) |
| 0.1 | 0.4 | GO:2000210 | positive regulation of anoikis(GO:2000210) |
| 0.1 | 0.5 | GO:0038032 | termination of G-protein coupled receptor signaling pathway(GO:0038032) |
| 0.1 | 0.6 | GO:0036066 | protein O-linked fucosylation(GO:0036066) |
| 0.1 | 0.6 | GO:0051901 | positive regulation of mitochondrial depolarization(GO:0051901) |
| 0.1 | 0.1 | GO:0002353 | plasma kallikrein-kinin cascade(GO:0002353) |
| 0.1 | 0.9 | GO:0006686 | sphingomyelin biosynthetic process(GO:0006686) |
| 0.1 | 0.3 | GO:0042346 | positive regulation of NF-kappaB import into nucleus(GO:0042346) |
| 0.1 | 0.4 | GO:0030091 | protein repair(GO:0030091) |
| 0.1 | 0.9 | GO:0033211 | adiponectin-activated signaling pathway(GO:0033211) |
| 0.1 | 0.6 | GO:0043320 | natural killer cell degranulation(GO:0043320) |
| 0.1 | 0.6 | GO:0001780 | neutrophil homeostasis(GO:0001780) |
| 0.1 | 2.2 | GO:0046854 | phosphatidylinositol phosphorylation(GO:0046854) |
| 0.1 | 0.1 | GO:0071474 | cellular hyperosmotic response(GO:0071474) |
| 0.1 | 0.5 | GO:1902031 | regulation of NADP metabolic process(GO:1902031) |
| 0.1 | 0.3 | GO:0072718 | response to cisplatin(GO:0072718) |
| 0.1 | 5.1 | GO:0008033 | tRNA processing(GO:0008033) |
| 0.1 | 0.3 | GO:0043691 | reverse cholesterol transport(GO:0043691) |
| 0.1 | 0.4 | GO:0030049 | muscle filament sliding(GO:0030049) |
| 0.1 | 2.0 | GO:0006515 | misfolded or incompletely synthesized protein catabolic process(GO:0006515) |
| 0.1 | 0.6 | GO:0015838 | amino-acid betaine transport(GO:0015838) |
| 0.1 | 0.2 | GO:0034372 | very-low-density lipoprotein particle remodeling(GO:0034372) |
| 0.1 | 0.2 | GO:0007182 | common-partner SMAD protein phosphorylation(GO:0007182) |
| 0.1 | 0.6 | GO:0036337 | Fas signaling pathway(GO:0036337) |
| 0.1 | 0.3 | GO:0006685 | sphingomyelin catabolic process(GO:0006685) |
| 0.1 | 1.0 | GO:0042168 | heme metabolic process(GO:0042168) |
| 0.1 | 1.0 | GO:0045723 | positive regulation of fatty acid biosynthetic process(GO:0045723) |
| 0.1 | 0.3 | GO:0043328 | protein targeting to vacuole involved in ubiquitin-dependent protein catabolic process via the multivesicular body sorting pathway(GO:0043328) |
| 0.1 | 1.8 | GO:0090022 | regulation of neutrophil chemotaxis(GO:0090022) |
| 0.1 | 0.3 | GO:0010636 | positive regulation of mitochondrial fusion(GO:0010636) |
| 0.1 | 1.2 | GO:0044342 | type B pancreatic cell proliferation(GO:0044342) |
| 0.1 | 0.2 | GO:0071681 | response to indole-3-methanol(GO:0071680) cellular response to indole-3-methanol(GO:0071681) |
| 0.1 | 0.2 | GO:0098935 | dendritic transport(GO:0098935) anterograde dendritic transport(GO:0098937) |
| 0.1 | 1.0 | GO:0097354 | protein prenylation(GO:0018342) prenylation(GO:0097354) |
| 0.1 | 0.1 | GO:0048385 | regulation of retinoic acid receptor signaling pathway(GO:0048385) |
| 0.1 | 0.4 | GO:0046339 | diacylglycerol metabolic process(GO:0046339) |
| 0.1 | 0.2 | GO:1900041 | negative regulation of interleukin-2 secretion(GO:1900041) |
| 0.1 | 1.3 | GO:0006099 | tricarboxylic acid cycle(GO:0006099) |
| 0.1 | 0.5 | GO:0006582 | melanin metabolic process(GO:0006582) |
| 0.1 | 1.3 | GO:0070816 | phosphorylation of RNA polymerase II C-terminal domain(GO:0070816) |
| 0.1 | 0.2 | GO:0044362 | modulation of molecular function in other organism(GO:0044359) negative regulation of molecular function in other organism(GO:0044362) negative regulation of molecular function in other organism involved in symbiotic interaction(GO:0052204) modulation of molecular function in other organism involved in symbiotic interaction(GO:0052205) negative regulation by host of symbiont molecular function(GO:0052405) modification by host of symbiont molecular function(GO:0052428) |
| 0.1 | 0.9 | GO:0043496 | regulation of protein homodimerization activity(GO:0043496) |
| 0.1 | 0.6 | GO:0010890 | positive regulation of sequestering of triglyceride(GO:0010890) |
| 0.1 | 0.1 | GO:2000812 | regulation of barbed-end actin filament capping(GO:2000812) |
| 0.1 | 1.1 | GO:0032355 | response to estradiol(GO:0032355) |
| 0.1 | 0.2 | GO:1901249 | regulation of lung goblet cell differentiation(GO:1901249) negative regulation of lung goblet cell differentiation(GO:1901250) |
| 0.1 | 0.2 | GO:0045650 | negative regulation of macrophage differentiation(GO:0045650) |
| 0.1 | 0.2 | GO:0098971 | anterograde dendritic transport of neurotransmitter receptor complex(GO:0098971) |
| 0.1 | 1.6 | GO:0035235 | ionotropic glutamate receptor signaling pathway(GO:0035235) |
| 0.1 | 0.2 | GO:0061043 | regulation of vascular wound healing(GO:0061043) |
| 0.1 | 0.7 | GO:0015721 | bile acid and bile salt transport(GO:0015721) |
| 0.1 | 0.6 | GO:0051574 | positive regulation of histone H3-K9 methylation(GO:0051574) |
| 0.1 | 0.3 | GO:0035826 | rubidium ion transport(GO:0035826) |
| 0.1 | 0.6 | GO:0090435 | protein localization to nuclear envelope(GO:0090435) |
| 0.1 | 0.1 | GO:0010536 | positive regulation of activation of Janus kinase activity(GO:0010536) |
| 0.1 | 0.3 | GO:0055012 | ventricular cardiac muscle cell differentiation(GO:0055012) |
| 0.1 | 0.2 | GO:0070245 | positive regulation of thymocyte apoptotic process(GO:0070245) |
| 0.1 | 0.9 | GO:2000480 | negative regulation of cAMP-dependent protein kinase activity(GO:2000480) |
| 0.1 | 2.0 | GO:0015985 | energy coupled proton transport, down electrochemical gradient(GO:0015985) ATP synthesis coupled proton transport(GO:0015986) |
| 0.1 | 0.3 | GO:0044597 | polyketide metabolic process(GO:0030638) aminoglycoside antibiotic metabolic process(GO:0030647) daunorubicin metabolic process(GO:0044597) doxorubicin metabolic process(GO:0044598) |
| 0.1 | 0.4 | GO:0001830 | trophectodermal cell fate commitment(GO:0001830) |
| 0.1 | 0.1 | GO:2000196 | positive regulation of female gonad development(GO:2000196) positive regulation of progesterone secretion(GO:2000872) |
| 0.1 | 0.1 | GO:0032289 | central nervous system myelin formation(GO:0032289) |
| 0.1 | 0.7 | GO:0042347 | negative regulation of NF-kappaB import into nucleus(GO:0042347) |
| 0.1 | 1.0 | GO:1900825 | regulation of membrane depolarization during cardiac muscle cell action potential(GO:1900825) |
| 0.1 | 0.2 | GO:0042450 | arginine biosynthetic process via ornithine(GO:0042450) |
| 0.1 | 0.3 | GO:0002318 | myeloid progenitor cell differentiation(GO:0002318) |
| 0.1 | 0.4 | GO:0014004 | microglia differentiation(GO:0014004) microglia development(GO:0014005) |
| 0.1 | 0.3 | GO:2000051 | negative regulation of non-canonical Wnt signaling pathway(GO:2000051) |
| 0.1 | 0.4 | GO:0038128 | ERBB2 signaling pathway(GO:0038128) |
| 0.1 | 3.2 | GO:0030032 | lamellipodium assembly(GO:0030032) |
| 0.1 | 0.1 | GO:1905206 | positive regulation of hydrogen peroxide-induced cell death(GO:1905206) |
| 0.1 | 0.5 | GO:0034315 | regulation of Arp2/3 complex-mediated actin nucleation(GO:0034315) |
| 0.1 | 0.5 | GO:0016266 | O-glycan processing(GO:0016266) |
| 0.1 | 0.4 | GO:0006122 | mitochondrial electron transport, ubiquinol to cytochrome c(GO:0006122) |
| 0.1 | 0.2 | GO:0030450 | regulation of complement activation, classical pathway(GO:0030450) |
| 0.1 | 0.8 | GO:0060216 | definitive hemopoiesis(GO:0060216) |
| 0.1 | 1.1 | GO:0048512 | circadian behavior(GO:0048512) |
| 0.1 | 0.3 | GO:0036151 | phosphatidylcholine acyl-chain remodeling(GO:0036151) |
| 0.1 | 0.3 | GO:0031293 | membrane protein intracellular domain proteolysis(GO:0031293) |
| 0.1 | 0.5 | GO:1904262 | negative regulation of TORC1 signaling(GO:1904262) |
| 0.1 | 0.1 | GO:0071431 | tRNA export from nucleus(GO:0006409) tRNA-containing ribonucleoprotein complex export from nucleus(GO:0071431) |
| 0.1 | 0.4 | GO:0060347 | heart trabecula formation(GO:0060347) |
| 0.1 | 0.6 | GO:0051457 | maintenance of protein location in nucleus(GO:0051457) |
| 0.1 | 0.1 | GO:0046087 | cytidine catabolic process(GO:0006216) cytidine deamination(GO:0009972) cytidine metabolic process(GO:0046087) |
| 0.1 | 0.1 | GO:2000790 | regulation of mesenchymal cell proliferation involved in lung development(GO:2000790) negative regulation of mesenchymal cell proliferation involved in lung development(GO:2000791) |
| 0.1 | 0.2 | GO:0008612 | peptidyl-lysine modification to peptidyl-hypusine(GO:0008612) |
| 0.1 | 0.5 | GO:0035437 | protein retention in ER lumen(GO:0006621) maintenance of protein localization in endoplasmic reticulum(GO:0035437) |
| 0.1 | 0.1 | GO:0072602 | interleukin-4 secretion(GO:0072602) |
| 0.1 | 1.0 | GO:1901099 | negative regulation of signal transduction in absence of ligand(GO:1901099) negative regulation of extrinsic apoptotic signaling pathway in absence of ligand(GO:2001240) |
| 0.1 | 0.2 | GO:0034379 | very-low-density lipoprotein particle assembly(GO:0034379) |
| 0.1 | 0.3 | GO:0097150 | neuronal stem cell population maintenance(GO:0097150) |
| 0.1 | 0.1 | GO:2000821 | regulation of grooming behavior(GO:2000821) |
| 0.1 | 0.2 | GO:0009396 | folic acid-containing compound biosynthetic process(GO:0009396) |
| 0.1 | 0.7 | GO:0045086 | positive regulation of interleukin-2 biosynthetic process(GO:0045086) |
| 0.1 | 0.1 | GO:0008355 | olfactory learning(GO:0008355) |
| 0.1 | 0.3 | GO:0001927 | exocyst assembly(GO:0001927) |
| 0.1 | 0.5 | GO:0033962 | cytoplasmic mRNA processing body assembly(GO:0033962) |
| 0.1 | 0.1 | GO:0000350 | generation of catalytic spliceosome for second transesterification step(GO:0000350) |
| 0.1 | 0.1 | GO:0010693 | negative regulation of alkaline phosphatase activity(GO:0010693) |
| 0.1 | 0.2 | GO:0051127 | positive regulation of actin nucleation(GO:0051127) |
| 0.1 | 0.1 | GO:0002431 | Fc receptor mediated stimulatory signaling pathway(GO:0002431) |
| 0.1 | 0.7 | GO:0061049 | physiological muscle hypertrophy(GO:0003298) physiological cardiac muscle hypertrophy(GO:0003301) cell growth involved in cardiac muscle cell development(GO:0061049) |
| 0.1 | 1.0 | GO:0008299 | isoprenoid biosynthetic process(GO:0008299) |
| 0.1 | 0.2 | GO:0031339 | negative regulation of vesicle fusion(GO:0031339) |
| 0.1 | 0.2 | GO:1905146 | lysosomal protein catabolic process(GO:1905146) |
| 0.1 | 0.9 | GO:0045071 | negative regulation of viral genome replication(GO:0045071) |
| 0.1 | 0.2 | GO:0036297 | interstrand cross-link repair(GO:0036297) |
| 0.1 | 0.5 | GO:0010762 | regulation of fibroblast migration(GO:0010762) |
| 0.1 | 0.9 | GO:0043046 | DNA methylation involved in gamete generation(GO:0043046) |
| 0.1 | 0.5 | GO:0021554 | optic nerve development(GO:0021554) |
| 0.1 | 0.1 | GO:0060051 | negative regulation of protein glycosylation(GO:0060051) |
| 0.1 | 0.8 | GO:0034629 | cellular protein complex localization(GO:0034629) |
| 0.1 | 0.4 | GO:0006735 | NADH regeneration(GO:0006735) canonical glycolysis(GO:0061621) glucose catabolic process to pyruvate(GO:0061718) |
| 0.1 | 0.4 | GO:0046852 | positive regulation of bone resorption(GO:0045780) positive regulation of bone remodeling(GO:0046852) |
| 0.1 | 0.2 | GO:0006116 | NADH oxidation(GO:0006116) |
| 0.1 | 0.7 | GO:0051084 | 'de novo' posttranslational protein folding(GO:0051084) |
| 0.1 | 0.1 | GO:1903998 | regulation of eating behavior(GO:1903998) |
| 0.1 | 1.3 | GO:0007212 | dopamine receptor signaling pathway(GO:0007212) |
| 0.1 | 1.5 | GO:0043252 | sodium-independent organic anion transport(GO:0043252) |
| 0.1 | 0.1 | GO:0035461 | vitamin transmembrane transport(GO:0035461) |
| 0.1 | 0.6 | GO:0019886 | antigen processing and presentation of exogenous peptide antigen via MHC class II(GO:0019886) |
| 0.1 | 0.5 | GO:1902083 | negative regulation of peptidyl-cysteine S-nitrosylation(GO:1902083) |
| 0.1 | 0.1 | GO:2000474 | regulation of opioid receptor signaling pathway(GO:2000474) |
| 0.1 | 0.4 | GO:2001273 | regulation of glucose import in response to insulin stimulus(GO:2001273) |
| 0.1 | 1.7 | GO:0016126 | sterol biosynthetic process(GO:0016126) |
| 0.1 | 0.5 | GO:0036309 | protein localization to M-band(GO:0036309) protein localization to T-tubule(GO:0036371) |
| 0.1 | 0.4 | GO:0050706 | regulation of interleukin-1 beta secretion(GO:0050706) |
| 0.1 | 0.5 | GO:0035855 | megakaryocyte development(GO:0035855) |
| 0.1 | 0.1 | GO:0032417 | positive regulation of sodium:proton antiporter activity(GO:0032417) |
| 0.1 | 1.2 | GO:0097320 | membrane tubulation(GO:0097320) |
| 0.1 | 3.4 | GO:0000086 | G2/M transition of mitotic cell cycle(GO:0000086) |
| 0.1 | 0.2 | GO:1902525 | regulation of protein monoubiquitination(GO:1902525) |
| 0.1 | 0.4 | GO:0002862 | negative regulation of inflammatory response to antigenic stimulus(GO:0002862) |
| 0.1 | 0.2 | GO:2000346 | negative regulation of hepatocyte proliferation(GO:2000346) |
| 0.1 | 0.8 | GO:0032801 | receptor catabolic process(GO:0032801) |
| 0.1 | 0.1 | GO:1990167 | protein K27-linked deubiquitination(GO:1990167) protein K33-linked deubiquitination(GO:1990168) |
| 0.1 | 0.4 | GO:0031047 | gene silencing by RNA(GO:0031047) |
| 0.1 | 0.7 | GO:0032958 | inositol phosphate biosynthetic process(GO:0032958) |
| 0.1 | 0.3 | GO:0001510 | RNA methylation(GO:0001510) |
| 0.0 | 0.2 | GO:0015705 | iodide transport(GO:0015705) |
| 0.0 | 0.3 | GO:0032048 | cardiolipin metabolic process(GO:0032048) |
| 0.0 | 0.7 | GO:0032784 | regulation of DNA-templated transcription, elongation(GO:0032784) |
| 0.0 | 2.2 | GO:0017148 | negative regulation of translation(GO:0017148) |
| 0.0 | 0.0 | GO:0036092 | phosphatidylinositol-3-phosphate biosynthetic process(GO:0036092) |
| 0.0 | 0.2 | GO:0001832 | blastocyst growth(GO:0001832) |
| 0.0 | 0.4 | GO:1902914 | regulation of protein polyubiquitination(GO:1902914) |
| 0.0 | 0.1 | GO:0051970 | negative regulation of transmission of nerve impulse(GO:0051970) |
| 0.0 | 0.0 | GO:0009838 | abscission(GO:0009838) |
| 0.0 | 0.2 | GO:0045078 | regulation of interferon-gamma biosynthetic process(GO:0045072) positive regulation of interferon-gamma biosynthetic process(GO:0045078) |
| 0.0 | 0.0 | GO:0031062 | positive regulation of histone methylation(GO:0031062) |
| 0.0 | 0.2 | GO:0097119 | postsynaptic density protein 95 clustering(GO:0097119) |
| 0.0 | 0.2 | GO:0051835 | positive regulation of synapse structural plasticity(GO:0051835) |
| 0.0 | 0.1 | GO:2001268 | negative regulation of cysteine-type endopeptidase activity involved in apoptotic signaling pathway(GO:2001268) |
| 0.0 | 0.5 | GO:0046716 | muscle cell cellular homeostasis(GO:0046716) |
| 0.0 | 0.3 | GO:0048251 | elastic fiber assembly(GO:0048251) |
| 0.0 | 0.7 | GO:0010842 | retina layer formation(GO:0010842) |
| 0.0 | 0.1 | GO:2000650 | negative regulation of sodium ion transmembrane transporter activity(GO:2000650) |
| 0.0 | 1.0 | GO:0032729 | positive regulation of interferon-gamma production(GO:0032729) |
| 0.0 | 0.0 | GO:0014721 | voluntary skeletal muscle contraction(GO:0003010) twitch skeletal muscle contraction(GO:0014721) fast-twitch skeletal muscle fiber contraction(GO:0031443) |
| 0.0 | 0.0 | GO:0060032 | notochord regression(GO:0060032) |
| 0.0 | 0.1 | GO:0032752 | interleukin-3 production(GO:0032632) regulation of interleukin-3 production(GO:0032672) positive regulation of interleukin-3 production(GO:0032752) interleukin-3 biosynthetic process(GO:0042223) regulation of interleukin-3 biosynthetic process(GO:0045399) positive regulation of interleukin-3 biosynthetic process(GO:0045401) positive regulation of granulocyte macrophage colony-stimulating factor biosynthetic process(GO:0045425) regulation of arachidonic acid secretion(GO:0090237) |
| 0.0 | 0.4 | GO:0050892 | intestinal absorption(GO:0050892) |
| 0.0 | 0.4 | GO:0035634 | response to stilbenoid(GO:0035634) |
| 0.0 | 0.6 | GO:0030513 | positive regulation of BMP signaling pathway(GO:0030513) |
| 0.0 | 0.3 | GO:0043649 | dicarboxylic acid catabolic process(GO:0043649) |
| 0.0 | 0.2 | GO:0097503 | sialylation(GO:0097503) |
| 0.0 | 0.1 | GO:0007198 | adenylate cyclase-inhibiting serotonin receptor signaling pathway(GO:0007198) |
| 0.0 | 0.9 | GO:0065002 | intracellular protein transmembrane transport(GO:0065002) protein transmembrane transport(GO:0071806) |
| 0.0 | 0.2 | GO:0007213 | G-protein coupled acetylcholine receptor signaling pathway(GO:0007213) |
| 0.0 | 3.4 | GO:0000375 | RNA splicing, via transesterification reactions(GO:0000375) |
| 0.0 | 0.1 | GO:2000794 | regulation of epithelial cell proliferation involved in lung morphogenesis(GO:2000794) |
| 0.0 | 0.1 | GO:0043276 | anoikis(GO:0043276) |
| 0.0 | 0.1 | GO:0060316 | positive regulation of ryanodine-sensitive calcium-release channel activity(GO:0060316) |
| 0.0 | 0.2 | GO:1990253 | cellular response to leucine starvation(GO:1990253) |
| 0.0 | 8.5 | GO:0016311 | dephosphorylation(GO:0016311) |
| 0.0 | 0.1 | GO:0042574 | retinal metabolic process(GO:0042574) |
| 0.0 | 0.1 | GO:0009146 | purine nucleoside triphosphate catabolic process(GO:0009146) |
| 0.0 | 0.4 | GO:1900383 | regulation of synaptic plasticity by receptor localization to synapse(GO:1900383) |
| 0.0 | 0.3 | GO:2000582 | positive regulation of microtubule motor activity(GO:2000576) regulation of ATP-dependent microtubule motor activity, plus-end-directed(GO:2000580) positive regulation of ATP-dependent microtubule motor activity, plus-end-directed(GO:2000582) |
| 0.0 | 0.5 | GO:0061003 | positive regulation of dendritic spine morphogenesis(GO:0061003) |
| 0.0 | 0.1 | GO:0030046 | parallel actin filament bundle assembly(GO:0030046) |
| 0.0 | 0.3 | GO:0046835 | carbohydrate phosphorylation(GO:0046835) |
| 0.0 | 0.0 | GO:0021544 | subpallium development(GO:0021544) |
| 0.0 | 0.4 | GO:0019373 | epoxygenase P450 pathway(GO:0019373) |
| 0.0 | 0.3 | GO:0042090 | interleukin-12 biosynthetic process(GO:0042090) regulation of interleukin-12 biosynthetic process(GO:0045075) |
| 0.0 | 0.3 | GO:0046519 | sphingoid metabolic process(GO:0046519) |
| 0.0 | 0.2 | GO:0070328 | acylglycerol homeostasis(GO:0055090) triglyceride homeostasis(GO:0070328) |
| 0.0 | 1.2 | GO:0018279 | peptidyl-asparagine modification(GO:0018196) protein N-linked glycosylation via asparagine(GO:0018279) |
| 0.0 | 0.1 | GO:0001788 | antibody-dependent cellular cytotoxicity(GO:0001788) |
| 0.0 | 0.3 | GO:0044380 | protein localization to cytoskeleton(GO:0044380) |
| 0.0 | 0.3 | GO:0006751 | glutathione catabolic process(GO:0006751) |
| 0.0 | 0.1 | GO:0034196 | acylglycerol transport(GO:0034196) triglyceride transport(GO:0034197) |
| 0.0 | 0.2 | GO:0009235 | cobalamin metabolic process(GO:0009235) |
| 0.0 | 0.4 | GO:0038063 | collagen-activated tyrosine kinase receptor signaling pathway(GO:0038063) |
| 0.0 | 0.2 | GO:0090141 | positive regulation of mitochondrial fission(GO:0090141) |
| 0.0 | 0.2 | GO:0015684 | ferrous iron transport(GO:0015684) |
| 0.0 | 0.1 | GO:0010133 | proline catabolic process(GO:0006562) proline catabolic process to glutamate(GO:0010133) |
| 0.0 | 0.2 | GO:0006968 | cellular defense response(GO:0006968) |
| 0.0 | 0.3 | GO:0035414 | negative regulation of catenin import into nucleus(GO:0035414) |
| 0.0 | 0.1 | GO:0014823 | response to activity(GO:0014823) |
| 0.0 | 0.1 | GO:0070886 | positive regulation of calcineurin-NFAT signaling cascade(GO:0070886) |
| 0.0 | 0.1 | GO:0016240 | autophagosome docking(GO:0016240) |
| 0.0 | 2.1 | GO:0008380 | RNA splicing(GO:0008380) |
| 0.0 | 0.2 | GO:0031424 | keratinization(GO:0031424) |
| 0.0 | 0.1 | GO:0044030 | regulation of DNA methylation(GO:0044030) |
| 0.0 | 0.1 | GO:0014742 | positive regulation of cardiac muscle hypertrophy(GO:0010613) positive regulation of muscle hypertrophy(GO:0014742) |
| 0.0 | 0.0 | GO:2000394 | positive regulation of lamellipodium morphogenesis(GO:2000394) |
| 0.0 | 0.9 | GO:0008637 | apoptotic mitochondrial changes(GO:0008637) |
| 0.0 | 0.1 | GO:0032836 | glomerular basement membrane development(GO:0032836) |
| 0.0 | 0.3 | GO:0043171 | peptide catabolic process(GO:0043171) |
| 0.0 | 0.3 | GO:0001662 | behavioral fear response(GO:0001662) |
| 0.0 | 0.4 | GO:0045682 | regulation of epidermis development(GO:0045682) |
| 0.0 | 0.0 | GO:0090148 | membrane fission(GO:0090148) |
| 0.0 | 0.3 | GO:0040015 | negative regulation of multicellular organism growth(GO:0040015) |
| 0.0 | 0.0 | GO:0010992 | ubiquitin homeostasis(GO:0010992) |
| 0.0 | 0.1 | GO:0072677 | eosinophil migration(GO:0072677) |
| 0.0 | 0.0 | GO:0030579 | ubiquitin-dependent SMAD protein catabolic process(GO:0030579) |
| 0.0 | 0.2 | GO:0045010 | actin nucleation(GO:0045010) |
| 0.0 | 0.1 | GO:0002523 | leukocyte migration involved in inflammatory response(GO:0002523) |
| 0.0 | 0.0 | GO:0071548 | response to dexamethasone(GO:0071548) |
| 0.0 | 0.0 | GO:0038180 | nerve growth factor signaling pathway(GO:0038180) |
Gene overrepresentation in cellular component category:
| Log-likelihood per target | Total log-likelihood | Term | Description |
|---|---|---|---|
| 6.3 | 19.0 | GO:0097135 | cyclin E2-CDK2 complex(GO:0097135) |
| 3.7 | 11.1 | GO:0033186 | CAF-1 complex(GO:0033186) |
| 3.7 | 29.4 | GO:0035985 | senescence-associated heterochromatin focus(GO:0035985) |
| 3.0 | 15.2 | GO:0097149 | centralspindlin complex(GO:0097149) |
| 3.0 | 14.9 | GO:0008622 | epsilon DNA polymerase complex(GO:0008622) |
| 2.9 | 11.7 | GO:0099569 | presynaptic cytoskeleton(GO:0099569) |
| 2.9 | 14.6 | GO:0097226 | sperm mitochondrial sheath(GO:0097226) |
| 2.7 | 27.4 | GO:0000796 | condensin complex(GO:0000796) |
| 2.7 | 18.7 | GO:0001740 | Barr body(GO:0001740) |
| 2.6 | 10.3 | GO:0000942 | condensed nuclear chromosome outer kinetochore(GO:0000942) |
| 2.4 | 7.1 | GO:0042642 | actomyosin, myosin complex part(GO:0042642) |
| 2.3 | 4.6 | GO:0044317 | rod spherule(GO:0044317) |
| 2.2 | 13.4 | GO:0000235 | astral microtubule(GO:0000235) |
| 2.2 | 19.8 | GO:0031390 | Ctf18 RFC-like complex(GO:0031390) |
| 2.2 | 6.5 | GO:0071920 | cleavage body(GO:0071920) |
| 2.1 | 6.4 | GO:1990423 | RZZ complex(GO:1990423) |
| 2.0 | 30.7 | GO:0042555 | MCM complex(GO:0042555) |
| 2.0 | 10.1 | GO:0031021 | interphase microtubule organizing center(GO:0031021) |
| 2.0 | 9.9 | GO:0031262 | Ndc80 complex(GO:0031262) |
| 2.0 | 13.9 | GO:0071204 | histone pre-mRNA 3'end processing complex(GO:0071204) |
| 1.9 | 9.6 | GO:0044611 | nuclear pore inner ring(GO:0044611) |
| 1.8 | 20.0 | GO:0005642 | annulate lamellae(GO:0005642) |
| 1.8 | 5.4 | GO:0042720 | mitochondrial inner membrane peptidase complex(GO:0042720) |
| 1.7 | 6.8 | GO:0036449 | microtubule minus-end(GO:0036449) |
| 1.6 | 8.2 | GO:0031523 | Myb complex(GO:0031523) |
| 1.6 | 6.4 | GO:0097058 | CRLF-CLCF1 complex(GO:0097058) |
| 1.5 | 6.0 | GO:0070937 | CRD-mediated mRNA stability complex(GO:0070937) |
| 1.5 | 25.2 | GO:0070938 | contractile ring(GO:0070938) |
| 1.5 | 1.5 | GO:0070032 | synaptobrevin 2-SNAP-25-syntaxin-1a-complexin I complex(GO:0070032) |
| 1.5 | 8.8 | GO:0044094 | host cell nucleus(GO:0042025) host cell nuclear part(GO:0044094) |
| 1.5 | 2.9 | GO:1990023 | mitotic spindle midzone(GO:1990023) |
| 1.4 | 4.3 | GO:0005967 | mitochondrial pyruvate dehydrogenase complex(GO:0005967) |
| 1.4 | 11.5 | GO:0001940 | male pronucleus(GO:0001940) |
| 1.4 | 8.5 | GO:0016035 | zeta DNA polymerase complex(GO:0016035) |
| 1.4 | 15.5 | GO:0070761 | pre-snoRNP complex(GO:0070761) |
| 1.4 | 8.2 | GO:0098536 | deuterosome(GO:0098536) |
| 1.4 | 6.8 | GO:0005658 | alpha DNA polymerase:primase complex(GO:0005658) |
| 1.3 | 12.0 | GO:0008278 | cohesin complex(GO:0008278) |
| 1.3 | 10.6 | GO:0070652 | HAUS complex(GO:0070652) |
| 1.3 | 5.2 | GO:0090537 | CERF complex(GO:0090537) |
| 1.3 | 3.9 | GO:0017109 | glutamate-cysteine ligase complex(GO:0017109) |
| 1.3 | 16.6 | GO:0031209 | SCAR complex(GO:0031209) |
| 1.3 | 10.1 | GO:0016281 | eukaryotic translation initiation factor 4F complex(GO:0016281) |
| 1.2 | 3.6 | GO:0098833 | presynaptic endocytic zone(GO:0098833) presynaptic endocytic zone membrane(GO:0098835) |
| 1.2 | 7.1 | GO:0005955 | calcineurin complex(GO:0005955) |
| 1.2 | 1.2 | GO:0097418 | neurofibrillary tangle(GO:0097418) |
| 1.2 | 4.6 | GO:0005606 | laminin-1 complex(GO:0005606) |
| 1.1 | 10.3 | GO:0000940 | condensed chromosome outer kinetochore(GO:0000940) |
| 1.1 | 3.4 | GO:0097059 | CNTFR-CLCF1 complex(GO:0097059) |
| 1.1 | 4.5 | GO:0097129 | cyclin D2-CDK4 complex(GO:0097129) |
| 1.1 | 4.5 | GO:0043564 | Ku70:Ku80 complex(GO:0043564) |
| 1.1 | 4.5 | GO:0008623 | CHRAC(GO:0008623) |
| 1.1 | 10.8 | GO:0044327 | dendritic spine head(GO:0044327) |
| 1.0 | 12.4 | GO:1990635 | proximal dendrite(GO:1990635) |
| 1.0 | 7.1 | GO:0005664 | origin recognition complex(GO:0000808) nuclear origin of replication recognition complex(GO:0005664) |
| 1.0 | 5.9 | GO:0000444 | MIS12/MIND type complex(GO:0000444) |
| 1.0 | 1.0 | GO:0000811 | GINS complex(GO:0000811) |
| 1.0 | 5.8 | GO:0032299 | ribonuclease H2 complex(GO:0032299) |
| 1.0 | 4.8 | GO:0034715 | pICln-Sm protein complex(GO:0034715) |
| 1.0 | 1.9 | GO:0033061 | DNA recombinase mediator complex(GO:0033061) |
| 0.9 | 4.7 | GO:0097513 | myosin II filament(GO:0097513) |
| 0.9 | 6.5 | GO:0072588 | box H/ACA snoRNP complex(GO:0031429) box H/ACA RNP complex(GO:0072588) |
| 0.9 | 6.5 | GO:0030915 | Smc5-Smc6 complex(GO:0030915) |
| 0.9 | 6.5 | GO:0005638 | lamin filament(GO:0005638) |
| 0.9 | 7.4 | GO:0031415 | NatA complex(GO:0031415) |
| 0.9 | 10.1 | GO:0044294 | dendritic growth cone(GO:0044294) |
| 0.9 | 10.0 | GO:0000176 | nuclear exosome (RNase complex)(GO:0000176) |
| 0.9 | 9.0 | GO:0016589 | NURF complex(GO:0016589) |
| 0.9 | 3.6 | GO:0097255 | R2TP complex(GO:0097255) |
| 0.9 | 0.9 | GO:0035101 | FACT complex(GO:0035101) |
| 0.9 | 4.4 | GO:0044666 | MLL3/4 complex(GO:0044666) |
| 0.9 | 6.0 | GO:0033588 | Elongator holoenzyme complex(GO:0033588) |
| 0.9 | 1.7 | GO:0098842 | postsynaptic early endosome(GO:0098842) |
| 0.9 | 6.0 | GO:0005652 | nuclear lamina(GO:0005652) |
| 0.9 | 3.4 | GO:1990421 | subtelomeric heterochromatin(GO:1990421) nuclear subtelomeric heterochromatin(GO:1990707) |
| 0.9 | 13.6 | GO:0035327 | transcriptionally active chromatin(GO:0035327) |
| 0.8 | 12.7 | GO:0010369 | chromocenter(GO:0010369) |
| 0.8 | 10.2 | GO:0005845 | mRNA cap binding complex(GO:0005845) RNA cap binding complex(GO:0034518) |
| 0.8 | 4.2 | GO:0035189 | Rb-E2F complex(GO:0035189) |
| 0.8 | 12.7 | GO:0045120 | pronucleus(GO:0045120) |
| 0.8 | 6.8 | GO:0061689 | tricellular tight junction(GO:0061689) |
| 0.8 | 3.3 | GO:0044307 | dendritic branch(GO:0044307) |
| 0.8 | 5.8 | GO:0005687 | U4 snRNP(GO:0005687) |
| 0.8 | 4.1 | GO:0033553 | rDNA heterochromatin(GO:0033553) |
| 0.8 | 4.9 | GO:0070531 | BRCA1-A complex(GO:0070531) |
| 0.8 | 10.5 | GO:0048188 | Set1C/COMPASS complex(GO:0048188) |
| 0.8 | 2.4 | GO:0070557 | PCNA-p21 complex(GO:0070557) |
| 0.8 | 11.2 | GO:0031464 | Cul4A-RING E3 ubiquitin ligase complex(GO:0031464) |
| 0.8 | 0.8 | GO:0000153 | cytoplasmic ubiquitin ligase complex(GO:0000153) |
| 0.8 | 7.9 | GO:0005883 | neurofilament(GO:0005883) |
| 0.8 | 2.3 | GO:0042575 | DNA polymerase complex(GO:0042575) |
| 0.8 | 2.3 | GO:0000778 | condensed nuclear chromosome kinetochore(GO:0000778) |
| 0.8 | 1.5 | GO:0031414 | N-terminal protein acetyltransferase complex(GO:0031414) |
| 0.8 | 1.5 | GO:0005663 | DNA replication factor C complex(GO:0005663) |
| 0.7 | 12.7 | GO:0097470 | ribbon synapse(GO:0097470) |
| 0.7 | 3.0 | GO:0001651 | dense fibrillar component(GO:0001651) |
| 0.7 | 1.5 | GO:0005656 | nuclear pre-replicative complex(GO:0005656) pre-replicative complex(GO:0036387) |
| 0.7 | 14.0 | GO:0071564 | npBAF complex(GO:0071564) |
| 0.7 | 4.4 | GO:0005853 | eukaryotic translation elongation factor 1 complex(GO:0005853) |
| 0.7 | 6.6 | GO:0000015 | phosphopyruvate hydratase complex(GO:0000015) |
| 0.7 | 14.6 | GO:0005680 | anaphase-promoting complex(GO:0005680) |
| 0.7 | 2.2 | GO:0030981 | cortical microtubule cytoskeleton(GO:0030981) |
| 0.7 | 12.3 | GO:0090544 | BAF-type complex(GO:0090544) |
| 0.7 | 24.4 | GO:0005763 | organellar small ribosomal subunit(GO:0000314) mitochondrial small ribosomal subunit(GO:0005763) |
| 0.7 | 12.9 | GO:0031616 | spindle pole centrosome(GO:0031616) |
| 0.7 | 4.2 | GO:1990726 | Lsm1-7-Pat1 complex(GO:1990726) |
| 0.7 | 7.0 | GO:0042587 | glycogen granule(GO:0042587) |
| 0.7 | 27.0 | GO:0005876 | spindle microtubule(GO:0005876) |
| 0.7 | 4.8 | GO:0017071 | intracellular cyclic nucleotide activated cation channel complex(GO:0017071) |
| 0.7 | 19.8 | GO:0043596 | nuclear replication fork(GO:0043596) |
| 0.7 | 1.4 | GO:0031510 | SUMO activating enzyme complex(GO:0031510) |
| 0.7 | 5.3 | GO:0019907 | cyclin-dependent protein kinase activating kinase holoenzyme complex(GO:0019907) |
| 0.7 | 3.3 | GO:0072687 | meiotic spindle(GO:0072687) |
| 0.7 | 8.6 | GO:0035631 | CD40 receptor complex(GO:0035631) |
| 0.7 | 2.0 | GO:0034457 | Mpp10 complex(GO:0034457) |
| 0.7 | 6.6 | GO:0031080 | nuclear pore outer ring(GO:0031080) |
| 0.7 | 2.6 | GO:0043511 | inhibin complex(GO:0043511) |
| 0.7 | 13.1 | GO:1902711 | GABA-A receptor complex(GO:1902711) |
| 0.6 | 3.2 | GO:1990761 | growth cone lamellipodium(GO:1990761) |
| 0.6 | 17.4 | GO:0005657 | replication fork(GO:0005657) |
| 0.6 | 2.6 | GO:0043293 | apoptosome(GO:0043293) |
| 0.6 | 10.2 | GO:0005736 | DNA-directed RNA polymerase I complex(GO:0005736) |
| 0.6 | 3.2 | GO:0005971 | ribonucleoside-diphosphate reductase complex(GO:0005971) |
| 0.6 | 3.8 | GO:0097452 | GAIT complex(GO:0097452) |
| 0.6 | 7.6 | GO:0017146 | NMDA selective glutamate receptor complex(GO:0017146) |
| 0.6 | 12.0 | GO:0030014 | CCR4-NOT complex(GO:0030014) |
| 0.6 | 11.9 | GO:0035098 | ESC/E(Z) complex(GO:0035098) |
| 0.6 | 1.9 | GO:0034098 | VCP-NPL4-UFD1 AAA ATPase complex(GO:0034098) |
| 0.6 | 22.7 | GO:0097440 | apical dendrite(GO:0097440) |
| 0.6 | 5.5 | GO:0061617 | MICOS complex(GO:0061617) |
| 0.6 | 6.1 | GO:0031595 | nuclear proteasome complex(GO:0031595) |
| 0.6 | 1.8 | GO:0000777 | condensed chromosome kinetochore(GO:0000777) |
| 0.6 | 1.8 | GO:0005588 | collagen type V trimer(GO:0005588) |
| 0.6 | 9.0 | GO:0008385 | IkappaB kinase complex(GO:0008385) |
| 0.6 | 2.4 | GO:0098559 | cytoplasmic side of early endosome membrane(GO:0098559) |
| 0.6 | 10.1 | GO:0000159 | protein phosphatase type 2A complex(GO:0000159) |
| 0.6 | 1.8 | GO:0014802 | terminal cisterna(GO:0014802) |
| 0.6 | 5.3 | GO:0089701 | U2AF(GO:0089701) |
| 0.6 | 9.6 | GO:0060077 | inhibitory synapse(GO:0060077) |
| 0.6 | 1.7 | GO:0005673 | transcription factor TFIIE complex(GO:0005673) |
| 0.6 | 5.6 | GO:0045298 | tubulin complex(GO:0045298) |
| 0.5 | 3.3 | GO:0000172 | ribonuclease MRP complex(GO:0000172) |
| 0.5 | 1.6 | GO:0005655 | nucleolar ribonuclease P complex(GO:0005655) |
| 0.5 | 1.6 | GO:0031251 | PAN complex(GO:0031251) |
| 0.5 | 4.3 | GO:0042382 | paraspeckles(GO:0042382) |
| 0.5 | 8.1 | GO:0016580 | Sin3 complex(GO:0016580) |
| 0.5 | 2.7 | GO:0030062 | mitochondrial tricarboxylic acid cycle enzyme complex(GO:0030062) |
| 0.5 | 3.7 | GO:0000243 | commitment complex(GO:0000243) |
| 0.5 | 2.1 | GO:0000125 | PCAF complex(GO:0000125) |
| 0.5 | 6.8 | GO:0097539 | ciliary transition fiber(GO:0097539) |
| 0.5 | 3.1 | GO:1990356 | sumoylated E2 ligase complex(GO:1990356) |
| 0.5 | 15.1 | GO:1990752 | microtubule end(GO:1990752) |
| 0.5 | 2.6 | GO:0030689 | Noc complex(GO:0030689) |
| 0.5 | 3.6 | GO:0000801 | central element(GO:0000801) |
| 0.5 | 2.6 | GO:0072487 | MSL complex(GO:0072487) |
| 0.5 | 2.0 | GO:0030289 | protein phosphatase 4 complex(GO:0030289) |
| 0.5 | 6.6 | GO:0001673 | male germ cell nucleus(GO:0001673) |
| 0.5 | 24.4 | GO:0022627 | cytosolic small ribosomal subunit(GO:0022627) |
| 0.5 | 30.6 | GO:0005643 | nuclear pore(GO:0005643) |
| 0.5 | 4.3 | GO:0019773 | proteasome core complex, alpha-subunit complex(GO:0019773) |
| 0.5 | 27.8 | GO:0005844 | polysome(GO:0005844) |
| 0.5 | 1.4 | GO:0070877 | microprocessor complex(GO:0070877) ribonuclease III complex(GO:1903095) |
| 0.5 | 5.2 | GO:0031011 | Ino80 complex(GO:0031011) |
| 0.5 | 1.4 | GO:0018444 | translation release factor complex(GO:0018444) |
| 0.5 | 6.0 | GO:0005862 | muscle thin filament tropomyosin(GO:0005862) |
| 0.5 | 2.3 | GO:0008091 | spectrin(GO:0008091) |
| 0.5 | 2.8 | GO:0034388 | Pwp2p-containing subcomplex of 90S preribosome(GO:0034388) |
| 0.5 | 8.3 | GO:0031045 | dense core granule(GO:0031045) |
| 0.5 | 0.9 | GO:0005688 | U6 snRNP(GO:0005688) |
| 0.5 | 9.7 | GO:0044300 | cerebellar mossy fiber(GO:0044300) |
| 0.5 | 5.5 | GO:0090543 | Flemming body(GO:0090543) |
| 0.5 | 1.4 | GO:0048269 | methionine adenosyltransferase complex(GO:0048269) |
| 0.4 | 3.6 | GO:0090571 | RNA polymerase II transcription repressor complex(GO:0090571) |
| 0.4 | 5.8 | GO:0005666 | DNA-directed RNA polymerase III complex(GO:0005666) |
| 0.4 | 1.3 | GO:0032591 | dendritic spine membrane(GO:0032591) |
| 0.4 | 16.6 | GO:0000307 | cyclin-dependent protein kinase holoenzyme complex(GO:0000307) |
| 0.4 | 58.4 | GO:0001650 | fibrillar center(GO:0001650) |
| 0.4 | 4.3 | GO:0000347 | THO complex(GO:0000347) THO complex part of transcription export complex(GO:0000445) |
| 0.4 | 1.7 | GO:0042719 | mitochondrial intermembrane space protein transporter complex(GO:0042719) |
| 0.4 | 3.4 | GO:0005744 | mitochondrial inner membrane presequence translocase complex(GO:0005744) |
| 0.4 | 1.7 | GO:1990584 | cardiac Troponin complex(GO:1990584) |
| 0.4 | 27.4 | GO:0022625 | cytosolic large ribosomal subunit(GO:0022625) |
| 0.4 | 1.7 | GO:0000221 | vacuolar proton-transporting V-type ATPase, V1 domain(GO:0000221) |
| 0.4 | 6.5 | GO:0031932 | TORC2 complex(GO:0031932) |
| 0.4 | 16.6 | GO:0002102 | podosome(GO:0002102) |
| 0.4 | 0.4 | GO:0035061 | interchromatin granule(GO:0035061) |
| 0.4 | 4.0 | GO:0005750 | mitochondrial respiratory chain complex III(GO:0005750) |
| 0.4 | 5.6 | GO:0031235 | intrinsic component of the cytoplasmic side of the plasma membrane(GO:0031235) |
| 0.4 | 2.4 | GO:0016461 | unconventional myosin complex(GO:0016461) |
| 0.4 | 0.4 | GO:0033648 | host intracellular organelle(GO:0033647) host intracellular membrane-bounded organelle(GO:0033648) |
| 0.4 | 28.6 | GO:0031463 | Cul3-RING ubiquitin ligase complex(GO:0031463) |
| 0.4 | 2.3 | GO:0005956 | protein kinase CK2 complex(GO:0005956) |
| 0.4 | 1.6 | GO:0043541 | UDP-N-acetylglucosamine transferase complex(GO:0043541) |
| 0.4 | 3.4 | GO:0071541 | eukaryotic translation initiation factor 3 complex, eIF3m(GO:0071541) |
| 0.4 | 1.1 | GO:0008274 | gamma-tubulin large complex(GO:0000931) gamma-tubulin ring complex(GO:0008274) |
| 0.4 | 17.8 | GO:0042645 | nucleoid(GO:0009295) mitochondrial nucleoid(GO:0042645) |
| 0.4 | 0.4 | GO:0034274 | Atg12-Atg5-Atg16 complex(GO:0034274) |
| 0.4 | 2.6 | GO:0097431 | mitotic spindle pole(GO:0097431) |
| 0.4 | 1.9 | GO:0045254 | pyruvate dehydrogenase complex(GO:0045254) |
| 0.4 | 11.4 | GO:0043194 | axon initial segment(GO:0043194) |
| 0.4 | 1.8 | GO:0097524 | sperm plasma membrane(GO:0097524) |
| 0.4 | 2.2 | GO:0032300 | mismatch repair complex(GO:0032300) |
| 0.4 | 3.6 | GO:0005915 | zonula adherens(GO:0005915) |
| 0.4 | 14.4 | GO:0032154 | cleavage furrow(GO:0032154) cell surface furrow(GO:0097610) |
| 0.4 | 1.4 | GO:0070578 | RISC-loading complex(GO:0070578) |
| 0.3 | 3.5 | GO:0044233 | ER-mitochondrion membrane contact site(GO:0044233) |
| 0.3 | 39.3 | GO:0000775 | chromosome, centromeric region(GO:0000775) |
| 0.3 | 4.0 | GO:0005685 | U1 snRNP(GO:0005685) |
| 0.3 | 4.0 | GO:0046581 | intercellular canaliculus(GO:0046581) |
| 0.3 | 2.3 | GO:0030314 | junctional membrane complex(GO:0030314) |
| 0.3 | 6.8 | GO:0032279 | asymmetric synapse(GO:0032279) |
| 0.3 | 1.3 | GO:0016602 | CCAAT-binding factor complex(GO:0016602) |
| 0.3 | 2.9 | GO:0045180 | basal cortex(GO:0045180) |
| 0.3 | 2.2 | GO:0034992 | microtubule organizing center attachment site(GO:0034992) LINC complex(GO:0034993) |
| 0.3 | 3.5 | GO:0030669 | clathrin coat of endocytic vesicle(GO:0030128) clathrin-coated endocytic vesicle membrane(GO:0030669) |
| 0.3 | 6.0 | GO:0000800 | lateral element(GO:0000800) |
| 0.3 | 1.9 | GO:0098845 | postsynaptic endosome(GO:0098845) |
| 0.3 | 2.8 | GO:0030877 | beta-catenin destruction complex(GO:0030877) |
| 0.3 | 22.5 | GO:0017053 | transcriptional repressor complex(GO:0017053) |
| 0.3 | 1.5 | GO:0071547 | piP-body(GO:0071547) |
| 0.3 | 4.0 | GO:0044665 | MLL1/2 complex(GO:0044665) MLL1 complex(GO:0071339) |
| 0.3 | 0.9 | GO:0030870 | Mre11 complex(GO:0030870) |
| 0.3 | 3.3 | GO:0043240 | Fanconi anaemia nuclear complex(GO:0043240) |
| 0.3 | 15.8 | GO:0000315 | organellar large ribosomal subunit(GO:0000315) mitochondrial large ribosomal subunit(GO:0005762) |
| 0.3 | 19.3 | GO:0016605 | PML body(GO:0016605) |
| 0.3 | 4.2 | GO:0005832 | chaperonin-containing T-complex(GO:0005832) |
| 0.3 | 4.7 | GO:0030687 | preribosome, large subunit precursor(GO:0030687) |
| 0.3 | 0.9 | GO:0034750 | Scrib-APC-beta-catenin complex(GO:0034750) |
| 0.3 | 0.3 | GO:0044308 | axonal spine(GO:0044308) |
| 0.3 | 2.3 | GO:0008541 | proteasome regulatory particle, lid subcomplex(GO:0008541) |
| 0.3 | 1.4 | GO:0070776 | H3 histone acetyltransferase complex(GO:0070775) MOZ/MORF histone acetyltransferase complex(GO:0070776) |
| 0.3 | 1.1 | GO:0030906 | retromer, cargo-selective complex(GO:0030906) |
| 0.3 | 31.9 | GO:0005759 | mitochondrial matrix(GO:0005759) |
| 0.3 | 0.9 | GO:1990682 | CSF1-CSF1R complex(GO:1990682) |
| 0.3 | 4.8 | GO:0005751 | mitochondrial respiratory chain complex IV(GO:0005751) |
| 0.3 | 4.2 | GO:0005640 | nuclear outer membrane(GO:0005640) |
| 0.3 | 1.1 | GO:0030891 | VCB complex(GO:0030891) |
| 0.3 | 0.6 | GO:0034684 | integrin alphav-beta5 complex(GO:0034684) |
| 0.3 | 0.3 | GO:0099522 | region of cytosol(GO:0099522) postsynaptic cytosol(GO:0099524) |
| 0.3 | 1.7 | GO:0000214 | tRNA-intron endonuclease complex(GO:0000214) |
| 0.3 | 4.5 | GO:1902562 | NuA4 histone acetyltransferase complex(GO:0035267) H4/H2A histone acetyltransferase complex(GO:0043189) H4 histone acetyltransferase complex(GO:1902562) |
| 0.3 | 0.8 | GO:0071595 | Nem1-Spo7 phosphatase complex(GO:0071595) |
| 0.3 | 1.7 | GO:0001741 | XY body(GO:0001741) |
| 0.3 | 1.4 | GO:0032983 | kainate selective glutamate receptor complex(GO:0032983) |
| 0.3 | 1.1 | GO:0060187 | cell pole(GO:0060187) |
| 0.3 | 5.4 | GO:0030686 | 90S preribosome(GO:0030686) |
| 0.3 | 1.1 | GO:0098576 | integral component of cytoplasmic side of endoplasmic reticulum membrane(GO:0071458) integral component of lumenal side of endoplasmic reticulum membrane(GO:0071556) lumenal side of endoplasmic reticulum membrane(GO:0098553) lumenal side of membrane(GO:0098576) |
| 0.3 | 3.5 | GO:0005697 | telomerase holoenzyme complex(GO:0005697) |
| 0.3 | 1.9 | GO:0005850 | eukaryotic translation initiation factor 2 complex(GO:0005850) |
| 0.3 | 0.3 | GO:0000974 | Prp19 complex(GO:0000974) |
| 0.3 | 0.5 | GO:0005869 | dynactin complex(GO:0005869) |
| 0.3 | 1.3 | GO:0005968 | Rab-protein geranylgeranyltransferase complex(GO:0005968) |
| 0.3 | 3.1 | GO:0070852 | cell body fiber(GO:0070852) |
| 0.3 | 3.1 | GO:0005689 | U12-type spliceosomal complex(GO:0005689) |
| 0.3 | 0.5 | GO:0002193 | MAML1-RBP-Jkappa- ICN1 complex(GO:0002193) |
| 0.3 | 9.5 | GO:0044298 | cell body membrane(GO:0044298) |
| 0.3 | 3.6 | GO:0071011 | precatalytic spliceosome(GO:0071011) |
| 0.3 | 1.3 | GO:0061574 | ASAP complex(GO:0061574) |
| 0.3 | 1.0 | GO:0005852 | eukaryotic translation initiation factor 3 complex(GO:0005852) |
| 0.3 | 0.5 | GO:0031074 | nucleocytoplasmic shuttling complex(GO:0031074) |
| 0.3 | 2.0 | GO:0035861 | site of double-strand break(GO:0035861) |
| 0.2 | 1.0 | GO:0008537 | proteasome activator complex(GO:0008537) |
| 0.2 | 1.5 | GO:0070847 | core mediator complex(GO:0070847) |
| 0.2 | 3.6 | GO:0032580 | Golgi cisterna membrane(GO:0032580) |
| 0.2 | 2.2 | GO:0016272 | prefoldin complex(GO:0016272) |
| 0.2 | 1.0 | GO:0071942 | XPC complex(GO:0071942) |
| 0.2 | 1.0 | GO:0035032 | phosphatidylinositol 3-kinase complex, class III(GO:0035032) |
| 0.2 | 1.2 | GO:0005851 | eukaryotic translation initiation factor 2B complex(GO:0005851) |
| 0.2 | 1.4 | GO:0097442 | CA3 pyramidal cell dendrite(GO:0097442) |
| 0.2 | 19.3 | GO:0071013 | catalytic step 2 spliceosome(GO:0071013) |
| 0.2 | 17.3 | GO:0000932 | cytoplasmic mRNA processing body(GO:0000932) |
| 0.2 | 3.0 | GO:0017101 | aminoacyl-tRNA synthetase multienzyme complex(GO:0017101) |
| 0.2 | 0.7 | GO:0005749 | mitochondrial respiratory chain complex II, succinate dehydrogenase complex (ubiquinone)(GO:0005749) succinate dehydrogenase complex (ubiquinone)(GO:0045257) respiratory chain complex II(GO:0045273) succinate dehydrogenase complex(GO:0045281) fumarate reductase complex(GO:0045283) |
| 0.2 | 0.9 | GO:0042405 | nuclear inclusion body(GO:0042405) |
| 0.2 | 3.1 | GO:0031083 | BLOC-1 complex(GO:0031083) |
| 0.2 | 1.3 | GO:0030670 | phagocytic vesicle membrane(GO:0030670) |
| 0.2 | 0.9 | GO:0005745 | m-AAA complex(GO:0005745) |
| 0.2 | 1.1 | GO:0005672 | transcription factor TFIIA complex(GO:0005672) |
| 0.2 | 5.4 | GO:0034451 | centriolar satellite(GO:0034451) |
| 0.2 | 0.9 | GO:1990590 | ATF1-ATF4 transcription factor complex(GO:1990590) |
| 0.2 | 15.0 | GO:0005814 | centriole(GO:0005814) |
| 0.2 | 42.2 | GO:0031965 | nuclear membrane(GO:0031965) |
| 0.2 | 9.9 | GO:0005881 | cytoplasmic microtubule(GO:0005881) |
| 0.2 | 6.4 | GO:0030992 | intraciliary transport particle B(GO:0030992) |
| 0.2 | 1.6 | GO:0000439 | core TFIIH complex(GO:0000439) |
| 0.2 | 1.0 | GO:0000408 | EKC/KEOPS complex(GO:0000408) |
| 0.2 | 9.0 | GO:0008180 | COP9 signalosome(GO:0008180) |
| 0.2 | 0.6 | GO:0034679 | integrin alpha9-beta1 complex(GO:0034679) |
| 0.2 | 5.3 | GO:0032588 | trans-Golgi network membrane(GO:0032588) |
| 0.2 | 3.5 | GO:0005840 | ribosome(GO:0005840) |
| 0.2 | 2.7 | GO:0051233 | spindle midzone(GO:0051233) |
| 0.2 | 2.5 | GO:0000930 | gamma-tubulin complex(GO:0000930) |
| 0.2 | 112.3 | GO:0005730 | nucleolus(GO:0005730) |
| 0.2 | 0.9 | GO:0031314 | extrinsic component of mitochondrial inner membrane(GO:0031314) |
| 0.2 | 2.5 | GO:0012510 | trans-Golgi network transport vesicle membrane(GO:0012510) |
| 0.2 | 2.5 | GO:0032839 | dendrite cytoplasm(GO:0032839) |
| 0.2 | 3.2 | GO:0000145 | exocyst(GO:0000145) |
| 0.2 | 1.6 | GO:0030061 | mitochondrial crista(GO:0030061) |
| 0.2 | 3.6 | GO:0032426 | stereocilium tip(GO:0032426) |
| 0.2 | 0.5 | GO:0044316 | cone cell pedicle(GO:0044316) |
| 0.2 | 0.7 | GO:0048476 | Holliday junction resolvase complex(GO:0048476) |
| 0.2 | 0.7 | GO:0071256 | Sec61 translocon complex(GO:0005784) translocon complex(GO:0071256) |
| 0.2 | 2.6 | GO:0032039 | integrator complex(GO:0032039) |
| 0.2 | 7.0 | GO:0016363 | nuclear matrix(GO:0016363) |
| 0.2 | 1.0 | GO:0061700 | GATOR2 complex(GO:0061700) |
| 0.2 | 2.3 | GO:0000276 | mitochondrial proton-transporting ATP synthase complex, coupling factor F(o)(GO:0000276) |
| 0.2 | 0.5 | GO:0030905 | retromer, tubulation complex(GO:0030905) |
| 0.2 | 0.8 | GO:0034719 | SMN complex(GO:0032797) SMN-Sm protein complex(GO:0034719) |
| 0.2 | 9.3 | GO:0000502 | proteasome complex(GO:0000502) |
| 0.2 | 0.3 | GO:0005899 | insulin receptor complex(GO:0005899) |
| 0.2 | 2.0 | GO:0002178 | palmitoyltransferase complex(GO:0002178) |
| 0.2 | 2.7 | GO:0010494 | cytoplasmic stress granule(GO:0010494) |
| 0.2 | 3.1 | GO:0031588 | nucleotide-activated protein kinase complex(GO:0031588) |
| 0.2 | 1.1 | GO:0097526 | spliceosomal tri-snRNP complex(GO:0097526) |
| 0.2 | 0.2 | GO:0005859 | muscle myosin complex(GO:0005859) striated muscle myosin thick filament(GO:0005863) |
| 0.2 | 2.1 | GO:0030056 | hemidesmosome(GO:0030056) |
| 0.2 | 1.5 | GO:0035748 | myelin sheath abaxonal region(GO:0035748) |
| 0.1 | 0.1 | GO:0043073 | germ cell nucleus(GO:0043073) |
| 0.1 | 7.9 | GO:0005834 | heterotrimeric G-protein complex(GO:0005834) |
| 0.1 | 1.2 | GO:0032937 | SREBP-SCAP-Insig complex(GO:0032937) |
| 0.1 | 0.3 | GO:1902636 | kinociliary basal body(GO:1902636) |
| 0.1 | 1.2 | GO:0005665 | DNA-directed RNA polymerase II, core complex(GO:0005665) |
| 0.1 | 2.5 | GO:0045095 | keratin filament(GO:0045095) |
| 0.1 | 0.5 | GO:0043527 | tRNA methyltransferase complex(GO:0043527) |
| 0.1 | 6.0 | GO:0005758 | mitochondrial intermembrane space(GO:0005758) |
| 0.1 | 3.8 | GO:0016592 | mediator complex(GO:0016592) |
| 0.1 | 1.0 | GO:0045252 | dihydrolipoyl dehydrogenase complex(GO:0045240) oxoglutarate dehydrogenase complex(GO:0045252) |
| 0.1 | 10.4 | GO:0001725 | stress fiber(GO:0001725) contractile actin filament bundle(GO:0097517) |
| 0.1 | 0.3 | GO:0031372 | UBC13-MMS2 complex(GO:0031372) |
| 0.1 | 3.8 | GO:0043034 | costamere(GO:0043034) |
| 0.1 | 1.0 | GO:0097427 | microtubule bundle(GO:0097427) |
| 0.1 | 5.1 | GO:0005746 | mitochondrial respiratory chain(GO:0005746) |
| 0.1 | 0.4 | GO:0005943 | phosphatidylinositol 3-kinase complex, class IA(GO:0005943) |
| 0.1 | 2.5 | GO:0031941 | filamentous actin(GO:0031941) |
| 0.1 | 3.1 | GO:0030137 | COPI-coated vesicle(GO:0030137) |
| 0.1 | 1.8 | GO:0005847 | mRNA cleavage and polyadenylation specificity factor complex(GO:0005847) |
| 0.1 | 1.5 | GO:0005669 | transcription factor TFIID complex(GO:0005669) |
| 0.1 | 1.1 | GO:0000138 | Golgi trans cisterna(GO:0000138) |
| 0.1 | 0.1 | GO:0031467 | Cul7-RING ubiquitin ligase complex(GO:0031467) |
| 0.1 | 0.5 | GO:0034709 | methylosome(GO:0034709) |
| 0.1 | 0.9 | GO:0005753 | mitochondrial proton-transporting ATP synthase complex(GO:0005753) |
| 0.1 | 0.2 | GO:0097057 | TRAF2-GSTP1 complex(GO:0097057) |
| 0.1 | 0.8 | GO:0071203 | WASH complex(GO:0071203) |
| 0.1 | 0.5 | GO:0097542 | ciliary tip(GO:0097542) |
| 0.1 | 8.0 | GO:0005811 | lipid particle(GO:0005811) |
| 0.1 | 0.4 | GO:0005945 | 6-phosphofructokinase complex(GO:0005945) |
| 0.1 | 0.5 | GO:0038201 | TOR complex(GO:0038201) |
| 0.1 | 0.6 | GO:0060091 | kinocilium(GO:0060091) |
| 0.1 | 0.4 | GO:0070069 | cytochrome complex(GO:0070069) |
| 0.1 | 0.6 | GO:0000782 | telomere cap complex(GO:0000782) nuclear telomere cap complex(GO:0000783) |
| 0.1 | 0.6 | GO:0042622 | photoreceptor outer segment membrane(GO:0042622) |
| 0.1 | 0.2 | GO:0030125 | clathrin vesicle coat(GO:0030125) |
| 0.1 | 2.0 | GO:0001917 | photoreceptor inner segment(GO:0001917) |
| 0.1 | 0.4 | GO:1990130 | Iml1 complex(GO:1990130) |
| 0.1 | 19.0 | GO:0016607 | nuclear speck(GO:0016607) |
| 0.1 | 0.4 | GO:0031084 | BLOC-2 complex(GO:0031084) |
| 0.1 | 0.4 | GO:0071817 | MMXD complex(GO:0071817) |
| 0.1 | 0.3 | GO:0000814 | ESCRT II complex(GO:0000814) |
| 0.1 | 0.5 | GO:0035145 | exon-exon junction complex(GO:0035145) |
| 0.1 | 0.3 | GO:0045009 | melanosome membrane(GO:0033162) chitosome(GO:0045009) |
| 0.1 | 0.3 | GO:0032584 | growth cone membrane(GO:0032584) |
| 0.1 | 1.1 | GO:0046930 | pore complex(GO:0046930) |
| 0.1 | 0.2 | GO:0031371 | ubiquitin conjugating enzyme complex(GO:0031371) |
| 0.1 | 3.1 | GO:0000792 | heterochromatin(GO:0000792) |
| 0.1 | 0.1 | GO:0005683 | U7 snRNP(GO:0005683) |
| 0.1 | 0.2 | GO:0033193 | Lsd1/2 complex(GO:0033193) |
| 0.1 | 0.5 | GO:0000127 | transcription factor TFIIIC complex(GO:0000127) |
| 0.1 | 19.6 | GO:0005813 | centrosome(GO:0005813) |
| 0.1 | 0.8 | GO:0098799 | outer mitochondrial membrane protein complex(GO:0098799) |
| 0.1 | 0.6 | GO:0030478 | actin cap(GO:0030478) |
| 0.1 | 0.5 | GO:0031315 | extrinsic component of mitochondrial outer membrane(GO:0031315) |
| 0.1 | 0.9 | GO:0005865 | striated muscle thin filament(GO:0005865) |
| 0.1 | 0.4 | GO:0033256 | I-kappaB/NF-kappaB complex(GO:0033256) |
| 0.1 | 0.7 | GO:0035253 | ciliary rootlet(GO:0035253) |
| 0.1 | 0.3 | GO:0031466 | Cul5-RING ubiquitin ligase complex(GO:0031466) |
| 0.1 | 1.3 | GO:0035869 | ciliary transition zone(GO:0035869) |
| 0.1 | 1.8 | GO:0016234 | inclusion body(GO:0016234) |
| 0.1 | 0.2 | GO:0043540 | 6-phosphofructo-2-kinase/fructose-2,6-biphosphatase complex(GO:0043540) |
| 0.1 | 0.5 | GO:0005577 | fibrinogen complex(GO:0005577) |
| 0.1 | 0.2 | GO:0005944 | phosphatidylinositol 3-kinase complex, class IB(GO:0005944) |
| 0.1 | 0.2 | GO:0030485 | smooth muscle contractile fiber(GO:0030485) |
| 0.1 | 1.2 | GO:0008023 | transcription elongation factor complex(GO:0008023) |
| 0.1 | 1.0 | GO:0065010 | extracellular membrane-bounded organelle(GO:0065010) |
| 0.1 | 0.4 | GO:0019815 | B cell receptor complex(GO:0019815) |
| 0.1 | 1.6 | GO:0000118 | histone deacetylase complex(GO:0000118) |
| 0.1 | 1.4 | GO:0045171 | intercellular bridge(GO:0045171) |
| 0.1 | 0.6 | GO:1990712 | HFE-transferrin receptor complex(GO:1990712) |
| 0.1 | 3.7 | GO:0030018 | Z disc(GO:0030018) |
| 0.1 | 6.6 | GO:0005741 | mitochondrial outer membrane(GO:0005741) |
| 0.0 | 2.3 | GO:0099501 | synaptic vesicle membrane(GO:0030672) exocytic vesicle membrane(GO:0099501) |
| 0.0 | 0.4 | GO:0034366 | spherical high-density lipoprotein particle(GO:0034366) |
| 0.0 | 0.2 | GO:0030660 | Golgi-associated vesicle membrane(GO:0030660) |
| 0.0 | 0.2 | GO:0000137 | Golgi cis cisterna(GO:0000137) |
| 0.0 | 0.1 | GO:0097637 | intrinsic component of autophagosome membrane(GO:0097636) integral component of autophagosome membrane(GO:0097637) |
| 0.0 | 1.7 | GO:0005681 | spliceosomal complex(GO:0005681) |
| 0.0 | 0.3 | GO:0098651 | collagen type IV trimer(GO:0005587) network-forming collagen trimer(GO:0098642) collagen network(GO:0098645) basement membrane collagen trimer(GO:0098651) |
| 0.0 | 1.7 | GO:0030118 | clathrin coat(GO:0030118) |
| 0.0 | 0.2 | GO:0009331 | glycerol-3-phosphate dehydrogenase complex(GO:0009331) |
| 0.0 | 0.2 | GO:0030990 | intraciliary transport particle(GO:0030990) intraciliary transport particle A(GO:0030991) |
| 0.0 | 0.2 | GO:0002189 | ribose phosphate diphosphokinase complex(GO:0002189) |
| 0.0 | 0.4 | GO:0044214 | spanning component of plasma membrane(GO:0044214) spanning component of membrane(GO:0089717) |
| 0.0 | 0.1 | GO:0071797 | LUBAC complex(GO:0071797) |
| 0.0 | 0.1 | GO:0031258 | lamellipodium membrane(GO:0031258) |
| 0.0 | 0.7 | GO:0042734 | presynaptic membrane(GO:0042734) |
| 0.0 | 0.1 | GO:0032156 | septin cytoskeleton(GO:0032156) |
| 0.0 | 0.1 | GO:0044354 | pinosome(GO:0044352) macropinosome(GO:0044354) |
| 0.0 | 0.3 | GO:0031527 | filopodium membrane(GO:0031527) |
| 0.0 | 0.1 | GO:1990923 | PET complex(GO:1990923) |
| 0.0 | 3.9 | GO:0042579 | peroxisome(GO:0005777) microbody(GO:0042579) |
| 0.0 | 0.3 | GO:0035686 | sperm fibrous sheath(GO:0035686) |
| 0.0 | 0.1 | GO:0005584 | collagen type I trimer(GO:0005584) |
| 0.0 | 1.0 | GO:0043198 | dendritic shaft(GO:0043198) |
| 0.0 | 23.2 | GO:0005739 | mitochondrion(GO:0005739) |
| 0.0 | 1.4 | GO:0034705 | potassium channel complex(GO:0034705) |
| 0.0 | 1.1 | GO:0072562 | blood microparticle(GO:0072562) |
| 0.0 | 0.1 | GO:0030688 | preribosome, small subunit precursor(GO:0030688) |
| 0.0 | 0.0 | GO:0070044 | synaptobrevin 2-SNAP-25-syntaxin-1a complex(GO:0070044) |
Gene overrepresentation in molecular function category:
| Log-likelihood per target | Total log-likelihood | Term | Description |
|---|---|---|---|
| 3.5 | 3.5 | GO:0097472 | cyclin-dependent protein kinase activity(GO:0097472) |
| 3.3 | 3.3 | GO:0001884 | pyrimidine nucleoside binding(GO:0001884) |
| 3.1 | 3.1 | GO:0051430 | corticotropin-releasing hormone receptor 1 binding(GO:0051430) |
| 2.7 | 21.4 | GO:0016618 | hydroxypyruvate reductase activity(GO:0016618) glyoxylate reductase (NADP) activity(GO:0030267) |
| 2.7 | 10.7 | GO:0097100 | supercoiled DNA binding(GO:0097100) |
| 2.6 | 7.9 | GO:0070052 | collagen V binding(GO:0070052) |
| 2.6 | 7.9 | GO:0051765 | inositol tetrakisphosphate kinase activity(GO:0051765) |
| 2.6 | 7.9 | GO:0000402 | open form four-way junction DNA binding(GO:0000401) crossed form four-way junction DNA binding(GO:0000402) |
| 2.5 | 22.8 | GO:0051575 | 5'-deoxyribose-5-phosphate lyase activity(GO:0051575) |
| 2.4 | 12.1 | GO:0001165 | RNA polymerase I upstream control element sequence-specific DNA binding(GO:0001165) |
| 2.3 | 9.3 | GO:0055105 | ubiquitin-protein transferase inhibitor activity(GO:0055105) |
| 2.3 | 13.9 | GO:0002135 | CTP binding(GO:0002135) |
| 2.3 | 11.4 | GO:0000405 | bubble DNA binding(GO:0000405) |
| 2.1 | 2.1 | GO:0043139 | 5'-3' DNA helicase activity(GO:0043139) |
| 2.0 | 2.0 | GO:0015616 | DNA translocase activity(GO:0015616) |
| 2.0 | 17.9 | GO:0005004 | GPI-linked ephrin receptor activity(GO:0005004) |
| 1.9 | 21.4 | GO:0033170 | DNA clamp loader activity(GO:0003689) protein-DNA loading ATPase activity(GO:0033170) |
| 1.8 | 5.3 | GO:0033680 | ATP-dependent DNA/RNA helicase activity(GO:0033680) |
| 1.8 | 5.3 | GO:0003865 | 3-oxo-5-alpha-steroid 4-dehydrogenase activity(GO:0003865) cholestenone 5-alpha-reductase activity(GO:0047751) |
| 1.7 | 8.7 | GO:0003989 | acetyl-CoA carboxylase activity(GO:0003989) |
| 1.7 | 17.2 | GO:0001135 | transcription factor activity, RNA polymerase II transcription factor recruiting(GO:0001135) |
| 1.7 | 10.2 | GO:0010997 | anaphase-promoting complex binding(GO:0010997) |
| 1.7 | 5.0 | GO:0016855 | racemase and epimerase activity, acting on amino acids and derivatives(GO:0016855) racemase activity, acting on amino acids and derivatives(GO:0036361) amino-acid racemase activity(GO:0047661) |
| 1.7 | 11.6 | GO:0033592 | RNA strand annealing activity(GO:0033592) |
| 1.6 | 8.2 | GO:1990188 | euchromatin binding(GO:1990188) |
| 1.6 | 4.9 | GO:0047598 | sterol delta7 reductase activity(GO:0009918) 7-dehydrocholesterol reductase activity(GO:0047598) |
| 1.6 | 8.1 | GO:0031779 | melanocortin receptor binding(GO:0031779) type 3 melanocortin receptor binding(GO:0031781) type 4 melanocortin receptor binding(GO:0031782) |
| 1.6 | 3.2 | GO:0043142 | single-stranded DNA-dependent ATPase activity(GO:0043142) |
| 1.5 | 7.7 | GO:0016907 | G-protein coupled acetylcholine receptor activity(GO:0016907) |
| 1.5 | 4.6 | GO:0036132 | 13-prostaglandin reductase activity(GO:0036132) 15-oxoprostaglandin 13-oxidase activity(GO:0047522) |
| 1.5 | 4.5 | GO:0071209 | U7 snRNA binding(GO:0071209) |
| 1.5 | 7.5 | GO:0008269 | JAK pathway signal transduction adaptor activity(GO:0008269) |
| 1.5 | 4.5 | GO:0050510 | N-acetylgalactosaminyl-proteoglycan 3-beta-glucuronosyltransferase activity(GO:0050510) |
| 1.5 | 12.0 | GO:0008310 | single-stranded DNA 3'-5' exodeoxyribonuclease activity(GO:0008310) |
| 1.5 | 5.9 | GO:0046976 | histone methyltransferase activity (H3-K27 specific)(GO:0046976) |
| 1.5 | 4.4 | GO:0005119 | smoothened binding(GO:0005119) hedgehog receptor activity(GO:0008158) |
| 1.5 | 8.8 | GO:0004359 | glutaminase activity(GO:0004359) |
| 1.4 | 11.5 | GO:0046974 | histone methyltransferase activity (H3-K9 specific)(GO:0046974) |
| 1.4 | 9.7 | GO:0004614 | phosphoglucomutase activity(GO:0004614) |
| 1.4 | 4.2 | GO:0015319 | sodium:inorganic phosphate symporter activity(GO:0015319) |
| 1.4 | 4.2 | GO:0046899 | nucleoside triphosphate adenylate kinase activity(GO:0046899) |
| 1.4 | 5.5 | GO:0033883 | pyridoxal phosphatase activity(GO:0033883) |
| 1.4 | 2.8 | GO:0034046 | poly(G) binding(GO:0034046) |
| 1.4 | 8.2 | GO:0042296 | ISG15 transferase activity(GO:0042296) |
| 1.3 | 4.0 | GO:0047192 | 1-alkylglycerophosphocholine O-acetyltransferase activity(GO:0047192) |
| 1.3 | 18.3 | GO:1990226 | histone methyltransferase binding(GO:1990226) |
| 1.3 | 1.3 | GO:0010521 | telomerase inhibitor activity(GO:0010521) |
| 1.3 | 3.9 | GO:0004357 | glutamate-cysteine ligase activity(GO:0004357) |
| 1.3 | 3.8 | GO:0071207 | histone pre-mRNA stem-loop binding(GO:0071207) |
| 1.2 | 3.7 | GO:0034211 | GTP-dependent protein kinase activity(GO:0034211) |
| 1.2 | 4.9 | GO:0004315 | 3-oxoacyl-[acyl-carrier-protein] synthase activity(GO:0004315) |
| 1.2 | 4.9 | GO:0017095 | heparan sulfate 6-O-sulfotransferase activity(GO:0017095) |
| 1.2 | 7.3 | GO:0008518 | reduced folate carrier activity(GO:0008518) |
| 1.2 | 7.3 | GO:0033192 | calmodulin-dependent protein phosphatase activity(GO:0033192) |
| 1.2 | 8.4 | GO:0051731 | polynucleotide 5'-hydroxyl-kinase activity(GO:0051731) |
| 1.2 | 11.9 | GO:0019103 | pyrimidine nucleotide binding(GO:0019103) |
| 1.2 | 9.5 | GO:1990446 | U1 snRNP binding(GO:1990446) |
| 1.2 | 7.1 | GO:0015129 | lactate transmembrane transporter activity(GO:0015129) |
| 1.2 | 9.4 | GO:0070087 | chromo shadow domain binding(GO:0070087) |
| 1.2 | 7.0 | GO:0031493 | nucleosomal histone binding(GO:0031493) |
| 1.2 | 9.2 | GO:0008821 | crossover junction endodeoxyribonuclease activity(GO:0008821) |
| 1.2 | 6.9 | GO:1990189 | peptide-serine-N-acetyltransferase activity(GO:1990189) |
| 1.1 | 11.5 | GO:0005049 | nuclear export signal receptor activity(GO:0005049) |
| 1.1 | 4.6 | GO:0004703 | G-protein coupled receptor kinase activity(GO:0004703) |
| 1.1 | 6.8 | GO:0061649 | ubiquitinated histone binding(GO:0061649) |
| 1.1 | 6.7 | GO:0015018 | galactosylgalactosylxylosylprotein 3-beta-glucuronosyltransferase activity(GO:0015018) |
| 1.1 | 31.3 | GO:0070064 | proline-rich region binding(GO:0070064) |
| 1.1 | 5.4 | GO:0004883 | glucocorticoid receptor activity(GO:0004883) transcription factor activity, ligand-activated RNA polymerase II transcription factor binding(GO:0038049) glucocorticoid-activated RNA polymerase II transcription factor binding transcription factor activity(GO:0038051) |
| 1.1 | 5.4 | GO:0022851 | GABA-gated chloride ion channel activity(GO:0022851) |
| 1.1 | 5.3 | GO:0001537 | N-acetylgalactosamine 4-O-sulfotransferase activity(GO:0001537) |
| 1.1 | 7.4 | GO:0061665 | SUMO ligase activity(GO:0061665) |
| 1.0 | 2.1 | GO:0036310 | annealing helicase activity(GO:0036310) |
| 1.0 | 7.2 | GO:1990948 | ligase inhibitor activity(GO:0055104) ubiquitin ligase inhibitor activity(GO:1990948) |
| 1.0 | 19.6 | GO:0004535 | poly(A)-specific ribonuclease activity(GO:0004535) |
| 1.0 | 6.2 | GO:0005087 | Ran guanyl-nucleotide exchange factor activity(GO:0005087) |
| 1.0 | 30.5 | GO:0004003 | ATP-dependent DNA helicase activity(GO:0004003) |
| 1.0 | 3.0 | GO:0004637 | phosphoribosylamine-glycine ligase activity(GO:0004637) |
| 1.0 | 4.0 | GO:0004740 | pyruvate dehydrogenase (acetyl-transferring) kinase activity(GO:0004740) |
| 1.0 | 6.9 | GO:0015220 | choline transmembrane transporter activity(GO:0015220) |
| 1.0 | 4.9 | GO:0004692 | cGMP-dependent protein kinase activity(GO:0004692) |
| 1.0 | 2.9 | GO:0035402 | histone kinase activity (H3-T11 specific)(GO:0035402) |
| 1.0 | 4.8 | GO:0004468 | lysine N-acetyltransferase activity, acting on acetyl phosphate as donor(GO:0004468) |
| 1.0 | 4.8 | GO:0070404 | NADH binding(GO:0070404) |
| 1.0 | 22.8 | GO:0017056 | structural constituent of nuclear pore(GO:0017056) |
| 0.9 | 4.7 | GO:0052832 | inositol monophosphate 1-phosphatase activity(GO:0008934) inositol monophosphate 3-phosphatase activity(GO:0052832) inositol monophosphate 4-phosphatase activity(GO:0052833) inositol monophosphate phosphatase activity(GO:0052834) |
| 0.9 | 0.9 | GO:0035276 | ethanol binding(GO:0035276) |
| 0.9 | 8.5 | GO:0003909 | DNA ligase activity(GO:0003909) DNA ligase (ATP) activity(GO:0003910) |
| 0.9 | 1.9 | GO:0086089 | voltage-gated potassium channel activity involved in atrial cardiac muscle cell action potential repolarization(GO:0086089) |
| 0.9 | 6.5 | GO:0034513 | box H/ACA snoRNA binding(GO:0034513) |
| 0.9 | 12.1 | GO:0003688 | DNA replication origin binding(GO:0003688) |
| 0.9 | 1.8 | GO:0031403 | lithium ion binding(GO:0031403) |
| 0.9 | 6.4 | GO:0008504 | monoamine transmembrane transporter activity(GO:0008504) |
| 0.9 | 30.7 | GO:0016538 | cyclin-dependent protein serine/threonine kinase regulator activity(GO:0016538) |
| 0.9 | 5.4 | GO:0034186 | apolipoprotein A-I binding(GO:0034186) |
| 0.9 | 5.4 | GO:0044547 | DNA topoisomerase binding(GO:0044547) |
| 0.9 | 3.6 | GO:0008273 | calcium, potassium:sodium antiporter activity(GO:0008273) |
| 0.9 | 2.7 | GO:0000179 | rRNA (adenine-N6,N6-)-dimethyltransferase activity(GO:0000179) |
| 0.9 | 2.7 | GO:0035605 | peptidyl-cysteine S-nitrosylase activity(GO:0035605) |
| 0.9 | 7.0 | GO:0050786 | RAGE receptor binding(GO:0050786) |
| 0.9 | 3.5 | GO:0004897 | ciliary neurotrophic factor receptor activity(GO:0004897) |
| 0.9 | 17.4 | GO:0008266 | poly(U) RNA binding(GO:0008266) |
| 0.9 | 20.9 | GO:0003746 | translation elongation factor activity(GO:0003746) |
| 0.9 | 2.6 | GO:0004774 | succinate-CoA ligase activity(GO:0004774) |
| 0.9 | 5.2 | GO:0015467 | G-protein activated inward rectifier potassium channel activity(GO:0015467) |
| 0.9 | 2.6 | GO:0004379 | glycylpeptide N-tetradecanoyltransferase activity(GO:0004379) myristoyltransferase activity(GO:0019107) |
| 0.9 | 2.6 | GO:0070540 | stearic acid binding(GO:0070540) |
| 0.9 | 5.1 | GO:0005052 | peroxisome matrix targeting signal-1 binding(GO:0005052) |
| 0.8 | 5.1 | GO:0000213 | tRNA-intron endonuclease activity(GO:0000213) |
| 0.8 | 3.3 | GO:0003938 | IMP dehydrogenase activity(GO:0003938) |
| 0.8 | 2.5 | GO:0004452 | isopentenyl-diphosphate delta-isomerase activity(GO:0004452) |
| 0.8 | 12.3 | GO:0043495 | protein anchor(GO:0043495) |
| 0.8 | 3.3 | GO:0000700 | mismatch base pair DNA N-glycosylase activity(GO:0000700) |
| 0.8 | 7.3 | GO:1990247 | N6-methyladenosine-containing RNA binding(GO:1990247) |
| 0.8 | 8.1 | GO:0070097 | delta-catenin binding(GO:0070097) |
| 0.8 | 5.6 | GO:0004652 | polynucleotide adenylyltransferase activity(GO:0004652) |
| 0.8 | 12.0 | GO:0031996 | thioesterase binding(GO:0031996) |
| 0.8 | 3.2 | GO:0001087 | transcription factor activity, sequence-specific DNA binding, RNA polymerase recruiting(GO:0001011) transcription factor activity, TFIIB-class binding(GO:0001087) |
| 0.8 | 7.1 | GO:0034711 | inhibin binding(GO:0034711) |
| 0.8 | 3.9 | GO:0003918 | DNA topoisomerase type II (ATP-hydrolyzing) activity(GO:0003918) DNA topoisomerase II activity(GO:0061505) |
| 0.8 | 8.6 | GO:0008190 | eukaryotic initiation factor 4E binding(GO:0008190) |
| 0.8 | 18.5 | GO:0008139 | nuclear localization sequence binding(GO:0008139) |
| 0.8 | 3.8 | GO:0001226 | RNA polymerase II transcription corepressor binding(GO:0001226) |
| 0.8 | 3.1 | GO:1904315 | neurotransmitter receptor activity involved in regulation of postsynaptic membrane potential(GO:0099529) transmitter-gated ion channel activity involved in regulation of postsynaptic membrane potential(GO:1904315) |
| 0.8 | 2.3 | GO:0008297 | single-stranded DNA exodeoxyribonuclease activity(GO:0008297) |
| 0.8 | 8.4 | GO:0009922 | fatty acid elongase activity(GO:0009922) 3-oxo-arachidoyl-CoA synthase activity(GO:0102336) 3-oxo-cerotoyl-CoA synthase activity(GO:0102337) 3-oxo-lignoceronyl-CoA synthase activity(GO:0102338) |
| 0.8 | 5.3 | GO:0004523 | RNA-DNA hybrid ribonuclease activity(GO:0004523) |
| 0.8 | 2.3 | GO:0032137 | guanine/thymine mispair binding(GO:0032137) |
| 0.8 | 3.0 | GO:0003883 | CTP synthase activity(GO:0003883) |
| 0.8 | 6.1 | GO:0035242 | protein-arginine omega-N asymmetric methyltransferase activity(GO:0035242) |
| 0.8 | 3.0 | GO:0015277 | kainate selective glutamate receptor activity(GO:0015277) |
| 0.8 | 3.0 | GO:0000010 | trans-hexaprenyltranstransferase activity(GO:0000010) trans-octaprenyltranstransferase activity(GO:0050347) |
| 0.8 | 15.8 | GO:0003887 | DNA-directed DNA polymerase activity(GO:0003887) |
| 0.7 | 12.6 | GO:0015643 | toxic substance binding(GO:0015643) |
| 0.7 | 8.1 | GO:0030306 | ADP-ribosylation factor binding(GO:0030306) |
| 0.7 | 5.9 | GO:0001075 | transcription factor activity, RNA polymerase II core promoter sequence-specific binding involved in preinitiation complex assembly(GO:0001075) |
| 0.7 | 6.6 | GO:0004634 | phosphopyruvate hydratase activity(GO:0004634) |
| 0.7 | 4.4 | GO:0051033 | nucleic acid transmembrane transporter activity(GO:0051032) RNA transmembrane transporter activity(GO:0051033) |
| 0.7 | 2.2 | GO:0030629 | U6 snRNA 3'-end binding(GO:0030629) |
| 0.7 | 2.2 | GO:0036478 | tyrosine 3-monooxygenase activator activity(GO:0036470) L-dopa decarboxylase activator activity(GO:0036478) |
| 0.7 | 0.7 | GO:0031750 | D3 dopamine receptor binding(GO:0031750) |
| 0.7 | 2.2 | GO:0005134 | interleukin-2 receptor binding(GO:0005134) |
| 0.7 | 5.7 | GO:0005094 | Rho GDP-dissociation inhibitor activity(GO:0005094) |
| 0.7 | 10.7 | GO:0017017 | MAP kinase tyrosine/serine/threonine phosphatase activity(GO:0017017) |
| 0.7 | 10.7 | GO:0001222 | transcription corepressor binding(GO:0001222) |
| 0.7 | 2.1 | GO:0001591 | dopamine neurotransmitter receptor activity, coupled via Gi/Go(GO:0001591) |
| 0.7 | 4.9 | GO:0035312 | 5'-3' exodeoxyribonuclease activity(GO:0035312) |
| 0.7 | 4.9 | GO:0032184 | SUMO polymer binding(GO:0032184) |
| 0.7 | 4.9 | GO:0000340 | RNA 7-methylguanosine cap binding(GO:0000340) |
| 0.7 | 2.1 | GO:0070546 | L-aspartate:2-oxoglutarate aminotransferase activity(GO:0004069) L-phenylalanine aminotransferase activity(GO:0070546) L-phenylalanine:2-oxoglutarate aminotransferase activity(GO:0080130) |
| 0.7 | 2.1 | GO:0098918 | structural constituent of synapse(GO:0098918) structural constituent of postsynaptic actin cytoskeleton(GO:0098973) |
| 0.7 | 2.8 | GO:0050265 | RNA uridylyltransferase activity(GO:0050265) |
| 0.7 | 16.0 | GO:0008536 | Ran GTPase binding(GO:0008536) |
| 0.7 | 1.4 | GO:0033549 | MAP kinase phosphatase activity(GO:0033549) |
| 0.7 | 2.0 | GO:0051880 | G-quadruplex DNA binding(GO:0051880) |
| 0.7 | 6.1 | GO:0031995 | insulin-like growth factor II binding(GO:0031995) |
| 0.7 | 5.4 | GO:0052629 | phosphatidylinositol-3,5-bisphosphate 3-phosphatase activity(GO:0052629) |
| 0.7 | 2.0 | GO:0070137 | ubiquitin-like protein-specific endopeptidase activity(GO:0070137) SUMO-specific endopeptidase activity(GO:0070139) |
| 0.7 | 2.7 | GO:0015403 | thiamine uptake transmembrane transporter activity(GO:0015403) |
| 0.7 | 1.3 | GO:0031698 | beta-2 adrenergic receptor binding(GO:0031698) |
| 0.6 | 25.8 | GO:0031492 | nucleosomal DNA binding(GO:0031492) |
| 0.6 | 2.6 | GO:0016909 | JUN kinase activity(GO:0004705) SAP kinase activity(GO:0016909) |
| 0.6 | 9.6 | GO:0001054 | RNA polymerase I activity(GO:0001054) |
| 0.6 | 12.8 | GO:0031681 | G-protein beta-subunit binding(GO:0031681) |
| 0.6 | 2.6 | GO:0004427 | inorganic diphosphatase activity(GO:0004427) |
| 0.6 | 2.6 | GO:0004832 | valine-tRNA ligase activity(GO:0004832) |
| 0.6 | 3.8 | GO:0070728 | leucine binding(GO:0070728) |
| 0.6 | 3.2 | GO:0004748 | ribonucleoside-diphosphate reductase activity, thioredoxin disulfide as acceptor(GO:0004748) oxidoreductase activity, acting on CH or CH2 groups, disulfide as acceptor(GO:0016728) ribonucleoside-diphosphate reductase activity(GO:0061731) |
| 0.6 | 1.3 | GO:0032767 | copper-dependent protein binding(GO:0032767) |
| 0.6 | 1.9 | GO:0004829 | threonine-tRNA ligase activity(GO:0004829) |
| 0.6 | 1.9 | GO:0046975 | histone methyltransferase activity (H3-K36 specific)(GO:0046975) |
| 0.6 | 5.0 | GO:0003886 | DNA (cytosine-5-)-methyltransferase activity(GO:0003886) |
| 0.6 | 4.4 | GO:0000774 | adenyl-nucleotide exchange factor activity(GO:0000774) |
| 0.6 | 1.9 | GO:0023030 | MHC class Ib protein complex binding(GO:0023025) MHC class Ib protein binding, via antigen binding groove(GO:0023030) |
| 0.6 | 5.6 | GO:0046790 | virion binding(GO:0046790) |
| 0.6 | 0.6 | GO:0070878 | primary miRNA binding(GO:0070878) |
| 0.6 | 2.5 | GO:0010484 | H3 histone acetyltransferase activity(GO:0010484) |
| 0.6 | 4.9 | GO:0001640 | adenylate cyclase inhibiting G-protein coupled glutamate receptor activity(GO:0001640) |
| 0.6 | 2.4 | GO:0042903 | tubulin deacetylase activity(GO:0042903) |
| 0.6 | 0.6 | GO:0004312 | fatty acid synthase activity(GO:0004312) |
| 0.6 | 1.8 | GO:0003858 | 3-hydroxybutyrate dehydrogenase activity(GO:0003858) |
| 0.6 | 3.0 | GO:0016868 | intramolecular transferase activity, phosphotransferases(GO:0016868) |
| 0.6 | 1.8 | GO:0052743 | inositol tetrakisphosphate phosphatase activity(GO:0052743) |
| 0.6 | 2.9 | GO:0043515 | kinetochore binding(GO:0043515) |
| 0.6 | 2.9 | GO:0015038 | glutathione disulfide oxidoreductase activity(GO:0015038) |
| 0.6 | 3.5 | GO:0001094 | TFIID-class transcription factor binding(GO:0001094) |
| 0.6 | 1.1 | GO:0030899 | calcium-dependent ATPase activity(GO:0030899) |
| 0.6 | 5.1 | GO:0070181 | small ribosomal subunit rRNA binding(GO:0070181) |
| 0.6 | 2.3 | GO:0008802 | betaine-aldehyde dehydrogenase activity(GO:0008802) |
| 0.6 | 2.3 | GO:0016530 | metallochaperone activity(GO:0016530) |
| 0.6 | 3.4 | GO:0004084 | branched-chain-amino-acid transaminase activity(GO:0004084) L-leucine transaminase activity(GO:0052654) L-valine transaminase activity(GO:0052655) L-isoleucine transaminase activity(GO:0052656) |
| 0.6 | 5.0 | GO:0043208 | glycosphingolipid binding(GO:0043208) |
| 0.6 | 4.5 | GO:0044388 | small protein activating enzyme binding(GO:0044388) |
| 0.6 | 4.4 | GO:0031811 | G-protein coupled nucleotide receptor binding(GO:0031811) P2Y1 nucleotide receptor binding(GO:0031812) |
| 0.6 | 2.2 | GO:0038025 | reelin receptor activity(GO:0038025) |
| 0.5 | 1.6 | GO:0016309 | 1-phosphatidylinositol-5-phosphate 4-kinase activity(GO:0016309) |
| 0.5 | 10.4 | GO:0050321 | tau-protein kinase activity(GO:0050321) |
| 0.5 | 2.7 | GO:0004768 | stearoyl-CoA 9-desaturase activity(GO:0004768) |
| 0.5 | 2.2 | GO:1990715 | mRNA CDS binding(GO:1990715) |
| 0.5 | 1.1 | GO:0004534 | 5'-3' exoribonuclease activity(GO:0004534) |
| 0.5 | 1.1 | GO:0098518 | polynucleotide phosphatase activity(GO:0098518) |
| 0.5 | 1.6 | GO:0004140 | dephospho-CoA kinase activity(GO:0004140) |
| 0.5 | 3.2 | GO:0032027 | myosin light chain binding(GO:0032027) |
| 0.5 | 1.6 | GO:0004471 | malic enzyme activity(GO:0004470) malate dehydrogenase (decarboxylating) (NAD+) activity(GO:0004471) malate dehydrogenase (decarboxylating) (NADP+) activity(GO:0004473) |
| 0.5 | 1.1 | GO:0098519 | nucleotide phosphatase activity, acting on free nucleotides(GO:0098519) |
| 0.5 | 3.7 | GO:0015562 | efflux transmembrane transporter activity(GO:0015562) |
| 0.5 | 1.6 | GO:0033829 | O-fucosylpeptide 3-beta-N-acetylglucosaminyltransferase activity(GO:0033829) |
| 0.5 | 4.1 | GO:0005127 | ciliary neurotrophic factor receptor binding(GO:0005127) |
| 0.5 | 3.6 | GO:0035174 | histone serine kinase activity(GO:0035174) |
| 0.5 | 4.1 | GO:1901612 | cardiolipin binding(GO:1901612) |
| 0.5 | 1.5 | GO:0015275 | stretch-activated, cation-selective, calcium channel activity(GO:0015275) |
| 0.5 | 3.0 | GO:0003680 | AT DNA binding(GO:0003680) |
| 0.5 | 4.6 | GO:0043023 | ribosomal large subunit binding(GO:0043023) |
| 0.5 | 1.0 | GO:1990269 | RNA polymerase II C-terminal domain phosphoserine binding(GO:1990269) |
| 0.5 | 1.5 | GO:0003963 | RNA-3'-phosphate cyclase activity(GO:0003963) |
| 0.5 | 1.5 | GO:0030620 | U2 snRNA binding(GO:0030620) |
| 0.5 | 3.5 | GO:0050733 | RS domain binding(GO:0050733) |
| 0.5 | 36.8 | GO:0048365 | Rac GTPase binding(GO:0048365) |
| 0.5 | 6.4 | GO:0010485 | H4 histone acetyltransferase activity(GO:0010485) |
| 0.5 | 3.9 | GO:1990825 | sequence-specific mRNA binding(GO:1990825) |
| 0.5 | 7.8 | GO:0051010 | microtubule plus-end binding(GO:0051010) |
| 0.5 | 1.9 | GO:0004741 | [pyruvate dehydrogenase (lipoamide)] phosphatase activity(GO:0004741) |
| 0.5 | 12.6 | GO:0008432 | JUN kinase binding(GO:0008432) |
| 0.5 | 1.4 | GO:0032356 | oxidized DNA binding(GO:0032356) |
| 0.5 | 5.8 | GO:0004549 | tRNA-specific ribonuclease activity(GO:0004549) |
| 0.5 | 79.8 | GO:0003735 | structural constituent of ribosome(GO:0003735) |
| 0.5 | 3.3 | GO:0016428 | tRNA (cytosine-5-)-methyltransferase activity(GO:0016428) |
| 0.5 | 1.4 | GO:0004686 | elongation factor-2 kinase activity(GO:0004686) |
| 0.5 | 1.4 | GO:0098770 | FBXO family protein binding(GO:0098770) |
| 0.5 | 8.4 | GO:0008253 | 5'-nucleotidase activity(GO:0008253) |
| 0.5 | 4.6 | GO:0050291 | sphingosine N-acyltransferase activity(GO:0050291) |
| 0.5 | 2.3 | GO:0070883 | pre-miRNA binding(GO:0070883) |
| 0.5 | 2.7 | GO:0046912 | transferase activity, transferring acyl groups, acyl groups converted into alkyl on transfer(GO:0046912) |
| 0.5 | 5.9 | GO:0016783 | sulfurtransferase activity(GO:0016783) |
| 0.5 | 2.3 | GO:0042610 | CD8 receptor binding(GO:0042610) |
| 0.4 | 1.3 | GO:0097677 | STAT family protein binding(GO:0097677) |
| 0.4 | 1.8 | GO:0003836 | beta-galactoside (CMP) alpha-2,3-sialyltransferase activity(GO:0003836) |
| 0.4 | 2.2 | GO:0008061 | chitin binding(GO:0008061) |
| 0.4 | 3.5 | GO:0061133 | endopeptidase activator activity(GO:0061133) |
| 0.4 | 0.4 | GO:0016886 | ligase activity, forming phosphoric ester bonds(GO:0016886) |
| 0.4 | 2.2 | GO:0004809 | tRNA (guanine-N2-)-methyltransferase activity(GO:0004809) |
| 0.4 | 2.6 | GO:0031749 | D2 dopamine receptor binding(GO:0031749) |
| 0.4 | 0.4 | GO:0070061 | fructose binding(GO:0070061) |
| 0.4 | 1.3 | GO:0016206 | catechol O-methyltransferase activity(GO:0016206) |
| 0.4 | 33.6 | GO:0003697 | single-stranded DNA binding(GO:0003697) |
| 0.4 | 1.3 | GO:0004816 | asparagine-tRNA ligase activity(GO:0004816) |
| 0.4 | 0.4 | GO:0001091 | RNA polymerase II basal transcription factor binding(GO:0001091) |
| 0.4 | 1.7 | GO:0031014 | troponin T binding(GO:0031014) |
| 0.4 | 13.5 | GO:0071837 | HMG box domain binding(GO:0071837) |
| 0.4 | 3.4 | GO:0008135 | translation factor activity, RNA binding(GO:0008135) |
| 0.4 | 3.3 | GO:0097027 | ubiquitin-protein transferase activator activity(GO:0097027) |
| 0.4 | 7.5 | GO:0016866 | intramolecular transferase activity(GO:0016866) |
| 0.4 | 1.2 | GO:0008260 | 3-oxoacid CoA-transferase activity(GO:0008260) |
| 0.4 | 16.5 | GO:0061631 | ubiquitin conjugating enzyme activity(GO:0061631) |
| 0.4 | 1.6 | GO:0032296 | ribonuclease III activity(GO:0004525) double-stranded RNA-specific ribonuclease activity(GO:0032296) |
| 0.4 | 2.5 | GO:0008527 | taste receptor activity(GO:0008527) |
| 0.4 | 11.1 | GO:0001106 | RNA polymerase II transcription corepressor activity(GO:0001106) |
| 0.4 | 9.4 | GO:0000146 | microfilament motor activity(GO:0000146) |
| 0.4 | 6.9 | GO:0070717 | poly-purine tract binding(GO:0070717) |
| 0.4 | 1.2 | GO:0008311 | double-stranded DNA 3'-5' exodeoxyribonuclease activity(GO:0008311) |
| 0.4 | 10.1 | GO:0070840 | dynein complex binding(GO:0070840) |
| 0.4 | 5.2 | GO:0005314 | high-affinity glutamate transmembrane transporter activity(GO:0005314) |
| 0.4 | 6.4 | GO:0010314 | phosphatidylinositol-5-phosphate binding(GO:0010314) |
| 0.4 | 2.4 | GO:0004596 | peptide alpha-N-acetyltransferase activity(GO:0004596) |
| 0.4 | 1.6 | GO:0004488 | methenyltetrahydrofolate cyclohydrolase activity(GO:0004477) methylenetetrahydrofolate dehydrogenase (NADP+) activity(GO:0004488) |
| 0.4 | 21.2 | GO:0003743 | translation initiation factor activity(GO:0003743) |
| 0.4 | 1.2 | GO:0019776 | Atg8 ligase activity(GO:0019776) |
| 0.4 | 6.2 | GO:0004385 | guanylate kinase activity(GO:0004385) |
| 0.4 | 1.5 | GO:0004663 | Rab geranylgeranyltransferase activity(GO:0004663) |
| 0.4 | 3.5 | GO:0008519 | ammonium transmembrane transporter activity(GO:0008519) |
| 0.4 | 0.4 | GO:0001129 | RNA polymerase II transcription factor activity, TBP-class protein binding, involved in preinitiation complex assembly(GO:0001129) RNA polymerase II transcription factor activity, TBP-class protein binding(GO:0001132) |
| 0.4 | 10.3 | GO:0008569 | ATP-dependent microtubule motor activity, minus-end-directed(GO:0008569) |
| 0.4 | 2.7 | GO:0016896 | exoribonuclease activity, producing 5'-phosphomonoesters(GO:0016896) |
| 0.4 | 3.4 | GO:0003678 | DNA helicase activity(GO:0003678) |
| 0.4 | 1.5 | GO:0031800 | type 3 metabotropic glutamate receptor binding(GO:0031800) |
| 0.4 | 0.7 | GO:0016715 | oxidoreductase activity, acting on paired donors, with incorporation or reduction of molecular oxygen, reduced ascorbate as one donor, and incorporation of one atom of oxygen(GO:0016715) |
| 0.4 | 0.7 | GO:0015272 | ATP-activated inward rectifier potassium channel activity(GO:0015272) |
| 0.4 | 5.9 | GO:0030169 | low-density lipoprotein particle binding(GO:0030169) |
| 0.4 | 2.2 | GO:0047134 | protein-disulfide reductase activity(GO:0047134) |
| 0.4 | 3.3 | GO:0001665 | alpha-N-acetylgalactosaminide alpha-2,6-sialyltransferase activity(GO:0001665) |
| 0.4 | 1.1 | GO:0004743 | pyruvate kinase activity(GO:0004743) |
| 0.4 | 2.2 | GO:0034604 | pyruvate dehydrogenase activity(GO:0004738) pyruvate dehydrogenase [NAD(P)+] activity(GO:0034603) pyruvate dehydrogenase (NAD+) activity(GO:0034604) |
| 0.4 | 2.2 | GO:0015450 | P-P-bond-hydrolysis-driven protein transmembrane transporter activity(GO:0015450) |
| 0.4 | 1.1 | GO:0016434 | rRNA (cytosine) methyltransferase activity(GO:0016434) |
| 0.4 | 4.7 | GO:0001727 | lipid kinase activity(GO:0001727) |
| 0.4 | 0.7 | GO:0070644 | vitamin D response element binding(GO:0070644) |
| 0.4 | 1.1 | GO:0052901 | polyamine oxidase activity(GO:0046592) spermine:oxygen oxidoreductase (spermidine-forming) activity(GO:0052901) |
| 0.4 | 1.4 | GO:0003917 | DNA topoisomerase type I activity(GO:0003917) |
| 0.4 | 1.8 | GO:0031849 | olfactory receptor binding(GO:0031849) |
| 0.4 | 6.8 | GO:0102391 | decanoate--CoA ligase activity(GO:0102391) |
| 0.4 | 1.4 | GO:0004096 | catalase activity(GO:0004096) |
| 0.4 | 3.2 | GO:0030235 | nitric-oxide synthase regulator activity(GO:0030235) |
| 0.4 | 2.5 | GO:0036402 | proteasome-activating ATPase activity(GO:0036402) |
| 0.4 | 7.0 | GO:0031491 | nucleosome binding(GO:0031491) |
| 0.3 | 2.8 | GO:0004017 | adenylate kinase activity(GO:0004017) |
| 0.3 | 1.0 | GO:0004482 | mRNA (guanine-N7-)-methyltransferase activity(GO:0004482) |
| 0.3 | 7.7 | GO:0030515 | snoRNA binding(GO:0030515) |
| 0.3 | 2.1 | GO:0003720 | telomerase activity(GO:0003720) RNA-directed DNA polymerase activity(GO:0003964) |
| 0.3 | 4.9 | GO:0042800 | histone methyltransferase activity (H3-K4 specific)(GO:0042800) |
| 0.3 | 6.6 | GO:0004890 | GABA-A receptor activity(GO:0004890) |
| 0.3 | 4.1 | GO:0001056 | RNA polymerase III activity(GO:0001056) |
| 0.3 | 12.0 | GO:0030506 | ankyrin binding(GO:0030506) |
| 0.3 | 2.1 | GO:0004791 | thioredoxin-disulfide reductase activity(GO:0004791) |
| 0.3 | 1.0 | GO:0005105 | type 1 fibroblast growth factor receptor binding(GO:0005105) |
| 0.3 | 1.7 | GO:0004972 | NMDA glutamate receptor activity(GO:0004972) |
| 0.3 | 2.7 | GO:0008121 | ubiquinol-cytochrome-c reductase activity(GO:0008121) oxidoreductase activity, acting on diphenols and related substances as donors, cytochrome as acceptor(GO:0016681) |
| 0.3 | 1.7 | GO:0004515 | nicotinamide-nucleotide adenylyltransferase activity(GO:0000309) nicotinate-nucleotide adenylyltransferase activity(GO:0004515) |
| 0.3 | 4.0 | GO:0030274 | LIM domain binding(GO:0030274) |
| 0.3 | 19.1 | GO:0004722 | protein serine/threonine phosphatase activity(GO:0004722) |
| 0.3 | 0.7 | GO:0034988 | Fc-gamma receptor I complex binding(GO:0034988) |
| 0.3 | 1.7 | GO:0004849 | uridine kinase activity(GO:0004849) |
| 0.3 | 5.0 | GO:0016646 | oxidoreductase activity, acting on the CH-NH group of donors, NAD or NADP as acceptor(GO:0016646) |
| 0.3 | 2.0 | GO:0004726 | non-membrane spanning protein tyrosine phosphatase activity(GO:0004726) |
| 0.3 | 4.0 | GO:0001206 | transcriptional repressor activity, RNA polymerase II distal enhancer sequence-specific binding(GO:0001206) |
| 0.3 | 4.6 | GO:1990459 | transferrin receptor binding(GO:1990459) |
| 0.3 | 7.3 | GO:0015269 | calcium-activated potassium channel activity(GO:0015269) |
| 0.3 | 8.2 | GO:0097602 | cullin family protein binding(GO:0097602) |
| 0.3 | 2.9 | GO:0005522 | profilin binding(GO:0005522) |
| 0.3 | 3.2 | GO:0098599 | palmitoyl-(protein) hydrolase activity(GO:0008474) palmitoyl hydrolase activity(GO:0098599) |
| 0.3 | 4.2 | GO:0035014 | phosphatidylinositol 3-kinase regulator activity(GO:0035014) |
| 0.3 | 2.2 | GO:0001013 | RNA polymerase I regulatory region DNA binding(GO:0001013) |
| 0.3 | 2.2 | GO:0039706 | co-receptor binding(GO:0039706) |
| 0.3 | 0.9 | GO:0004450 | isocitrate dehydrogenase (NADP+) activity(GO:0004450) |
| 0.3 | 0.9 | GO:0043183 | vascular endothelial growth factor receptor 1 binding(GO:0043183) |
| 0.3 | 1.3 | GO:0030292 | protein tyrosine kinase inhibitor activity(GO:0030292) |
| 0.3 | 16.0 | GO:0031593 | polyubiquitin binding(GO:0031593) |
| 0.3 | 7.1 | GO:0031005 | filamin binding(GO:0031005) |
| 0.3 | 0.3 | GO:0070410 | co-SMAD binding(GO:0070410) |
| 0.3 | 1.8 | GO:0008559 | xenobiotic-transporting ATPase activity(GO:0008559) |
| 0.3 | 4.9 | GO:0004708 | MAP kinase kinase activity(GO:0004708) |
| 0.3 | 0.9 | GO:0015140 | malate transmembrane transporter activity(GO:0015140) |
| 0.3 | 1.2 | GO:0042731 | PH domain binding(GO:0042731) |
| 0.3 | 1.5 | GO:0017040 | ceramidase activity(GO:0017040) |
| 0.3 | 8.8 | GO:0005337 | nucleoside transmembrane transporter activity(GO:0005337) |
| 0.3 | 1.8 | GO:0016453 | acetyl-CoA C-acetyltransferase activity(GO:0003985) C-acetyltransferase activity(GO:0016453) |
| 0.3 | 0.9 | GO:0051011 | microtubule minus-end binding(GO:0051011) |
| 0.3 | 0.6 | GO:1903136 | cuprous ion binding(GO:1903136) |
| 0.3 | 0.9 | GO:0010698 | acetyltransferase activator activity(GO:0010698) |
| 0.3 | 3.6 | GO:0008157 | protein phosphatase 1 binding(GO:0008157) |
| 0.3 | 0.9 | GO:0035173 | histone kinase activity(GO:0035173) |
| 0.3 | 1.8 | GO:0017077 | oxidative phosphorylation uncoupler activity(GO:0017077) |
| 0.3 | 1.5 | GO:0005166 | neurotrophin p75 receptor binding(GO:0005166) |
| 0.3 | 12.2 | GO:0005070 | SH3/SH2 adaptor activity(GO:0005070) |
| 0.3 | 0.9 | GO:0004448 | isocitrate dehydrogenase activity(GO:0004448) isocitrate dehydrogenase (NAD+) activity(GO:0004449) |
| 0.3 | 0.3 | GO:0005315 | inorganic phosphate transmembrane transporter activity(GO:0005315) |
| 0.3 | 0.6 | GO:0015111 | iodide transmembrane transporter activity(GO:0015111) |
| 0.3 | 0.6 | GO:0042910 | xenobiotic transporter activity(GO:0042910) |
| 0.3 | 0.9 | GO:0005157 | macrophage colony-stimulating factor receptor binding(GO:0005157) |
| 0.3 | 2.3 | GO:0015349 | thyroid hormone transmembrane transporter activity(GO:0015349) |
| 0.3 | 1.7 | GO:0004022 | alcohol dehydrogenase (NAD) activity(GO:0004022) |
| 0.3 | 0.6 | GO:0031752 | D5 dopamine receptor binding(GO:0031752) |
| 0.3 | 1.7 | GO:0070579 | methylcytosine dioxygenase activity(GO:0070579) |
| 0.3 | 1.4 | GO:0016018 | cyclosporin A binding(GO:0016018) |
| 0.3 | 2.5 | GO:0043522 | leucine zipper domain binding(GO:0043522) |
| 0.3 | 1.7 | GO:0004035 | alkaline phosphatase activity(GO:0004035) |
| 0.3 | 5.3 | GO:0001786 | phosphatidylserine binding(GO:0001786) |
| 0.3 | 26.8 | GO:0101005 | thiol-dependent ubiquitinyl hydrolase activity(GO:0036459) ubiquitinyl hydrolase activity(GO:0101005) |
| 0.3 | 0.8 | GO:0038100 | nodal binding(GO:0038100) |
| 0.3 | 3.3 | GO:0032036 | myosin heavy chain binding(GO:0032036) |
| 0.3 | 0.8 | GO:0004349 | glutamate 5-kinase activity(GO:0004349) glutamate-5-semialdehyde dehydrogenase activity(GO:0004350) phosphotransferase activity, carboxyl group as acceptor(GO:0016774) delta1-pyrroline-5-carboxylate synthetase activity(GO:0017084) amino acid kinase activity(GO:0019202) |
| 0.3 | 1.4 | GO:1990254 | keratin filament binding(GO:1990254) |
| 0.3 | 6.4 | GO:0070003 | threonine-type endopeptidase activity(GO:0004298) threonine-type peptidase activity(GO:0070003) |
| 0.3 | 2.1 | GO:0050542 | icosanoid binding(GO:0050542) fatty acid derivative binding(GO:1901567) |
| 0.3 | 1.3 | GO:0008607 | phosphorylase kinase regulator activity(GO:0008607) |
| 0.3 | 0.3 | GO:0042328 | heparan sulfate N-acetylglucosaminyltransferase activity(GO:0042328) |
| 0.3 | 5.0 | GO:0070577 | lysine-acetylated histone binding(GO:0070577) |
| 0.3 | 7.0 | GO:0015002 | cytochrome-c oxidase activity(GO:0004129) heme-copper terminal oxidase activity(GO:0015002) oxidoreductase activity, acting on a heme group of donors, oxygen as acceptor(GO:0016676) |
| 0.3 | 0.8 | GO:0000995 | transcription factor activity, core RNA polymerase III binding(GO:0000995) |
| 0.3 | 9.8 | GO:0008307 | structural constituent of muscle(GO:0008307) |
| 0.3 | 0.3 | GO:0000104 | succinate dehydrogenase activity(GO:0000104) |
| 0.3 | 1.0 | GO:0008318 | protein prenyltransferase activity(GO:0008318) |
| 0.3 | 0.5 | GO:0071820 | N-box binding(GO:0071820) |
| 0.3 | 3.6 | GO:0048406 | nerve growth factor binding(GO:0048406) |
| 0.3 | 16.8 | GO:0005200 | structural constituent of cytoskeleton(GO:0005200) |
| 0.3 | 0.3 | GO:0019237 | centromeric DNA binding(GO:0019237) |
| 0.3 | 1.0 | GO:0004814 | arginine-tRNA ligase activity(GO:0004814) |
| 0.3 | 11.5 | GO:0019894 | kinesin binding(GO:0019894) |
| 0.2 | 3.0 | GO:0032050 | clathrin heavy chain binding(GO:0032050) |
| 0.2 | 1.7 | GO:0043184 | vascular endothelial growth factor receptor 2 binding(GO:0043184) |
| 0.2 | 5.4 | GO:0098632 | protein binding involved in cell-cell adhesion(GO:0098632) |
| 0.2 | 2.7 | GO:0035591 | signaling adaptor activity(GO:0035591) |
| 0.2 | 0.7 | GO:0008176 | tRNA (guanine-N7-)-methyltransferase activity(GO:0008176) |
| 0.2 | 5.8 | GO:0017025 | TBP-class protein binding(GO:0017025) |
| 0.2 | 0.5 | GO:0070990 | snRNP binding(GO:0070990) |
| 0.2 | 18.8 | GO:0032947 | protein complex scaffold(GO:0032947) |
| 0.2 | 1.2 | GO:0008353 | RNA polymerase II carboxy-terminal domain kinase activity(GO:0008353) |
| 0.2 | 6.6 | GO:0008574 | ATP-dependent microtubule motor activity, plus-end-directed(GO:0008574) |
| 0.2 | 0.9 | GO:0016971 | flavin-linked sulfhydryl oxidase activity(GO:0016971) |
| 0.2 | 0.9 | GO:0016842 | amidine-lyase activity(GO:0016842) |
| 0.2 | 2.3 | GO:0016846 | carbon-sulfur lyase activity(GO:0016846) |
| 0.2 | 11.6 | GO:0019212 | phosphatase inhibitor activity(GO:0019212) |
| 0.2 | 1.6 | GO:0004659 | prenyltransferase activity(GO:0004659) |
| 0.2 | 5.5 | GO:0045182 | translation regulator activity(GO:0045182) |
| 0.2 | 0.5 | GO:0016314 | phosphatidylinositol-3,4,5-trisphosphate 3-phosphatase activity(GO:0016314) |
| 0.2 | 0.9 | GO:0042979 | ornithine decarboxylase regulator activity(GO:0042979) |
| 0.2 | 1.8 | GO:0008454 | alpha-1,3-mannosylglycoprotein 4-beta-N-acetylglucosaminyltransferase activity(GO:0008454) |
| 0.2 | 0.7 | GO:0004126 | cytidine deaminase activity(GO:0004126) |
| 0.2 | 0.7 | GO:0016717 | oxidoreductase activity, acting on paired donors, with oxidation of a pair of donors resulting in the reduction of molecular oxygen to two molecules of water(GO:0016717) |
| 0.2 | 1.6 | GO:0030955 | potassium ion binding(GO:0030955) |
| 0.2 | 2.0 | GO:0030628 | pre-mRNA 3'-splice site binding(GO:0030628) |
| 0.2 | 0.2 | GO:0003691 | double-stranded telomeric DNA binding(GO:0003691) |
| 0.2 | 0.9 | GO:1902379 | chemoattractant activity involved in axon guidance(GO:1902379) |
| 0.2 | 4.7 | GO:0003684 | damaged DNA binding(GO:0003684) |
| 0.2 | 2.0 | GO:0002162 | dystroglycan binding(GO:0002162) |
| 0.2 | 2.2 | GO:0015193 | L-proline transmembrane transporter activity(GO:0015193) |
| 0.2 | 0.2 | GO:0005128 | erythropoietin receptor binding(GO:0005128) |
| 0.2 | 0.2 | GO:0034647 | histone demethylase activity (H3-trimethyl-K4 specific)(GO:0034647) |
| 0.2 | 0.4 | GO:0001160 | transcription termination site sequence-specific DNA binding(GO:0001147) transcription termination site DNA binding(GO:0001160) |
| 0.2 | 0.6 | GO:0035827 | rubidium ion transmembrane transporter activity(GO:0035827) |
| 0.2 | 1.3 | GO:0008294 | calcium- and calmodulin-responsive adenylate cyclase activity(GO:0008294) |
| 0.2 | 1.1 | GO:0004505 | phenylalanine 4-monooxygenase activity(GO:0004505) |
| 0.2 | 0.9 | GO:0015266 | protein channel activity(GO:0015266) |
| 0.2 | 0.6 | GO:0004045 | aminoacyl-tRNA hydrolase activity(GO:0004045) |
| 0.2 | 0.8 | GO:0004066 | asparagine synthase (glutamine-hydrolyzing) activity(GO:0004066) |
| 0.2 | 0.6 | GO:0047223 | beta-1,3-galactosyl-O-glycosyl-glycoprotein beta-1,3-N-acetylglucosaminyltransferase activity(GO:0047223) |
| 0.2 | 5.1 | GO:0071617 | lysophospholipid acyltransferase activity(GO:0071617) |
| 0.2 | 1.9 | GO:0035613 | RNA stem-loop binding(GO:0035613) |
| 0.2 | 28.2 | GO:0003729 | mRNA binding(GO:0003729) poly(A) RNA binding(GO:0044822) |
| 0.2 | 2.7 | GO:0045499 | chemorepellent activity(GO:0045499) |
| 0.2 | 3.3 | GO:0008483 | transaminase activity(GO:0008483) |
| 0.2 | 0.2 | GO:0003681 | bent DNA binding(GO:0003681) |
| 0.2 | 0.8 | GO:0008649 | rRNA methyltransferase activity(GO:0008649) |
| 0.2 | 1.9 | GO:0008656 | cysteine-type endopeptidase activator activity involved in apoptotic process(GO:0008656) |
| 0.2 | 0.6 | GO:0070138 | isopeptidase activity(GO:0070122) ubiquitin-like protein-specific isopeptidase activity(GO:0070138) SUMO-specific isopeptidase activity(GO:0070140) |
| 0.2 | 1.8 | GO:0002161 | aminoacyl-tRNA editing activity(GO:0002161) |
| 0.2 | 0.8 | GO:0003976 | UDP-N-acetylglucosamine-lysosomal-enzyme N-acetylglucosaminephosphotransferase activity(GO:0003976) |
| 0.2 | 0.6 | GO:0004677 | DNA-dependent protein kinase activity(GO:0004677) |
| 0.2 | 1.4 | GO:0015288 | porin activity(GO:0015288) |
| 0.2 | 0.4 | GO:0035243 | protein-arginine omega-N symmetric methyltransferase activity(GO:0035243) |
| 0.2 | 0.6 | GO:0042134 | rRNA primary transcript binding(GO:0042134) |
| 0.2 | 4.4 | GO:0070006 | metalloaminopeptidase activity(GO:0070006) |
| 0.2 | 1.6 | GO:0051428 | peptide hormone receptor binding(GO:0051428) |
| 0.2 | 1.0 | GO:0004111 | creatine kinase activity(GO:0004111) |
| 0.2 | 6.0 | GO:0004386 | helicase activity(GO:0004386) |
| 0.2 | 1.0 | GO:0047493 | sphingomyelin synthase activity(GO:0033188) ceramide cholinephosphotransferase activity(GO:0047493) |
| 0.2 | 0.2 | GO:0043024 | ribosomal small subunit binding(GO:0043024) |
| 0.2 | 2.0 | GO:0046966 | thyroid hormone receptor binding(GO:0046966) |
| 0.2 | 5.2 | GO:0003777 | microtubule motor activity(GO:0003777) |
| 0.2 | 11.8 | GO:0001104 | RNA polymerase II transcription cofactor activity(GO:0001104) |
| 0.2 | 0.8 | GO:0005283 | sodium:amino acid symporter activity(GO:0005283) cation:amino acid symporter activity(GO:0005416) |
| 0.2 | 1.1 | GO:1990405 | protein antigen binding(GO:1990405) |
| 0.2 | 0.2 | GO:0047238 | glucuronosyl-N-acetylgalactosaminyl-proteoglycan 4-beta-N-acetylgalactosaminyltransferase activity(GO:0047238) |
| 0.2 | 2.7 | GO:0017154 | semaphorin receptor activity(GO:0017154) |
| 0.2 | 1.9 | GO:0008379 | thioredoxin peroxidase activity(GO:0008379) |
| 0.2 | 4.2 | GO:0030676 | Rac guanyl-nucleotide exchange factor activity(GO:0030676) |
| 0.2 | 0.6 | GO:0002060 | purine nucleobase binding(GO:0002060) |
| 0.2 | 16.9 | GO:0004725 | protein tyrosine phosphatase activity(GO:0004725) |
| 0.2 | 0.8 | GO:0008097 | 5S rRNA binding(GO:0008097) |
| 0.2 | 0.4 | GO:0070815 | procollagen-lysine 5-dioxygenase activity(GO:0008475) peptidyl-lysine 5-dioxygenase activity(GO:0070815) |
| 0.2 | 2.8 | GO:0016594 | glycine binding(GO:0016594) |
| 0.2 | 3.2 | GO:0031210 | phosphatidylcholine binding(GO:0031210) |
| 0.2 | 1.9 | GO:0071933 | Arp2/3 complex binding(GO:0071933) |
| 0.2 | 0.6 | GO:0016721 | superoxide dismutase activity(GO:0004784) oxidoreductase activity, acting on superoxide radicals as acceptor(GO:0016721) |
| 0.2 | 0.9 | GO:0070012 | oligopeptidase activity(GO:0070012) |
| 0.2 | 0.4 | GO:0050833 | pyruvate transmembrane transporter activity(GO:0050833) |
| 0.2 | 5.3 | GO:0017091 | AU-rich element binding(GO:0017091) |
| 0.2 | 7.0 | GO:0004402 | histone acetyltransferase activity(GO:0004402) |
| 0.2 | 0.9 | GO:0070492 | oligosaccharide binding(GO:0070492) |
| 0.2 | 0.5 | GO:0018738 | S-formylglutathione hydrolase activity(GO:0018738) |
| 0.2 | 5.5 | GO:0035035 | histone acetyltransferase binding(GO:0035035) |
| 0.2 | 2.3 | GO:0016799 | hydrolase activity, hydrolyzing N-glycosyl compounds(GO:0016799) |
| 0.2 | 4.3 | GO:0043015 | gamma-tubulin binding(GO:0043015) |
| 0.2 | 3.9 | GO:0042813 | Wnt-activated receptor activity(GO:0042813) |
| 0.2 | 1.1 | GO:0008508 | bile acid:sodium symporter activity(GO:0008508) |
| 0.2 | 1.4 | GO:0031545 | peptidyl-proline 4-dioxygenase activity(GO:0031545) |
| 0.2 | 1.1 | GO:0050692 | DBD domain binding(GO:0050692) |
| 0.2 | 6.3 | GO:0070063 | RNA polymerase binding(GO:0070063) |
| 0.2 | 2.6 | GO:0042054 | histone methyltransferase activity(GO:0042054) |
| 0.2 | 0.5 | GO:0003845 | 11-beta-hydroxysteroid dehydrogenase [NAD(P)] activity(GO:0003845) |
| 0.2 | 0.3 | GO:0005124 | scavenger receptor binding(GO:0005124) |
| 0.2 | 3.2 | GO:0000049 | tRNA binding(GO:0000049) |
| 0.2 | 0.7 | GO:0045504 | dynein heavy chain binding(GO:0045504) |
| 0.2 | 1.7 | GO:0017166 | vinculin binding(GO:0017166) |
| 0.2 | 1.5 | GO:0017151 | DEAD/H-box RNA helicase binding(GO:0017151) |
| 0.2 | 1.2 | GO:0004969 | histamine receptor activity(GO:0004969) |
| 0.2 | 0.5 | GO:0004609 | phosphatidylserine decarboxylase activity(GO:0004609) |
| 0.2 | 1.0 | GO:0070182 | DNA polymerase binding(GO:0070182) |
| 0.2 | 0.5 | GO:0009041 | uridylate kinase activity(GO:0009041) |
| 0.2 | 4.9 | GO:0044183 | protein binding involved in protein folding(GO:0044183) |
| 0.2 | 0.3 | GO:0017150 | tRNA dihydrouridine synthase activity(GO:0017150) |
| 0.2 | 4.1 | GO:0016881 | acid-amino acid ligase activity(GO:0016881) |
| 0.2 | 1.1 | GO:0004013 | adenosylhomocysteinase activity(GO:0004013) trialkylsulfonium hydrolase activity(GO:0016802) |
| 0.2 | 1.1 | GO:0005313 | L-glutamate transmembrane transporter activity(GO:0005313) |
| 0.2 | 0.8 | GO:0008568 | microtubule-severing ATPase activity(GO:0008568) |
| 0.2 | 2.1 | GO:0034062 | RNA polymerase activity(GO:0034062) |
| 0.2 | 0.6 | GO:0050501 | hyaluronan synthase activity(GO:0050501) |
| 0.2 | 0.3 | GO:0008940 | nitrate reductase activity(GO:0008940) |
| 0.2 | 0.8 | GO:0004382 | guanosine-diphosphatase activity(GO:0004382) |
| 0.2 | 5.5 | GO:0005112 | Notch binding(GO:0005112) |
| 0.2 | 0.5 | GO:0050429 | calcium-dependent phospholipase C activity(GO:0050429) |
| 0.2 | 1.4 | GO:1901505 | carbohydrate derivative transporter activity(GO:1901505) |
| 0.2 | 23.1 | GO:0003714 | transcription corepressor activity(GO:0003714) |
| 0.2 | 0.2 | GO:0019153 | protein-disulfide reductase (glutathione) activity(GO:0019153) |
| 0.2 | 0.5 | GO:0030621 | U4 snRNA binding(GO:0030621) |
| 0.2 | 1.1 | GO:0005499 | vitamin D binding(GO:0005499) |
| 0.1 | 2.4 | GO:0016814 | hydrolase activity, acting on carbon-nitrogen (but not peptide) bonds, in cyclic amidines(GO:0016814) |
| 0.1 | 0.4 | GO:0004731 | purine-nucleoside phosphorylase activity(GO:0004731) |
| 0.1 | 0.4 | GO:0051747 | cytosine C-5 DNA demethylase activity(GO:0051747) |
| 0.1 | 4.6 | GO:0019213 | deacetylase activity(GO:0019213) |
| 0.1 | 2.7 | GO:0005229 | intracellular calcium activated chloride channel activity(GO:0005229) |
| 0.1 | 0.3 | GO:0016748 | succinyltransferase activity(GO:0016748) |
| 0.1 | 0.6 | GO:0016670 | oxidoreductase activity, acting on a sulfur group of donors, oxygen as acceptor(GO:0016670) |
| 0.1 | 0.4 | GO:0030060 | L-malate dehydrogenase activity(GO:0030060) |
| 0.1 | 1.4 | GO:0032794 | GTPase activating protein binding(GO:0032794) |
| 0.1 | 4.9 | GO:0004683 | calmodulin-dependent protein kinase activity(GO:0004683) |
| 0.1 | 0.4 | GO:0016742 | hydroxymethyl-, formyl- and related transferase activity(GO:0016742) |
| 0.1 | 0.7 | GO:0004430 | 1-phosphatidylinositol 4-kinase activity(GO:0004430) |
| 0.1 | 5.5 | GO:0017048 | Rho GTPase binding(GO:0017048) |
| 0.1 | 0.8 | GO:0004957 | prostaglandin E receptor activity(GO:0004957) |
| 0.1 | 0.5 | GO:0016508 | long-chain-enoyl-CoA hydratase activity(GO:0016508) |
| 0.1 | 1.2 | GO:0015368 | calcium:cation antiporter activity(GO:0015368) |
| 0.1 | 0.7 | GO:0016884 | carbon-nitrogen ligase activity, with glutamine as amido-N-donor(GO:0016884) |
| 0.1 | 3.7 | GO:0016876 | aminoacyl-tRNA ligase activity(GO:0004812) ligase activity, forming carbon-oxygen bonds(GO:0016875) ligase activity, forming aminoacyl-tRNA and related compounds(GO:0016876) |
| 0.1 | 1.2 | GO:0042162 | telomeric DNA binding(GO:0042162) |
| 0.1 | 1.2 | GO:0003873 | 6-phosphofructo-2-kinase activity(GO:0003873) fructose-2,6-bisphosphate 2-phosphatase activity(GO:0004331) |
| 0.1 | 0.9 | GO:0004117 | calmodulin-dependent cyclic-nucleotide phosphodiesterase activity(GO:0004117) calcium- and calmodulin-regulated 3',5'-cyclic-GMP phosphodiesterase activity(GO:0048101) |
| 0.1 | 7.3 | GO:0004004 | RNA helicase activity(GO:0003724) ATP-dependent RNA helicase activity(GO:0004004) RNA-dependent ATPase activity(GO:0008186) |
| 0.1 | 0.1 | GO:0008948 | oxaloacetate decarboxylase activity(GO:0008948) |
| 0.1 | 0.4 | GO:0004839 | ubiquitin activating enzyme activity(GO:0004839) |
| 0.1 | 2.4 | GO:0051400 | BH domain binding(GO:0051400) |
| 0.1 | 3.5 | GO:0008137 | NADH dehydrogenase (ubiquinone) activity(GO:0008137) NADH dehydrogenase (quinone) activity(GO:0050136) |
| 0.1 | 0.6 | GO:0047429 | nucleoside-triphosphate diphosphatase activity(GO:0047429) |
| 0.1 | 3.0 | GO:0000030 | mannosyltransferase activity(GO:0000030) |
| 0.1 | 1.2 | GO:0035251 | UDP-glucosyltransferase activity(GO:0035251) |
| 0.1 | 0.7 | GO:0008140 | cAMP response element binding protein binding(GO:0008140) |
| 0.1 | 0.5 | GO:0016635 | oxidoreductase activity, acting on the CH-CH group of donors, quinone or related compound as acceptor(GO:0016635) |
| 0.1 | 0.5 | GO:0004415 | hyalurononglucosaminidase activity(GO:0004415) |
| 0.1 | 0.6 | GO:0016778 | diphosphotransferase activity(GO:0016778) |
| 0.1 | 0.1 | GO:0002054 | nucleobase binding(GO:0002054) |
| 0.1 | 14.6 | GO:0008017 | microtubule binding(GO:0008017) |
| 0.1 | 12.6 | GO:0042393 | histone binding(GO:0042393) |
| 0.1 | 0.1 | GO:0004706 | JUN kinase kinase kinase activity(GO:0004706) |
| 0.1 | 0.3 | GO:0050252 | retinol O-fatty-acyltransferase activity(GO:0050252) |
| 0.1 | 0.7 | GO:0033743 | peptide-methionine (R)-S-oxide reductase activity(GO:0033743) |
| 0.1 | 6.3 | GO:0005544 | calcium-dependent phospholipid binding(GO:0005544) |
| 0.1 | 0.7 | GO:0015198 | oligopeptide transporter activity(GO:0015198) |
| 0.1 | 0.6 | GO:0070628 | proteasome binding(GO:0070628) |
| 0.1 | 0.6 | GO:0004065 | arylsulfatase activity(GO:0004065) |
| 0.1 | 0.3 | GO:0047256 | beta-galactosyl-N-acetylglucosaminylgalactosylglucosyl-ceramide beta-1,3-acetylglucosaminyltransferase activity(GO:0008457) lactosylceramide 1,3-N-acetyl-beta-D-glucosaminyltransferase activity(GO:0047256) |
| 0.1 | 5.3 | GO:0005160 | transforming growth factor beta receptor binding(GO:0005160) |
| 0.1 | 0.7 | GO:0036312 | phosphatidylinositol 3-kinase regulatory subunit binding(GO:0036312) |
| 0.1 | 0.8 | GO:0043422 | protein kinase B binding(GO:0043422) |
| 0.1 | 0.4 | GO:0008443 | 6-phosphofructokinase activity(GO:0003872) phosphofructokinase activity(GO:0008443) |
| 0.1 | 1.9 | GO:0048487 | beta-tubulin binding(GO:0048487) |
| 0.1 | 0.2 | GO:0004905 | interferon receptor activity(GO:0004904) type I interferon receptor activity(GO:0004905) type I interferon binding(GO:0019962) |
| 0.1 | 0.7 | GO:0004591 | oxoglutarate dehydrogenase (succinyl-transferring) activity(GO:0004591) |
| 0.1 | 87.0 | GO:0003723 | RNA binding(GO:0003723) |
| 0.1 | 0.7 | GO:0003993 | acid phosphatase activity(GO:0003993) |
| 0.1 | 0.2 | GO:0009019 | tRNA (guanine-N1-)-methyltransferase activity(GO:0009019) |
| 0.1 | 0.6 | GO:0016279 | lysine N-methyltransferase activity(GO:0016278) protein-lysine N-methyltransferase activity(GO:0016279) |
| 0.1 | 0.5 | GO:0098639 | collagen binding involved in cell-matrix adhesion(GO:0098639) |
| 0.1 | 0.3 | GO:0030156 | benzodiazepine receptor binding(GO:0030156) |
| 0.1 | 0.5 | GO:0061676 | importin-alpha family protein binding(GO:0061676) |
| 0.1 | 2.6 | GO:0004712 | protein serine/threonine/tyrosine kinase activity(GO:0004712) |
| 0.1 | 0.3 | GO:0034617 | tetrahydrobiopterin binding(GO:0034617) |
| 0.1 | 0.3 | GO:0043237 | laminin-1 binding(GO:0043237) |
| 0.1 | 0.5 | GO:0046920 | alpha-(1->3)-fucosyltransferase activity(GO:0046920) |
| 0.1 | 1.4 | GO:0016653 | oxidoreductase activity, acting on NAD(P)H, heme protein as acceptor(GO:0016653) |
| 0.1 | 0.4 | GO:0016174 | NAD(P)H oxidase activity(GO:0016174) |
| 0.1 | 0.3 | GO:0004510 | tryptophan 5-monooxygenase activity(GO:0004510) |
| 0.1 | 0.3 | GO:0005223 | intracellular cGMP activated cation channel activity(GO:0005223) |
| 0.1 | 0.2 | GO:0016273 | arginine N-methyltransferase activity(GO:0016273) protein-arginine N-methyltransferase activity(GO:0016274) |
| 0.1 | 1.1 | GO:0030215 | semaphorin receptor binding(GO:0030215) |
| 0.1 | 0.3 | GO:0005111 | type 2 fibroblast growth factor receptor binding(GO:0005111) |
| 0.1 | 0.2 | GO:0016979 | lipoate-protein ligase activity(GO:0016979) |
| 0.1 | 0.5 | GO:0008195 | phosphatidate phosphatase activity(GO:0008195) |
| 0.1 | 0.9 | GO:0038191 | neuropilin binding(GO:0038191) |
| 0.1 | 2.5 | GO:0043394 | proteoglycan binding(GO:0043394) |
| 0.1 | 1.2 | GO:0015932 | nucleobase-containing compound transmembrane transporter activity(GO:0015932) |
| 0.1 | 0.7 | GO:0098821 | BMP receptor activity(GO:0098821) |
| 0.1 | 0.2 | GO:0003979 | UDP-glucose 6-dehydrogenase activity(GO:0003979) |
| 0.1 | 1.0 | GO:0016500 | protein-hormone receptor activity(GO:0016500) |
| 0.1 | 0.6 | GO:0016878 | acid-thiol ligase activity(GO:0016878) |
| 0.1 | 0.3 | GO:0004720 | protein-lysine 6-oxidase activity(GO:0004720) |
| 0.1 | 0.6 | GO:0017147 | Wnt-protein binding(GO:0017147) |
| 0.1 | 0.7 | GO:0046934 | phosphatidylinositol-4,5-bisphosphate 3-kinase activity(GO:0046934) phosphatidylinositol bisphosphate kinase activity(GO:0052813) |
| 0.1 | 1.2 | GO:0051539 | 4 iron, 4 sulfur cluster binding(GO:0051539) |
| 0.1 | 2.3 | GO:0004715 | non-membrane spanning protein tyrosine kinase activity(GO:0004715) |
| 0.1 | 0.6 | GO:0042500 | aspartic endopeptidase activity, intramembrane cleaving(GO:0042500) |
| 0.1 | 0.2 | GO:0016300 | tRNA (uracil) methyltransferase activity(GO:0016300) |
| 0.1 | 0.9 | GO:0046933 | proton-transporting ATP synthase activity, rotational mechanism(GO:0046933) |
| 0.1 | 0.2 | GO:0008384 | IkappaB kinase activity(GO:0008384) |
| 0.1 | 0.1 | GO:0001156 | TFIIIC-class transcription factor binding(GO:0001156) |
| 0.1 | 3.5 | GO:0003823 | antigen binding(GO:0003823) |
| 0.1 | 27.0 | GO:0004842 | ubiquitin-protein transferase activity(GO:0004842) |
| 0.1 | 0.3 | GO:0043532 | angiostatin binding(GO:0043532) |
| 0.1 | 0.3 | GO:0004920 | interleukin-10 receptor activity(GO:0004920) |
| 0.1 | 0.3 | GO:0008240 | tripeptidyl-peptidase activity(GO:0008240) |
| 0.1 | 0.2 | GO:0004301 | epoxide hydrolase activity(GO:0004301) |
| 0.1 | 0.1 | GO:0000386 | second spliceosomal transesterification activity(GO:0000386) |
| 0.1 | 0.2 | GO:0004800 | thyroxine 5'-deiodinase activity(GO:0004800) |
| 0.1 | 0.1 | GO:0016505 | peptidase activator activity involved in apoptotic process(GO:0016505) |
| 0.1 | 1.2 | GO:0030291 | protein serine/threonine kinase inhibitor activity(GO:0030291) |
| 0.1 | 0.3 | GO:0000064 | L-ornithine transmembrane transporter activity(GO:0000064) |
| 0.1 | 19.8 | GO:0004674 | protein serine/threonine kinase activity(GO:0004674) |
| 0.1 | 1.4 | GO:0008028 | monocarboxylic acid transmembrane transporter activity(GO:0008028) |
| 0.1 | 0.3 | GO:0042289 | MHC class II protein binding(GO:0042289) |
| 0.1 | 1.1 | GO:0009055 | electron carrier activity(GO:0009055) |
| 0.1 | 0.8 | GO:0015347 | sodium-independent organic anion transmembrane transporter activity(GO:0015347) |
| 0.1 | 0.9 | GO:0043022 | ribosome binding(GO:0043022) |
| 0.1 | 0.3 | GO:0047631 | ADP-ribose diphosphatase activity(GO:0047631) |
| 0.1 | 0.1 | GO:0001849 | complement component C1q binding(GO:0001849) |
| 0.1 | 1.9 | GO:0004519 | endonuclease activity(GO:0004519) |
| 0.1 | 0.1 | GO:0016624 | oxidoreductase activity, acting on the aldehyde or oxo group of donors, disulfide as acceptor(GO:0016624) |
| 0.1 | 14.3 | GO:0005096 | GTPase activator activity(GO:0005096) |
| 0.0 | 0.6 | GO:0070300 | phosphatidic acid binding(GO:0070300) |
| 0.0 | 1.4 | GO:0019707 | protein-cysteine S-palmitoyltransferase activity(GO:0019706) protein-cysteine S-acyltransferase activity(GO:0019707) |
| 0.0 | 0.3 | GO:0046527 | glucosyltransferase activity(GO:0046527) |
| 0.0 | 0.1 | GO:0045134 | uridine-diphosphatase activity(GO:0045134) |
| 0.0 | 0.1 | GO:0003829 | beta-1,3-galactosyl-O-glycosyl-glycoprotein beta-1,6-N-acetylglucosaminyltransferase activity(GO:0003829) |
| 0.0 | 0.1 | GO:0004616 | phosphogluconate dehydrogenase (decarboxylating) activity(GO:0004616) |
| 0.0 | 2.4 | GO:0016765 | transferase activity, transferring alkyl or aryl (other than methyl) groups(GO:0016765) |
| 0.0 | 0.2 | GO:0004367 | glycerol-3-phosphate dehydrogenase [NAD+] activity(GO:0004367) |
| 0.0 | 0.2 | GO:0001602 | pancreatic polypeptide receptor activity(GO:0001602) |
| 0.0 | 0.5 | GO:0003854 | 3-beta-hydroxy-delta5-steroid dehydrogenase activity(GO:0003854) |
| 0.0 | 0.7 | GO:0016780 | phosphotransferase activity, for other substituted phosphate groups(GO:0016780) |
| 0.0 | 0.3 | GO:0004767 | sphingomyelin phosphodiesterase activity(GO:0004767) |
| 0.0 | 2.6 | GO:0008168 | methyltransferase activity(GO:0008168) |
| 0.0 | 0.1 | GO:0070051 | fibrinogen binding(GO:0070051) |
| 0.0 | 0.1 | GO:0031369 | translation initiation factor binding(GO:0031369) |
| 0.0 | 1.0 | GO:0008376 | acetylgalactosaminyltransferase activity(GO:0008376) |
| 0.0 | 0.1 | GO:0052594 | tryptamine:oxygen oxidoreductase (deaminating) activity(GO:0052593) aminoacetone:oxygen oxidoreductase(deaminating) activity(GO:0052594) aliphatic-amine oxidase activity(GO:0052595) phenethylamine:oxygen oxidoreductase (deaminating) activity(GO:0052596) |
| 0.0 | 0.3 | GO:0031730 | CCR5 chemokine receptor binding(GO:0031730) |
| 0.0 | 0.1 | GO:0015037 | peptide disulfide oxidoreductase activity(GO:0015037) |
| 0.0 | 0.2 | GO:0034594 | phosphatidylinositol trisphosphate phosphatase activity(GO:0034594) |
| 0.0 | 0.2 | GO:0003835 | beta-galactoside alpha-2,6-sialyltransferase activity(GO:0003835) |
| 0.0 | 0.4 | GO:0003950 | NAD+ ADP-ribosyltransferase activity(GO:0003950) |
| 0.0 | 0.3 | GO:0036374 | glutathione hydrolase activity(GO:0036374) |
| 0.0 | 0.3 | GO:0038062 | protein tyrosine kinase collagen receptor activity(GO:0038062) |
| 0.0 | 0.2 | GO:0008046 | axon guidance receptor activity(GO:0008046) |
| 0.0 | 0.2 | GO:0047498 | calcium-dependent phospholipase A2 activity(GO:0047498) |
| 0.0 | 0.2 | GO:0043021 | ribonucleoprotein complex binding(GO:0043021) |
| 0.0 | 0.1 | GO:0003998 | acylphosphatase activity(GO:0003998) |
| 0.0 | 0.2 | GO:0051378 | serotonin binding(GO:0051378) |
| 0.0 | 0.1 | GO:0098988 | G-protein coupled glutamate receptor activity(GO:0098988) |
| 0.0 | 0.0 | GO:0004528 | phosphodiesterase I activity(GO:0004528) |
| 0.0 | 0.1 | GO:0004658 | propionyl-CoA carboxylase activity(GO:0004658) |
| 0.0 | 0.1 | GO:0032454 | histone demethylase activity (H3-K9 specific)(GO:0032454) |
| 0.0 | 0.1 | GO:0034185 | apolipoprotein binding(GO:0034185) |
| 0.0 | 0.1 | GO:0001517 | N-acetylglucosamine 6-O-sulfotransferase activity(GO:0001517) |
| 0.0 | 0.1 | GO:0072345 | NAADP-sensitive calcium-release channel activity(GO:0072345) |
| 0.0 | 0.1 | GO:0005326 | neurotransmitter transporter activity(GO:0005326) |
| 0.0 | 1.2 | GO:0003712 | transcription cofactor activity(GO:0003712) |
| 0.0 | 0.1 | GO:0015279 | store-operated calcium channel activity(GO:0015279) |
| 0.0 | 0.5 | GO:0042826 | histone deacetylase binding(GO:0042826) |
| 0.0 | 0.0 | GO:0004176 | ATP-dependent peptidase activity(GO:0004176) |
| 0.0 | 0.2 | GO:0016854 | racemase and epimerase activity(GO:0016854) |
| 0.0 | 1.1 | GO:0004222 | metalloendopeptidase activity(GO:0004222) |
| 0.0 | 0.4 | GO:0017112 | Rab guanyl-nucleotide exchange factor activity(GO:0017112) |
| 0.0 | 0.0 | GO:0004492 | methylmalonyl-CoA decarboxylase activity(GO:0004492) |
Gene overrepresentation in curated gene sets: canonical pathways category:
| Log-likelihood per target | Total log-likelihood | Term | Description |
|---|---|---|---|
| 3.1 | 49.8 | SA REG CASCADE OF CYCLIN EXPR | Expression of cyclins regulates progression through the cell cycle by activating cyclin-dependent kinases. |
| 1.3 | 62.6 | PID AURORA B PATHWAY | Aurora B signaling |
| 1.2 | 56.0 | PID ATR PATHWAY | ATR signaling pathway |
| 1.1 | 51.4 | PID PLK1 PATHWAY | PLK1 signaling events |
| 1.0 | 4.1 | PID EPO PATHWAY | EPO signaling pathway |
| 1.0 | 16.9 | PID RANBP2 PATHWAY | Sumoylation by RanBP2 regulates transcriptional repression |
| 1.0 | 1.0 | PID P38 ALPHA BETA PATHWAY | Regulation of p38-alpha and p38-beta |
| 1.0 | 105.6 | PID MYC ACTIV PATHWAY | Validated targets of C-MYC transcriptional activation |
| 0.8 | 25.1 | PID FANCONI PATHWAY | Fanconi anemia pathway |
| 0.7 | 50.3 | PID E2F PATHWAY | E2F transcription factor network |
| 0.7 | 10.9 | PID BARD1 PATHWAY | BARD1 signaling events |
| 0.7 | 3.9 | SA PTEN PATHWAY | PTEN is a tumor suppressor that dephosphorylates the lipid messenger phosphatidylinositol triphosphate. |
| 0.6 | 33.8 | PID ILK PATHWAY | Integrin-linked kinase signaling |
| 0.6 | 4.4 | SA FAS SIGNALING | The TNF-type receptor Fas induces apoptosis on ligand binding. |
| 0.6 | 1.2 | PID EPHA2 FWD PATHWAY | EPHA2 forward signaling |
| 0.6 | 1.8 | PID MYC PATHWAY | C-MYC pathway |
| 0.6 | 11.1 | PID SMAD2 3PATHWAY | Regulation of cytoplasmic and nuclear SMAD2/3 signaling |
| 0.5 | 34.3 | PID P53 REGULATION PATHWAY | p53 pathway |
| 0.5 | 2.0 | PID ERB GENOMIC PATHWAY | Validated nuclear estrogen receptor beta network |
| 0.5 | 22.2 | PID HDAC CLASSII PATHWAY | Signaling events mediated by HDAC Class II |
| 0.4 | 36.9 | PID NOTCH PATHWAY | Notch signaling pathway |
| 0.4 | 0.4 | ST JAK STAT PATHWAY | Jak-STAT Pathway |
| 0.4 | 8.9 | PID HEDGEHOG 2PATHWAY | Signaling events mediated by the Hedgehog family |
| 0.4 | 17.2 | ST ERK1 ERK2 MAPK PATHWAY | ERK1/ERK2 MAPK Pathway |
| 0.4 | 24.7 | PID ERA GENOMIC PATHWAY | Validated nuclear estrogen receptor alpha network |
| 0.4 | 13.8 | PID TRAIL PATHWAY | TRAIL signaling pathway |
| 0.4 | 5.2 | PID NEPHRIN NEPH1 PATHWAY | Nephrin/Neph1 signaling in the kidney podocyte |
| 0.3 | 5.6 | PID ATM PATHWAY | ATM pathway |
| 0.3 | 23.8 | PID INSULIN PATHWAY | Insulin Pathway |
| 0.3 | 9.7 | PID INTEGRIN A4B1 PATHWAY | Alpha4 beta1 integrin signaling events |
| 0.3 | 4.2 | PID PDGFRA PATHWAY | PDGFR-alpha signaling pathway |
| 0.3 | 8.7 | PID WNT SIGNALING PATHWAY | Wnt signaling network |
| 0.3 | 4.1 | PID GLYPICAN 1PATHWAY | Glypican 1 network |
| 0.3 | 0.6 | SA TRKA RECEPTOR | The TrkA receptor binds nerve growth factor to activate MAP kinase pathways and promote cell growth. |
| 0.3 | 0.6 | PID THROMBIN PAR1 PATHWAY | PAR1-mediated thrombin signaling events |
| 0.3 | 8.4 | PID ALK1 PATHWAY | ALK1 signaling events |
| 0.3 | 4.0 | PID RB 1PATHWAY | Regulation of retinoblastoma protein |
| 0.3 | 12.2 | PID AR TF PATHWAY | Regulation of Androgen receptor activity |
| 0.3 | 6.9 | ST DIFFERENTIATION PATHWAY IN PC12 CELLS | Differentiation Pathway in PC12 Cells; this is a specific case of PAC1 Receptor Pathway. |
| 0.3 | 9.4 | PID CASPASE PATHWAY | Caspase cascade in apoptosis |
| 0.3 | 9.1 | PID FAK PATHWAY | Signaling events mediated by focal adhesion kinase |
| 0.3 | 16.2 | PID SMAD2 3NUCLEAR PATHWAY | Regulation of nuclear SMAD2/3 signaling |
| 0.3 | 7.0 | PID AMB2 NEUTROPHILS PATHWAY | amb2 Integrin signaling |
| 0.3 | 1.5 | PID PI3K PLC TRK PATHWAY | Trk receptor signaling mediated by PI3K and PLC-gamma |
| 0.2 | 4.0 | PID NFKAPPAB CANONICAL PATHWAY | Canonical NF-kappaB pathway |
| 0.2 | 14.6 | PID CDC42 PATHWAY | CDC42 signaling events |
| 0.2 | 8.2 | PID DELTA NP63 PATHWAY | Validated transcriptional targets of deltaNp63 isoforms |
| 0.2 | 3.5 | PID ERBB2 ERBB3 PATHWAY | ErbB2/ErbB3 signaling events |
| 0.2 | 1.6 | PID NFKAPPAB ATYPICAL PATHWAY | Atypical NF-kappaB pathway |
| 0.2 | 2.0 | PID S1P S1P4 PATHWAY | S1P4 pathway |
| 0.2 | 1.6 | PID HIF1A PATHWAY | Hypoxic and oxygen homeostasis regulation of HIF-1-alpha |
| 0.2 | 1.3 | ST B CELL ANTIGEN RECEPTOR | B Cell Antigen Receptor |
| 0.2 | 6.4 | PID EPHA FWDPATHWAY | EPHA forward signaling |
| 0.2 | 2.2 | PID PS1 PATHWAY | Presenilin action in Notch and Wnt signaling |
| 0.2 | 6.4 | PID TGFBR PATHWAY | TGF-beta receptor signaling |
| 0.2 | 0.4 | PID GMCSF PATHWAY | GMCSF-mediated signaling events |
| 0.2 | 3.4 | SA CASPASE CASCADE | Apoptosis is mediated by caspases, cysteine proteases arranged in a proteolytic cascade. |
| 0.2 | 3.9 | PID PI3KCI AKT PATHWAY | Class I PI3K signaling events mediated by Akt |
| 0.2 | 4.9 | ST MYOCYTE AD PATHWAY | Myocyte Adrenergic Pathway is a specific case of the generalized Adrenergic Pathway. |
| 0.2 | 5.0 | PID NFAT 3PATHWAY | Role of Calcineurin-dependent NFAT signaling in lymphocytes |
| 0.2 | 6.8 | PID MTOR 4PATHWAY | mTOR signaling pathway |
| 0.2 | 2.1 | ST GA12 PATHWAY | G alpha 12 Pathway |
| 0.2 | 0.2 | PID HIV NEF PATHWAY | HIV-1 Nef: Negative effector of Fas and TNF-alpha |
| 0.2 | 3.1 | PID MET PATHWAY | Signaling events mediated by Hepatocyte Growth Factor Receptor (c-Met) |
| 0.2 | 2.7 | PID WNT NONCANONICAL PATHWAY | Noncanonical Wnt signaling pathway |
| 0.2 | 1.3 | ST TYPE I INTERFERON PATHWAY | Type I Interferon (alpha/beta IFN) Pathway |
| 0.2 | 4.5 | PID HIF2PATHWAY | HIF-2-alpha transcription factor network |
| 0.2 | 9.4 | PID AVB3 INTEGRIN PATHWAY | Integrins in angiogenesis |
| 0.1 | 0.3 | SA G2 AND M PHASES | Cdc25 activates the cdc2/cyclin B complex to induce the G2/M transition. |
| 0.1 | 4.0 | PID CDC42 REG PATHWAY | Regulation of CDC42 activity |
| 0.1 | 2.2 | SIG CHEMOTAXIS | Genes related to chemotaxis |
| 0.1 | 6.7 | PID AR PATHWAY | Coregulation of Androgen receptor activity |
| 0.1 | 2.0 | PID IL2 PI3K PATHWAY | IL2 signaling events mediated by PI3K |
| 0.1 | 0.6 | PID ANTHRAX PATHWAY | Cellular roles of Anthrax toxin |
| 0.1 | 1.0 | PID FAS PATHWAY | FAS (CD95) signaling pathway |
| 0.1 | 1.2 | PID VEGFR1 PATHWAY | VEGFR1 specific signals |
| 0.1 | 0.3 | PID TCR RAS PATHWAY | Ras signaling in the CD4+ TCR pathway |
| 0.1 | 1.0 | PID ANGIOPOIETIN RECEPTOR PATHWAY | Angiopoietin receptor Tie2-mediated signaling |
| 0.1 | 4.5 | ST FAS SIGNALING PATHWAY | Fas Signaling Pathway |
| 0.1 | 3.1 | PID SHP2 PATHWAY | SHP2 signaling |
| 0.1 | 3.9 | PID LKB1 PATHWAY | LKB1 signaling events |
| 0.1 | 1.1 | PID P38 MK2 PATHWAY | p38 signaling mediated by MAPKAP kinases |
| 0.1 | 0.3 | PID ALK2 PATHWAY | ALK2 signaling events |
| 0.1 | 3.6 | PID HIF1 TFPATHWAY | HIF-1-alpha transcription factor network |
| 0.1 | 0.8 | PID S1P S1P1 PATHWAY | S1P1 pathway |
| 0.1 | 6.9 | PID P53 DOWNSTREAM PATHWAY | Direct p53 effectors |
| 0.1 | 0.8 | ST PHOSPHOINOSITIDE 3 KINASE PATHWAY | PI3K Pathway |
| 0.1 | 0.3 | ST IL 13 PATHWAY | Interleukin 13 (IL-13) Pathway |
| 0.1 | 0.2 | NABA BASEMENT MEMBRANES | Genes encoding structural components of basement membranes |
| 0.1 | 0.8 | PID CERAMIDE PATHWAY | Ceramide signaling pathway |
| 0.1 | 0.9 | PID VEGFR1 2 PATHWAY | Signaling events mediated by VEGFR1 and VEGFR2 |
| 0.1 | 1.5 | PID FGF PATHWAY | FGF signaling pathway |
| 0.1 | 2.8 | PID RAC1 REG PATHWAY | Regulation of RAC1 activity |
| 0.1 | 1.3 | PID HNF3A PATHWAY | FOXA1 transcription factor network |
| 0.1 | 0.2 | PID AVB3 OPN PATHWAY | Osteopontin-mediated events |
| 0.1 | 0.9 | PID BCR 5PATHWAY | BCR signaling pathway |
| 0.1 | 0.8 | PID PTP1B PATHWAY | Signaling events mediated by PTP1B |
| 0.1 | 1.9 | PID TELOMERASE PATHWAY | Regulation of Telomerase |
| 0.1 | 0.1 | ST GAQ PATHWAY | G alpha q Pathway |
| 0.1 | 0.3 | PID TCR JNK PATHWAY | JNK signaling in the CD4+ TCR pathway |
| 0.1 | 0.3 | PID P38 GAMMA DELTA PATHWAY | Signaling mediated by p38-gamma and p38-delta |
| 0.0 | 0.9 | PID INTEGRIN A9B1 PATHWAY | Alpha9 beta1 integrin signaling events |
| 0.0 | 0.7 | PID ALPHA SYNUCLEIN PATHWAY | Alpha-synuclein signaling |
| 0.0 | 0.8 | PID CXCR4 PATHWAY | CXCR4-mediated signaling events |
| 0.0 | 0.1 | PID ECADHERIN NASCENT AJ PATHWAY | E-cadherin signaling in the nascent adherens junction |
| 0.0 | 0.0 | ST INTERFERON GAMMA PATHWAY | Interferon gamma pathway. |
| 0.0 | 0.6 | PID NCADHERIN PATHWAY | N-cadherin signaling events |
| 0.0 | 0.6 | PID HDAC CLASSI PATHWAY | Signaling events mediated by HDAC Class I |
| 0.0 | 0.3 | PID UPA UPAR PATHWAY | Urokinase-type plasminogen activator (uPA) and uPAR-mediated signaling |
| 0.0 | 0.9 | PID RHOA REG PATHWAY | Regulation of RhoA activity |
| 0.0 | 0.3 | PID ERBB1 DOWNSTREAM PATHWAY | ErbB1 downstream signaling |
| 0.0 | 0.1 | PID IL27 PATHWAY | IL27-mediated signaling events |
| 0.0 | 0.2 | PID IL23 PATHWAY | IL23-mediated signaling events |
Gene overrepresentation in curated gene sets: REACTOME pathways category:
| Log-likelihood per target | Total log-likelihood | Term | Description |
|---|---|---|---|
| 3.8 | 30.1 | REACTOME APOBEC3G MEDIATED RESISTANCE TO HIV1 INFECTION | Genes involved in APOBEC3G mediated resistance to HIV-1 infection |
| 2.6 | 66.8 | REACTOME G0 AND EARLY G1 | Genes involved in G0 and Early G1 |
| 2.4 | 25.9 | REACTOME G1 S SPECIFIC TRANSCRIPTION | Genes involved in G1/S-Specific Transcription |
| 2.3 | 67.1 | REACTOME ACTIVATION OF THE PRE REPLICATIVE COMPLEX | Genes involved in Activation of the pre-replicative complex |
| 2.3 | 2.3 | REACTOME E2F ENABLED INHIBITION OF PRE REPLICATION COMPLEX FORMATION | Genes involved in E2F-enabled inhibition of pre-replication complex formation |
| 1.8 | 10.8 | REACTOME ASSOCIATION OF LICENSING FACTORS WITH THE PRE REPLICATIVE COMPLEX | Genes involved in Association of licensing factors with the pre-replicative complex |
| 1.7 | 20.1 | REACTOME CYCLIN A B1 ASSOCIATED EVENTS DURING G2 M TRANSITION | Genes involved in Cyclin A/B1 associated events during G2/M transition |
| 1.6 | 24.8 | REACTOME APOPTOSIS INDUCED DNA FRAGMENTATION | Genes involved in Apoptosis induced DNA fragmentation |
| 1.4 | 9.8 | REACTOME PROCESSIVE SYNTHESIS ON THE LAGGING STRAND | Genes involved in Processive synthesis on the lagging strand |
| 1.4 | 5.5 | REACTOME LAGGING STRAND SYNTHESIS | Genes involved in Lagging Strand Synthesis |
| 1.3 | 7.7 | REACTOME REGULATION OF THE FANCONI ANEMIA PATHWAY | Genes involved in Regulation of the Fanconi anemia pathway |
| 1.3 | 25.2 | REACTOME SEMA3A PAK DEPENDENT AXON REPULSION | Genes involved in Sema3A PAK dependent Axon repulsion |
| 1.3 | 13.8 | REACTOME RECEPTOR LIGAND BINDING INITIATES THE SECOND PROTEOLYTIC CLEAVAGE OF NOTCH RECEPTOR | Genes involved in Receptor-ligand binding initiates the second proteolytic cleavage of Notch receptor |
| 1.2 | 14.8 | REACTOME SLBP DEPENDENT PROCESSING OF REPLICATION DEPENDENT HISTONE PRE MRNAS | Genes involved in SLBP Dependent Processing of Replication-Dependent Histone Pre-mRNAs |
| 1.1 | 4.6 | REACTOME G2 M DNA DAMAGE CHECKPOINT | Genes involved in G2/M DNA damage checkpoint |
| 1.1 | 29.5 | REACTOME KINESINS | Genes involved in Kinesins |
| 1.0 | 10.6 | REACTOME CRMPS IN SEMA3A SIGNALING | Genes involved in CRMPs in Sema3A signaling |
| 1.0 | 13.5 | REACTOME HOMOLOGOUS RECOMBINATION REPAIR OF REPLICATION INDEPENDENT DOUBLE STRAND BREAKS | Genes involved in Homologous recombination repair of replication-independent double-strand breaks |
| 0.9 | 9.4 | REACTOME MRNA DECAY BY 3 TO 5 EXORIBONUCLEASE | Genes involved in mRNA Decay by 3' to 5' Exoribonuclease |
| 0.9 | 11.3 | REACTOME ACTIVATION OF RAC | Genes involved in Activation of Rac |
| 0.9 | 7.5 | REACTOME EXTENSION OF TELOMERES | Genes involved in Extension of Telomeres |
| 0.9 | 28.5 | REACTOME TRANSPORT OF RIBONUCLEOPROTEINS INTO THE HOST NUCLEUS | Genes involved in Transport of Ribonucleoproteins into the Host Nucleus |
| 0.9 | 0.9 | REACTOME NEP NS2 INTERACTS WITH THE CELLULAR EXPORT MACHINERY | Genes involved in NEP/NS2 Interacts with the Cellular Export Machinery |
| 0.8 | 8.5 | REACTOME ERKS ARE INACTIVATED | Genes involved in ERKs are inactivated |
| 0.8 | 0.8 | REACTOME INHIBITION OF REPLICATION INITIATION OF DAMAGED DNA BY RB1 E2F1 | Genes involved in Inhibition of replication initiation of damaged DNA by RB1/E2F1 |
| 0.8 | 18.1 | REACTOME RNA POL I TRANSCRIPTION TERMINATION | Genes involved in RNA Polymerase I Transcription Termination |
| 0.8 | 22.0 | REACTOME DEADENYLATION OF MRNA | Genes involved in Deadenylation of mRNA |
| 0.8 | 26.5 | REACTOME FATTY ACYL COA BIOSYNTHESIS | Genes involved in Fatty Acyl-CoA Biosynthesis |
| 0.7 | 68.8 | REACTOME MITOTIC PROMETAPHASE | Genes involved in Mitotic Prometaphase |
| 0.7 | 16.7 | REACTOME RNA POL I TRANSCRIPTION | Genes involved in RNA Polymerase I Transcription |
| 0.7 | 0.7 | REACTOME 3 UTR MEDIATED TRANSLATIONAL REGULATION | Genes involved in 3' -UTR-mediated translational regulation |
| 0.7 | 3.4 | REACTOME INFLUENZA VIRAL RNA TRANSCRIPTION AND REPLICATION | Genes involved in Influenza Viral RNA Transcription and Replication |
| 0.7 | 15.1 | REACTOME FORMATION OF TUBULIN FOLDING INTERMEDIATES BY CCT TRIC | Genes involved in Formation of tubulin folding intermediates by CCT/TriC |
| 0.7 | 7.4 | REACTOME BILE SALT AND ORGANIC ANION SLC TRANSPORTERS | Genes involved in Bile salt and organic anion SLC transporters |
| 0.7 | 8.0 | REACTOME FANCONI ANEMIA PATHWAY | Genes involved in Fanconi Anemia pathway |
| 0.7 | 39.9 | REACTOME LOSS OF NLP FROM MITOTIC CENTROSOMES | Genes involved in Loss of Nlp from mitotic centrosomes |
| 0.7 | 5.3 | REACTOME ANDROGEN BIOSYNTHESIS | Genes involved in Androgen biosynthesis |
| 0.7 | 9.1 | REACTOME PURINE RIBONUCLEOSIDE MONOPHOSPHATE BIOSYNTHESIS | Genes involved in Purine ribonucleoside monophosphate biosynthesis |
| 0.7 | 9.8 | REACTOME TETRAHYDROBIOPTERIN BH4 SYNTHESIS RECYCLING SALVAGE AND REGULATION | Genes involved in Tetrahydrobiopterin (BH4) synthesis, recycling, salvage and regulation |
| 0.6 | 0.6 | REACTOME P75NTR RECRUITS SIGNALLING COMPLEXES | Genes involved in p75NTR recruits signalling complexes |
| 0.6 | 8.2 | REACTOME REGULATION OF PYRUVATE DEHYDROGENASE PDH COMPLEX | Genes involved in Regulation of pyruvate dehydrogenase (PDH) complex |
| 0.6 | 16.1 | REACTOME AMINO ACID SYNTHESIS AND INTERCONVERSION TRANSAMINATION | Genes involved in Amino acid synthesis and interconversion (transamination) |
| 0.6 | 16.7 | REACTOME PYRIMIDINE METABOLISM | Genes involved in Pyrimidine metabolism |
| 0.5 | 28.1 | REACTOME FORMATION OF THE TERNARY COMPLEX AND SUBSEQUENTLY THE 43S COMPLEX | Genes involved in Formation of the ternary complex, and subsequently, the 43S complex |
| 0.5 | 3.1 | REACTOME NRIF SIGNALS CELL DEATH FROM THE NUCLEUS | Genes involved in NRIF signals cell death from the nucleus |
| 0.5 | 24.6 | REACTOME VOLTAGE GATED POTASSIUM CHANNELS | Genes involved in Voltage gated Potassium channels |
| 0.5 | 1.0 | REACTOME TGF BETA RECEPTOR SIGNALING IN EMT EPITHELIAL TO MESENCHYMAL TRANSITION | Genes involved in TGF-beta receptor signaling in EMT (epithelial to mesenchymal transition) |
| 0.5 | 9.7 | REACTOME ACYL CHAIN REMODELLING OF PG | Genes involved in Acyl chain remodelling of PG |
| 0.5 | 13.1 | REACTOME SIGNALING BY NODAL | Genes involved in Signaling by NODAL |
| 0.5 | 7.4 | REACTOME FGFR2C LIGAND BINDING AND ACTIVATION | Genes involved in FGFR2c ligand binding and activation |
| 0.5 | 7.9 | REACTOME GABA A RECEPTOR ACTIVATION | Genes involved in GABA A receptor activation |
| 0.5 | 1.0 | REACTOME INTERACTIONS OF VPR WITH HOST CELLULAR PROTEINS | Genes involved in Interactions of Vpr with host cellular proteins |
| 0.5 | 5.2 | REACTOME NEGATIVE REGULATION OF THE PI3K AKT NETWORK | Genes involved in Negative regulation of the PI3K/AKT network |
| 0.5 | 7.4 | REACTOME METABOLISM OF POLYAMINES | Genes involved in Metabolism of polyamines |
| 0.5 | 6.9 | REACTOME ACTIVATION OF IRF3 IRF7 MEDIATED BY TBK1 IKK EPSILON | Genes involved in Activation of IRF3/IRF7 mediated by TBK1/IKK epsilon |
| 0.5 | 4.1 | REACTOME INTEGRATION OF PROVIRUS | Genes involved in Integration of provirus |
| 0.5 | 31.3 | REACTOME PEPTIDE CHAIN ELONGATION | Genes involved in Peptide chain elongation |
| 0.4 | 11.2 | REACTOME CHOLESTEROL BIOSYNTHESIS | Genes involved in Cholesterol biosynthesis |
| 0.4 | 16.6 | REACTOME ANTIVIRAL MECHANISM BY IFN STIMULATED GENES | Genes involved in Antiviral mechanism by IFN-stimulated genes |
| 0.4 | 7.5 | REACTOME METABOLISM OF NON CODING RNA | Genes involved in Metabolism of non-coding RNA |
| 0.4 | 10.3 | REACTOME SYNTHESIS AND INTERCONVERSION OF NUCLEOTIDE DI AND TRIPHOSPHATES | Genes involved in Synthesis and interconversion of nucleotide di- and triphosphates |
| 0.4 | 0.9 | REACTOME DOUBLE STRAND BREAK REPAIR | Genes involved in Double-Strand Break Repair |
| 0.4 | 1.6 | REACTOME ACTIVATED POINT MUTANTS OF FGFR2 | Genes involved in Activated point mutants of FGFR2 |
| 0.4 | 20.6 | REACTOME MITOCHONDRIAL PROTEIN IMPORT | Genes involved in Mitochondrial Protein Import |
| 0.4 | 6.0 | REACTOME PROCESSING OF CAPPED INTRONLESS PRE MRNA | Genes involved in Processing of Capped Intronless Pre-mRNA |
| 0.4 | 15.9 | REACTOME DEPOSITION OF NEW CENPA CONTAINING NUCLEOSOMES AT THE CENTROMERE | Genes involved in Deposition of New CENPA-containing Nucleosomes at the Centromere |
| 0.4 | 10.1 | REACTOME ACTIVATED NOTCH1 TRANSMITS SIGNAL TO THE NUCLEUS | Genes involved in Activated NOTCH1 Transmits Signal to the Nucleus |
| 0.4 | 13.6 | REACTOME G BETA GAMMA SIGNALLING THROUGH PLC BETA | Genes involved in G beta:gamma signalling through PLC beta |
| 0.4 | 3.7 | REACTOME ABACAVIR TRANSPORT AND METABOLISM | Genes involved in Abacavir transport and metabolism |
| 0.4 | 12.4 | REACTOME DNA REPAIR | Genes involved in DNA Repair |
| 0.4 | 8.0 | REACTOME RNA POL III TRANSCRIPTION TERMINATION | Genes involved in RNA Polymerase III Transcription Termination |
| 0.4 | 5.3 | REACTOME APC CDC20 MEDIATED DEGRADATION OF NEK2A | Genes involved in APC-Cdc20 mediated degradation of Nek2A |
| 0.4 | 2.5 | REACTOME MICRORNA MIRNA BIOGENESIS | Genes involved in MicroRNA (miRNA) Biogenesis |
| 0.3 | 11.0 | REACTOME MEIOTIC SYNAPSIS | Genes involved in Meiotic Synapsis |
| 0.3 | 9.4 | REACTOME G1 PHASE | Genes involved in G1 Phase |
| 0.3 | 2.7 | REACTOME GLYCOPROTEIN HORMONES | Genes involved in Glycoprotein hormones |
| 0.3 | 6.0 | REACTOME CITRIC ACID CYCLE TCA CYCLE | Genes involved in Citric acid cycle (TCA cycle) |
| 0.3 | 19.6 | REACTOME LATE PHASE OF HIV LIFE CYCLE | Genes involved in Late Phase of HIV Life Cycle |
| 0.3 | 18.3 | REACTOME DESTABILIZATION OF MRNA BY AUF1 HNRNP D0 | Genes involved in Destabilization of mRNA by AUF1 (hnRNP D0) |
| 0.3 | 1.9 | REACTOME ETHANOL OXIDATION | Genes involved in Ethanol oxidation |
| 0.3 | 8.3 | REACTOME PTM GAMMA CARBOXYLATION HYPUSINE FORMATION AND ARYLSULFATASE ACTIVATION | Genes involved in PTM: gamma carboxylation, hypusine formation and arylsulfatase activation |
| 0.3 | 13.7 | REACTOME TRANSPORT OF VITAMINS NUCLEOSIDES AND RELATED MOLECULES | Genes involved in Transport of vitamins, nucleosides, and related molecules |
| 0.3 | 5.4 | REACTOME PROLONGED ERK ACTIVATION EVENTS | Genes involved in Prolonged ERK activation events |
| 0.3 | 6.2 | REACTOME MITOCHONDRIAL TRNA AMINOACYLATION | Genes involved in Mitochondrial tRNA aminoacylation |
| 0.3 | 7.0 | REACTOME DOWNREGULATION OF SMAD2 3 SMAD4 TRANSCRIPTIONAL ACTIVITY | Genes involved in Downregulation of SMAD2/3:SMAD4 transcriptional activity |
| 0.3 | 6.1 | REACTOME INSULIN SYNTHESIS AND PROCESSING | Genes involved in Insulin Synthesis and Processing |
| 0.3 | 3.3 | REACTOME PREFOLDIN MEDIATED TRANSFER OF SUBSTRATE TO CCT TRIC | Genes involved in Prefoldin mediated transfer of substrate to CCT/TriC |
| 0.3 | 6.0 | REACTOME REGULATION OF KIT SIGNALING | Genes involved in Regulation of KIT signaling |
| 0.3 | 0.5 | REACTOME G BETA GAMMA SIGNALLING THROUGH PI3KGAMMA | Genes involved in G beta:gamma signalling through PI3Kgamma |
| 0.3 | 1.6 | REACTOME REGULATION OF IFNG SIGNALING | Genes involved in Regulation of IFNG signaling |
| 0.3 | 6.2 | REACTOME TRNA AMINOACYLATION | Genes involved in tRNA Aminoacylation |
| 0.3 | 1.0 | REACTOME DESTABILIZATION OF MRNA BY TRISTETRAPROLIN TTP | Genes involved in Destabilization of mRNA by Tristetraprolin (TTP) |
| 0.2 | 3.4 | REACTOME FORMATION OF ATP BY CHEMIOSMOTIC COUPLING | Genes involved in Formation of ATP by chemiosmotic coupling |
| 0.2 | 4.0 | REACTOME NONSENSE MEDIATED DECAY ENHANCED BY THE EXON JUNCTION COMPLEX | Genes involved in Nonsense Mediated Decay Enhanced by the Exon Junction Complex |
| 0.2 | 9.9 | REACTOME RECYCLING PATHWAY OF L1 | Genes involved in Recycling pathway of L1 |
| 0.2 | 3.7 | REACTOME TIE2 SIGNALING | Genes involved in Tie2 Signaling |
| 0.2 | 2.3 | REACTOME NUCLEAR EVENTS KINASE AND TRANSCRIPTION FACTOR ACTIVATION | Genes involved in Nuclear Events (kinase and transcription factor activation) |
| 0.2 | 7.2 | REACTOME MYOGENESIS | Genes involved in Myogenesis |
| 0.2 | 8.7 | REACTOME GLYCOLYSIS | Genes involved in Glycolysis |
| 0.2 | 15.5 | REACTOME RESPIRATORY ELECTRON TRANSPORT ATP SYNTHESIS BY CHEMIOSMOTIC COUPLING AND HEAT PRODUCTION BY UNCOUPLING PROTEINS | Genes involved in Respiratory electron transport, ATP synthesis by chemiosmotic coupling, and heat production by uncoupling proteins. |
| 0.2 | 4.0 | REACTOME TERMINATION OF O GLYCAN BIOSYNTHESIS | Genes involved in Termination of O-glycan biosynthesis |
| 0.2 | 2.1 | REACTOME PLATELET SENSITIZATION BY LDL | Genes involved in Platelet sensitization by LDL |
| 0.2 | 19.3 | REACTOME MRNA SPLICING | Genes involved in mRNA Splicing |
| 0.2 | 0.4 | REACTOME VIF MEDIATED DEGRADATION OF APOBEC3G | Genes involved in Vif-mediated degradation of APOBEC3G |
| 0.2 | 3.8 | REACTOME REGULATION OF INSULIN LIKE GROWTH FACTOR IGF ACTIVITY BY INSULIN LIKE GROWTH FACTOR BINDING PROTEINS IGFBPS | Genes involved in Regulation of Insulin-like Growth Factor (IGF) Activity by Insulin-like Growth Factor Binding Proteins (IGFBPs) |
| 0.2 | 7.7 | REACTOME SMOOTH MUSCLE CONTRACTION | Genes involved in Smooth Muscle Contraction |
| 0.2 | 3.2 | REACTOME SYNTHESIS OF PIPS AT THE LATE ENDOSOME MEMBRANE | Genes involved in Synthesis of PIPs at the late endosome membrane |
| 0.2 | 35.4 | REACTOME ANTIGEN PROCESSING UBIQUITINATION PROTEASOME DEGRADATION | Genes involved in Antigen processing: Ubiquitination & Proteasome degradation |
| 0.2 | 0.8 | REACTOME ACTIVATION OF ATR IN RESPONSE TO REPLICATION STRESS | Genes involved in Activation of ATR in response to replication stress |
| 0.2 | 2.7 | REACTOME GENERATION OF SECOND MESSENGER MOLECULES | Genes involved in Generation of second messenger molecules |
| 0.2 | 2.4 | REACTOME SIGNAL ATTENUATION | Genes involved in Signal attenuation |
| 0.2 | 6.3 | REACTOME TRIGLYCERIDE BIOSYNTHESIS | Genes involved in Triglyceride Biosynthesis |
| 0.2 | 12.0 | REACTOME METABOLISM OF VITAMINS AND COFACTORS | Genes involved in Metabolism of vitamins and cofactors |
| 0.2 | 3.7 | REACTOME N GLYCAN ANTENNAE ELONGATION | Genes involved in N-Glycan antennae elongation |
| 0.2 | 3.8 | REACTOME SEMA4D INDUCED CELL MIGRATION AND GROWTH CONE COLLAPSE | Genes involved in Sema4D induced cell migration and growth-cone collapse |
| 0.2 | 7.2 | REACTOME SYNTHESIS OF PIPS AT THE PLASMA MEMBRANE | Genes involved in Synthesis of PIPs at the plasma membrane |
| 0.2 | 0.2 | REACTOME KERATAN SULFATE KERATIN METABOLISM | Genes involved in Keratan sulfate/keratin metabolism |
| 0.2 | 2.5 | REACTOME ACTIVATION OF BH3 ONLY PROTEINS | Genes involved in Activation of BH3-only proteins |
| 0.2 | 3.6 | REACTOME BRANCHED CHAIN AMINO ACID CATABOLISM | Genes involved in Branched-chain amino acid catabolism |
| 0.2 | 1.5 | REACTOME MTORC1 MEDIATED SIGNALLING | Genes involved in mTORC1-mediated signalling |
| 0.2 | 0.8 | REACTOME INWARDLY RECTIFYING K CHANNELS | Genes involved in Inwardly rectifying K+ channels |
| 0.2 | 2.3 | REACTOME REGULATION OF RHEB GTPASE ACTIVITY BY AMPK | Genes involved in Regulation of Rheb GTPase activity by AMPK |
| 0.2 | 1.6 | REACTOME PROSTANOID LIGAND RECEPTORS | Genes involved in Prostanoid ligand receptors |
| 0.2 | 1.9 | REACTOME PHOSPHORYLATION OF CD3 AND TCR ZETA CHAINS | Genes involved in Phosphorylation of CD3 and TCR zeta chains |
| 0.2 | 9.6 | REACTOME AMINO ACID AND OLIGOPEPTIDE SLC TRANSPORTERS | Genes involved in Amino acid and oligopeptide SLC transporters |
| 0.2 | 0.9 | REACTOME RECRUITMENT OF NUMA TO MITOTIC CENTROSOMES | Genes involved in Recruitment of NuMA to mitotic centrosomes |
| 0.2 | 0.6 | REACTOME TRAF6 MEDIATED INDUCTION OF TAK1 COMPLEX | Genes involved in TRAF6 mediated induction of TAK1 complex |
| 0.2 | 0.9 | REACTOME REGULATION OF ORNITHINE DECARBOXYLASE ODC | Genes involved in Regulation of ornithine decarboxylase (ODC) |
| 0.2 | 1.7 | REACTOME SIGNALING BY PDGF | Genes involved in Signaling by PDGF |
| 0.2 | 1.5 | REACTOME G PROTEIN ACTIVATION | Genes involved in G-protein activation |
| 0.1 | 4.2 | REACTOME AMINE COMPOUND SLC TRANSPORTERS | Genes involved in Amine compound SLC transporters |
| 0.1 | 4.1 | REACTOME DARPP 32 EVENTS | Genes involved in DARPP-32 events |
| 0.1 | 9.8 | REACTOME FACTORS INVOLVED IN MEGAKARYOCYTE DEVELOPMENT AND PLATELET PRODUCTION | Genes involved in Factors involved in megakaryocyte development and platelet production |
| 0.1 | 0.8 | REACTOME ACYL CHAIN REMODELLING OF PI | Genes involved in Acyl chain remodelling of PI |
| 0.1 | 1.7 | REACTOME MRNA DECAY BY 5 TO 3 EXORIBONUCLEASE | Genes involved in mRNA Decay by 5' to 3' Exoribonuclease |
| 0.1 | 2.5 | REACTOME DEGRADATION OF THE EXTRACELLULAR MATRIX | Genes involved in Degradation of the extracellular matrix |
| 0.1 | 1.4 | REACTOME IRAK1 RECRUITS IKK COMPLEX | Genes involved in IRAK1 recruits IKK complex |
| 0.1 | 9.4 | REACTOME CELL DEATH SIGNALLING VIA NRAGE NRIF AND NADE | Genes involved in Cell death signalling via NRAGE, NRIF and NADE |
| 0.1 | 0.9 | REACTOME SIGNALING BY WNT | Genes involved in Signaling by Wnt |
| 0.1 | 2.6 | REACTOME CELL EXTRACELLULAR MATRIX INTERACTIONS | Genes involved in Cell-extracellular matrix interactions |
| 0.1 | 7.7 | REACTOME PHASE II CONJUGATION | Genes involved in Phase II conjugation |
| 0.1 | 0.5 | REACTOME MRNA PROCESSING | Genes involved in mRNA Processing |
| 0.1 | 0.7 | REACTOME SIGNALING BY ERBB2 | Genes involved in Signaling by ERBB2 |
| 0.1 | 3.0 | REACTOME ADHERENS JUNCTIONS INTERACTIONS | Genes involved in Adherens junctions interactions |
| 0.1 | 1.6 | REACTOME INTRINSIC PATHWAY FOR APOPTOSIS | Genes involved in Intrinsic Pathway for Apoptosis |
| 0.1 | 0.7 | REACTOME G ALPHA1213 SIGNALLING EVENTS | Genes involved in G alpha (12/13) signalling events |
| 0.1 | 1.8 | REACTOME RNA POL I RNA POL III AND MITOCHONDRIAL TRANSCRIPTION | Genes involved in RNA Polymerase I, RNA Polymerase III, and Mitochondrial Transcription |
| 0.1 | 0.7 | REACTOME OXYGEN DEPENDENT PROLINE HYDROXYLATION OF HYPOXIA INDUCIBLE FACTOR ALPHA | Genes involved in Oxygen-dependent Proline Hydroxylation of Hypoxia-inducible Factor Alpha |
| 0.1 | 0.8 | REACTOME REGULATION OF APOPTOSIS | Genes involved in Regulation of Apoptosis |
| 0.1 | 0.2 | REACTOME ADVANCED GLYCOSYLATION ENDPRODUCT RECEPTOR SIGNALING | Genes involved in Advanced glycosylation endproduct receptor signaling |
| 0.1 | 2.5 | REACTOME A TETRASACCHARIDE LINKER SEQUENCE IS REQUIRED FOR GAG SYNTHESIS | Genes involved in A tetrasaccharide linker sequence is required for GAG synthesis |
| 0.1 | 0.8 | REACTOME TRANSCRIPTIONAL ACTIVITY OF SMAD2 SMAD3 SMAD4 HETEROTRIMER | Genes involved in Transcriptional activity of SMAD2/SMAD3:SMAD4 heterotrimer |
| 0.1 | 0.1 | REACTOME IKK COMPLEX RECRUITMENT MEDIATED BY RIP1 | Genes involved in IKK complex recruitment mediated by RIP1 |
| 0.1 | 0.3 | REACTOME TRANSPORT OF MATURE MRNA DERIVED FROM AN INTRONLESS TRANSCRIPT | Genes involved in Transport of Mature mRNA Derived from an Intronless Transcript |
| 0.1 | 0.1 | REACTOME SEMA3A PLEXIN REPULSION SIGNALING BY INHIBITING INTEGRIN ADHESION | Genes involved in SEMA3A-Plexin repulsion signaling by inhibiting Integrin adhesion |
| 0.1 | 0.5 | REACTOME METABOLISM OF RNA | Genes involved in Metabolism of RNA |
| 0.1 | 0.3 | REACTOME THE ROLE OF NEF IN HIV1 REPLICATION AND DISEASE PATHOGENESIS | Genes involved in The role of Nef in HIV-1 replication and disease pathogenesis |
| 0.1 | 0.7 | REACTOME ENOS ACTIVATION AND REGULATION | Genes involved in eNOS activation and regulation |
| 0.1 | 1.4 | REACTOME SIGNALING BY HIPPO | Genes involved in Signaling by Hippo |
| 0.0 | 0.8 | REACTOME AMINE DERIVED HORMONES | Genes involved in Amine-derived hormones |
| 0.0 | 0.6 | REACTOME ALPHA LINOLENIC ACID ALA METABOLISM | Genes involved in alpha-linolenic acid (ALA) metabolism |
| 0.0 | 0.9 | REACTOME OTHER SEMAPHORIN INTERACTIONS | Genes involved in Other semaphorin interactions |
| 0.0 | 0.5 | REACTOME ACTIVATION OF KAINATE RECEPTORS UPON GLUTAMATE BINDING | Genes involved in Activation of Kainate Receptors upon glutamate binding |
| 0.0 | 1.5 | REACTOME NITRIC OXIDE STIMULATES GUANYLATE CYCLASE | Genes involved in Nitric oxide stimulates guanylate cyclase |
| 0.0 | 0.2 | REACTOME REGULATION OF SIGNALING BY CBL | Genes involved in Regulation of signaling by CBL |
| 0.0 | 0.2 | REACTOME CD28 DEPENDENT VAV1 PATHWAY | Genes involved in CD28 dependent Vav1 pathway |
| 0.0 | 0.5 | REACTOME TCA CYCLE AND RESPIRATORY ELECTRON TRANSPORT | Genes involved in The citric acid (TCA) cycle and respiratory electron transport |
| 0.0 | 0.8 | REACTOME POST NMDA RECEPTOR ACTIVATION EVENTS | Genes involved in Post NMDA receptor activation events |
| 0.0 | 0.6 | REACTOME MITOCHONDRIAL FATTY ACID BETA OXIDATION | Genes involved in Mitochondrial Fatty Acid Beta-Oxidation |
| 0.0 | 0.2 | REACTOME YAP1 AND WWTR1 TAZ STIMULATED GENE EXPRESSION | Genes involved in YAP1- and WWTR1 (TAZ)-stimulated gene expression |
| 0.0 | 0.3 | REACTOME SYNTHESIS OF BILE ACIDS AND BILE SALTS VIA 7ALPHA HYDROXYCHOLESTEROL | Genes involved in Synthesis of bile acids and bile salts via 7alpha-hydroxycholesterol |
| 0.0 | 0.2 | REACTOME SIGNALLING TO RAS | Genes involved in Signalling to RAS |
| 0.0 | 0.2 | REACTOME REGULATION OF IFNA SIGNALING | Genes involved in Regulation of IFNA signaling |
| 0.0 | 0.1 | REACTOME DOWNSTREAM TCR SIGNALING | Genes involved in Downstream TCR signaling |
| 0.0 | 0.8 | REACTOME GOLGI ASSOCIATED VESICLE BIOGENESIS | Genes involved in Golgi Associated Vesicle Biogenesis |
| 0.0 | 1.5 | REACTOME METABOLISM OF AMINO ACIDS AND DERIVATIVES | Genes involved in Metabolism of amino acids and derivatives |
| 0.0 | 0.2 | REACTOME DCC MEDIATED ATTRACTIVE SIGNALING | Genes involved in DCC mediated attractive signaling |
| 0.0 | 1.4 | REACTOME TRANSCRIPTIONAL REGULATION OF WHITE ADIPOCYTE DIFFERENTIATION | Genes involved in Transcriptional Regulation of White Adipocyte Differentiation |
| 0.0 | 0.1 | REACTOME BASIGIN INTERACTIONS | Genes involved in Basigin interactions |
| 0.0 | 0.2 | REACTOME HIGHLY CALCIUM PERMEABLE POSTSYNAPTIC NICOTINIC ACETYLCHOLINE RECEPTORS | Genes involved in Highly calcium permeable postsynaptic nicotinic acetylcholine receptors |
| 0.0 | 0.6 | REACTOME IMMUNOREGULATORY INTERACTIONS BETWEEN A LYMPHOID AND A NON LYMPHOID CELL | Genes involved in Immunoregulatory interactions between a Lymphoid and a non-Lymphoid cell |
| 0.0 | 0.0 | REACTOME PD1 SIGNALING | Genes involved in PD-1 signaling |