Project
avrg: 12D miR HR13_24
Navigation
Downloads
Results for Snai1_Zeb1_Snai2
Z-value: 12.49
Motif logo
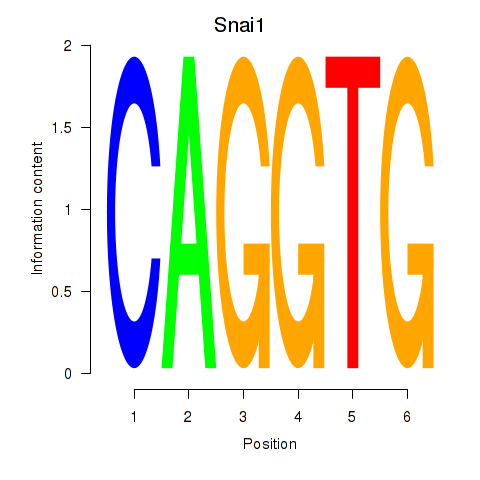
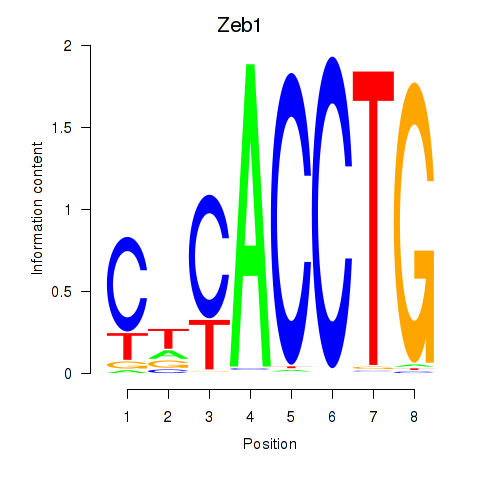
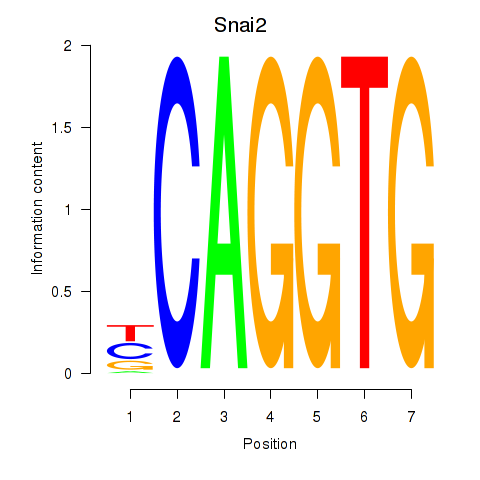
Transcription factors associated with Snai1_Zeb1_Snai2
| Gene Symbol | Gene ID | Gene Info |
|---|---|---|
|
Snai1
|
ENSMUSG00000042821.7 | snail family zinc finger 1 |
|
Zeb1
|
ENSMUSG00000024238.7 | zinc finger E-box binding homeobox 1 |
|
Snai2
|
ENSMUSG00000022676.6 | snail family zinc finger 2 |
Activity-expression correlation:
| Gene | Promoter | Pearson corr. coef. | P-value | Plot |
|---|---|---|---|---|
| Zeb1 | mm10_v2_chr18_+_5591860_5591902 | -0.94 | 1.2e-05 | Click! |
| Snai2 | mm10_v2_chr16_+_14705832_14705858 | -0.79 | 3.5e-03 | Click! |
| Snai1 | mm10_v2_chr2_+_167538192_167538210 | -0.73 | 1.1e-02 | Click! |
Activity profile of Snai1_Zeb1_Snai2 motif
Sorted Z-values of Snai1_Zeb1_Snai2 motif
| Promoter | Log-likelihood | Transcript | Gene | Gene Info |
|---|---|---|---|---|
| chr11_+_69965396 | 51.84 |
ENSMUST00000018713.6
|
Cldn7
|
claudin 7 |
| chr11_+_68556186 | 29.73 |
ENSMUST00000053211.6
|
Mfsd6l
|
major facilitator superfamily domain containing 6-like |
| chr16_+_36693972 | 26.92 |
ENSMUST00000023617.6
ENSMUST00000089618.3 |
Ildr1
|
immunoglobulin-like domain containing receptor 1 |
| chr9_-_21312255 | 26.50 |
ENSMUST00000115433.3
ENSMUST00000003397.7 |
Ap1m2
|
adaptor protein complex AP-1, mu 2 subunit |
| chr12_-_73546383 | 24.93 |
ENSMUST00000042975.5
|
Tmem30b
|
transmembrane protein 30B |
| chr16_+_36694024 | 24.81 |
ENSMUST00000119464.1
|
Ildr1
|
immunoglobulin-like domain containing receptor 1 |
| chr17_+_57062231 | 23.77 |
ENSMUST00000097299.3
ENSMUST00000169543.1 ENSMUST00000163763.1 |
Crb3
|
crumbs homolog 3 (Drosophila) |
| chr4_-_11386757 | 22.36 |
ENSMUST00000108313.1
ENSMUST00000108311.2 |
Esrp1
|
epithelial splicing regulatory protein 1 |
| chr4_+_133518963 | 22.14 |
ENSMUST00000149807.1
ENSMUST00000042919.9 ENSMUST00000153811.1 ENSMUST00000105901.1 ENSMUST00000121797.1 |
1810019J16Rik
|
RIKEN cDNA 1810019J16 gene |
| chr4_-_11386679 | 21.95 |
ENSMUST00000043781.7
ENSMUST00000108310.1 |
Esrp1
|
epithelial splicing regulatory protein 1 |
| chr1_-_134234492 | 21.90 |
ENSMUST00000169927.1
|
Adora1
|
adenosine A1 receptor |
| chr17_+_24752980 | 20.24 |
ENSMUST00000044922.6
|
Hs3st6
|
heparan sulfate (glucosamine) 3-O-sulfotransferase 6 |
| chr5_-_139814231 | 20.10 |
ENSMUST00000044002.4
|
Tmem184a
|
transmembrane protein 184a |
| chr13_-_57907587 | 19.97 |
ENSMUST00000172326.1
|
Spock1
|
sparc/osteonectin, cwcv and kazal-like domains proteoglycan 1 |
| chr7_-_143074037 | 18.79 |
ENSMUST00000136602.1
|
Trpm5
|
transient receptor potential cation channel, subfamily M, member 5 |
| chr11_+_69964758 | 18.54 |
ENSMUST00000108597.1
ENSMUST00000060651.5 ENSMUST00000108596.1 |
Cldn7
|
claudin 7 |
| chr4_-_11386394 | 17.62 |
ENSMUST00000155519.1
|
Esrp1
|
epithelial splicing regulatory protein 1 |
| chr4_+_106622424 | 17.52 |
ENSMUST00000047922.2
|
Ttc22
|
tetratricopeptide repeat domain 22 |
| chr17_+_23660477 | 17.12 |
ENSMUST00000062967.8
|
Ccdc64b
|
coiled-coil domain containing 64B |
| chr18_+_74442551 | 16.78 |
ENSMUST00000121875.1
|
Myo5b
|
myosin VB |
| chr2_+_180725263 | 15.84 |
ENSMUST00000094218.3
|
Slc17a9
|
solute carrier family 17, member 9 |
| chr7_-_29281977 | 15.54 |
ENSMUST00000098604.4
ENSMUST00000108236.3 |
Spint2
|
serine protease inhibitor, Kunitz type 2 |
| chr5_-_139814025 | 15.19 |
ENSMUST00000146780.1
|
Tmem184a
|
transmembrane protein 184a |
| chr4_-_154299851 | 14.64 |
ENSMUST00000154895.1
|
Arhgef16
|
Rho guanine nucleotide exchange factor (GEF) 16 |
| chr4_-_154300029 | 14.24 |
ENSMUST00000030898.5
|
Arhgef16
|
Rho guanine nucleotide exchange factor (GEF) 16 |
| chr1_-_171437288 | 14.17 |
ENSMUST00000181499.1
|
Gm26641
|
predicted gene, 26641 |
| chr5_-_93045022 | 14.16 |
ENSMUST00000061328.5
|
Sowahb
|
sosondowah ankyrin repeat domain family member B |
| chr11_+_115824029 | 14.13 |
ENSMUST00000103032.4
ENSMUST00000133250.1 ENSMUST00000177736.1 |
Llgl2
|
lethal giant larvae homolog 2 (Drosophila) |
| chr7_+_121734477 | 14.01 |
ENSMUST00000000221.5
|
Scnn1g
|
sodium channel, nonvoltage-gated 1 gamma |
| chr8_+_106603351 | 13.95 |
ENSMUST00000000312.5
ENSMUST00000167688.1 |
Cdh1
|
cadherin 1 |
| chr16_-_23890805 | 13.36 |
ENSMUST00000004480.3
|
Sst
|
somatostatin |
| chr1_-_153186447 | 13.32 |
ENSMUST00000027753.6
|
Lamc2
|
laminin, gamma 2 |
| chr1_+_74409376 | 13.07 |
ENSMUST00000027366.6
|
Vil1
|
villin 1 |
| chr11_+_61684419 | 13.07 |
ENSMUST00000093019.5
|
Fam83g
|
family with sequence similarity 83, member G |
| chr6_+_47244359 | 12.92 |
ENSMUST00000060839.6
|
Cntnap2
|
contactin associated protein-like 2 |
| chr18_+_74442500 | 12.05 |
ENSMUST00000074157.6
|
Myo5b
|
myosin VB |
| chr5_+_35057059 | 11.92 |
ENSMUST00000050709.3
|
Dok7
|
docking protein 7 |
| chr5_+_125003440 | 11.85 |
ENSMUST00000036109.3
|
Fam101a
|
family with sequence similarity 101, member A |
| chr8_-_113848615 | 11.84 |
ENSMUST00000093113.4
|
Adamts18
|
a disintegrin-like and metallopeptidase (reprolysin type) with thrombospondin type 1 motif, 18 |
| chr14_+_41105359 | 11.59 |
ENSMUST00000047286.6
|
Mat1a
|
methionine adenosyltransferase I, alpha |
| chr7_-_141100526 | 11.53 |
ENSMUST00000097958.2
|
Sigirr
|
single immunoglobulin and toll-interleukin 1 receptor (TIR) domain |
| chr11_+_96929260 | 11.22 |
ENSMUST00000054311.5
ENSMUST00000107636.3 |
Prr15l
|
proline rich 15-like |
| chr17_+_23679363 | 11.12 |
ENSMUST00000024699.2
|
Cldn6
|
claudin 6 |
| chr9_+_53301571 | 10.96 |
ENSMUST00000051014.1
|
Exph5
|
exophilin 5 |
| chr6_-_48445373 | 10.96 |
ENSMUST00000114563.1
ENSMUST00000114558.1 ENSMUST00000101443.3 ENSMUST00000114564.1 |
Zfp467
|
zinc finger protein 467 |
| chr7_-_100658394 | 10.94 |
ENSMUST00000138830.1
ENSMUST00000107044.3 ENSMUST00000116287.2 |
Plekhb1
|
pleckstrin homology domain containing, family B (evectins) member 1 |
| chr17_+_47436731 | 10.92 |
ENSMUST00000150819.2
|
AI661453
|
expressed sequence AI661453 |
| chr17_+_57062486 | 10.88 |
ENSMUST00000163628.1
|
Crb3
|
crumbs homolog 3 (Drosophila) |
| chr17_+_30901811 | 10.87 |
ENSMUST00000114574.1
|
Glp1r
|
glucagon-like peptide 1 receptor |
| chr4_+_118527229 | 10.83 |
ENSMUST00000030261.5
|
2610528J11Rik
|
RIKEN cDNA 2610528J11 gene |
| chr3_-_88548249 | 10.80 |
ENSMUST00000131775.1
ENSMUST00000008745.6 |
Rab25
|
RAB25, member RAS oncogene family |
| chr3_+_106482427 | 10.80 |
ENSMUST00000029508.4
|
Dennd2d
|
DENN/MADD domain containing 2D |
| chr11_+_96929367 | 10.66 |
ENSMUST00000062172.5
|
Prr15l
|
proline rich 15-like |
| chr7_+_141079759 | 10.62 |
ENSMUST00000066873.4
ENSMUST00000163041.1 |
Pkp3
|
plakophilin 3 |
| chr15_+_54571358 | 10.40 |
ENSMUST00000025356.2
|
Mal2
|
mal, T cell differentiation protein 2 |
| chr11_-_69858723 | 10.26 |
ENSMUST00000001626.3
ENSMUST00000108626.1 |
Tnk1
|
tyrosine kinase, non-receptor, 1 |
| chr19_+_52264323 | 10.23 |
ENSMUST00000039652.4
|
Ins1
|
insulin I |
| chr18_+_20558038 | 10.20 |
ENSMUST00000059787.8
|
Dsg2
|
desmoglein 2 |
| chr5_+_35056813 | 10.00 |
ENSMUST00000101298.2
ENSMUST00000114270.1 ENSMUST00000133381.1 |
Dok7
|
docking protein 7 |
| chr4_+_140906344 | 9.94 |
ENSMUST00000030765.6
|
Padi2
|
peptidyl arginine deiminase, type II |
| chr3_-_89393294 | 9.84 |
ENSMUST00000142119.1
ENSMUST00000029677.8 ENSMUST00000148361.1 |
Zbtb7b
|
zinc finger and BTB domain containing 7B |
| chr7_+_45617575 | 9.83 |
ENSMUST00000008605.5
|
Fut1
|
fucosyltransferase 1 |
| chr5_-_139813237 | 9.74 |
ENSMUST00000110832.1
|
Tmem184a
|
transmembrane protein 184a |
| chr1_-_134235420 | 9.55 |
ENSMUST00000038191.6
ENSMUST00000086465.4 |
Adora1
|
adenosine A1 receptor |
| chr5_+_91139591 | 9.42 |
ENSMUST00000031325.4
|
Areg
|
amphiregulin |
| chr7_+_49974864 | 9.24 |
ENSMUST00000081872.5
ENSMUST00000151721.1 |
Nell1
|
NEL-like 1 |
| chr4_-_106799779 | 9.10 |
ENSMUST00000145061.1
ENSMUST00000102762.3 |
Acot11
|
acyl-CoA thioesterase 11 |
| chr7_-_141214080 | 9.01 |
ENSMUST00000026573.5
ENSMUST00000170841.1 |
1600016N20Rik
|
RIKEN cDNA 1600016N20 gene |
| chr6_-_112489808 | 8.83 |
ENSMUST00000053306.6
|
Oxtr
|
oxytocin receptor |
| chr6_+_90619241 | 8.80 |
ENSMUST00000032177.8
|
Slc41a3
|
solute carrier family 41, member 3 |
| chr11_-_69858687 | 8.78 |
ENSMUST00000125571.1
|
Tnk1
|
tyrosine kinase, non-receptor, 1 |
| chr13_+_25056206 | 8.76 |
ENSMUST00000069614.6
|
Dcdc2a
|
doublecortin domain containing 2a |
| chr6_+_96115249 | 8.69 |
ENSMUST00000075080.5
|
Fam19a1
|
family with sequence similarity 19, member A1 |
| chr15_+_98634743 | 8.69 |
ENSMUST00000003442.7
|
Cacnb3
|
calcium channel, voltage-dependent, beta 3 subunit |
| chr11_+_120530688 | 8.67 |
ENSMUST00000026119.7
|
Gcgr
|
glucagon receptor |
| chr13_-_95525239 | 8.64 |
ENSMUST00000022185.8
|
F2rl1
|
coagulation factor II (thrombin) receptor-like 1 |
| chr6_+_39381175 | 8.57 |
ENSMUST00000031986.4
|
Rab19
|
RAB19, member RAS oncogene family |
| chr3_-_89393629 | 8.55 |
ENSMUST00000124783.1
ENSMUST00000126027.1 |
Zbtb7b
|
zinc finger and BTB domain containing 7B |
| chr7_-_100658364 | 8.53 |
ENSMUST00000107043.1
|
Plekhb1
|
pleckstrin homology domain containing, family B (evectins) member 1 |
| chr11_-_109722214 | 8.51 |
ENSMUST00000020938.7
|
Fam20a
|
family with sequence similarity 20, member A |
| chr11_-_72135721 | 8.51 |
ENSMUST00000108508.2
ENSMUST00000075258.6 |
Pitpnm3
|
PITPNM family member 3 |
| chr17_+_87635974 | 8.48 |
ENSMUST00000053577.8
|
Epcam
|
epithelial cell adhesion molecule |
| chr8_+_76902277 | 8.46 |
ENSMUST00000109912.1
ENSMUST00000128862.1 ENSMUST00000109911.1 |
Nr3c2
|
nuclear receptor subfamily 3, group C, member 2 |
| chr7_-_19796789 | 8.38 |
ENSMUST00000108449.2
ENSMUST00000043822.7 |
Cblc
|
Casitas B-lineage lymphoma c |
| chr13_+_38151324 | 8.37 |
ENSMUST00000127906.1
|
Dsp
|
desmoplakin |
| chr13_+_38151343 | 8.36 |
ENSMUST00000124830.1
|
Dsp
|
desmoplakin |
| chr16_-_52452654 | 8.35 |
ENSMUST00000168071.1
|
Alcam
|
activated leukocyte cell adhesion molecule |
| chr12_+_30911659 | 8.35 |
ENSMUST00000020997.8
ENSMUST00000110880.2 |
Sh3yl1
|
Sh3 domain YSC-like 1 |
| chr9_+_46998931 | 8.34 |
ENSMUST00000178065.1
|
Gm4791
|
predicted gene 4791 |
| chr9_-_121792478 | 8.33 |
ENSMUST00000035110.4
|
Hhatl
|
hedgehog acyltransferase-like |
| chr11_+_96464587 | 8.31 |
ENSMUST00000103154.4
ENSMUST00000100521.3 ENSMUST00000100519.4 ENSMUST00000071510.7 ENSMUST00000107662.2 |
Skap1
|
src family associated phosphoprotein 1 |
| chr7_+_18884679 | 8.30 |
ENSMUST00000032573.6
|
Pglyrp1
|
peptidoglycan recognition protein 1 |
| chr12_-_79007276 | 8.30 |
ENSMUST00000056660.6
ENSMUST00000174721.1 |
Tmem229b
|
transmembrane protein 229B |
| chr7_-_142679533 | 8.24 |
ENSMUST00000162317.1
ENSMUST00000125933.1 ENSMUST00000105931.1 ENSMUST00000105930.1 ENSMUST00000105933.1 ENSMUST00000105932.1 ENSMUST00000000220.2 |
Ins2
|
insulin II |
| chr3_+_146117451 | 8.22 |
ENSMUST00000140214.1
|
Mcoln3
|
mucolipin 3 |
| chr2_+_59484645 | 8.19 |
ENSMUST00000028369.5
|
Dapl1
|
death associated protein-like 1 |
| chr12_-_44210061 | 8.18 |
ENSMUST00000015049.3
|
Dnajb9
|
DnaJ (Hsp40) homolog, subfamily B, member 9 |
| chr15_+_85017138 | 8.04 |
ENSMUST00000023070.5
|
Upk3a
|
uroplakin 3A |
| chr18_+_20558221 | 8.02 |
ENSMUST00000121837.1
|
Dsg2
|
desmoglein 2 |
| chr11_-_80779989 | 7.99 |
ENSMUST00000041065.7
ENSMUST00000070997.5 |
Myo1d
|
myosin ID |
| chr6_-_124738714 | 7.97 |
ENSMUST00000171549.2
|
Ptpn6
|
protein tyrosine phosphatase, non-receptor type 6 |
| chr2_-_144332146 | 7.95 |
ENSMUST00000037423.3
|
Ovol2
|
ovo-like 2 (Drosophila) |
| chr11_-_120648104 | 7.93 |
ENSMUST00000026134.2
|
Myadml2
|
myeloid-associated differentiation marker-like 2 |
| chr4_-_130275542 | 7.82 |
ENSMUST00000154846.1
ENSMUST00000105996.1 |
Serinc2
|
serine incorporator 2 |
| chr8_-_72212837 | 7.81 |
ENSMUST00000098630.3
|
Cib3
|
calcium and integrin binding family member 3 |
| chr16_-_52452465 | 7.81 |
ENSMUST00000170035.1
ENSMUST00000164728.1 |
Alcam
|
activated leukocyte cell adhesion molecule |
| chr19_-_3686549 | 7.76 |
ENSMUST00000025856.10
ENSMUST00000176867.1 |
Lrp5
|
low density lipoprotein receptor-related protein 5 |
| chr11_+_3983704 | 7.73 |
ENSMUST00000063004.7
|
Gal3st1
|
galactose-3-O-sulfotransferase 1 |
| chr13_+_24845122 | 7.69 |
ENSMUST00000006893.8
|
D130043K22Rik
|
RIKEN cDNA D130043K22 gene |
| chr2_-_62483637 | 7.67 |
ENSMUST00000136686.1
ENSMUST00000102733.3 |
Gcg
|
glucagon |
| chr7_-_101864093 | 7.60 |
ENSMUST00000106981.1
|
Folr1
|
folate receptor 1 (adult) |
| chr4_-_133263042 | 7.60 |
ENSMUST00000105908.3
ENSMUST00000030674.7 |
Sytl1
|
synaptotagmin-like 1 |
| chr4_+_118526986 | 7.57 |
ENSMUST00000106367.1
|
2610528J11Rik
|
RIKEN cDNA 2610528J11 gene |
| chr11_+_16752203 | 7.53 |
ENSMUST00000102884.3
ENSMUST00000020329.6 |
Egfr
|
epidermal growth factor receptor |
| chr4_+_120666562 | 7.46 |
ENSMUST00000094814.4
|
Cited4
|
Cbp/p300-interacting transactivator, with Glu/Asp-rich carboxy-terminal domain, 4 |
| chr2_+_153492790 | 7.45 |
ENSMUST00000109783.1
|
4930404H24Rik
|
RIKEN cDNA 4930404H24 gene |
| chr10_+_75893398 | 7.40 |
ENSMUST00000009236.4
|
Derl3
|
Der1-like domain family, member 3 |
| chr3_-_89387132 | 7.35 |
ENSMUST00000107433.1
|
Zbtb7b
|
zinc finger and BTB domain containing 7B |
| chr2_+_92915080 | 7.26 |
ENSMUST00000028648.2
|
Syt13
|
synaptotagmin XIII |
| chr8_-_106136792 | 7.26 |
ENSMUST00000146940.1
|
Esrp2
|
epithelial splicing regulatory protein 2 |
| chr7_-_66427469 | 7.25 |
ENSMUST00000015278.7
|
Aldh1a3
|
aldehyde dehydrogenase family 1, subfamily A3 |
| chr5_-_108675569 | 7.20 |
ENSMUST00000051757.7
|
Slc26a1
|
solute carrier family 26 (sulfate transporter), member 1 |
| chr2_-_37703275 | 7.17 |
ENSMUST00000072186.5
|
Strbp
|
spermatid perinuclear RNA binding protein |
| chr7_-_128206346 | 7.16 |
ENSMUST00000033049.7
|
Cox6a2
|
cytochrome c oxidase subunit VIa polypeptide 2 |
| chr4_+_137277489 | 7.14 |
ENSMUST00000045747.4
|
Wnt4
|
wingless-related MMTV integration site 4 |
| chr3_+_27371351 | 7.14 |
ENSMUST00000057186.1
|
Ghsr
|
growth hormone secretagogue receptor |
| chr4_+_49059256 | 7.13 |
ENSMUST00000076670.2
|
E130309F12Rik
|
RIKEN cDNA E130309F12 gene |
| chr7_-_143074561 | 7.11 |
ENSMUST00000148715.1
|
Trpm5
|
transient receptor potential cation channel, subfamily M, member 5 |
| chr14_-_47189406 | 7.09 |
ENSMUST00000089959.6
|
Gch1
|
GTP cyclohydrolase 1 |
| chr4_-_154026037 | 7.07 |
ENSMUST00000131325.2
ENSMUST00000146054.1 ENSMUST00000126119.1 ENSMUST00000125533.2 |
Smim1
|
small integral membrane protein 1 |
| chr3_+_105870898 | 7.06 |
ENSMUST00000010279.5
|
Adora3
|
adenosine A3 receptor |
| chr6_-_124738579 | 7.05 |
ENSMUST00000174265.1
ENSMUST00000004377.8 |
Ptpn6
|
protein tyrosine phosphatase, non-receptor type 6 |
| chr5_+_35757875 | 6.99 |
ENSMUST00000101280.3
ENSMUST00000054598.5 ENSMUST00000114205.1 ENSMUST00000114206.2 |
Ablim2
|
actin-binding LIM protein 2 |
| chr15_+_88819584 | 6.90 |
ENSMUST00000024042.3
|
Creld2
|
cysteine-rich with EGF-like domains 2 |
| chr1_+_96872221 | 6.89 |
ENSMUST00000181489.1
|
Gm5101
|
predicted gene 5101 |
| chr10_-_127041513 | 6.89 |
ENSMUST00000116231.2
|
Mettl21b
|
methyltransferase like 21B |
| chr10_+_115817247 | 6.86 |
ENSMUST00000035563.7
ENSMUST00000080630.3 ENSMUST00000179196.1 |
Tspan8
|
tetraspanin 8 |
| chr8_-_109962127 | 6.84 |
ENSMUST00000001722.7
ENSMUST00000051430.6 |
Marveld3
|
MARVEL (membrane-associating) domain containing 3 |
| chr11_+_113619318 | 6.81 |
ENSMUST00000146390.2
ENSMUST00000106630.1 |
Sstr2
|
somatostatin receptor 2 |
| chr17_-_25256274 | 6.80 |
ENSMUST00000182435.1
ENSMUST00000169109.2 ENSMUST00000182056.1 |
Baiap3
|
BAI1-associated protein 3 |
| chr9_-_76567092 | 6.78 |
ENSMUST00000183437.1
|
Fam83b
|
family with sequence similarity 83, member B |
| chr7_-_30973464 | 6.74 |
ENSMUST00000001279.8
|
Lsr
|
lipolysis stimulated lipoprotein receptor |
| chr13_+_25056004 | 6.72 |
ENSMUST00000036932.8
|
Dcdc2a
|
doublecortin domain containing 2a |
| chr4_-_134238372 | 6.70 |
ENSMUST00000030645.8
|
Cnksr1
|
connector enhancer of kinase suppressor of Ras 1 |
| chr17_+_25736040 | 6.70 |
ENSMUST00000047098.5
|
Mslnl
|
mesothelin-like |
| chr6_+_54326955 | 6.67 |
ENSMUST00000059138.4
|
Prr15
|
proline rich 15 |
| chr2_-_144331695 | 6.64 |
ENSMUST00000103171.3
|
Ovol2
|
ovo-like 2 (Drosophila) |
| chr4_+_95967322 | 6.61 |
ENSMUST00000107083.1
|
Hook1
|
hook homolog 1 (Drosophila) |
| chr7_+_128203598 | 6.57 |
ENSMUST00000177383.1
|
Itgad
|
integrin, alpha D |
| chr1_+_135818593 | 6.55 |
ENSMUST00000038760.8
|
Lad1
|
ladinin |
| chr2_-_114013619 | 6.54 |
ENSMUST00000090275.4
|
Gjd2
|
gap junction protein, delta 2 |
| chr3_-_92485886 | 6.54 |
ENSMUST00000054599.7
|
Sprr1a
|
small proline-rich protein 1A |
| chr7_-_30973399 | 6.51 |
ENSMUST00000098553.4
ENSMUST00000147431.1 |
Lsr
|
lipolysis stimulated lipoprotein receptor |
| chr4_-_131672133 | 6.50 |
ENSMUST00000144212.1
|
Gm12962
|
predicted gene 12962 |
| chr11_+_3983636 | 6.47 |
ENSMUST00000078757.1
|
Gal3st1
|
galactose-3-O-sulfotransferase 1 |
| chr9_-_50746501 | 6.43 |
ENSMUST00000034564.1
|
2310030G06Rik
|
RIKEN cDNA 2310030G06 gene |
| chr6_+_43265582 | 6.43 |
ENSMUST00000031750.7
|
Arhgef5
|
Rho guanine nucleotide exchange factor (GEF) 5 |
| chrX_-_162643629 | 6.41 |
ENSMUST00000112334.1
|
Reps2
|
RALBP1 associated Eps domain containing protein 2 |
| chr11_-_115367667 | 6.39 |
ENSMUST00000123428.1
ENSMUST00000044152.6 ENSMUST00000106542.2 |
Hid1
|
HID1 domain containing |
| chrX_-_162643575 | 6.39 |
ENSMUST00000101102.1
|
Reps2
|
RALBP1 associated Eps domain containing protein 2 |
| chr4_-_156059414 | 6.38 |
ENSMUST00000184348.1
|
Ttll10
|
tubulin tyrosine ligase-like family, member 10 |
| chr2_-_65238573 | 6.38 |
ENSMUST00000090896.3
ENSMUST00000155082.1 |
Cobll1
|
Cobl-like 1 |
| chr13_-_13393592 | 6.35 |
ENSMUST00000021738.8
|
Gpr137b
|
G protein-coupled receptor 137B |
| chr2_+_62664279 | 6.31 |
ENSMUST00000028257.2
|
Gca
|
grancalcin |
| chr1_+_193153107 | 6.28 |
ENSMUST00000076521.5
|
Irf6
|
interferon regulatory factor 6 |
| chr2_+_119237453 | 6.26 |
ENSMUST00000110816.1
|
Spint1
|
serine protease inhibitor, Kunitz type 1 |
| chr2_+_119237351 | 6.25 |
ENSMUST00000028783.7
|
Spint1
|
serine protease inhibitor, Kunitz type 1 |
| chr8_+_76899772 | 6.20 |
ENSMUST00000109913.2
|
Nr3c2
|
nuclear receptor subfamily 3, group C, member 2 |
| chr10_+_79822617 | 6.13 |
ENSMUST00000046833.4
|
Misp
|
mitotic spindle positioning |
| chr1_+_171437535 | 6.08 |
ENSMUST00000043839.4
|
F11r
|
F11 receptor |
| chr10_-_75797528 | 6.07 |
ENSMUST00000120177.1
|
Gstt1
|
glutathione S-transferase, theta 1 |
| chr15_+_80671829 | 6.06 |
ENSMUST00000023044.5
|
Fam83f
|
family with sequence similarity 83, member F |
| chr2_-_65238721 | 6.05 |
ENSMUST00000112431.1
|
Cobll1
|
Cobl-like 1 |
| chr1_-_158814469 | 6.02 |
ENSMUST00000161589.2
|
Pappa2
|
pappalysin 2 |
| chr4_+_133553370 | 6.00 |
ENSMUST00000042706.2
|
Nr0b2
|
nuclear receptor subfamily 0, group B, member 2 |
| chr11_-_53480178 | 6.00 |
ENSMUST00000104955.2
|
Sowaha
|
sosondowah ankyrin repeat domain family member A |
| chrX_+_159627265 | 5.99 |
ENSMUST00000112456.2
|
Sh3kbp1
|
SH3-domain kinase binding protein 1 |
| chr7_-_127890918 | 5.99 |
ENSMUST00000121394.1
|
Prss53
|
protease, serine, 53 |
| chr16_+_5007306 | 5.97 |
ENSMUST00000178155.2
ENSMUST00000184256.1 ENSMUST00000185147.1 |
Smim22
|
small integral membrane protein 22 |
| chr16_-_97611072 | 5.97 |
ENSMUST00000000395.6
|
Tmprss2
|
transmembrane protease, serine 2 |
| chr2_-_155729359 | 5.96 |
ENSMUST00000040833.4
|
Edem2
|
ER degradation enhancer, mannosidase alpha-like 2 |
| chr7_-_30973367 | 5.94 |
ENSMUST00000108116.3
|
Lsr
|
lipolysis stimulated lipoprotein receptor |
| chr7_-_30924169 | 5.90 |
ENSMUST00000074671.6
|
Hamp2
|
hepcidin antimicrobial peptide 2 |
| chr14_+_58075115 | 5.88 |
ENSMUST00000074654.5
|
Fgf9
|
fibroblast growth factor 9 |
| chr7_-_3677509 | 5.88 |
ENSMUST00000038743.8
|
Tmc4
|
transmembrane channel-like gene family 4 |
| chr2_-_121806988 | 5.85 |
ENSMUST00000110592.1
|
Frmd5
|
FERM domain containing 5 |
| chr7_+_4119556 | 5.79 |
ENSMUST00000079415.5
|
Ttyh1
|
tweety homolog 1 (Drosophila) |
| chr9_+_114978507 | 5.75 |
ENSMUST00000183104.1
|
Osbpl10
|
oxysterol binding protein-like 10 |
| chr18_+_24653691 | 5.75 |
ENSMUST00000068006.7
|
Mocos
|
molybdenum cofactor sulfurase |
| chr9_-_114844090 | 5.75 |
ENSMUST00000047013.3
|
Cmtm8
|
CKLF-like MARVEL transmembrane domain containing 8 |
| chr2_-_129699833 | 5.73 |
ENSMUST00000028883.5
|
Pdyn
|
prodynorphin |
| chr4_+_43059028 | 5.69 |
ENSMUST00000163653.1
ENSMUST00000107952.2 ENSMUST00000107953.2 |
Unc13b
|
unc-13 homolog B (C. elegans) |
| chr1_+_118627943 | 5.64 |
ENSMUST00000027629.8
|
Tfcp2l1
|
transcription factor CP2-like 1 |
| chrX_-_164980279 | 5.63 |
ENSMUST00000112247.2
|
Mospd2
|
motile sperm domain containing 2 |
| chr12_-_113422730 | 5.62 |
ENSMUST00000177715.1
ENSMUST00000103426.1 |
Ighm
|
immunoglobulin heavy constant mu |
| chr13_-_92131494 | 5.62 |
ENSMUST00000099326.3
ENSMUST00000146492.1 |
Rasgrf2
|
RAS protein-specific guanine nucleotide-releasing factor 2 |
| chr10_-_81291227 | 5.61 |
ENSMUST00000045744.6
|
Tjp3
|
tight junction protein 3 |
| chr3_+_122729158 | 5.58 |
ENSMUST00000066728.5
|
Pde5a
|
phosphodiesterase 5A, cGMP-specific |
| chr4_-_58553553 | 5.54 |
ENSMUST00000107575.2
ENSMUST00000107574.1 ENSMUST00000147354.1 |
Lpar1
|
lysophosphatidic acid receptor 1 |
| chr1_-_136230289 | 5.53 |
ENSMUST00000150163.1
ENSMUST00000144464.1 |
5730559C18Rik
|
RIKEN cDNA 5730559C18 gene |
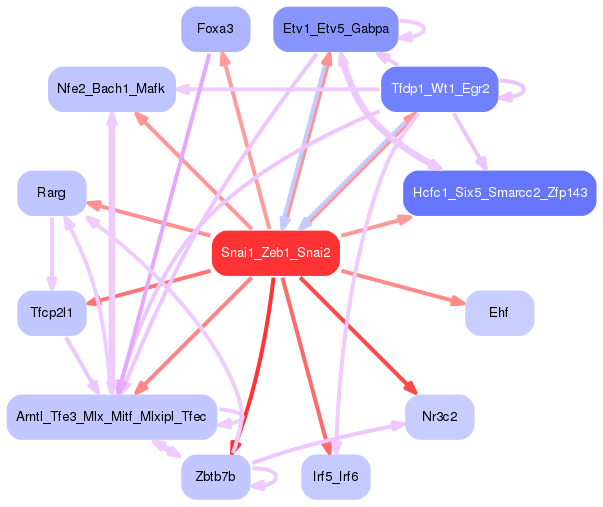
Network of associatons between targets according to the STRING database.

First level regulatory network of Snai1_Zeb1_Snai2
Gene Ontology Analysis
Gene overrepresentation in biological process category:
| Log-likelihood per target | Total log-likelihood | Term | Description |
|---|---|---|---|
| 10.5 | 31.5 | GO:0042323 | negative regulation of circadian sleep/wake cycle, non-REM sleep(GO:0042323) negative regulation of mucus secretion(GO:0070256) |
| 7.8 | 46.7 | GO:0018992 | germ-line sex determination(GO:0018992) |
| 6.4 | 25.8 | GO:0043376 | regulation of CD8-positive, alpha-beta T cell differentiation(GO:0043376) |
| 6.4 | 19.2 | GO:1904274 | tricellular tight junction assembly(GO:1904274) |
| 6.3 | 18.8 | GO:0060672 | epithelial cell differentiation involved in embryonic placenta development(GO:0060671) epithelial cell morphogenesis involved in placental branching(GO:0060672) |
| 5.4 | 21.8 | GO:0016332 | establishment or maintenance of polarity of embryonic epithelium(GO:0016332) |
| 5.4 | 21.4 | GO:0003165 | Purkinje myocyte development(GO:0003165) |
| 5.0 | 29.9 | GO:0032439 | endosome localization(GO:0032439) |
| 4.9 | 14.7 | GO:0031959 | mineralocorticoid receptor signaling pathway(GO:0031959) |
| 4.8 | 19.4 | GO:1902896 | terminal web assembly(GO:1902896) |
| 3.9 | 11.7 | GO:0043134 | hindgut contraction(GO:0043133) regulation of hindgut contraction(GO:0043134) |
| 3.9 | 11.6 | GO:0045079 | negative regulation of chemokine biosynthetic process(GO:0045079) |
| 3.7 | 70.3 | GO:0032463 | negative regulation of protein homooligomerization(GO:0032463) |
| 3.6 | 10.8 | GO:0043311 | positive regulation of eosinophil degranulation(GO:0043311) positive regulation of eosinophil activation(GO:1902568) |
| 3.6 | 39.1 | GO:0045198 | establishment of epithelial cell apical/basal polarity(GO:0045198) |
| 3.5 | 17.3 | GO:0033277 | abortive mitotic cell cycle(GO:0033277) |
| 3.4 | 6.9 | GO:0072034 | renal vesicle induction(GO:0072034) |
| 3.3 | 3.3 | GO:1902996 | neurofibrillary tangle assembly(GO:1902988) regulation of neurofibrillary tangle assembly(GO:1902996) |
| 3.0 | 8.9 | GO:0033861 | negative regulation of NAD(P)H oxidase activity(GO:0033861) |
| 2.9 | 14.6 | GO:0060066 | oviduct development(GO:0060066) |
| 2.8 | 34.1 | GO:0070863 | positive regulation of protein exit from endoplasmic reticulum(GO:0070863) |
| 2.8 | 8.5 | GO:0002325 | peptidoglycan metabolic process(GO:0000270) natural killer cell differentiation involved in immune response(GO:0002325) peptidoglycan catabolic process(GO:0009253) negative regulation of natural killer cell differentiation(GO:0032824) regulation of natural killer cell differentiation involved in immune response(GO:0032826) negative regulation of natural killer cell differentiation involved in immune response(GO:0032827) |
| 2.8 | 5.6 | GO:0051464 | cortisol secretion(GO:0043400) regulation of cortisol secretion(GO:0051462) positive regulation of cortisol secretion(GO:0051464) |
| 2.8 | 11.3 | GO:0002415 | immunoglobulin transcytosis in epithelial cells mediated by polymeric immunoglobulin receptor(GO:0002415) |
| 2.8 | 14.0 | GO:0070384 | Harderian gland development(GO:0070384) |
| 2.8 | 11.2 | GO:0006556 | S-adenosylmethionine biosynthetic process(GO:0006556) |
| 2.8 | 11.2 | GO:0001992 | regulation of systemic arterial blood pressure by vasopressin(GO:0001992) |
| 2.8 | 11.0 | GO:0018101 | protein citrullination(GO:0018101) histone citrullination(GO:0036414) |
| 2.8 | 11.0 | GO:1904565 | response to 1-oleoyl-sn-glycerol 3-phosphate(GO:1904565) cellular response to 1-oleoyl-sn-glycerol 3-phosphate(GO:1904566) |
| 2.7 | 11.0 | GO:0034757 | negative regulation of iron ion transport(GO:0034757) negative regulation of iron ion transmembrane transport(GO:0034760) |
| 2.7 | 19.0 | GO:0071896 | protein localization to adherens junction(GO:0071896) |
| 2.7 | 5.4 | GO:0051794 | regulation of catagen(GO:0051794) |
| 2.6 | 15.8 | GO:0019532 | oxalate transport(GO:0019532) |
| 2.6 | 10.3 | GO:0010808 | positive regulation of synaptic vesicle priming(GO:0010808) |
| 2.6 | 17.9 | GO:1904217 | regulation of CDP-diacylglycerol-serine O-phosphatidyltransferase activity(GO:1904217) positive regulation of CDP-diacylglycerol-serine O-phosphatidyltransferase activity(GO:1904219) positive regulation of serine C-palmitoyltransferase activity(GO:1904222) |
| 2.6 | 12.8 | GO:0045163 | clustering of voltage-gated potassium channels(GO:0045163) |
| 2.5 | 9.9 | GO:0046898 | response to cycloheximide(GO:0046898) |
| 2.4 | 9.7 | GO:0060598 | dichotomous subdivision of terminal units involved in mammary gland duct morphogenesis(GO:0060598) |
| 2.3 | 9.3 | GO:0038163 | thrombopoietin-mediated signaling pathway(GO:0038163) |
| 2.3 | 9.2 | GO:1903059 | regulation of protein lipidation(GO:1903059) |
| 2.3 | 4.5 | GO:0032910 | transforming growth factor beta3 production(GO:0032907) regulation of transforming growth factor beta3 production(GO:0032910) |
| 2.2 | 6.7 | GO:0060447 | bud outgrowth involved in lung branching(GO:0060447) |
| 2.2 | 4.4 | GO:1903903 | regulation of establishment of T cell polarity(GO:1903903) |
| 2.2 | 13.2 | GO:0002159 | desmosome assembly(GO:0002159) |
| 2.2 | 10.8 | GO:0000738 | DNA catabolic process, exonucleolytic(GO:0000738) |
| 2.1 | 17.0 | GO:0031580 | membrane raft polarization(GO:0001766) membrane raft distribution(GO:0031580) |
| 2.1 | 14.8 | GO:0060484 | lung-associated mesenchyme development(GO:0060484) |
| 2.1 | 21.1 | GO:0045617 | negative regulation of keratinocyte differentiation(GO:0045617) |
| 2.1 | 79.4 | GO:0060445 | branching involved in salivary gland morphogenesis(GO:0060445) |
| 2.0 | 6.1 | GO:0018900 | dichloromethane metabolic process(GO:0018900) chlorinated hydrocarbon metabolic process(GO:0042196) halogenated hydrocarbon metabolic process(GO:0042197) |
| 2.0 | 2.0 | GO:2001188 | negative regulation of immunological synapse formation(GO:2000521) regulation of T cell activation via T cell receptor contact with antigen bound to MHC molecule on antigen presenting cell(GO:2001188) negative regulation of T cell activation via T cell receptor contact with antigen bound to MHC molecule on antigen presenting cell(GO:2001189) |
| 2.0 | 10.1 | GO:0033762 | response to glucagon(GO:0033762) |
| 2.0 | 12.0 | GO:0071985 | multivesicular body sorting pathway(GO:0071985) |
| 2.0 | 19.5 | GO:0033689 | negative regulation of osteoblast proliferation(GO:0033689) |
| 1.9 | 7.8 | GO:0071847 | TNFSF11-mediated signaling pathway(GO:0071847) |
| 1.9 | 9.7 | GO:0086042 | cardiac muscle cell-cardiac muscle cell adhesion(GO:0086042) |
| 1.9 | 5.6 | GO:0002343 | peripheral B cell selection(GO:0002343) B cell affinity maturation(GO:0002344) |
| 1.9 | 16.7 | GO:0006682 | galactosylceramide biosynthetic process(GO:0006682) galactolipid biosynthetic process(GO:0019375) |
| 1.9 | 7.4 | GO:1904395 | positive regulation of skeletal muscle acetylcholine-gated channel clustering(GO:1904395) |
| 1.9 | 5.6 | GO:0046351 | disaccharide biosynthetic process(GO:0046351) |
| 1.8 | 5.5 | GO:0046341 | CDP-diacylglycerol metabolic process(GO:0046341) |
| 1.8 | 5.4 | GO:1905035 | regulation of antifungal innate immune response(GO:1905034) negative regulation of antifungal innate immune response(GO:1905035) |
| 1.8 | 7.1 | GO:1902414 | protein localization to cell junction(GO:1902414) |
| 1.8 | 5.3 | GO:0034224 | cellular response to zinc ion starvation(GO:0034224) |
| 1.7 | 5.2 | GO:0002879 | positive regulation of acute inflammatory response to non-antigenic stimulus(GO:0002879) |
| 1.7 | 3.5 | GO:1901079 | positive regulation of relaxation of muscle(GO:1901079) |
| 1.7 | 5.1 | GO:0061090 | positive regulation of sequestering of zinc ion(GO:0061090) |
| 1.7 | 6.7 | GO:1900019 | regulation of protein kinase C activity(GO:1900019) positive regulation of protein kinase C activity(GO:1900020) |
| 1.7 | 6.6 | GO:0014916 | regulation of lung blood pressure(GO:0014916) |
| 1.6 | 9.8 | GO:0038161 | prolactin signaling pathway(GO:0038161) |
| 1.6 | 6.3 | GO:0002408 | myeloid dendritic cell chemotaxis(GO:0002408) |
| 1.6 | 3.1 | GO:0060003 | copper ion export(GO:0060003) |
| 1.6 | 7.8 | GO:0060157 | urinary bladder development(GO:0060157) |
| 1.5 | 4.6 | GO:2001074 | negative regulation of metanephric glomerulus development(GO:0072299) negative regulation of metanephric glomerular mesangial cell proliferation(GO:0072302) regulation of metanephric ureteric bud development(GO:2001074) positive regulation of metanephric ureteric bud development(GO:2001076) |
| 1.5 | 10.3 | GO:2001199 | negative regulation of dendritic cell differentiation(GO:2001199) |
| 1.5 | 5.9 | GO:2000048 | negative regulation of cell-cell adhesion mediated by cadherin(GO:2000048) |
| 1.4 | 5.8 | GO:0061623 | glycolytic process from galactose(GO:0061623) |
| 1.4 | 1.4 | GO:0002752 | cell surface pattern recognition receptor signaling pathway(GO:0002752) |
| 1.4 | 8.5 | GO:0018094 | protein polyglycylation(GO:0018094) |
| 1.4 | 8.5 | GO:0000160 | phosphorelay signal transduction system(GO:0000160) |
| 1.4 | 16.8 | GO:0060670 | branching involved in labyrinthine layer morphogenesis(GO:0060670) |
| 1.4 | 5.6 | GO:0060282 | positive regulation of oocyte development(GO:0060282) |
| 1.4 | 5.6 | GO:0030070 | insulin processing(GO:0030070) |
| 1.4 | 2.8 | GO:0071681 | response to indole-3-methanol(GO:0071680) cellular response to indole-3-methanol(GO:0071681) |
| 1.4 | 4.1 | GO:0042374 | phylloquinone metabolic process(GO:0042374) phylloquinone catabolic process(GO:0042376) quinone catabolic process(GO:1901662) |
| 1.4 | 8.2 | GO:0060762 | regulation of branching involved in mammary gland duct morphogenesis(GO:0060762) |
| 1.3 | 4.0 | GO:1990869 | response to chemokine(GO:1990868) cellular response to chemokine(GO:1990869) |
| 1.3 | 4.0 | GO:0010360 | negative regulation of anion channel activity(GO:0010360) |
| 1.3 | 6.6 | GO:0090080 | positive regulation of MAPKKK cascade by fibroblast growth factor receptor signaling pathway(GO:0090080) |
| 1.3 | 5.3 | GO:0097195 | pilomotor reflex(GO:0097195) |
| 1.3 | 1.3 | GO:0021650 | vestibulocochlear nerve formation(GO:0021650) |
| 1.3 | 2.6 | GO:0030969 | mRNA splicing via endonucleolytic cleavage and ligation involved in unfolded protein response(GO:0030969) mRNA splicing, via endonucleolytic cleavage and ligation(GO:0070054) mRNA endonucleolytic cleavage involved in unfolded protein response(GO:0070055) |
| 1.3 | 3.9 | GO:0061762 | CAMKK-AMPK signaling cascade(GO:0061762) |
| 1.2 | 3.6 | GO:0044240 | multicellular organism lipid catabolic process(GO:0044240) |
| 1.2 | 6.0 | GO:0001920 | negative regulation of receptor recycling(GO:0001920) |
| 1.2 | 6.0 | GO:0046133 | pyrimidine ribonucleoside catabolic process(GO:0046133) |
| 1.2 | 3.6 | GO:0070358 | actin polymerization-dependent cell motility(GO:0070358) |
| 1.2 | 3.6 | GO:1903279 | regulation of calcium:sodium antiporter activity(GO:1903279) |
| 1.2 | 4.8 | GO:0035962 | response to interleukin-13(GO:0035962) cellular response to interleukin-13(GO:0035963) |
| 1.2 | 3.6 | GO:0071442 | positive regulation of histone H3-K14 acetylation(GO:0071442) |
| 1.2 | 1.2 | GO:0051665 | membrane raft localization(GO:0051665) |
| 1.2 | 3.5 | GO:0010980 | regulation of vitamin D 24-hydroxylase activity(GO:0010979) positive regulation of vitamin D 24-hydroxylase activity(GO:0010980) |
| 1.2 | 4.7 | GO:0034031 | coenzyme A catabolic process(GO:0015938) nucleoside bisphosphate catabolic process(GO:0033869) ribonucleoside bisphosphate catabolic process(GO:0034031) purine nucleoside bisphosphate catabolic process(GO:0034034) |
| 1.2 | 11.7 | GO:1903298 | regulation of hypoxia-induced intrinsic apoptotic signaling pathway(GO:1903297) negative regulation of hypoxia-induced intrinsic apoptotic signaling pathway(GO:1903298) |
| 1.2 | 3.5 | GO:0097212 | lysosomal membrane organization(GO:0097212) |
| 1.2 | 3.5 | GO:0006227 | dUDP biosynthetic process(GO:0006227) pyrimidine nucleoside diphosphate metabolic process(GO:0009138) pyrimidine nucleoside diphosphate biosynthetic process(GO:0009139) pyrimidine deoxyribonucleoside diphosphate metabolic process(GO:0009196) pyrimidine deoxyribonucleoside diphosphate biosynthetic process(GO:0009197) dUDP metabolic process(GO:0046077) |
| 1.1 | 3.4 | GO:0032304 | negative regulation of icosanoid secretion(GO:0032304) |
| 1.1 | 6.8 | GO:2000667 | positive regulation of interleukin-5 secretion(GO:2000664) positive regulation of interleukin-13 secretion(GO:2000667) |
| 1.1 | 1.1 | GO:0051542 | elastin biosynthetic process(GO:0051542) |
| 1.1 | 4.5 | GO:0010958 | regulation of amino acid import(GO:0010958) |
| 1.1 | 15.5 | GO:0098719 | sodium ion import across plasma membrane(GO:0098719) sodium ion import into cell(GO:1990118) |
| 1.1 | 9.9 | GO:0002349 | histamine production involved in inflammatory response(GO:0002349) histamine secretion involved in inflammatory response(GO:0002441) histamine secretion by mast cell(GO:0002553) |
| 1.1 | 7.7 | GO:0035948 | positive regulation of gluconeogenesis by positive regulation of transcription from RNA polymerase II promoter(GO:0035948) |
| 1.1 | 3.3 | GO:0006004 | fucose metabolic process(GO:0006004) |
| 1.1 | 1.1 | GO:0060455 | negative regulation of gastric acid secretion(GO:0060455) |
| 1.1 | 3.2 | GO:0072488 | ammonium transmembrane transport(GO:0072488) |
| 1.1 | 3.2 | GO:0010536 | positive regulation of activation of Janus kinase activity(GO:0010536) |
| 1.1 | 3.2 | GO:0042726 | flavin-containing compound metabolic process(GO:0042726) |
| 1.0 | 4.2 | GO:2000660 | negative regulation of interleukin-1-mediated signaling pathway(GO:2000660) |
| 1.0 | 1.0 | GO:0072603 | interleukin-5 secretion(GO:0072603) interleukin-13 secretion(GO:0072611) regulation of interleukin-5 secretion(GO:2000662) regulation of interleukin-13 secretion(GO:2000665) |
| 1.0 | 5.2 | GO:2001274 | negative regulation of glucose import in response to insulin stimulus(GO:2001274) |
| 1.0 | 3.1 | GO:0097501 | stress response to metal ion(GO:0097501) |
| 1.0 | 7.1 | GO:0009449 | gamma-aminobutyric acid biosynthetic process(GO:0009449) |
| 1.0 | 4.1 | GO:0014052 | regulation of gamma-aminobutyric acid secretion(GO:0014052) |
| 1.0 | 4.0 | GO:1990743 | protein sialylation(GO:1990743) |
| 1.0 | 1.0 | GO:0097112 | gamma-aminobutyric acid receptor clustering(GO:0097112) |
| 1.0 | 1.0 | GO:0007161 | calcium-independent cell-matrix adhesion(GO:0007161) |
| 1.0 | 1.0 | GO:0090191 | negative regulation of branching involved in ureteric bud morphogenesis(GO:0090191) |
| 1.0 | 12.0 | GO:0006751 | glutathione catabolic process(GO:0006751) |
| 1.0 | 5.0 | GO:0002484 | antigen processing and presentation of endogenous peptide antigen via MHC class I via ER pathway(GO:0002484) antigen processing and presentation of endogenous peptide antigen via MHC class I via ER pathway, TAP-dependent(GO:0002485) |
| 1.0 | 4.9 | GO:0008291 | acetylcholine metabolic process(GO:0008291) acetate ester metabolic process(GO:1900619) |
| 1.0 | 2.0 | GO:0035526 | retrograde transport, plasma membrane to Golgi(GO:0035526) |
| 1.0 | 2.0 | GO:0002934 | desmosome organization(GO:0002934) |
| 1.0 | 9.8 | GO:0046598 | positive regulation of viral entry into host cell(GO:0046598) |
| 1.0 | 2.0 | GO:0032286 | central nervous system myelin maintenance(GO:0032286) |
| 1.0 | 5.9 | GO:0010730 | negative regulation of hydrogen peroxide biosynthetic process(GO:0010730) |
| 1.0 | 6.7 | GO:0048227 | plasma membrane to endosome transport(GO:0048227) |
| 1.0 | 3.8 | GO:0035609 | C-terminal protein deglutamylation(GO:0035609) |
| 1.0 | 5.7 | GO:0032483 | regulation of Rab protein signal transduction(GO:0032483) |
| 0.9 | 2.8 | GO:0070488 | neutrophil aggregation(GO:0070488) |
| 0.9 | 10.4 | GO:0070166 | enamel mineralization(GO:0070166) |
| 0.9 | 3.8 | GO:0010641 | positive regulation of platelet-derived growth factor receptor signaling pathway(GO:0010641) |
| 0.9 | 1.9 | GO:0019732 | antifungal humoral response(GO:0019732) |
| 0.9 | 9.2 | GO:0005513 | detection of calcium ion(GO:0005513) |
| 0.9 | 2.8 | GO:2000314 | negative regulation of fibroblast growth factor receptor signaling pathway involved in neural plate anterior/posterior pattern formation(GO:2000314) |
| 0.9 | 8.3 | GO:0035021 | negative regulation of Rac protein signal transduction(GO:0035021) |
| 0.9 | 1.8 | GO:0016344 | meiotic chromosome movement towards spindle pole(GO:0016344) |
| 0.9 | 0.9 | GO:1905167 | positive regulation of lysosomal protein catabolic process(GO:1905167) |
| 0.9 | 6.2 | GO:0060363 | cranial suture morphogenesis(GO:0060363) |
| 0.9 | 5.3 | GO:0072092 | ureteric bud invasion(GO:0072092) |
| 0.9 | 7.9 | GO:0097118 | neuroligin clustering involved in postsynaptic membrane assembly(GO:0097118) |
| 0.9 | 5.3 | GO:0019720 | Mo-molybdopterin cofactor biosynthetic process(GO:0006777) Mo-molybdopterin cofactor metabolic process(GO:0019720) |
| 0.9 | 5.3 | GO:0002835 | negative regulation of response to tumor cell(GO:0002835) negative regulation of immune response to tumor cell(GO:0002838) |
| 0.9 | 4.4 | GO:0000103 | sulfate assimilation(GO:0000103) |
| 0.9 | 5.2 | GO:0044351 | macropinocytosis(GO:0044351) |
| 0.9 | 7.0 | GO:0033353 | S-adenosylmethionine cycle(GO:0033353) |
| 0.9 | 1.7 | GO:0060084 | synaptic transmission involved in micturition(GO:0060084) |
| 0.9 | 1.7 | GO:0070948 | regulation of neutrophil mediated cytotoxicity(GO:0070948) regulation of neutrophil mediated killing of symbiont cell(GO:0070949) |
| 0.9 | 0.9 | GO:0035502 | metanephric part of ureteric bud development(GO:0035502) |
| 0.9 | 2.6 | GO:2000768 | glomerular parietal epithelial cell differentiation(GO:0072139) positive regulation of nephron tubule epithelial cell differentiation(GO:2000768) |
| 0.9 | 3.4 | GO:0009992 | cellular water homeostasis(GO:0009992) |
| 0.9 | 5.1 | GO:0001561 | fatty acid alpha-oxidation(GO:0001561) |
| 0.8 | 2.5 | GO:0090341 | negative regulation of secretion of lysosomal enzymes(GO:0090341) |
| 0.8 | 11.9 | GO:0031268 | pseudopodium organization(GO:0031268) |
| 0.8 | 6.8 | GO:1900029 | positive regulation of ruffle assembly(GO:1900029) |
| 0.8 | 7.6 | GO:0061713 | neural crest cell migration involved in heart formation(GO:0003147) anterior neural tube closure(GO:0061713) cellular response to folic acid(GO:0071231) |
| 0.8 | 2.5 | GO:0060809 | CD8-positive, alpha-beta T cell differentiation involved in immune response(GO:0002302) mesodermal to mesenchymal transition involved in gastrulation(GO:0060809) |
| 0.8 | 9.3 | GO:0044336 | canonical Wnt signaling pathway involved in negative regulation of apoptotic process(GO:0044336) |
| 0.8 | 5.9 | GO:0019262 | N-acetylneuraminate catabolic process(GO:0019262) |
| 0.8 | 4.2 | GO:2000327 | regulation of ligand-dependent nuclear receptor transcription coactivator activity(GO:2000325) positive regulation of ligand-dependent nuclear receptor transcription coactivator activity(GO:2000327) |
| 0.8 | 3.4 | GO:0010956 | negative regulation of calcidiol 1-monooxygenase activity(GO:0010956) |
| 0.8 | 5.0 | GO:0044375 | regulation of peroxisome size(GO:0044375) |
| 0.8 | 9.2 | GO:0007342 | fusion of sperm to egg plasma membrane(GO:0007342) |
| 0.8 | 8.4 | GO:0016554 | cytidine to uridine editing(GO:0016554) |
| 0.8 | 1.7 | GO:0060005 | vestibular reflex(GO:0060005) |
| 0.8 | 1.7 | GO:0060648 | mammary gland bud morphogenesis(GO:0060648) |
| 0.8 | 2.5 | GO:0060468 | prevention of polyspermy(GO:0060468) |
| 0.8 | 8.3 | GO:0033603 | positive regulation of dopamine secretion(GO:0033603) |
| 0.8 | 10.7 | GO:0097264 | self proteolysis(GO:0097264) |
| 0.8 | 2.4 | GO:0071873 | response to norepinephrine(GO:0071873) |
| 0.8 | 7.3 | GO:0030432 | peristalsis(GO:0030432) |
| 0.8 | 3.2 | GO:0097494 | regulation of vesicle size(GO:0097494) |
| 0.8 | 3.2 | GO:0009814 | defense response, incompatible interaction(GO:0009814) defense response to bacterium, incompatible interaction(GO:0009816) regulation of defense response to bacterium, incompatible interaction(GO:1902477) |
| 0.8 | 18.4 | GO:0035313 | wound healing, spreading of epidermal cells(GO:0035313) |
| 0.8 | 4.8 | GO:0015871 | choline transport(GO:0015871) |
| 0.8 | 3.2 | GO:0032237 | activation of store-operated calcium channel activity(GO:0032237) |
| 0.8 | 7.9 | GO:0007168 | receptor guanylyl cyclase signaling pathway(GO:0007168) |
| 0.8 | 6.3 | GO:1903208 | neuron death in response to hydrogen peroxide(GO:0036476) regulation of hydrogen peroxide-induced neuron death(GO:1903207) negative regulation of hydrogen peroxide-induced neuron death(GO:1903208) |
| 0.8 | 3.9 | GO:0001923 | B-1 B cell differentiation(GO:0001923) |
| 0.8 | 4.7 | GO:0021631 | optic nerve morphogenesis(GO:0021631) |
| 0.8 | 0.8 | GO:0071674 | mononuclear cell migration(GO:0071674) |
| 0.8 | 2.3 | GO:0015746 | tricarboxylic acid transport(GO:0006842) citrate transport(GO:0015746) |
| 0.8 | 2.3 | GO:0035585 | calcium-mediated signaling using extracellular calcium source(GO:0035585) |
| 0.8 | 2.3 | GO:0009726 | detection of nodal flow(GO:0003127) detection of endogenous stimulus(GO:0009726) |
| 0.8 | 8.5 | GO:0090557 | establishment of endothelial intestinal barrier(GO:0090557) |
| 0.8 | 2.3 | GO:0060821 | inactivation of X chromosome by DNA methylation(GO:0060821) |
| 0.8 | 2.3 | GO:0046168 | glycerol-3-phosphate catabolic process(GO:0046168) |
| 0.8 | 8.4 | GO:0015868 | purine ribonucleotide transport(GO:0015868) |
| 0.8 | 10.6 | GO:0090331 | negative regulation of platelet aggregation(GO:0090331) |
| 0.8 | 2.3 | GO:0090004 | positive regulation of Golgi to plasma membrane protein transport(GO:0042998) positive regulation of establishment of protein localization to plasma membrane(GO:0090004) |
| 0.8 | 3.8 | GO:0015820 | branched-chain amino acid transport(GO:0015803) leucine transport(GO:0015820) |
| 0.8 | 6.1 | GO:1903715 | regulation of aerobic respiration(GO:1903715) |
| 0.8 | 3.0 | GO:0045897 | regulation of transcription during mitosis(GO:0045896) positive regulation of transcription during mitosis(GO:0045897) |
| 0.8 | 0.8 | GO:0014028 | notochord formation(GO:0014028) |
| 0.8 | 2.3 | GO:1903237 | negative regulation of leukocyte tethering or rolling(GO:1903237) |
| 0.7 | 0.7 | GO:0002589 | regulation of antigen processing and presentation of peptide antigen via MHC class I(GO:0002589) |
| 0.7 | 2.2 | GO:0021589 | hindbrain structural organization(GO:0021577) cerebellum structural organization(GO:0021589) spinal cord motor neuron migration(GO:0097476) lateral motor column neuron migration(GO:0097477) |
| 0.7 | 0.7 | GO:0009174 | UMP biosynthetic process(GO:0006222) pyrimidine ribonucleoside monophosphate metabolic process(GO:0009173) pyrimidine ribonucleoside monophosphate biosynthetic process(GO:0009174) UMP metabolic process(GO:0046049) |
| 0.7 | 3.0 | GO:2001271 | negative regulation of cysteine-type endopeptidase activity involved in execution phase of apoptosis(GO:2001271) |
| 0.7 | 4.4 | GO:0050968 | detection of chemical stimulus involved in sensory perception of pain(GO:0050968) |
| 0.7 | 5.1 | GO:0021894 | cerebral cortex GABAergic interneuron development(GO:0021894) |
| 0.7 | 0.7 | GO:0060478 | acrosomal vesicle exocytosis(GO:0060478) |
| 0.7 | 2.2 | GO:0045660 | positive regulation of neutrophil differentiation(GO:0045660) |
| 0.7 | 2.2 | GO:0010716 | negative regulation of extracellular matrix disassembly(GO:0010716) |
| 0.7 | 0.7 | GO:0055099 | response to high density lipoprotein particle(GO:0055099) |
| 0.7 | 3.6 | GO:0070164 | negative regulation of adiponectin secretion(GO:0070164) |
| 0.7 | 10.2 | GO:0036065 | fucosylation(GO:0036065) |
| 0.7 | 1.5 | GO:1904685 | positive regulation of metalloendopeptidase activity(GO:1904685) |
| 0.7 | 10.1 | GO:0061577 | calcium ion transmembrane transport via high voltage-gated calcium channel(GO:0061577) |
| 0.7 | 4.3 | GO:0048861 | leukemia inhibitory factor signaling pathway(GO:0048861) |
| 0.7 | 2.9 | GO:0031133 | regulation of axon diameter(GO:0031133) |
| 0.7 | 5.0 | GO:0006517 | protein deglycosylation(GO:0006517) |
| 0.7 | 1.4 | GO:0060300 | regulation of cytokine activity(GO:0060300) |
| 0.7 | 4.2 | GO:0038128 | ERBB2 signaling pathway(GO:0038128) |
| 0.7 | 2.8 | GO:0060376 | positive regulation of mast cell differentiation(GO:0060376) |
| 0.7 | 1.4 | GO:0042539 | hypotonic salinity response(GO:0042539) cellular hypotonic salinity response(GO:0071477) |
| 0.7 | 3.5 | GO:0042117 | monocyte activation(GO:0042117) |
| 0.7 | 4.2 | GO:0097186 | amelogenesis(GO:0097186) |
| 0.7 | 3.5 | GO:0061086 | negative regulation of histone H3-K27 methylation(GO:0061086) |
| 0.7 | 2.8 | GO:0061152 | trachea submucosa development(GO:0061152) trachea gland development(GO:0061153) |
| 0.7 | 9.0 | GO:0010763 | positive regulation of fibroblast migration(GO:0010763) |
| 0.7 | 1.4 | GO:0032849 | regulation of cellular pH reduction(GO:0032847) positive regulation of cellular pH reduction(GO:0032849) |
| 0.7 | 1.4 | GO:0019323 | pentose catabolic process(GO:0019323) |
| 0.7 | 16.5 | GO:0051639 | actin filament network formation(GO:0051639) |
| 0.7 | 1.4 | GO:0032962 | positive regulation of inositol trisphosphate biosynthetic process(GO:0032962) |
| 0.7 | 2.7 | GO:0048496 | maintenance of organ identity(GO:0048496) |
| 0.7 | 3.4 | GO:0035359 | negative regulation of peroxisome proliferator activated receptor signaling pathway(GO:0035359) |
| 0.7 | 2.0 | GO:0007181 | transforming growth factor beta receptor complex assembly(GO:0007181) |
| 0.7 | 2.0 | GO:0008358 | oocyte construction(GO:0007308) oocyte axis specification(GO:0007309) oocyte anterior/posterior axis specification(GO:0007314) pole plasm assembly(GO:0007315) maternal determination of anterior/posterior axis, embryo(GO:0008358) P granule organization(GO:0030719) |
| 0.7 | 2.0 | GO:0030862 | neuroblast division in subventricular zone(GO:0021849) positive regulation of polarized epithelial cell differentiation(GO:0030862) |
| 0.7 | 2.7 | GO:0070368 | positive regulation of hepatocyte differentiation(GO:0070368) |
| 0.7 | 3.3 | GO:0032349 | positive regulation of aldosterone metabolic process(GO:0032346) positive regulation of aldosterone biosynthetic process(GO:0032349) |
| 0.7 | 3.3 | GO:1903275 | positive regulation of sodium ion export(GO:1903275) positive regulation of sodium ion export from cell(GO:1903278) |
| 0.7 | 9.9 | GO:0032494 | response to peptidoglycan(GO:0032494) |
| 0.7 | 2.0 | GO:0035621 | ER to Golgi ceramide transport(GO:0035621) ceramide transport(GO:0035627) |
| 0.6 | 3.9 | GO:2000394 | positive regulation of lamellipodium morphogenesis(GO:2000394) |
| 0.6 | 11.7 | GO:0001675 | acrosome assembly(GO:0001675) |
| 0.6 | 1.3 | GO:0043396 | corticotropin-releasing hormone secretion(GO:0043396) regulation of corticotropin-releasing hormone secretion(GO:0043397) positive regulation of corticotropin-releasing hormone secretion(GO:0051466) |
| 0.6 | 3.9 | GO:0003383 | apical constriction(GO:0003383) |
| 0.6 | 5.2 | GO:0006027 | glycosaminoglycan catabolic process(GO:0006027) |
| 0.6 | 12.9 | GO:0048312 | intracellular distribution of mitochondria(GO:0048312) |
| 0.6 | 3.9 | GO:0031547 | brain-derived neurotrophic factor receptor signaling pathway(GO:0031547) |
| 0.6 | 2.6 | GO:1903575 | cornified envelope assembly(GO:1903575) |
| 0.6 | 7.7 | GO:0034242 | negative regulation of syncytium formation by plasma membrane fusion(GO:0034242) |
| 0.6 | 3.2 | GO:0014005 | microglia differentiation(GO:0014004) microglia development(GO:0014005) |
| 0.6 | 2.6 | GO:2000195 | negative regulation of female gonad development(GO:2000195) |
| 0.6 | 8.3 | GO:0002070 | epithelial cell maturation(GO:0002070) |
| 0.6 | 33.1 | GO:1903078 | positive regulation of protein localization to plasma membrane(GO:1903078) |
| 0.6 | 2.5 | GO:0072272 | proximal/distal pattern formation involved in metanephric nephron development(GO:0072272) |
| 0.6 | 1.3 | GO:0061526 | acetylcholine secretion, neurotransmission(GO:0014055) regulation of acetylcholine secretion, neurotransmission(GO:0014056) acetylcholine secretion(GO:0061526) |
| 0.6 | 10.1 | GO:0006491 | N-glycan processing(GO:0006491) |
| 0.6 | 5.7 | GO:1904152 | negative regulation of protein exit from endoplasmic reticulum(GO:0070862) regulation of retrograde protein transport, ER to cytosol(GO:1904152) negative regulation of retrograde protein transport, ER to cytosol(GO:1904153) |
| 0.6 | 6.9 | GO:0060644 | mammary gland epithelial cell differentiation(GO:0060644) |
| 0.6 | 3.1 | GO:0070471 | uterine smooth muscle contraction(GO:0070471) |
| 0.6 | 6.9 | GO:2000580 | positive regulation of microtubule motor activity(GO:2000576) regulation of ATP-dependent microtubule motor activity, plus-end-directed(GO:2000580) positive regulation of ATP-dependent microtubule motor activity, plus-end-directed(GO:2000582) |
| 0.6 | 1.9 | GO:0060754 | positive regulation of mast cell chemotaxis(GO:0060754) |
| 0.6 | 1.9 | GO:0016240 | autophagosome docking(GO:0016240) |
| 0.6 | 1.2 | GO:0018076 | N-terminal peptidyl-lysine acetylation(GO:0018076) |
| 0.6 | 1.2 | GO:0048294 | negative regulation of isotype switching to IgE isotypes(GO:0048294) |
| 0.6 | 1.8 | GO:0045054 | constitutive secretory pathway(GO:0045054) |
| 0.6 | 1.2 | GO:0019344 | cysteine biosynthetic process(GO:0019344) |
| 0.6 | 1.8 | GO:0060155 | platelet dense granule organization(GO:0060155) |
| 0.6 | 0.6 | GO:0071608 | macrophage inflammatory protein-1 alpha production(GO:0071608) |
| 0.6 | 0.6 | GO:0002414 | immunoglobulin transcytosis in epithelial cells(GO:0002414) |
| 0.6 | 20.5 | GO:0048791 | calcium ion-regulated exocytosis of neurotransmitter(GO:0048791) |
| 0.6 | 0.6 | GO:1904995 | negative regulation of leukocyte adhesion to vascular endothelial cell(GO:1904995) |
| 0.6 | 2.4 | GO:0014722 | regulation of skeletal muscle contraction by calcium ion signaling(GO:0014722) |
| 0.6 | 3.0 | GO:0061002 | negative regulation of dendritic spine morphogenesis(GO:0061002) |
| 0.6 | 1.2 | GO:0071579 | regulation of zinc ion transport(GO:0071579) |
| 0.6 | 1.2 | GO:2000620 | positive regulation of histone H4-K16 acetylation(GO:2000620) |
| 0.6 | 1.8 | GO:0009186 | deoxyribonucleoside diphosphate metabolic process(GO:0009186) |
| 0.6 | 2.9 | GO:0043097 | pyrimidine-containing compound salvage(GO:0008655) pyrimidine nucleoside salvage(GO:0043097) |
| 0.6 | 2.9 | GO:1902474 | positive regulation of protein localization to synapse(GO:1902474) |
| 0.6 | 4.6 | GO:0051798 | positive regulation of hair follicle development(GO:0051798) |
| 0.6 | 1.1 | GO:0043152 | induction of bacterial agglutination(GO:0043152) |
| 0.6 | 4.0 | GO:0045162 | clustering of voltage-gated sodium channels(GO:0045162) |
| 0.6 | 1.1 | GO:0001983 | baroreceptor response to increased systemic arterial blood pressure(GO:0001983) |
| 0.6 | 2.8 | GO:0015692 | vanadium ion transport(GO:0015676) lead ion transport(GO:0015692) |
| 0.6 | 3.4 | GO:0014842 | regulation of skeletal muscle satellite cell proliferation(GO:0014842) |
| 0.6 | 1.7 | GO:1901642 | purine nucleoside transmembrane transport(GO:0015860) nucleoside transmembrane transport(GO:1901642) |
| 0.6 | 2.2 | GO:2000252 | negative regulation of feeding behavior(GO:2000252) |
| 0.6 | 3.4 | GO:0042737 | drug catabolic process(GO:0042737) |
| 0.6 | 2.2 | GO:0035405 | histone-threonine phosphorylation(GO:0035405) |
| 0.6 | 6.1 | GO:0001573 | ganglioside metabolic process(GO:0001573) |
| 0.6 | 0.6 | GO:1904426 | positive regulation of GTP binding(GO:1904426) |
| 0.5 | 0.5 | GO:0070947 | neutrophil mediated killing of fungus(GO:0070947) |
| 0.5 | 6.0 | GO:0032401 | establishment of melanosome localization(GO:0032401) |
| 0.5 | 1.6 | GO:0009095 | tyrosine biosynthetic process(GO:0006571) aromatic amino acid family biosynthetic process(GO:0009073) aromatic amino acid family biosynthetic process, prephenate pathway(GO:0009095) |
| 0.5 | 15.2 | GO:0018149 | peptide cross-linking(GO:0018149) |
| 0.5 | 1.6 | GO:0050925 | negative regulation of negative chemotaxis(GO:0050925) |
| 0.5 | 1.6 | GO:1900477 | negative regulation of G1/S transition of mitotic cell cycle by negative regulation of transcription from RNA polymerase II promoter(GO:1900477) |
| 0.5 | 62.7 | GO:0002793 | positive regulation of peptide secretion(GO:0002793) positive regulation of peptide hormone secretion(GO:0090277) |
| 0.5 | 7.0 | GO:0006555 | methionine metabolic process(GO:0006555) |
| 0.5 | 2.2 | GO:0021564 | vagus nerve development(GO:0021564) |
| 0.5 | 0.5 | GO:1902953 | positive regulation of ER to Golgi vesicle-mediated transport(GO:1902953) |
| 0.5 | 1.1 | GO:0090481 | pyrimidine nucleotide-sugar transmembrane transport(GO:0090481) |
| 0.5 | 1.6 | GO:0042560 | 10-formyltetrahydrofolate catabolic process(GO:0009258) folic acid-containing compound catabolic process(GO:0009397) pteridine-containing compound catabolic process(GO:0042560) |
| 0.5 | 2.1 | GO:0030321 | transepithelial chloride transport(GO:0030321) |
| 0.5 | 1.6 | GO:0016095 | polyprenol catabolic process(GO:0016095) |
| 0.5 | 2.1 | GO:1904378 | maintenance of unfolded protein(GO:0036506) maintenance of unfolded protein involved in ERAD pathway(GO:1904378) |
| 0.5 | 1.6 | GO:0036486 | trunk segmentation(GO:0035290) trunk neural crest cell migration(GO:0036484) ventral trunk neural crest cell migration(GO:0036486) sympathetic neuron projection extension(GO:0097490) sympathetic neuron projection guidance(GO:0097491) |
| 0.5 | 1.6 | GO:0015910 | peroxisomal long-chain fatty acid import(GO:0015910) |
| 0.5 | 2.1 | GO:1901492 | positive regulation of lymphangiogenesis(GO:1901492) |
| 0.5 | 1.6 | GO:0071846 | actin filament debranching(GO:0071846) |
| 0.5 | 2.1 | GO:0002583 | regulation of antigen processing and presentation of peptide antigen(GO:0002583) |
| 0.5 | 1.0 | GO:0035947 | regulation of gluconeogenesis by regulation of transcription from RNA polymerase II promoter(GO:0035947) |
| 0.5 | 1.0 | GO:0031659 | positive regulation of cyclin-dependent protein serine/threonine kinase activity involved in G1/S transition of mitotic cell cycle(GO:0031659) |
| 0.5 | 3.1 | GO:0046103 | inosine biosynthetic process(GO:0046103) |
| 0.5 | 1.6 | GO:0016598 | protein arginylation(GO:0016598) |
| 0.5 | 1.0 | GO:0043490 | malate-aspartate shuttle(GO:0043490) |
| 0.5 | 20.1 | GO:0061098 | positive regulation of protein tyrosine kinase activity(GO:0061098) |
| 0.5 | 1.5 | GO:0003162 | atrioventricular node development(GO:0003162) |
| 0.5 | 1.0 | GO:0042640 | anagen(GO:0042640) |
| 0.5 | 6.6 | GO:0009134 | nucleoside diphosphate catabolic process(GO:0009134) |
| 0.5 | 2.0 | GO:0060708 | spongiotrophoblast differentiation(GO:0060708) |
| 0.5 | 3.0 | GO:0071494 | cellular response to UV-C(GO:0071494) |
| 0.5 | 1.5 | GO:0043181 | vacuolar sequestering(GO:0043181) |
| 0.5 | 7.5 | GO:0033005 | positive regulation of mast cell activation(GO:0033005) |
| 0.5 | 20.0 | GO:0045880 | positive regulation of smoothened signaling pathway(GO:0045880) |
| 0.5 | 3.0 | GO:1990504 | dense core granule exocytosis(GO:1990504) |
| 0.5 | 2.5 | GO:0015889 | cobalamin transport(GO:0015889) |
| 0.5 | 1.5 | GO:0045161 | neuronal ion channel clustering(GO:0045161) |
| 0.5 | 6.4 | GO:1901898 | negative regulation of relaxation of muscle(GO:1901078) negative regulation of relaxation of cardiac muscle(GO:1901898) |
| 0.5 | 7.9 | GO:0036158 | outer dynein arm assembly(GO:0036158) |
| 0.5 | 1.5 | GO:0098909 | regulation of cardiac muscle cell action potential involved in regulation of contraction(GO:0098909) |
| 0.5 | 2.0 | GO:0038094 | Fc-gamma receptor signaling pathway(GO:0038094) |
| 0.5 | 18.1 | GO:0050909 | sensory perception of taste(GO:0050909) |
| 0.5 | 2.9 | GO:0043201 | response to leucine(GO:0043201) cellular response to leucine(GO:0071233) |
| 0.5 | 3.4 | GO:0035020 | regulation of Rac protein signal transduction(GO:0035020) |
| 0.5 | 5.3 | GO:0071318 | cellular response to ATP(GO:0071318) |
| 0.5 | 1.4 | GO:0002268 | follicular dendritic cell activation(GO:0002266) follicular dendritic cell differentiation(GO:0002268) |
| 0.5 | 3.8 | GO:2000786 | positive regulation of autophagosome assembly(GO:2000786) |
| 0.5 | 1.9 | GO:0060158 | phospholipase C-activating dopamine receptor signaling pathway(GO:0060158) |
| 0.5 | 1.4 | GO:1901994 | meiotic cell cycle phase transition(GO:0044771) regulation of meiotic cell cycle phase transition(GO:1901993) negative regulation of meiotic cell cycle phase transition(GO:1901994) |
| 0.5 | 1.0 | GO:0034334 | adherens junction maintenance(GO:0034334) |
| 0.5 | 1.4 | GO:0090155 | negative regulation of sphingolipid biosynthetic process(GO:0090155) cellular sphingolipid homeostasis(GO:0090156) negative regulation of ceramide biosynthetic process(GO:1900060) |
| 0.5 | 2.3 | GO:0002669 | positive regulation of T cell anergy(GO:0002669) positive regulation of lymphocyte anergy(GO:0002913) |
| 0.5 | 2.3 | GO:0070633 | transepithelial transport(GO:0070633) |
| 0.5 | 0.9 | GO:0097021 | lymphocyte migration into lymphoid organs(GO:0097021) |
| 0.5 | 5.1 | GO:0046007 | negative regulation of activated T cell proliferation(GO:0046007) |
| 0.5 | 3.2 | GO:0060576 | intestinal epithelial cell development(GO:0060576) |
| 0.5 | 2.8 | GO:0021891 | olfactory bulb interneuron development(GO:0021891) |
| 0.5 | 2.3 | GO:0014827 | intestine smooth muscle contraction(GO:0014827) |
| 0.5 | 0.9 | GO:0009448 | gamma-aminobutyric acid metabolic process(GO:0009448) |
| 0.5 | 2.7 | GO:0006072 | glycerol-3-phosphate metabolic process(GO:0006072) |
| 0.5 | 0.9 | GO:1900220 | semaphorin-plexin signaling pathway involved in bone trabecula morphogenesis(GO:1900220) |
| 0.5 | 19.2 | GO:0006890 | retrograde vesicle-mediated transport, Golgi to ER(GO:0006890) |
| 0.5 | 3.7 | GO:0006590 | thyroid hormone generation(GO:0006590) |
| 0.5 | 1.8 | GO:0061589 | calcium activated phosphatidylserine scrambling(GO:0061589) |
| 0.5 | 2.7 | GO:0048012 | hepatocyte growth factor receptor signaling pathway(GO:0048012) |
| 0.5 | 1.8 | GO:0019254 | carnitine metabolic process, CoA-linked(GO:0019254) |
| 0.5 | 2.7 | GO:0015671 | oxygen transport(GO:0015671) |
| 0.5 | 15.3 | GO:1903146 | regulation of mitophagy(GO:1903146) |
| 0.4 | 1.3 | GO:2000503 | positive regulation of natural killer cell chemotaxis(GO:2000503) |
| 0.4 | 1.3 | GO:0036500 | ATF6-mediated unfolded protein response(GO:0036500) |
| 0.4 | 1.8 | GO:0001973 | adenosine receptor signaling pathway(GO:0001973) |
| 0.4 | 0.9 | GO:0002003 | angiotensin maturation(GO:0002003) |
| 0.4 | 4.0 | GO:0002862 | negative regulation of inflammatory response to antigenic stimulus(GO:0002862) |
| 0.4 | 7.5 | GO:0007175 | negative regulation of epidermal growth factor-activated receptor activity(GO:0007175) |
| 0.4 | 1.7 | GO:0030043 | actin filament fragmentation(GO:0030043) |
| 0.4 | 4.4 | GO:0098532 | histone H3-K27 trimethylation(GO:0098532) |
| 0.4 | 1.3 | GO:0031296 | B cell costimulation(GO:0031296) |
| 0.4 | 3.5 | GO:0032261 | purine nucleotide salvage(GO:0032261) IMP salvage(GO:0032264) |
| 0.4 | 0.4 | GO:0071726 | response to diacyl bacterial lipopeptide(GO:0071724) cellular response to diacyl bacterial lipopeptide(GO:0071726) |
| 0.4 | 1.3 | GO:0006667 | sphinganine metabolic process(GO:0006667) regulation of lipophagy(GO:1904502) positive regulation of lipophagy(GO:1904504) |
| 0.4 | 0.4 | GO:1901963 | cardiac right atrium morphogenesis(GO:0003213) canonical Wnt signaling pathway involved in positive regulation of cardiac outflow tract cell proliferation(GO:0061324) planar cell polarity pathway involved in outflow tract morphogenesis(GO:0061347) planar cell polarity pathway involved in ventricular septum morphogenesis(GO:0061348) planar cell polarity pathway involved in cardiac right atrium morphogenesis(GO:0061349) planar cell polarity pathway involved in cardiac muscle tissue morphogenesis(GO:0061350) planar cell polarity pathway involved in pericardium morphogenesis(GO:0061354) regulation of cell proliferation involved in outflow tract morphogenesis(GO:1901963) |
| 0.4 | 0.9 | GO:2000043 | regulation of cardiac cell fate specification(GO:2000043) |
| 0.4 | 1.7 | GO:0070417 | cellular response to cold(GO:0070417) |
| 0.4 | 0.4 | GO:0014050 | negative regulation of glutamate secretion(GO:0014050) |
| 0.4 | 2.1 | GO:0010961 | cellular magnesium ion homeostasis(GO:0010961) |
| 0.4 | 2.5 | GO:1901678 | iron coordination entity transport(GO:1901678) |
| 0.4 | 7.0 | GO:0033327 | Leydig cell differentiation(GO:0033327) |
| 0.4 | 1.2 | GO:0044878 | mitotic cytokinesis checkpoint(GO:0044878) |
| 0.4 | 6.5 | GO:0010543 | regulation of platelet activation(GO:0010543) |
| 0.4 | 1.2 | GO:0003051 | angiotensin-mediated drinking behavior(GO:0003051) |
| 0.4 | 2.4 | GO:0072675 | osteoclast fusion(GO:0072675) |
| 0.4 | 0.8 | GO:0031914 | negative regulation of synaptic plasticity(GO:0031914) |
| 0.4 | 0.8 | GO:0030450 | regulation of complement activation, classical pathway(GO:0030450) |
| 0.4 | 1.2 | GO:0050755 | chemokine metabolic process(GO:0050755) |
| 0.4 | 1.6 | GO:2000382 | positive regulation of nodal signaling pathway involved in determination of lateral mesoderm left/right asymmetry(GO:1900224) positive regulation of mesoderm development(GO:2000382) |
| 0.4 | 3.6 | GO:0090197 | positive regulation of chemokine secretion(GO:0090197) |
| 0.4 | 0.8 | GO:0051892 | negative regulation of cardioblast differentiation(GO:0051892) |
| 0.4 | 1.2 | GO:0002182 | cytoplasmic translational elongation(GO:0002182) regulation of cytoplasmic translational elongation(GO:1900247) negative regulation of cytoplasmic translational elongation(GO:1900248) |
| 0.4 | 0.8 | GO:0097065 | anterior head development(GO:0097065) regulation of anterior head development(GO:2000742) positive regulation of anterior head development(GO:2000744) |
| 0.4 | 4.7 | GO:0090110 | cargo loading into COPII-coated vesicle(GO:0090110) |
| 0.4 | 2.3 | GO:0034498 | early endosome to Golgi transport(GO:0034498) |
| 0.4 | 1.2 | GO:0045925 | positive regulation of female receptivity(GO:0045925) |
| 0.4 | 1.9 | GO:1903071 | positive regulation of ER-associated ubiquitin-dependent protein catabolic process(GO:1903071) |
| 0.4 | 1.9 | GO:1904953 | Wnt signaling pathway involved in midbrain dopaminergic neuron differentiation(GO:1904953) |
| 0.4 | 19.5 | GO:0007157 | heterophilic cell-cell adhesion via plasma membrane cell adhesion molecules(GO:0007157) |
| 0.4 | 0.8 | GO:0072053 | renal inner medulla development(GO:0072053) |
| 0.4 | 5.3 | GO:0046514 | ceramide catabolic process(GO:0046514) |
| 0.4 | 1.5 | GO:0055075 | potassium ion homeostasis(GO:0055075) |
| 0.4 | 3.0 | GO:0002756 | MyD88-independent toll-like receptor signaling pathway(GO:0002756) |
| 0.4 | 0.7 | GO:0001878 | response to yeast(GO:0001878) |
| 0.4 | 1.9 | GO:0008078 | mesodermal cell migration(GO:0008078) |
| 0.4 | 4.4 | GO:0060294 | cilium movement involved in cell motility(GO:0060294) |
| 0.4 | 0.7 | GO:0018199 | peptidyl-glutamine modification(GO:0018199) |
| 0.4 | 1.5 | GO:0033364 | mast cell secretory granule organization(GO:0033364) |
| 0.4 | 2.2 | GO:0010991 | negative regulation of SMAD protein complex assembly(GO:0010991) |
| 0.4 | 1.8 | GO:1900095 | regulation of dosage compensation by inactivation of X chromosome(GO:1900095) |
| 0.4 | 2.2 | GO:0007196 | adenylate cyclase-inhibiting G-protein coupled glutamate receptor signaling pathway(GO:0007196) |
| 0.4 | 1.5 | GO:0071294 | cellular response to zinc ion(GO:0071294) |
| 0.4 | 4.0 | GO:1900454 | positive regulation of long term synaptic depression(GO:1900454) |
| 0.4 | 2.6 | GO:0033210 | leptin-mediated signaling pathway(GO:0033210) |
| 0.4 | 2.5 | GO:0090166 | Golgi disassembly(GO:0090166) |
| 0.4 | 2.2 | GO:0045779 | negative regulation of bone resorption(GO:0045779) negative regulation of bone remodeling(GO:0046851) |
| 0.4 | 0.7 | GO:1904717 | postsynaptic density assembly(GO:0097107) guanylate kinase-associated protein clustering(GO:0097117) regulation of AMPA glutamate receptor clustering(GO:1904717) |
| 0.4 | 1.8 | GO:0090383 | phagosome acidification(GO:0090383) |
| 0.4 | 2.2 | GO:0034154 | toll-like receptor 7 signaling pathway(GO:0034154) |
| 0.4 | 1.1 | GO:0061343 | cell adhesion involved in heart morphogenesis(GO:0061343) |
| 0.4 | 1.4 | GO:0000301 | retrograde transport, vesicle recycling within Golgi(GO:0000301) |
| 0.4 | 1.4 | GO:0051697 | protein delipidation(GO:0051697) |
| 0.3 | 1.4 | GO:0019087 | transformation of host cell by virus(GO:0019087) |
| 0.3 | 1.7 | GO:0006048 | UDP-N-acetylglucosamine biosynthetic process(GO:0006048) |
| 0.3 | 2.1 | GO:0010820 | regulation of T cell chemotaxis(GO:0010819) positive regulation of T cell chemotaxis(GO:0010820) |
| 0.3 | 6.2 | GO:0015693 | magnesium ion transport(GO:0015693) |
| 0.3 | 1.7 | GO:0046208 | spermine catabolic process(GO:0046208) |
| 0.3 | 0.3 | GO:1905154 | negative regulation of membrane invagination(GO:1905154) |
| 0.3 | 1.0 | GO:1904211 | membrane protein proteolysis involved in retrograde protein transport, ER to cytosol(GO:1904211) |
| 0.3 | 3.0 | GO:0042574 | retinal metabolic process(GO:0042574) |
| 0.3 | 3.4 | GO:0048280 | vesicle fusion with Golgi apparatus(GO:0048280) |
| 0.3 | 1.0 | GO:1902093 | positive regulation of sperm motility(GO:1902093) |
| 0.3 | 2.4 | GO:0018377 | protein myristoylation(GO:0018377) |
| 0.3 | 3.0 | GO:0030388 | fructose 1,6-bisphosphate metabolic process(GO:0030388) |
| 0.3 | 7.4 | GO:0043171 | peptide catabolic process(GO:0043171) |
| 0.3 | 4.0 | GO:0006670 | sphingosine metabolic process(GO:0006670) |
| 0.3 | 0.3 | GO:0038066 | p38MAPK cascade(GO:0038066) |
| 0.3 | 2.7 | GO:0046146 | tetrahydrobiopterin metabolic process(GO:0046146) |
| 0.3 | 0.7 | GO:0038033 | positive regulation of endothelial cell chemotaxis by VEGF-activated vascular endothelial growth factor receptor signaling pathway(GO:0038033) |
| 0.3 | 2.0 | GO:0060074 | synapse maturation(GO:0060074) |
| 0.3 | 1.3 | GO:0003241 | growth involved in heart morphogenesis(GO:0003241) |
| 0.3 | 1.0 | GO:0003289 | atrial septum primum morphogenesis(GO:0003289) |
| 0.3 | 1.6 | GO:2000253 | positive regulation of feeding behavior(GO:2000253) |
| 0.3 | 0.3 | GO:0008343 | adult feeding behavior(GO:0008343) |
| 0.3 | 1.0 | GO:2000196 | positive regulation of female gonad development(GO:2000196) |
| 0.3 | 1.3 | GO:2000427 | positive regulation of apoptotic cell clearance(GO:2000427) |
| 0.3 | 1.0 | GO:0019085 | early viral transcription(GO:0019085) |
| 0.3 | 1.6 | GO:0032472 | Golgi calcium ion transport(GO:0032472) |
| 0.3 | 1.9 | GO:0060575 | intestinal epithelial cell differentiation(GO:0060575) |
| 0.3 | 2.9 | GO:0042447 | hormone catabolic process(GO:0042447) |
| 0.3 | 0.3 | GO:0090118 | receptor-mediated endocytosis of low-density lipoprotein particle involved in cholesterol transport(GO:0090118) |
| 0.3 | 0.3 | GO:0016561 | protein import into peroxisome matrix, translocation(GO:0016561) |
| 0.3 | 0.6 | GO:0002541 | activation of plasma proteins involved in acute inflammatory response(GO:0002541) |
| 0.3 | 0.6 | GO:0009446 | putrescine biosynthetic process(GO:0009446) |
| 0.3 | 1.0 | GO:0016093 | polyprenol metabolic process(GO:0016093) |
| 0.3 | 0.6 | GO:1904578 | response to thapsigargin(GO:1904578) cellular response to thapsigargin(GO:1904579) |
| 0.3 | 0.3 | GO:0060664 | epithelial cell proliferation involved in salivary gland morphogenesis(GO:0060664) |
| 0.3 | 2.5 | GO:0043562 | cellular response to nitrogen starvation(GO:0006995) cellular response to nitrogen levels(GO:0043562) |
| 0.3 | 2.5 | GO:0021895 | cerebral cortex neuron differentiation(GO:0021895) |
| 0.3 | 5.3 | GO:0071378 | growth hormone receptor signaling pathway(GO:0060396) cellular response to growth hormone stimulus(GO:0071378) |
| 0.3 | 0.6 | GO:1904457 | positive regulation of neuronal action potential(GO:1904457) |
| 0.3 | 1.5 | GO:0046501 | protoporphyrinogen IX metabolic process(GO:0046501) |
| 0.3 | 4.0 | GO:0006123 | mitochondrial electron transport, cytochrome c to oxygen(GO:0006123) |
| 0.3 | 3.0 | GO:0035094 | response to nicotine(GO:0035094) |
| 0.3 | 0.6 | GO:2000301 | negative regulation of synaptic vesicle exocytosis(GO:2000301) |
| 0.3 | 1.5 | GO:0039530 | MDA-5 signaling pathway(GO:0039530) |
| 0.3 | 0.6 | GO:1900126 | negative regulation of hyaluronan biosynthetic process(GO:1900126) |
| 0.3 | 1.5 | GO:0043456 | regulation of pentose-phosphate shunt(GO:0043456) |
| 0.3 | 3.0 | GO:0072501 | cellular phosphate ion homeostasis(GO:0030643) cellular divalent inorganic anion homeostasis(GO:0072501) cellular trivalent inorganic anion homeostasis(GO:0072502) |
| 0.3 | 0.3 | GO:1904304 | regulation of gastro-intestinal system smooth muscle contraction(GO:1904304) |
| 0.3 | 2.6 | GO:0016082 | synaptic vesicle priming(GO:0016082) |
| 0.3 | 1.5 | GO:0034104 | negative regulation of tissue remodeling(GO:0034104) |
| 0.3 | 0.9 | GO:0072554 | blood vessel lumenization(GO:0072554) |
| 0.3 | 0.3 | GO:0033499 | galactose catabolic process via UDP-galactose(GO:0033499) |
| 0.3 | 0.9 | GO:0042938 | dipeptide transport(GO:0042938) |
| 0.3 | 2.3 | GO:0061469 | regulation of type B pancreatic cell proliferation(GO:0061469) |
| 0.3 | 2.6 | GO:0036010 | protein localization to endosome(GO:0036010) |
| 0.3 | 0.6 | GO:1900736 | regulation of phospholipase C-activating G-protein coupled receptor signaling pathway(GO:1900736) |
| 0.3 | 1.2 | GO:0061187 | regulation of chromatin silencing at rDNA(GO:0061187) negative regulation of chromatin silencing at rDNA(GO:0061188) |
| 0.3 | 16.4 | GO:0006661 | phosphatidylinositol biosynthetic process(GO:0006661) |
| 0.3 | 1.1 | GO:1903553 | positive regulation of extracellular exosome assembly(GO:1903553) |
| 0.3 | 1.4 | GO:0019885 | antigen processing and presentation of endogenous peptide antigen via MHC class I(GO:0019885) |
| 0.3 | 11.2 | GO:0034198 | cellular response to amino acid starvation(GO:0034198) |
| 0.3 | 0.3 | GO:0002786 | positive regulation of antimicrobial peptide production(GO:0002225) positive regulation of antimicrobial humoral response(GO:0002760) regulation of antimicrobial peptide production(GO:0002784) regulation of antibacterial peptide production(GO:0002786) positive regulation of antibacterial peptide production(GO:0002803) |
| 0.3 | 2.2 | GO:0038028 | insulin receptor signaling pathway via phosphatidylinositol 3-kinase(GO:0038028) |
| 0.3 | 1.6 | GO:0043353 | enucleate erythrocyte differentiation(GO:0043353) |
| 0.3 | 1.4 | GO:0001830 | trophectodermal cell fate commitment(GO:0001830) |
| 0.3 | 1.1 | GO:0046951 | ketone body biosynthetic process(GO:0046951) |
| 0.3 | 0.8 | GO:0036233 | glycine import(GO:0036233) |
| 0.3 | 0.8 | GO:0042760 | very long-chain fatty acid catabolic process(GO:0042760) |
| 0.3 | 0.5 | GO:0034124 | regulation of MyD88-dependent toll-like receptor signaling pathway(GO:0034124) |
| 0.3 | 4.3 | GO:0006465 | signal peptide processing(GO:0006465) |
| 0.3 | 0.8 | GO:0002331 | pre-B cell allelic exclusion(GO:0002331) |
| 0.3 | 0.3 | GO:2000570 | T-helper 2 cell activation(GO:0035712) regulation of T-helper 2 cell activation(GO:2000569) positive regulation of T-helper 2 cell activation(GO:2000570) |
| 0.3 | 4.0 | GO:0006910 | phagocytosis, recognition(GO:0006910) |
| 0.3 | 3.5 | GO:0014002 | astrocyte development(GO:0014002) |
| 0.3 | 6.7 | GO:1900047 | negative regulation of blood coagulation(GO:0030195) negative regulation of hemostasis(GO:1900047) |
| 0.3 | 1.6 | GO:0006002 | fructose 6-phosphate metabolic process(GO:0006002) |
| 0.3 | 0.5 | GO:1903721 | regulation of I-kappaB phosphorylation(GO:1903719) positive regulation of I-kappaB phosphorylation(GO:1903721) |
| 0.3 | 0.3 | GO:0090187 | positive regulation of pancreatic juice secretion(GO:0090187) |
| 0.3 | 4.2 | GO:0006903 | vesicle targeting(GO:0006903) |
| 0.3 | 9.7 | GO:0009409 | response to cold(GO:0009409) |
| 0.3 | 3.1 | GO:0034625 | fatty acid elongation, saturated fatty acid(GO:0019367) fatty acid elongation, unsaturated fatty acid(GO:0019368) fatty acid elongation, monounsaturated fatty acid(GO:0034625) fatty acid elongation, polyunsaturated fatty acid(GO:0034626) |
| 0.3 | 0.8 | GO:0018214 | peptidyl-glutamic acid carboxylation(GO:0017187) protein carboxylation(GO:0018214) |
| 0.3 | 0.8 | GO:0014046 | dopamine secretion(GO:0014046) regulation of dopamine secretion(GO:0014059) |
| 0.3 | 2.3 | GO:0031987 | locomotion involved in locomotory behavior(GO:0031987) |
| 0.3 | 1.8 | GO:0006620 | posttranslational protein targeting to membrane(GO:0006620) |
| 0.3 | 7.9 | GO:0010812 | negative regulation of cell-substrate adhesion(GO:0010812) |
| 0.3 | 0.8 | GO:0046037 | GMP metabolic process(GO:0046037) |
| 0.3 | 3.0 | GO:0006654 | phosphatidic acid biosynthetic process(GO:0006654) |
| 0.3 | 1.3 | GO:0036089 | cleavage furrow formation(GO:0036089) |
| 0.3 | 1.8 | GO:0006701 | progesterone biosynthetic process(GO:0006701) |
| 0.3 | 0.3 | GO:0006987 | activation of signaling protein activity involved in unfolded protein response(GO:0006987) |
| 0.2 | 2.7 | GO:0045956 | positive regulation of calcium ion-dependent exocytosis(GO:0045956) |
| 0.2 | 2.5 | GO:0033866 | coenzyme A biosynthetic process(GO:0015937) nucleoside bisphosphate biosynthetic process(GO:0033866) ribonucleoside bisphosphate biosynthetic process(GO:0034030) purine nucleoside bisphosphate biosynthetic process(GO:0034033) |
| 0.2 | 1.7 | GO:0007220 | Notch receptor processing(GO:0007220) |
| 0.2 | 1.7 | GO:0036265 | RNA (guanine-N7)-methylation(GO:0036265) |
| 0.2 | 1.2 | GO:0019482 | beta-alanine metabolic process(GO:0019482) |
| 0.2 | 5.2 | GO:0032897 | negative regulation of viral transcription(GO:0032897) |
| 0.2 | 2.7 | GO:0070131 | positive regulation of mitochondrial translation(GO:0070131) |
| 0.2 | 0.2 | GO:1904431 | positive regulation of t-circle formation(GO:1904431) |
| 0.2 | 2.2 | GO:0060837 | blood vessel endothelial cell differentiation(GO:0060837) |
| 0.2 | 1.0 | GO:0006481 | C-terminal protein methylation(GO:0006481) |
| 0.2 | 1.2 | GO:0006177 | GMP biosynthetic process(GO:0006177) |
| 0.2 | 3.7 | GO:0042572 | retinol metabolic process(GO:0042572) |
| 0.2 | 0.5 | GO:2000508 | regulation of dendritic cell chemotaxis(GO:2000508) positive regulation of dendritic cell chemotaxis(GO:2000510) |
| 0.2 | 0.2 | GO:0007602 | phototransduction(GO:0007602) |
| 0.2 | 5.8 | GO:0034063 | stress granule assembly(GO:0034063) |
| 0.2 | 1.9 | GO:2000766 | negative regulation of cytoplasmic translation(GO:2000766) |
| 0.2 | 1.4 | GO:0045905 | translational frameshifting(GO:0006452) positive regulation of translational termination(GO:0045905) |
| 0.2 | 3.4 | GO:0032274 | gonadotropin secretion(GO:0032274) |
| 0.2 | 0.5 | GO:0034058 | endosomal vesicle fusion(GO:0034058) |
| 0.2 | 4.3 | GO:0045736 | negative regulation of cyclin-dependent protein serine/threonine kinase activity(GO:0045736) negative regulation of cyclin-dependent protein kinase activity(GO:1904030) |
| 0.2 | 3.3 | GO:0007638 | mechanosensory behavior(GO:0007638) |
| 0.2 | 0.2 | GO:2000825 | positive regulation of androgen receptor activity(GO:2000825) |
| 0.2 | 0.9 | GO:0002317 | plasma cell differentiation(GO:0002317) |
| 0.2 | 0.7 | GO:0051835 | positive regulation of synapse structural plasticity(GO:0051835) |
| 0.2 | 2.6 | GO:1902590 | viral budding via host ESCRT complex(GO:0039702) viral budding(GO:0046755) multi-organism organelle organization(GO:1902590) multi-organism membrane budding(GO:1902592) |
| 0.2 | 0.2 | GO:0061193 | taste bud development(GO:0061193) |
| 0.2 | 1.6 | GO:0001969 | activation of membrane attack complex(GO:0001905) regulation of activation of membrane attack complex(GO:0001969) |
| 0.2 | 1.8 | GO:0070327 | thyroid hormone transport(GO:0070327) |
| 0.2 | 3.0 | GO:0006957 | complement activation, alternative pathway(GO:0006957) |
| 0.2 | 1.1 | GO:0023041 | neuronal signal transduction(GO:0023041) |
| 0.2 | 0.7 | GO:0002540 | leukotriene production involved in inflammatory response(GO:0002540) |
| 0.2 | 1.1 | GO:0033031 | positive regulation of neutrophil apoptotic process(GO:0033031) |
| 0.2 | 0.7 | GO:1903371 | regulation of endoplasmic reticulum tubular network organization(GO:1903371) |
| 0.2 | 0.7 | GO:0046462 | monoacylglycerol metabolic process(GO:0046462) |
| 0.2 | 0.7 | GO:2001160 | regulation of histone H3-K79 methylation(GO:2001160) |
| 0.2 | 1.1 | GO:0002121 | inter-male aggressive behavior(GO:0002121) |
| 0.2 | 14.8 | GO:0030433 | ER-associated ubiquitin-dependent protein catabolic process(GO:0030433) |
| 0.2 | 0.9 | GO:0070295 | renal water absorption(GO:0070295) |
| 0.2 | 1.3 | GO:1901724 | positive regulation of cell proliferation involved in kidney development(GO:1901724) |
| 0.2 | 0.7 | GO:0045743 | positive regulation of fibroblast growth factor receptor signaling pathway(GO:0045743) |
| 0.2 | 0.7 | GO:0035106 | operant conditioning(GO:0035106) |
| 0.2 | 13.5 | GO:0050852 | T cell receptor signaling pathway(GO:0050852) |
| 0.2 | 2.8 | GO:0034067 | protein localization to Golgi apparatus(GO:0034067) |
| 0.2 | 0.2 | GO:2000297 | negative regulation of synapse maturation(GO:2000297) |
| 0.2 | 3.2 | GO:0060088 | auditory receptor cell stereocilium organization(GO:0060088) |
| 0.2 | 2.4 | GO:0052696 | flavonoid glucuronidation(GO:0052696) xenobiotic glucuronidation(GO:0052697) |
| 0.2 | 9.2 | GO:1902476 | chloride transmembrane transport(GO:1902476) |
| 0.2 | 0.6 | GO:0060948 | cardiac vascular smooth muscle cell development(GO:0060948) |
| 0.2 | 0.9 | GO:0006780 | uroporphyrinogen III biosynthetic process(GO:0006780) |
| 0.2 | 0.2 | GO:0061317 | canonical Wnt signaling pathway involved in heart development(GO:0061316) canonical Wnt signaling pathway involved in cardiac muscle cell fate commitment(GO:0061317) regulation of canonical Wnt signaling pathway involved in cardiac muscle cell fate commitment(GO:1901295) positive regulation of heart induction(GO:1901321) regulation of canonical Wnt signaling pathway involved in heart development(GO:1905066) |
| 0.2 | 1.1 | GO:0009235 | cobalamin metabolic process(GO:0009235) |
| 0.2 | 7.4 | GO:0008333 | endosome to lysosome transport(GO:0008333) |
| 0.2 | 2.3 | GO:0006152 | purine nucleoside catabolic process(GO:0006152) purine ribonucleoside catabolic process(GO:0046130) |
| 0.2 | 2.9 | GO:0000712 | resolution of meiotic recombination intermediates(GO:0000712) |
| 0.2 | 2.9 | GO:0030322 | stabilization of membrane potential(GO:0030322) |
| 0.2 | 0.2 | GO:2000561 | regulation of CD4-positive, alpha-beta T cell proliferation(GO:2000561) |
| 0.2 | 0.6 | GO:2001137 | positive regulation of endocytic recycling(GO:2001137) |
| 0.2 | 1.4 | GO:0071763 | nuclear membrane organization(GO:0071763) |
| 0.2 | 0.2 | GO:0061009 | common bile duct development(GO:0061009) |
| 0.2 | 0.2 | GO:0002826 | negative regulation of T-helper 1 type immune response(GO:0002826) |
| 0.2 | 4.9 | GO:0018279 | protein N-linked glycosylation via asparagine(GO:0018279) |
| 0.2 | 1.2 | GO:0051967 | negative regulation of synaptic transmission, glutamatergic(GO:0051967) |
| 0.2 | 0.6 | GO:0016068 | antibody-dependent cellular cytotoxicity(GO:0001788) regulation of type I hypersensitivity(GO:0001810) positive regulation of type I hypersensitivity(GO:0001812) type I hypersensitivity(GO:0016068) |
| 0.2 | 1.0 | GO:0045347 | negative regulation of MHC class II biosynthetic process(GO:0045347) |
| 0.2 | 0.6 | GO:0071397 | cellular response to cholesterol(GO:0071397) |
| 0.2 | 0.2 | GO:1903179 | regulation of dopamine biosynthetic process(GO:1903179) positive regulation of dopamine biosynthetic process(GO:1903181) |
| 0.2 | 1.6 | GO:1903025 | regulation of RNA polymerase II regulatory region sequence-specific DNA binding(GO:1903025) |
| 0.2 | 0.2 | GO:0070100 | negative regulation of chemokine-mediated signaling pathway(GO:0070100) |
| 0.2 | 0.8 | GO:0002432 | granuloma formation(GO:0002432) |
| 0.2 | 1.4 | GO:0021817 | modulation of microtubule cytoskeleton involved in cerebral cortex radial glia guided migration(GO:0021815) nucleokinesis involved in cell motility in cerebral cortex radial glia guided migration(GO:0021817) nuclear migration along microtubule(GO:0030473) |
| 0.2 | 1.4 | GO:0046292 | formaldehyde metabolic process(GO:0046292) |
| 0.2 | 0.2 | GO:0009957 | epidermal cell fate specification(GO:0009957) |
| 0.2 | 0.6 | GO:0006566 | threonine metabolic process(GO:0006566) |
| 0.2 | 0.4 | GO:0002572 | pro-T cell differentiation(GO:0002572) |
| 0.2 | 0.8 | GO:0003365 | establishment of cell polarity involved in ameboidal cell migration(GO:0003365) |
| 0.2 | 1.2 | GO:0030240 | skeletal muscle thin filament assembly(GO:0030240) |
| 0.2 | 0.8 | GO:0090245 | axis elongation involved in somitogenesis(GO:0090245) |
| 0.2 | 0.8 | GO:0006420 | arginyl-tRNA aminoacylation(GO:0006420) |
| 0.2 | 0.2 | GO:0021800 | cerebral cortex tangential migration(GO:0021800) |
| 0.2 | 1.0 | GO:0021993 | initiation of neural tube closure(GO:0021993) |
| 0.2 | 1.0 | GO:0051775 | response to redox state(GO:0051775) |
| 0.2 | 1.3 | GO:0070458 | detoxification of nitrogen compound(GO:0051410) cellular detoxification of nitrogen compound(GO:0070458) |
| 0.2 | 3.1 | GO:0010043 | response to zinc ion(GO:0010043) |
| 0.2 | 0.8 | GO:0000707 | meiotic DNA recombinase assembly(GO:0000707) |
| 0.2 | 0.6 | GO:0050819 | negative regulation of coagulation(GO:0050819) |
| 0.2 | 1.7 | GO:0071257 | cellular response to electrical stimulus(GO:0071257) |
| 0.2 | 0.2 | GO:0045605 | negative regulation of epidermal cell differentiation(GO:0045605) |
| 0.2 | 0.6 | GO:0006578 | amino-acid betaine biosynthetic process(GO:0006578) |
| 0.2 | 0.2 | GO:0051660 | establishment of centrosome localization(GO:0051660) |
| 0.2 | 5.8 | GO:2000171 | negative regulation of dendrite development(GO:2000171) |
| 0.2 | 1.9 | GO:0090084 | negative regulation of inclusion body assembly(GO:0090084) |
| 0.2 | 0.9 | GO:0018343 | protein farnesylation(GO:0018343) |
| 0.2 | 0.7 | GO:0042126 | nitrate metabolic process(GO:0042126) |
| 0.2 | 1.5 | GO:0010225 | response to UV-C(GO:0010225) |
| 0.2 | 0.7 | GO:0035279 | mRNA cleavage involved in gene silencing by miRNA(GO:0035279) mRNA cleavage involved in gene silencing(GO:0098795) |
| 0.2 | 0.6 | GO:0018211 | protein C-linked glycosylation(GO:0018103) peptidyl-tryptophan modification(GO:0018211) protein C-linked glycosylation via tryptophan(GO:0018317) protein C-linked glycosylation via 2'-alpha-mannosyl-L-tryptophan(GO:0018406) |
| 0.2 | 3.3 | GO:0060009 | Sertoli cell development(GO:0060009) |
| 0.2 | 0.6 | GO:1901165 | positive regulation of trophoblast cell migration(GO:1901165) |
| 0.2 | 2.4 | GO:0006767 | water-soluble vitamin metabolic process(GO:0006767) |
| 0.2 | 2.0 | GO:0090503 | RNA phosphodiester bond hydrolysis, exonucleolytic(GO:0090503) |
| 0.2 | 0.7 | GO:0006548 | histidine metabolic process(GO:0006547) histidine catabolic process(GO:0006548) |
| 0.2 | 0.5 | GO:0003418 | growth plate cartilage chondrocyte differentiation(GO:0003418) |
| 0.2 | 2.6 | GO:0043552 | positive regulation of phosphatidylinositol 3-kinase activity(GO:0043552) |
| 0.2 | 0.9 | GO:0006686 | sphingomyelin biosynthetic process(GO:0006686) |
| 0.2 | 0.7 | GO:0072344 | rescue of stalled ribosome(GO:0072344) |
| 0.2 | 0.9 | GO:0050651 | dermatan sulfate proteoglycan biosynthetic process(GO:0050651) |
| 0.2 | 0.5 | GO:0070317 | negative regulation of G0 to G1 transition(GO:0070317) |
| 0.2 | 0.7 | GO:0030423 | targeting of mRNA for destruction involved in RNA interference(GO:0030423) siRNA loading onto RISC involved in RNA interference(GO:0035087) |
| 0.2 | 0.9 | GO:0032485 | regulation of Ral protein signal transduction(GO:0032485) |
| 0.2 | 0.7 | GO:2000659 | regulation of interleukin-1-mediated signaling pathway(GO:2000659) |
| 0.2 | 1.4 | GO:0035887 | aortic smooth muscle cell differentiation(GO:0035887) |
| 0.2 | 1.8 | GO:0070831 | basement membrane assembly(GO:0070831) |
| 0.2 | 0.7 | GO:2000680 | regulation of rubidium ion transport(GO:2000680) |
| 0.2 | 0.4 | GO:0071929 | alpha-tubulin acetylation(GO:0071929) |
| 0.2 | 1.6 | GO:0098907 | T-tubule organization(GO:0033292) protein localization to M-band(GO:0036309) protein localization to T-tubule(GO:0036371) regulation of SA node cell action potential(GO:0098907) |
| 0.2 | 2.8 | GO:0007214 | gamma-aminobutyric acid signaling pathway(GO:0007214) |
| 0.2 | 0.9 | GO:0032687 | negative regulation of interferon-alpha production(GO:0032687) |
| 0.2 | 1.9 | GO:0016558 | protein import into peroxisome matrix(GO:0016558) |
| 0.2 | 3.1 | GO:0010971 | positive regulation of G2/M transition of mitotic cell cycle(GO:0010971) |
| 0.2 | 0.5 | GO:0043619 | regulation of transcription from RNA polymerase II promoter in response to oxidative stress(GO:0043619) |
| 0.2 | 2.3 | GO:0009950 | dorsal/ventral axis specification(GO:0009950) |
| 0.2 | 0.5 | GO:2001106 | regulation of Rho guanyl-nucleotide exchange factor activity(GO:2001106) |
| 0.2 | 0.3 | GO:2000676 | positive regulation of type B pancreatic cell apoptotic process(GO:2000676) |
| 0.2 | 0.7 | GO:0015874 | norepinephrine transport(GO:0015874) |
| 0.2 | 0.9 | GO:0045716 | positive regulation of low-density lipoprotein particle receptor biosynthetic process(GO:0045716) |
| 0.2 | 2.6 | GO:1990001 | inhibition of cysteine-type endopeptidase activity involved in apoptotic process(GO:1990001) |
| 0.2 | 0.9 | GO:2000465 | regulation of glycogen (starch) synthase activity(GO:2000465) |
| 0.2 | 2.4 | GO:0071688 | striated muscle myosin thick filament assembly(GO:0071688) |
| 0.2 | 2.2 | GO:2000060 | positive regulation of protein ubiquitination involved in ubiquitin-dependent protein catabolic process(GO:2000060) |
| 0.2 | 0.5 | GO:0019068 | virion assembly(GO:0019068) |
| 0.2 | 1.0 | GO:0015722 | canalicular bile acid transport(GO:0015722) |
| 0.2 | 0.2 | GO:2000474 | regulation of opioid receptor signaling pathway(GO:2000474) |
| 0.2 | 0.7 | GO:0046604 | positive regulation of mitotic centrosome separation(GO:0046604) |
| 0.2 | 0.3 | GO:0060596 | mammary placode formation(GO:0060596) |
| 0.2 | 1.8 | GO:0002328 | pro-B cell differentiation(GO:0002328) |
| 0.2 | 0.2 | GO:0051562 | negative regulation of mitochondrial calcium ion concentration(GO:0051562) |
| 0.2 | 0.5 | GO:0016259 | selenium compound metabolic process(GO:0001887) selenocysteine metabolic process(GO:0016259) |
| 0.2 | 0.3 | GO:0043328 | protein targeting to vacuole involved in ubiquitin-dependent protein catabolic process via the multivesicular body sorting pathway(GO:0043328) |
| 0.2 | 0.8 | GO:0045542 | positive regulation of cholesterol biosynthetic process(GO:0045542) positive regulation of cholesterol metabolic process(GO:0090205) |
| 0.2 | 0.3 | GO:0018298 | protein-chromophore linkage(GO:0018298) |
| 0.2 | 1.5 | GO:0043585 | nose morphogenesis(GO:0043585) |
| 0.2 | 1.3 | GO:0009249 | protein lipoylation(GO:0009249) |
| 0.2 | 0.2 | GO:0003219 | cardiac right ventricle formation(GO:0003219) |
| 0.2 | 0.2 | GO:0060535 | trachea cartilage morphogenesis(GO:0060535) |
| 0.2 | 7.9 | GO:0006888 | ER to Golgi vesicle-mediated transport(GO:0006888) |
| 0.2 | 1.4 | GO:0032836 | glomerular basement membrane development(GO:0032836) |
| 0.2 | 0.6 | GO:0006241 | CTP biosynthetic process(GO:0006241) CTP metabolic process(GO:0046036) |
| 0.2 | 0.2 | GO:0051081 | membrane disassembly(GO:0030397) nuclear envelope disassembly(GO:0051081) |
| 0.2 | 0.5 | GO:0008212 | mineralocorticoid metabolic process(GO:0008212) |
| 0.2 | 1.9 | GO:0032780 | negative regulation of ATPase activity(GO:0032780) |
| 0.2 | 0.3 | GO:0038003 | opioid receptor signaling pathway(GO:0038003) |
| 0.2 | 0.5 | GO:0045060 | negative T cell selection(GO:0043383) negative thymic T cell selection(GO:0045060) |
| 0.2 | 0.5 | GO:0099590 | neurotransmitter receptor internalization(GO:0099590) |
| 0.2 | 1.5 | GO:0070070 | proton-transporting V-type ATPase complex assembly(GO:0070070) |
| 0.2 | 1.2 | GO:0033216 | ferric iron import(GO:0033216) ferric iron import into cell(GO:0097461) ferric iron import across plasma membrane(GO:0098706) |
| 0.2 | 1.1 | GO:0017196 | N-terminal peptidyl-methionine acetylation(GO:0017196) |
| 0.2 | 0.8 | GO:1990440 | positive regulation of transcription from RNA polymerase II promoter in response to endoplasmic reticulum stress(GO:1990440) |
| 0.1 | 1.3 | GO:0097066 | response to thyroid hormone(GO:0097066) |
| 0.1 | 0.9 | GO:0030886 | negative regulation of myeloid dendritic cell activation(GO:0030886) |
| 0.1 | 3.0 | GO:0071625 | vocalization behavior(GO:0071625) |
| 0.1 | 0.4 | GO:2001034 | positive regulation of double-strand break repair via nonhomologous end joining(GO:2001034) |
| 0.1 | 1.2 | GO:0032020 | ISG15-protein conjugation(GO:0032020) |
| 0.1 | 0.3 | GO:0045760 | positive regulation of action potential(GO:0045760) |
| 0.1 | 0.1 | GO:2000370 | positive regulation of clathrin-mediated endocytosis(GO:2000370) |
| 0.1 | 0.6 | GO:0007023 | post-chaperonin tubulin folding pathway(GO:0007023) |
| 0.1 | 1.7 | GO:0043011 | myeloid dendritic cell differentiation(GO:0043011) |
| 0.1 | 0.4 | GO:0071799 | response to prostaglandin D(GO:0071798) cellular response to prostaglandin D stimulus(GO:0071799) |
| 0.1 | 0.3 | GO:0036343 | psychomotor behavior(GO:0036343) |
| 0.1 | 0.3 | GO:0002370 | natural killer cell cytokine production(GO:0002370) regulation of natural killer cell cytokine production(GO:0002727) |
| 0.1 | 1.0 | GO:0016338 | calcium-independent cell-cell adhesion via plasma membrane cell-adhesion molecules(GO:0016338) |
| 0.1 | 0.7 | GO:0040016 | embryonic cleavage(GO:0040016) |
| 0.1 | 2.5 | GO:0006904 | vesicle docking involved in exocytosis(GO:0006904) |
| 0.1 | 0.3 | GO:0035434 | copper ion transmembrane transport(GO:0035434) |
| 0.1 | 0.3 | GO:0008588 | release of cytoplasmic sequestered NF-kappaB(GO:0008588) |
| 0.1 | 1.3 | GO:0030277 | maintenance of gastrointestinal epithelium(GO:0030277) |
| 0.1 | 0.8 | GO:0009437 | amino-acid betaine metabolic process(GO:0006577) carnitine metabolic process(GO:0009437) |
| 0.1 | 0.3 | GO:1901166 | neural crest cell migration involved in autonomic nervous system development(GO:1901166) |
| 0.1 | 0.7 | GO:0046085 | adenosine metabolic process(GO:0046085) |
| 0.1 | 0.4 | GO:1903632 | regulation of aminoacyl-tRNA ligase activity(GO:1903630) positive regulation of aminoacyl-tRNA ligase activity(GO:1903632) |
| 0.1 | 1.1 | GO:1900745 | positive regulation of p38MAPK cascade(GO:1900745) |
| 0.1 | 0.6 | GO:0072361 | regulation of glycolytic process by regulation of transcription from RNA polymerase II promoter(GO:0072361) regulation of glycolytic process by negative regulation of transcription from RNA polymerase II promoter(GO:0072362) regulation of lipid transport by negative regulation of transcription from RNA polymerase II promoter(GO:0072368) |
| 0.1 | 0.3 | GO:2000359 | regulation of binding of sperm to zona pellucida(GO:2000359) |
| 0.1 | 1.8 | GO:0070995 | NADPH oxidation(GO:0070995) |
| 0.1 | 0.5 | GO:0043985 | histone H4-R3 methylation(GO:0043985) |
| 0.1 | 0.5 | GO:0007597 | blood coagulation, intrinsic pathway(GO:0007597) |
| 0.1 | 0.3 | GO:0048769 | sarcomerogenesis(GO:0048769) |
| 0.1 | 0.3 | GO:0007199 | G-protein coupled receptor signaling pathway coupled to cGMP nucleotide second messenger(GO:0007199) |
| 0.1 | 0.7 | GO:0045820 | negative regulation of glycolytic process(GO:0045820) |
| 0.1 | 0.3 | GO:0048935 | peripheral nervous system neuron differentiation(GO:0048934) peripheral nervous system neuron development(GO:0048935) |
| 0.1 | 0.9 | GO:0051256 | mitotic spindle elongation(GO:0000022) mitotic spindle midzone assembly(GO:0051256) |
| 0.1 | 1.6 | GO:1903546 | protein localization to photoreceptor outer segment(GO:1903546) |
| 0.1 | 0.1 | GO:0046098 | guanine metabolic process(GO:0046098) |
| 0.1 | 0.5 | GO:0042985 | negative regulation of amyloid precursor protein biosynthetic process(GO:0042985) |
| 0.1 | 0.4 | GO:0048625 | myoblast fate commitment(GO:0048625) |
| 0.1 | 0.4 | GO:0006742 | NADP catabolic process(GO:0006742) |
| 0.1 | 0.4 | GO:1901475 | pyruvate transmembrane transport(GO:1901475) |
| 0.1 | 0.4 | GO:1901299 | negative regulation of hydrogen peroxide-mediated programmed cell death(GO:1901299) |
| 0.1 | 3.4 | GO:0018345 | protein palmitoylation(GO:0018345) |
| 0.1 | 0.8 | GO:0032429 | regulation of phospholipase A2 activity(GO:0032429) |
| 0.1 | 0.3 | GO:0001560 | regulation of cell growth by extracellular stimulus(GO:0001560) |
| 0.1 | 0.1 | GO:1990791 | dorsal root ganglion development(GO:1990791) |
| 0.1 | 2.4 | GO:0034113 | heterotypic cell-cell adhesion(GO:0034113) |
| 0.1 | 1.0 | GO:0098586 | cellular response to virus(GO:0098586) |
| 0.1 | 0.3 | GO:0099527 | postsynapse to nucleus signaling pathway(GO:0099527) |
| 0.1 | 1.9 | GO:0033617 | mitochondrial respiratory chain complex IV assembly(GO:0033617) mitochondrial respiratory chain complex IV biogenesis(GO:0097034) |
| 0.1 | 1.3 | GO:0005981 | regulation of glycogen catabolic process(GO:0005981) |
| 0.1 | 0.4 | GO:0008594 | photoreceptor cell morphogenesis(GO:0008594) |
| 0.1 | 0.2 | GO:0046628 | positive regulation of insulin receptor signaling pathway(GO:0046628) |
| 0.1 | 1.0 | GO:0061318 | renal filtration cell differentiation(GO:0061318) glomerular epithelium development(GO:0072010) glomerular visceral epithelial cell differentiation(GO:0072112) glomerular epithelial cell differentiation(GO:0072311) |
| 0.1 | 1.7 | GO:0046548 | retinal rod cell development(GO:0046548) |
| 0.1 | 0.2 | GO:1901727 | positive regulation of histone deacetylase activity(GO:1901727) |
| 0.1 | 0.4 | GO:0035726 | common myeloid progenitor cell proliferation(GO:0035726) |
| 0.1 | 0.5 | GO:0006121 | mitochondrial electron transport, succinate to ubiquinone(GO:0006121) |
| 0.1 | 0.4 | GO:0072307 | metanephric nephron tubule epithelial cell differentiation(GO:0072257) regulation of metanephric nephron tubule epithelial cell differentiation(GO:0072307) |
| 0.1 | 2.0 | GO:0010758 | regulation of macrophage chemotaxis(GO:0010758) |
| 0.1 | 1.4 | GO:0016339 | calcium-dependent cell-cell adhesion via plasma membrane cell adhesion molecules(GO:0016339) |
| 0.1 | 0.6 | GO:0035608 | protein deglutamylation(GO:0035608) |
| 0.1 | 0.5 | GO:0014029 | neural crest formation(GO:0014029) |
| 0.1 | 0.1 | GO:0009233 | menaquinone metabolic process(GO:0009233) |
| 0.1 | 0.6 | GO:1990592 | protein polyufmylation(GO:1990564) protein K69-linked ufmylation(GO:1990592) |
| 0.1 | 0.1 | GO:0044313 | protein K6-linked deubiquitination(GO:0044313) |
| 0.1 | 0.1 | GO:2000821 | regulation of grooming behavior(GO:2000821) |
| 0.1 | 1.3 | GO:0010452 | histone H3-K36 methylation(GO:0010452) |
| 0.1 | 0.6 | GO:0006290 | pyrimidine dimer repair(GO:0006290) |
| 0.1 | 1.3 | GO:0033006 | regulation of mast cell activation involved in immune response(GO:0033006) regulation of mast cell degranulation(GO:0043304) |
| 0.1 | 0.7 | GO:0045351 | type I interferon biosynthetic process(GO:0045351) |
| 0.1 | 0.2 | GO:0032423 | regulation of mismatch repair(GO:0032423) |
| 0.1 | 0.2 | GO:1902951 | negative regulation of dendritic spine maintenance(GO:1902951) |
| 0.1 | 0.6 | GO:0036462 | TRAIL-activated apoptotic signaling pathway(GO:0036462) |
| 0.1 | 0.4 | GO:0015825 | L-serine transport(GO:0015825) |
| 0.1 | 0.2 | GO:0044154 | histone H3-K14 acetylation(GO:0044154) |
| 0.1 | 0.3 | GO:0060722 | spongiotrophoblast cell proliferation(GO:0060720) cell proliferation involved in embryonic placenta development(GO:0060722) |
| 0.1 | 1.1 | GO:0046040 | IMP metabolic process(GO:0046040) |
| 0.1 | 0.3 | GO:0006828 | manganese ion transport(GO:0006828) |
| 0.1 | 0.7 | GO:0072189 | ureter development(GO:0072189) |
| 0.1 | 0.2 | GO:2001268 | negative regulation of cysteine-type endopeptidase activity involved in apoptotic signaling pathway(GO:2001268) |
| 0.1 | 0.7 | GO:1903301 | positive regulation of glucokinase activity(GO:0033133) positive regulation of hexokinase activity(GO:1903301) |
| 0.1 | 0.2 | GO:0031038 | myosin II filament organization(GO:0031038) regulation of myosin II filament organization(GO:0043519) |
| 0.1 | 0.5 | GO:1903912 | negative regulation of endoplasmic reticulum stress-induced eIF2 alpha phosphorylation(GO:1903912) |
| 0.1 | 0.3 | GO:0071351 | interleukin-18-mediated signaling pathway(GO:0035655) cellular response to interleukin-18(GO:0071351) |
| 0.1 | 0.4 | GO:0090037 | positive regulation of protein kinase C signaling(GO:0090037) |
| 0.1 | 0.2 | GO:1903232 | melanosome assembly(GO:1903232) |
| 0.1 | 0.5 | GO:0060178 | regulation of exocyst localization(GO:0060178) |
| 0.1 | 0.2 | GO:1904262 | negative regulation of TORC1 signaling(GO:1904262) |
| 0.1 | 0.3 | GO:0009312 | oligosaccharide biosynthetic process(GO:0009312) |
| 0.1 | 1.5 | GO:0007339 | binding of sperm to zona pellucida(GO:0007339) sperm-egg recognition(GO:0035036) |
| 0.1 | 0.1 | GO:1902525 | regulation of protein monoubiquitination(GO:1902525) |
| 0.1 | 0.2 | GO:0070682 | proteasome regulatory particle assembly(GO:0070682) |
| 0.1 | 0.8 | GO:0005980 | glycogen catabolic process(GO:0005980) glucan catabolic process(GO:0009251) cellular polysaccharide catabolic process(GO:0044247) |
| 0.1 | 0.3 | GO:0035262 | gonad morphogenesis(GO:0035262) |
| 0.1 | 0.2 | GO:0010838 | positive regulation of keratinocyte proliferation(GO:0010838) |
| 0.1 | 0.2 | GO:0014854 | response to inactivity(GO:0014854) response to muscle inactivity(GO:0014870) response to muscle inactivity involved in regulation of muscle adaptation(GO:0014877) response to denervation involved in regulation of muscle adaptation(GO:0014894) |
| 0.1 | 0.4 | GO:0001955 | blood vessel maturation(GO:0001955) |
| 0.1 | 0.3 | GO:0060017 | parathyroid gland development(GO:0060017) |
| 0.1 | 1.0 | GO:0090026 | positive regulation of monocyte chemotaxis(GO:0090026) |
| 0.1 | 0.3 | GO:1900120 | regulation of receptor binding(GO:1900120) |
| 0.1 | 0.3 | GO:0000715 | nucleotide-excision repair, DNA damage recognition(GO:0000715) |
| 0.1 | 0.3 | GO:0003345 | proepicardium cell migration involved in pericardium morphogenesis(GO:0003345) |
| 0.1 | 0.3 | GO:0010949 | negative regulation of intestinal phytosterol absorption(GO:0010949) negative regulation of intestinal cholesterol absorption(GO:0045796) intestinal phytosterol absorption(GO:0060752) negative regulation of intestinal lipid absorption(GO:1904730) |
| 0.1 | 0.2 | GO:0007619 | courtship behavior(GO:0007619) female courtship behavior(GO:0008050) |
| 0.1 | 0.2 | GO:0045404 | positive regulation of interleukin-4 biosynthetic process(GO:0045404) |
| 0.1 | 0.2 | GO:0071550 | death-inducing signaling complex assembly(GO:0071550) |
| 0.1 | 2.0 | GO:0035335 | peptidyl-tyrosine dephosphorylation(GO:0035335) |
| 0.1 | 0.2 | GO:0042732 | D-xylose metabolic process(GO:0042732) |
| 0.1 | 0.7 | GO:0016056 | rhodopsin mediated signaling pathway(GO:0016056) |
| 0.1 | 1.8 | GO:0046039 | GTP metabolic process(GO:0046039) |
| 0.1 | 1.3 | GO:2000035 | regulation of stem cell division(GO:2000035) |
| 0.1 | 0.6 | GO:0019227 | neuronal action potential propagation(GO:0019227) action potential propagation(GO:0098870) |
| 0.1 | 0.8 | GO:0048520 | positive regulation of behavior(GO:0048520) |
| 0.1 | 0.4 | GO:0042535 | positive regulation of tumor necrosis factor biosynthetic process(GO:0042535) |
| 0.1 | 0.2 | GO:1901897 | regulation of relaxation of cardiac muscle(GO:1901897) |
| 0.1 | 0.4 | GO:0042095 | interferon-gamma biosynthetic process(GO:0042095) |
| 0.1 | 0.3 | GO:0045086 | positive regulation of interleukin-2 biosynthetic process(GO:0045086) |
| 0.1 | 2.0 | GO:0006829 | zinc II ion transport(GO:0006829) |
| 0.1 | 0.7 | GO:0003056 | regulation of vascular smooth muscle contraction(GO:0003056) |
| 0.1 | 0.1 | GO:0060600 | dichotomous subdivision of an epithelial terminal unit(GO:0060600) |
| 0.1 | 1.3 | GO:0002230 | positive regulation of defense response to virus by host(GO:0002230) |
| 0.1 | 0.5 | GO:1903758 | regulation of transcription from RNA polymerase II promoter by histone modification(GO:1903756) negative regulation of transcription from RNA polymerase II promoter by histone modification(GO:1903758) |
| 0.1 | 0.2 | GO:2000650 | negative regulation of sodium ion transmembrane transport(GO:1902306) negative regulation of sodium ion transmembrane transporter activity(GO:2000650) |
| 0.1 | 0.6 | GO:0090385 | phagosome-lysosome fusion(GO:0090385) |
| 0.1 | 0.8 | GO:0019731 | antibacterial humoral response(GO:0019731) |
| 0.1 | 0.4 | GO:0048165 | ovarian cumulus expansion(GO:0001550) fused antrum stage(GO:0048165) |
| 0.1 | 2.6 | GO:0031146 | SCF-dependent proteasomal ubiquitin-dependent protein catabolic process(GO:0031146) |
| 0.1 | 0.5 | GO:0006704 | glucocorticoid biosynthetic process(GO:0006704) |
| 0.1 | 1.3 | GO:0006891 | intra-Golgi vesicle-mediated transport(GO:0006891) |
| 0.1 | 2.0 | GO:0099601 | regulation of neurotransmitter receptor activity(GO:0099601) |
| 0.1 | 0.3 | GO:0060336 | negative regulation of response to interferon-gamma(GO:0060331) negative regulation of interferon-gamma-mediated signaling pathway(GO:0060336) |
| 0.1 | 0.2 | GO:1990168 | protein K29-linked deubiquitination(GO:0035523) protein K27-linked deubiquitination(GO:1990167) protein K33-linked deubiquitination(GO:1990168) |
| 0.1 | 5.0 | GO:1903955 | positive regulation of protein targeting to mitochondrion(GO:1903955) |
| 0.1 | 1.1 | GO:0051044 | positive regulation of membrane protein ectodomain proteolysis(GO:0051044) |
| 0.1 | 2.7 | GO:0045104 | intermediate filament cytoskeleton organization(GO:0045104) |
| 0.1 | 0.1 | GO:2000843 | testosterone secretion(GO:0035936) regulation of testosterone secretion(GO:2000843) |
| 0.1 | 1.1 | GO:0046415 | urate metabolic process(GO:0046415) |
| 0.1 | 0.5 | GO:0033540 | fatty acid beta-oxidation using acyl-CoA oxidase(GO:0033540) |
| 0.1 | 1.0 | GO:0098789 | pre-mRNA cleavage required for polyadenylation(GO:0098789) |
| 0.1 | 0.2 | GO:0006014 | D-ribose metabolic process(GO:0006014) |
| 0.1 | 0.4 | GO:1901837 | negative regulation of transcription of nuclear large rRNA transcript from RNA polymerase I promoter(GO:1901837) |
| 0.1 | 3.4 | GO:0007586 | digestion(GO:0007586) |
| 0.1 | 0.8 | GO:0051601 | exocyst localization(GO:0051601) |
| 0.1 | 0.8 | GO:0043402 | glucocorticoid mediated signaling pathway(GO:0043402) |
| 0.1 | 0.3 | GO:0097384 | cellular lipid biosynthetic process(GO:0097384) |
| 0.1 | 0.5 | GO:0071420 | cellular response to histamine(GO:0071420) |
| 0.1 | 4.7 | GO:0007030 | Golgi organization(GO:0007030) |
| 0.1 | 1.0 | GO:1990126 | retrograde transport, endosome to plasma membrane(GO:1990126) |
| 0.1 | 0.6 | GO:0019395 | fatty acid oxidation(GO:0019395) lipid oxidation(GO:0034440) |
| 0.1 | 0.1 | GO:0046439 | cysteine catabolic process(GO:0009093) L-cysteine catabolic process(GO:0019448) L-cysteine metabolic process(GO:0046439) |
| 0.1 | 0.6 | GO:0003283 | atrial septum development(GO:0003283) |
| 0.1 | 1.1 | GO:0042832 | defense response to protozoan(GO:0042832) |
| 0.1 | 1.9 | GO:0045197 | establishment or maintenance of epithelial cell apical/basal polarity(GO:0045197) |
| 0.1 | 0.5 | GO:2001054 | negative regulation of mesenchymal cell apoptotic process(GO:2001054) |
| 0.1 | 0.5 | GO:0070544 | histone H3-K36 demethylation(GO:0070544) |
| 0.1 | 0.3 | GO:0006409 | tRNA export from nucleus(GO:0006409) tRNA-containing ribonucleoprotein complex export from nucleus(GO:0071431) |
| 0.1 | 0.5 | GO:0060259 | regulation of feeding behavior(GO:0060259) |
| 0.1 | 0.4 | GO:0070572 | positive regulation of axon regeneration(GO:0048680) positive regulation of neuron projection regeneration(GO:0070572) |
| 0.1 | 1.3 | GO:0007095 | mitotic G2 DNA damage checkpoint(GO:0007095) |
| 0.1 | 5.4 | GO:0009062 | fatty acid catabolic process(GO:0009062) |
| 0.1 | 0.7 | GO:1902894 | negative regulation of pri-miRNA transcription from RNA polymerase II promoter(GO:1902894) |
| 0.1 | 0.4 | GO:0038018 | Wnt receptor catabolic process(GO:0038018) |
| 0.1 | 0.9 | GO:0048278 | vesicle docking(GO:0048278) |
| 0.1 | 0.3 | GO:2001275 | positive regulation of glucose import in response to insulin stimulus(GO:2001275) |
| 0.1 | 1.3 | GO:0002251 | organ or tissue specific immune response(GO:0002251) mucosal immune response(GO:0002385) |
| 0.1 | 0.4 | GO:0044146 | negative regulation of growth of symbiont in host(GO:0044130) negative regulation of growth of symbiont involved in interaction with host(GO:0044146) |
| 0.1 | 0.4 | GO:0035336 | long-chain fatty-acyl-CoA metabolic process(GO:0035336) |
| 0.1 | 0.4 | GO:0006561 | proline biosynthetic process(GO:0006561) |
| 0.1 | 0.3 | GO:0070092 | glucagon secretion(GO:0070091) regulation of glucagon secretion(GO:0070092) |
| 0.1 | 0.5 | GO:0033198 | response to ATP(GO:0033198) |
| 0.1 | 1.1 | GO:0099517 | anterograde synaptic vesicle transport(GO:0048490) synaptic vesicle cytoskeletal transport(GO:0099514) synaptic vesicle transport along microtubule(GO:0099517) |
| 0.1 | 0.5 | GO:0061029 | eyelid development in camera-type eye(GO:0061029) |
| 0.1 | 0.2 | GO:0033278 | cell proliferation in midbrain(GO:0033278) establishment of body hair or bristle planar orientation(GO:0048104) establishment of body hair planar orientation(GO:0048105) |
| 0.1 | 0.1 | GO:0010996 | response to auditory stimulus(GO:0010996) |
| 0.1 | 3.7 | GO:0051965 | positive regulation of synapse assembly(GO:0051965) |
| 0.1 | 0.3 | GO:0097240 | meiotic telomere tethering at nuclear periphery(GO:0044821) meiotic attachment of telomere to nuclear envelope(GO:0070197) chromosome attachment to the nuclear envelope(GO:0097240) |
| 0.1 | 0.1 | GO:1900102 | negative regulation of endoplasmic reticulum unfolded protein response(GO:1900102) |
| 0.1 | 0.2 | GO:0000436 | carbon catabolite regulation of transcription from RNA polymerase II promoter(GO:0000429) regulation of transcription from RNA polymerase II promoter by glucose(GO:0000430) positive regulation of transcription from RNA polymerase II promoter by glucose(GO:0000432) carbon catabolite activation of transcription from RNA polymerase II promoter(GO:0000436) carbon catabolite activation of transcription(GO:0045991) positive regulation of transcription by glucose(GO:0046016) |
| 0.1 | 0.4 | GO:0097094 | craniofacial suture morphogenesis(GO:0097094) |
| 0.1 | 0.2 | GO:0097167 | circadian regulation of translation(GO:0097167) |
| 0.1 | 0.3 | GO:1903748 | negative regulation of establishment of protein localization to mitochondrion(GO:1903748) |
| 0.1 | 0.5 | GO:2000124 | regulation of endocannabinoid signaling pathway(GO:2000124) |
| 0.1 | 0.1 | GO:0034145 | positive regulation of toll-like receptor 4 signaling pathway(GO:0034145) |
| 0.1 | 0.6 | GO:0006044 | N-acetylglucosamine metabolic process(GO:0006044) |
| 0.1 | 0.2 | GO:1903976 | negative regulation of glial cell migration(GO:1903976) |
| 0.1 | 6.2 | GO:0007608 | sensory perception of smell(GO:0007608) |
| 0.1 | 0.2 | GO:1902037 | negative regulation of hematopoietic stem cell differentiation(GO:1902037) |
| 0.1 | 0.3 | GO:0043691 | reverse cholesterol transport(GO:0043691) |
| 0.1 | 0.2 | GO:0032722 | positive regulation of chemokine production(GO:0032722) |
| 0.1 | 0.2 | GO:1990034 | calcium ion export(GO:1901660) calcium ion export from cell(GO:1990034) |
| 0.1 | 0.2 | GO:1904784 | NLRP1 inflammasome complex assembly(GO:1904784) |
| 0.1 | 2.2 | GO:0007218 | neuropeptide signaling pathway(GO:0007218) |
| 0.1 | 0.3 | GO:0006623 | protein targeting to vacuole(GO:0006623) |
| 0.1 | 0.5 | GO:1990403 | embryonic brain development(GO:1990403) |
| 0.1 | 0.7 | GO:0014887 | muscle hypertrophy in response to stress(GO:0003299) cardiac muscle adaptation(GO:0014887) cardiac muscle hypertrophy in response to stress(GO:0014898) |
| 0.1 | 0.2 | GO:0042125 | protein glycosylation at cell surface(GO:0033575) protein galactosylation at cell surface(GO:0033580) protein galactosylation(GO:0042125) |
| 0.1 | 0.3 | GO:0032647 | regulation of interferon-alpha production(GO:0032647) positive regulation of interferon-alpha production(GO:0032727) |
| 0.1 | 1.2 | GO:0046856 | phosphatidylinositol dephosphorylation(GO:0046856) |
| 0.1 | 0.1 | GO:2000643 | positive regulation of early endosome to late endosome transport(GO:2000643) |
| 0.1 | 0.5 | GO:0006264 | mitochondrial DNA replication(GO:0006264) |
| 0.1 | 0.1 | GO:0007060 | male meiosis chromosome segregation(GO:0007060) |
| 0.1 | 0.5 | GO:0032506 | cytokinetic process(GO:0032506) |
| 0.1 | 0.1 | GO:0006549 | isoleucine metabolic process(GO:0006549) isoleucine catabolic process(GO:0006550) |
| 0.1 | 1.7 | GO:0046834 | lipid phosphorylation(GO:0046834) |
| 0.1 | 0.9 | GO:0007041 | lysosomal transport(GO:0007041) |
| 0.1 | 0.2 | GO:1903033 | regulation of microtubule plus-end binding(GO:1903031) positive regulation of microtubule plus-end binding(GO:1903033) |
| 0.1 | 0.4 | GO:0009404 | toxin metabolic process(GO:0009404) |
| 0.1 | 0.6 | GO:0090140 | regulation of mitochondrial fission(GO:0090140) |
| 0.1 | 0.5 | GO:0061158 | 3'-UTR-mediated mRNA destabilization(GO:0061158) |
| 0.1 | 4.2 | GO:0007601 | visual perception(GO:0007601) |
| 0.1 | 0.7 | GO:0042407 | cristae formation(GO:0042407) |
| 0.1 | 3.4 | GO:0061077 | chaperone-mediated protein folding(GO:0061077) |
| 0.1 | 0.5 | GO:0033234 | negative regulation of protein sumoylation(GO:0033234) |
| 0.1 | 0.3 | GO:0021869 | forebrain ventricular zone progenitor cell division(GO:0021869) |
| 0.1 | 0.4 | GO:0051013 | microtubule severing(GO:0051013) |
| 0.1 | 0.7 | GO:0007035 | vacuolar acidification(GO:0007035) |
| 0.1 | 0.2 | GO:0042905 | 9-cis-retinoic acid biosynthetic process(GO:0042904) 9-cis-retinoic acid metabolic process(GO:0042905) |
| 0.1 | 0.2 | GO:0032290 | peripheral nervous system myelin formation(GO:0032290) |
| 0.1 | 0.2 | GO:0002418 | immune response to tumor cell(GO:0002418) |
| 0.0 | 0.1 | GO:0010635 | regulation of mitochondrial fusion(GO:0010635) negative regulation of mitochondrial fusion(GO:0010637) |
| 0.0 | 0.1 | GO:0070343 | white fat cell proliferation(GO:0070343) regulation of white fat cell proliferation(GO:0070350) |
| 0.0 | 0.1 | GO:1904781 | positive regulation of protein localization to centrosome(GO:1904781) |
| 0.0 | 0.2 | GO:0072608 | interleukin-10 secretion(GO:0072608) |
| 0.0 | 0.1 | GO:0042761 | very long-chain fatty acid biosynthetic process(GO:0042761) |
| 0.0 | 0.5 | GO:0015732 | prostaglandin transport(GO:0015732) |
| 0.0 | 0.2 | GO:0010499 | proteasomal ubiquitin-independent protein catabolic process(GO:0010499) |
| 0.0 | 0.3 | GO:0036444 | calcium ion transmembrane import into mitochondrion(GO:0036444) |
| 0.0 | 0.2 | GO:0071449 | cellular response to lipid hydroperoxide(GO:0071449) |
| 0.0 | 0.4 | GO:0045745 | positive regulation of G-protein coupled receptor protein signaling pathway(GO:0045745) |
| 0.0 | 0.5 | GO:0002076 | osteoblast development(GO:0002076) |
| 0.0 | 0.0 | GO:0097039 | protein linear polyubiquitination(GO:0097039) |
| 0.0 | 1.7 | GO:0046580 | negative regulation of Ras protein signal transduction(GO:0046580) negative regulation of small GTPase mediated signal transduction(GO:0051058) |
| 0.0 | 0.1 | GO:0098501 | polynucleotide dephosphorylation(GO:0098501) |
| 0.0 | 0.2 | GO:1990035 | calcium ion import across plasma membrane(GO:0098703) calcium ion import into cell(GO:1990035) |
| 0.0 | 0.8 | GO:0002089 | lens morphogenesis in camera-type eye(GO:0002089) |
| 0.0 | 0.3 | GO:0042462 | eye photoreceptor cell development(GO:0042462) |
| 0.0 | 0.3 | GO:0006646 | phosphatidylethanolamine biosynthetic process(GO:0006646) |
| 0.0 | 0.2 | GO:2000271 | positive regulation of fibroblast apoptotic process(GO:2000271) |
| 0.0 | 0.1 | GO:0034142 | toll-like receptor 4 signaling pathway(GO:0034142) |
| 0.0 | 0.0 | GO:0060060 | post-embryonic retina morphogenesis in camera-type eye(GO:0060060) |
| 0.0 | 0.2 | GO:0060040 | retinal bipolar neuron differentiation(GO:0060040) |
| 0.0 | 0.4 | GO:0031670 | cellular response to nutrient(GO:0031670) |
| 0.0 | 0.4 | GO:1901620 | regulation of smoothened signaling pathway involved in dorsal/ventral neural tube patterning(GO:1901620) negative regulation of smoothened signaling pathway involved in dorsal/ventral neural tube patterning(GO:1901621) |
| 0.0 | 0.2 | GO:0009593 | detection of chemical stimulus(GO:0009593) |
| 0.0 | 0.2 | GO:0008300 | isoprenoid catabolic process(GO:0008300) |
| 0.0 | 0.2 | GO:0060004 | reflex(GO:0060004) |
| 0.0 | 0.1 | GO:0002517 | T cell tolerance induction(GO:0002517) |
| 0.0 | 0.3 | GO:0050687 | negative regulation of defense response to virus(GO:0050687) |
| 0.0 | 0.8 | GO:2000756 | regulation of peptidyl-lysine acetylation(GO:2000756) |
| 0.0 | 0.2 | GO:0018401 | peptidyl-proline hydroxylation to 4-hydroxy-L-proline(GO:0018401) |
| 0.0 | 0.8 | GO:0048026 | positive regulation of mRNA splicing, via spliceosome(GO:0048026) |
| 0.0 | 0.1 | GO:0046368 | GDP-L-fucose metabolic process(GO:0046368) |
| 0.0 | 0.1 | GO:0030242 | pexophagy(GO:0030242) |
| 0.0 | 0.2 | GO:0002825 | regulation of T-helper 1 type immune response(GO:0002825) |
| 0.0 | 0.1 | GO:0070813 | hydrogen sulfide metabolic process(GO:0070813) |
| 0.0 | 0.5 | GO:0016926 | protein desumoylation(GO:0016926) |
| 0.0 | 0.1 | GO:2001032 | regulation of double-strand break repair via nonhomologous end joining(GO:2001032) |
| 0.0 | 0.4 | GO:0010842 | retina layer formation(GO:0010842) |
| 0.0 | 0.2 | GO:0051014 | actin filament severing(GO:0051014) |
| 0.0 | 0.1 | GO:0072318 | clathrin coat disassembly(GO:0072318) |
| 0.0 | 0.2 | GO:0090043 | regulation of tubulin deacetylation(GO:0090043) |
| 0.0 | 0.1 | GO:0051182 | coenzyme transport(GO:0051182) |
| 0.0 | 0.1 | GO:0048852 | diencephalon morphogenesis(GO:0048852) |
| 0.0 | 0.4 | GO:0030213 | hyaluronan biosynthetic process(GO:0030213) |
| 0.0 | 0.2 | GO:0071554 | cell wall macromolecule catabolic process(GO:0016998) cell wall macromolecule metabolic process(GO:0044036) cell wall organization or biogenesis(GO:0071554) |
| 0.0 | 0.1 | GO:0034975 | protein folding in endoplasmic reticulum(GO:0034975) |
| 0.0 | 0.3 | GO:0002369 | T cell cytokine production(GO:0002369) |
| 0.0 | 0.1 | GO:1904491 | protein localization to ciliary transition zone(GO:1904491) |
| 0.0 | 0.1 | GO:0002036 | regulation of L-glutamate transport(GO:0002036) |
| 0.0 | 0.0 | GO:0042636 | negative regulation of hair cycle(GO:0042636) |
| 0.0 | 0.0 | GO:0030913 | protein localization to paranode region of axon(GO:0002175) paranodal junction assembly(GO:0030913) |
| 0.0 | 0.7 | GO:0048286 | lung alveolus development(GO:0048286) |
| 0.0 | 0.1 | GO:0090315 | negative regulation of protein targeting to membrane(GO:0090315) |
| 0.0 | 0.2 | GO:0031937 | positive regulation of chromatin silencing(GO:0031937) |
| 0.0 | 0.1 | GO:0035810 | positive regulation of urine volume(GO:0035810) |
| 0.0 | 0.1 | GO:0043589 | skin morphogenesis(GO:0043589) |
| 0.0 | 0.0 | GO:1902669 | positive regulation of axon guidance(GO:1902669) |
| 0.0 | 0.2 | GO:0035520 | monoubiquitinated protein deubiquitination(GO:0035520) |
| 0.0 | 0.4 | GO:0002474 | antigen processing and presentation of peptide antigen via MHC class I(GO:0002474) |
| 0.0 | 0.0 | GO:0048664 | neuron fate determination(GO:0048664) |
| 0.0 | 0.0 | GO:1990918 | double-strand break repair involved in meiotic recombination(GO:1990918) |
| 0.0 | 0.1 | GO:0002949 | tRNA threonylcarbamoyladenosine modification(GO:0002949) |
| 0.0 | 0.8 | GO:0010257 | NADH dehydrogenase complex assembly(GO:0010257) mitochondrial respiratory chain complex I assembly(GO:0032981) mitochondrial respiratory chain complex I biogenesis(GO:0097031) |
| 0.0 | 0.1 | GO:1903608 | protein localization to cytoplasmic stress granule(GO:1903608) |
| 0.0 | 0.8 | GO:0042147 | retrograde transport, endosome to Golgi(GO:0042147) |
| 0.0 | 0.1 | GO:0032460 | negative regulation of protein oligomerization(GO:0032460) |
| 0.0 | 0.1 | GO:0070837 | dehydroascorbic acid transport(GO:0070837) |
| 0.0 | 0.1 | GO:0007258 | JUN phosphorylation(GO:0007258) |
| 0.0 | 0.1 | GO:0015014 | heparan sulfate proteoglycan biosynthetic process, polysaccharide chain biosynthetic process(GO:0015014) |
| 0.0 | 0.1 | GO:0015936 | coenzyme A metabolic process(GO:0015936) |
| 0.0 | 0.2 | GO:1903318 | negative regulation of protein processing(GO:0010955) negative regulation of protein maturation(GO:1903318) |
| 0.0 | 0.0 | GO:0002886 | regulation of myeloid leukocyte mediated immunity(GO:0002886) |
| 0.0 | 0.1 | GO:0006488 | dolichol-linked oligosaccharide biosynthetic process(GO:0006488) |
| 0.0 | 0.1 | GO:0021819 | layer formation in cerebral cortex(GO:0021819) |
| 0.0 | 0.3 | GO:0008589 | regulation of smoothened signaling pathway(GO:0008589) |
| 0.0 | 0.1 | GO:0030889 | negative regulation of B cell proliferation(GO:0030889) |
| 0.0 | 0.2 | GO:0045653 | negative regulation of megakaryocyte differentiation(GO:0045653) |
| 0.0 | 0.0 | GO:0032509 | endosome transport via multivesicular body sorting pathway(GO:0032509) late endosome to vacuole transport via multivesicular body sorting pathway(GO:0032511) |
| 0.0 | 0.1 | GO:0002755 | MyD88-dependent toll-like receptor signaling pathway(GO:0002755) |
| 0.0 | 0.3 | GO:0006607 | NLS-bearing protein import into nucleus(GO:0006607) |
| 0.0 | 0.0 | GO:0045659 | negative regulation of neutrophil differentiation(GO:0045659) |
| 0.0 | 0.2 | GO:0021859 | pyramidal neuron differentiation(GO:0021859) |
| 0.0 | 0.1 | GO:1900363 | regulation of mRNA polyadenylation(GO:1900363) |
| 0.0 | 0.1 | GO:0061727 | methylglyoxal catabolic process to D-lactate via S-lactoyl-glutathione(GO:0019243) methylglyoxal catabolic process(GO:0051596) methylglyoxal catabolic process to lactate(GO:0061727) |
| 0.0 | 0.0 | GO:0086046 | membrane depolarization during SA node cell action potential(GO:0086046) |
| 0.0 | 0.2 | GO:0043001 | Golgi to plasma membrane protein transport(GO:0043001) |
| 0.0 | 0.2 | GO:0045815 | positive regulation of gene expression, epigenetic(GO:0045815) |
| 0.0 | 0.1 | GO:0014886 | transition between slow and fast fiber(GO:0014886) |
| 0.0 | 0.0 | GO:1904688 | regulation of cap-independent translational initiation(GO:1903677) positive regulation of cap-independent translational initiation(GO:1903679) regulation of cytoplasmic translational initiation(GO:1904688) positive regulation of cytoplasmic translational initiation(GO:1904690) |
| 0.0 | 0.1 | GO:1903847 | regulation of aorta morphogenesis(GO:1903847) positive regulation of aorta morphogenesis(GO:1903849) |
| 0.0 | 0.1 | GO:0048671 | negative regulation of collateral sprouting(GO:0048671) |
| 0.0 | 0.0 | GO:0021691 | cerebellar Purkinje cell layer maturation(GO:0021691) |
Gene overrepresentation in cellular component category:
| Log-likelihood per target | Total log-likelihood | Term | Description |
|---|---|---|---|
| 9.3 | 74.5 | GO:0061689 | tricellular tight junction(GO:0061689) |
| 4.2 | 12.6 | GO:0005607 | laminin-2 complex(GO:0005607) |
| 3.4 | 88.1 | GO:0016327 | apicolateral plasma membrane(GO:0016327) |
| 2.9 | 11.8 | GO:0030868 | smooth endoplasmic reticulum membrane(GO:0030868) smooth endoplasmic reticulum part(GO:0097425) |
| 2.7 | 8.2 | GO:0034667 | integrin alpha3-beta1 complex(GO:0034667) |
| 2.7 | 13.7 | GO:0005914 | spot adherens junction(GO:0005914) |
| 2.5 | 34.5 | GO:0045179 | apical cortex(GO:0045179) |
| 2.3 | 33.9 | GO:0001533 | cornified envelope(GO:0001533) |
| 2.2 | 8.7 | GO:0008282 | ATP-sensitive potassium channel complex(GO:0008282) |
| 2.1 | 8.3 | GO:0097487 | multivesicular body, internal vesicle(GO:0097487) |
| 1.8 | 9.2 | GO:0044305 | calyx of Held(GO:0044305) |
| 1.8 | 16.0 | GO:0042105 | alpha-beta T cell receptor complex(GO:0042105) |
| 1.7 | 6.8 | GO:0019815 | B cell receptor complex(GO:0019815) |
| 1.6 | 21.0 | GO:0016600 | flotillin complex(GO:0016600) |
| 1.5 | 4.4 | GO:0042584 | chromaffin granule membrane(GO:0042584) |
| 1.4 | 27.0 | GO:0032433 | filopodium tip(GO:0032433) |
| 1.3 | 30.7 | GO:0042101 | T cell receptor complex(GO:0042101) |
| 1.3 | 11.9 | GO:0000138 | Golgi trans cisterna(GO:0000138) |
| 1.3 | 23.2 | GO:0030057 | desmosome(GO:0030057) |
| 1.3 | 16.4 | GO:0060091 | kinocilium(GO:0060091) |
| 1.3 | 47.8 | GO:0030673 | axolemma(GO:0030673) |
| 1.2 | 3.7 | GO:0016533 | cyclin-dependent protein kinase 5 holoenzyme complex(GO:0016533) |
| 1.2 | 6.0 | GO:1990037 | Lewy body core(GO:1990037) |
| 1.2 | 1.2 | GO:0098843 | postsynaptic endocytic zone(GO:0098843) |
| 1.1 | 18.7 | GO:0036056 | filtration diaphragm(GO:0036056) slit diaphragm(GO:0036057) |
| 1.1 | 7.7 | GO:0070695 | FHF complex(GO:0070695) |
| 1.0 | 8.3 | GO:0005785 | signal recognition particle receptor complex(GO:0005785) |
| 1.0 | 15.5 | GO:0042581 | specific granule(GO:0042581) |
| 1.0 | 10.3 | GO:1990454 | L-type voltage-gated calcium channel complex(GO:1990454) |
| 1.0 | 23.0 | GO:0005922 | connexon complex(GO:0005922) |
| 1.0 | 24.8 | GO:0034706 | sodium channel complex(GO:0034706) |
| 1.0 | 2.9 | GO:1902937 | inward rectifier potassium channel complex(GO:1902937) |
| 0.9 | 16.7 | GO:0031143 | pseudopodium(GO:0031143) |
| 0.9 | 0.9 | GO:0071458 | integral component of cytoplasmic side of endoplasmic reticulum membrane(GO:0071458) integral component of lumenal side of endoplasmic reticulum membrane(GO:0071556) lumenal side of endoplasmic reticulum membrane(GO:0098553) lumenal side of membrane(GO:0098576) |
| 0.9 | 4.5 | GO:0009331 | glycerol-3-phosphate dehydrogenase complex(GO:0009331) |
| 0.8 | 1.7 | GO:0036195 | muscle cell projection(GO:0036194) muscle cell projection membrane(GO:0036195) |
| 0.8 | 6.6 | GO:0005787 | signal peptidase complex(GO:0005787) |
| 0.8 | 2.5 | GO:0020016 | ciliary pocket(GO:0020016) ciliary pocket membrane(GO:0020018) |
| 0.8 | 11.4 | GO:0034663 | endoplasmic reticulum chaperone complex(GO:0034663) |
| 0.8 | 44.3 | GO:0031901 | early endosome membrane(GO:0031901) |
| 0.8 | 3.2 | GO:0097447 | dendritic tree(GO:0097447) |
| 0.8 | 2.4 | GO:0048179 | activin receptor complex(GO:0048179) |
| 0.8 | 2.4 | GO:0098855 | HCN channel complex(GO:0098855) |
| 0.8 | 2.3 | GO:0031095 | platelet dense tubular network membrane(GO:0031095) |
| 0.8 | 6.2 | GO:0032937 | SREBP-SCAP-Insig complex(GO:0032937) |
| 0.8 | 3.8 | GO:1990131 | Gtr1-Gtr2 GTPase complex(GO:1990131) |
| 0.7 | 2.2 | GO:0070939 | Dsl1p complex(GO:0070939) |
| 0.7 | 4.8 | GO:1990604 | IRE1-TRAF2-ASK1 complex(GO:1990604) |
| 0.7 | 7.2 | GO:0097136 | Bcl-2 family protein complex(GO:0097136) |
| 0.6 | 3.2 | GO:1990923 | PET complex(GO:1990923) |
| 0.6 | 5.0 | GO:0033269 | internode region of axon(GO:0033269) |
| 0.6 | 2.5 | GO:0005594 | collagen type IX trimer(GO:0005594) |
| 0.6 | 16.6 | GO:0033268 | node of Ranvier(GO:0033268) |
| 0.6 | 6.0 | GO:0097197 | tetraspanin-enriched microdomain(GO:0097197) |
| 0.6 | 1.8 | GO:0097543 | ciliary inversin compartment(GO:0097543) |
| 0.6 | 21.5 | GO:0043235 | receptor complex(GO:0043235) |
| 0.6 | 5.2 | GO:0044233 | ER-mitochondrion membrane contact site(GO:0044233) |
| 0.6 | 5.2 | GO:0031983 | vesicle lumen(GO:0031983) |
| 0.6 | 24.3 | GO:0030131 | clathrin adaptor complex(GO:0030131) |
| 0.6 | 1.7 | GO:0070557 | PCNA-p21 complex(GO:0070557) |
| 0.6 | 2.8 | GO:0070826 | paraferritin complex(GO:0070826) |
| 0.6 | 11.9 | GO:0031362 | anchored component of external side of plasma membrane(GO:0031362) |
| 0.5 | 2.7 | GO:1990769 | proximal neuron projection(GO:1990769) |
| 0.5 | 4.2 | GO:0005890 | sodium:potassium-exchanging ATPase complex(GO:0005890) |
| 0.5 | 2.6 | GO:0048476 | Holliday junction resolvase complex(GO:0048476) |
| 0.5 | 5.7 | GO:0031985 | Golgi cisterna(GO:0031985) |
| 0.5 | 9.8 | GO:0005751 | mitochondrial respiratory chain complex IV(GO:0005751) |
| 0.5 | 2.6 | GO:0071914 | prominosome(GO:0071914) |
| 0.5 | 6.6 | GO:0030140 | trans-Golgi network transport vesicle(GO:0030140) |
| 0.5 | 3.0 | GO:0098651 | collagen type IV trimer(GO:0005587) network-forming collagen trimer(GO:0098642) collagen network(GO:0098645) basement membrane collagen trimer(GO:0098651) |
| 0.5 | 1.5 | GO:0046691 | intracellular canaliculus(GO:0046691) |
| 0.5 | 14.0 | GO:0045095 | keratin filament(GO:0045095) |
| 0.5 | 7.0 | GO:0030126 | COPI vesicle coat(GO:0030126) |
| 0.5 | 1.5 | GO:0005832 | chaperonin-containing T-complex(GO:0005832) |
| 0.5 | 1.4 | GO:0033257 | Bcl3/NF-kappaB2 complex(GO:0033257) |
| 0.5 | 3.3 | GO:0042406 | extrinsic component of endoplasmic reticulum membrane(GO:0042406) |
| 0.5 | 1.9 | GO:0098791 | Golgi subcompartment(GO:0098791) |
| 0.5 | 14.0 | GO:0055038 | recycling endosome membrane(GO:0055038) |
| 0.5 | 2.3 | GO:0031205 | endoplasmic reticulum Sec complex(GO:0031205) |
| 0.5 | 5.6 | GO:0042612 | MHC class I protein complex(GO:0042612) |
| 0.5 | 19.4 | GO:0048786 | presynaptic active zone(GO:0048786) |
| 0.4 | 6.7 | GO:0008250 | oligosaccharyltransferase complex(GO:0008250) |
| 0.4 | 61.5 | GO:0005923 | bicellular tight junction(GO:0005923) |
| 0.4 | 2.2 | GO:0071438 | invadopodium membrane(GO:0071438) |
| 0.4 | 1.3 | GO:0097232 | lamellar body membrane(GO:0097232) alveolar lamellar body membrane(GO:0097233) |
| 0.4 | 5.5 | GO:0031315 | extrinsic component of mitochondrial outer membrane(GO:0031315) |
| 0.4 | 1.3 | GO:0035841 | growing cell tip(GO:0035838) new growing cell tip(GO:0035841) |
| 0.4 | 0.4 | GO:0038039 | G-protein coupled receptor heterodimeric complex(GO:0038039) |
| 0.4 | 3.6 | GO:0042824 | MHC class I peptide loading complex(GO:0042824) |
| 0.4 | 8.0 | GO:0012507 | ER to Golgi transport vesicle membrane(GO:0012507) |
| 0.4 | 1.2 | GO:0034673 | inhibin-betaglycan-ActRII complex(GO:0034673) |
| 0.4 | 2.4 | GO:0031233 | intrinsic component of external side of plasma membrane(GO:0031233) |
| 0.4 | 2.0 | GO:0043527 | tRNA methyltransferase complex(GO:0043527) |
| 0.4 | 2.7 | GO:0017059 | serine C-palmitoyltransferase complex(GO:0017059) endoplasmic reticulum palmitoyltransferase complex(GO:0031211) |
| 0.4 | 3.1 | GO:0045098 | type III intermediate filament(GO:0045098) |
| 0.4 | 3.1 | GO:0001520 | outer dense fiber(GO:0001520) |
| 0.4 | 2.6 | GO:0016012 | dystroglycan complex(GO:0016011) sarcoglycan complex(GO:0016012) |
| 0.4 | 1.1 | GO:0005608 | laminin-3 complex(GO:0005608) |
| 0.4 | 4.3 | GO:0042613 | MHC class II protein complex(GO:0042613) |
| 0.4 | 1.1 | GO:0005965 | protein farnesyltransferase complex(GO:0005965) |
| 0.3 | 2.1 | GO:0005958 | DNA-dependent protein kinase-DNA ligase 4 complex(GO:0005958) |
| 0.3 | 3.4 | GO:0005579 | membrane attack complex(GO:0005579) |
| 0.3 | 1.7 | GO:0002193 | MAML1-RBP-Jkappa- ICN1 complex(GO:0002193) |
| 0.3 | 1.0 | GO:0005713 | recombination nodule(GO:0005713) |
| 0.3 | 0.7 | GO:0070852 | cell body fiber(GO:0070852) |
| 0.3 | 10.4 | GO:0005779 | integral component of peroxisomal membrane(GO:0005779) |
| 0.3 | 9.3 | GO:0048770 | melanosome(GO:0042470) pigment granule(GO:0048770) |
| 0.3 | 1.3 | GO:0032437 | cuticular plate(GO:0032437) |
| 0.3 | 0.7 | GO:0098839 | postsynaptic density membrane(GO:0098839) |
| 0.3 | 1.3 | GO:0005896 | interleukin-6 receptor complex(GO:0005896) |
| 0.3 | 1.3 | GO:1990696 | USH2 complex(GO:1990696) |
| 0.3 | 7.9 | GO:0097225 | sperm midpiece(GO:0097225) |
| 0.3 | 5.1 | GO:0005641 | nuclear envelope lumen(GO:0005641) |
| 0.3 | 12.5 | GO:0008305 | integrin complex(GO:0008305) |
| 0.3 | 5.3 | GO:0044224 | juxtaparanode region of axon(GO:0044224) |
| 0.3 | 1.9 | GO:0070776 | H3 histone acetyltransferase complex(GO:0070775) MOZ/MORF histone acetyltransferase complex(GO:0070776) |
| 0.3 | 5.5 | GO:1990124 | messenger ribonucleoprotein complex(GO:1990124) |
| 0.3 | 3.7 | GO:0032593 | insulin-responsive compartment(GO:0032593) |
| 0.3 | 1.5 | GO:0000308 | cytoplasmic cyclin-dependent protein kinase holoenzyme complex(GO:0000308) |
| 0.3 | 0.9 | GO:0034657 | GID complex(GO:0034657) |
| 0.3 | 4.8 | GO:0030008 | TRAPP complex(GO:0030008) |
| 0.3 | 1.2 | GO:0097059 | CNTFR-CLCF1 complex(GO:0097059) |
| 0.3 | 6.8 | GO:0030665 | clathrin-coated vesicle membrane(GO:0030665) |
| 0.3 | 0.3 | GO:0055087 | Ski complex(GO:0055087) |
| 0.3 | 0.9 | GO:0043224 | nuclear SCF ubiquitin ligase complex(GO:0043224) |
| 0.3 | 2.6 | GO:0043194 | axon initial segment(GO:0043194) |
| 0.3 | 1.9 | GO:0044294 | dendritic growth cone(GO:0044294) |
| 0.3 | 0.5 | GO:0036488 | CHOP-C/EBP complex(GO:0036488) |
| 0.3 | 0.8 | GO:0032783 | ELL-EAF complex(GO:0032783) |
| 0.3 | 2.1 | GO:0044322 | endoplasmic reticulum quality control compartment(GO:0044322) |
| 0.3 | 2.9 | GO:0070971 | endoplasmic reticulum exit site(GO:0070971) |
| 0.3 | 1.5 | GO:0044232 | organelle membrane contact site(GO:0044232) |
| 0.3 | 1.3 | GO:0097550 | transcriptional preinitiation complex(GO:0097550) |
| 0.3 | 1.5 | GO:0031265 | CD95 death-inducing signaling complex(GO:0031265) |
| 0.3 | 2.1 | GO:1990909 | Wnt signalosome(GO:1990909) |
| 0.3 | 2.3 | GO:0000015 | phosphopyruvate hydratase complex(GO:0000015) |
| 0.3 | 1.5 | GO:0005797 | Golgi medial cisterna(GO:0005797) |
| 0.3 | 2.0 | GO:0000835 | ER ubiquitin ligase complex(GO:0000835) Hrd1p ubiquitin ligase complex(GO:0000836) |
| 0.3 | 4.5 | GO:0044453 | nuclear membrane part(GO:0044453) |
| 0.3 | 1.8 | GO:1990357 | terminal web(GO:1990357) |
| 0.2 | 1.5 | GO:0042765 | GPI-anchor transamidase complex(GO:0042765) |
| 0.2 | 2.4 | GO:0000815 | ESCRT III complex(GO:0000815) |
| 0.2 | 1.7 | GO:0071818 | BAT3 complex(GO:0071818) ER membrane insertion complex(GO:0072379) |
| 0.2 | 2.2 | GO:0043020 | NADPH oxidase complex(GO:0043020) |
| 0.2 | 1.2 | GO:0071144 | SMAD2-SMAD3 protein complex(GO:0071144) |
| 0.2 | 1.2 | GO:0044292 | dendrite terminus(GO:0044292) |
| 0.2 | 0.7 | GO:0034751 | aryl hydrocarbon receptor complex(GO:0034751) |
| 0.2 | 0.5 | GO:0090533 | cation-transporting ATPase complex(GO:0090533) |
| 0.2 | 1.6 | GO:0005796 | Golgi lumen(GO:0005796) |
| 0.2 | 0.2 | GO:0035749 | myelin sheath adaxonal region(GO:0035749) |
| 0.2 | 1.1 | GO:0036396 | MIS complex(GO:0036396) |
| 0.2 | 5.6 | GO:0008074 | guanylate cyclase complex, soluble(GO:0008074) |
| 0.2 | 2.0 | GO:0042571 | immunoglobulin complex, circulating(GO:0042571) |
| 0.2 | 1.5 | GO:0097441 | basilar dendrite(GO:0097441) |
| 0.2 | 20.6 | GO:0032587 | ruffle membrane(GO:0032587) |
| 0.2 | 4.3 | GO:0042588 | zymogen granule(GO:0042588) |
| 0.2 | 1.7 | GO:0070765 | gamma-secretase complex(GO:0070765) |
| 0.2 | 0.7 | GO:0097413 | Lewy body(GO:0097413) |
| 0.2 | 16.2 | GO:0001750 | photoreceptor outer segment(GO:0001750) |
| 0.2 | 0.6 | GO:0033180 | proton-transporting V-type ATPase, V1 domain(GO:0033180) |
| 0.2 | 0.6 | GO:0032311 | angiogenin-PRI complex(GO:0032311) |
| 0.2 | 10.3 | GO:0005793 | endoplasmic reticulum-Golgi intermediate compartment(GO:0005793) |
| 0.2 | 7.7 | GO:0005788 | endoplasmic reticulum lumen(GO:0005788) |
| 0.2 | 1.0 | GO:0002081 | outer acrosomal membrane(GO:0002081) |
| 0.2 | 0.6 | GO:0032280 | symmetric synapse(GO:0032280) |
| 0.2 | 1.2 | GO:0001651 | dense fibrillar component(GO:0001651) |
| 0.2 | 4.0 | GO:0005791 | rough endoplasmic reticulum(GO:0005791) |
| 0.2 | 0.4 | GO:0014731 | spectrin-associated cytoskeleton(GO:0014731) |
| 0.2 | 1.6 | GO:0005742 | mitochondrial outer membrane translocase complex(GO:0005742) |
| 0.2 | 0.8 | GO:1990794 | lateral part of cell(GO:0097574) basolateral part of cell(GO:1990794) rod bipolar cell terminal bouton(GO:1990795) photoreceptor cell terminal bouton(GO:1990796) |
| 0.2 | 0.4 | GO:0016471 | vacuolar proton-transporting V-type ATPase complex(GO:0016471) |
| 0.2 | 3.1 | GO:0031618 | nuclear pericentric heterochromatin(GO:0031618) |
| 0.2 | 4.8 | GO:0000930 | gamma-tubulin complex(GO:0000930) |
| 0.2 | 0.8 | GO:0033063 | Rad51B-Rad51C-Rad51D-XRCC2 complex(GO:0033063) |
| 0.2 | 0.4 | GO:0005899 | insulin receptor complex(GO:0005899) |
| 0.2 | 0.9 | GO:0070876 | SOSS complex(GO:0070876) |
| 0.2 | 0.9 | GO:0031501 | mannosyltransferase complex(GO:0031501) |
| 0.2 | 2.0 | GO:0044754 | autolysosome(GO:0044754) |
| 0.2 | 2.5 | GO:0000506 | glycosylphosphatidylinositol-N-acetylglucosaminyltransferase (GPI-GnT) complex(GO:0000506) |
| 0.2 | 6.3 | GO:0005868 | cytoplasmic dynein complex(GO:0005868) |
| 0.2 | 0.9 | GO:0071782 | endoplasmic reticulum tubular network(GO:0071782) |
| 0.2 | 0.5 | GO:1990590 | ATF1-ATF4 transcription factor complex(GO:1990590) |
| 0.2 | 2.8 | GO:0002199 | zona pellucida receptor complex(GO:0002199) |
| 0.2 | 4.4 | GO:0005801 | cis-Golgi network(GO:0005801) |
| 0.2 | 1.0 | GO:0071986 | Ragulator complex(GO:0071986) |
| 0.2 | 2.3 | GO:0030118 | clathrin coat(GO:0030118) |
| 0.2 | 0.5 | GO:0000814 | ESCRT II complex(GO:0000814) |
| 0.2 | 0.8 | GO:0001931 | uropod(GO:0001931) cell trailing edge(GO:0031254) |
| 0.2 | 3.9 | GO:0016581 | NuRD complex(GO:0016581) CHD-type complex(GO:0090545) |
| 0.2 | 0.8 | GO:0033093 | Weibel-Palade body(GO:0033093) |
| 0.2 | 0.6 | GO:0043293 | apoptosome(GO:0043293) |
| 0.2 | 1.6 | GO:0036454 | insulin-like growth factor binding protein complex(GO:0016942) growth factor complex(GO:0036454) |
| 0.2 | 0.6 | GO:0033263 | CORVET complex(GO:0033263) |
| 0.1 | 0.7 | GO:0033270 | paranode region of axon(GO:0033270) |
| 0.1 | 0.6 | GO:0005944 | phosphatidylinositol 3-kinase complex, class IB(GO:0005944) |
| 0.1 | 0.4 | GO:0034750 | Scrib-APC-beta-catenin complex(GO:0034750) |
| 0.1 | 3.3 | GO:0044216 | other organism(GO:0044215) other organism cell(GO:0044216) other organism part(GO:0044217) |
| 0.1 | 4.3 | GO:0000800 | lateral element(GO:0000800) |
| 0.1 | 1.1 | GO:0000220 | vacuolar proton-transporting V-type ATPase, V0 domain(GO:0000220) |
| 0.1 | 0.4 | GO:0000811 | GINS complex(GO:0000811) |
| 0.1 | 1.1 | GO:0036513 | Derlin-1 retrotranslocation complex(GO:0036513) |
| 0.1 | 1.0 | GO:0005921 | gap junction(GO:0005921) |
| 0.1 | 27.9 | GO:0098852 | lysosomal membrane(GO:0005765) lytic vacuole membrane(GO:0098852) |
| 0.1 | 2.0 | GO:0005662 | DNA replication factor A complex(GO:0005662) |
| 0.1 | 1.8 | GO:0046658 | anchored component of plasma membrane(GO:0046658) |
| 0.1 | 0.4 | GO:0042582 | primary lysosome(GO:0005766) azurophil granule(GO:0042582) |
| 0.1 | 1.1 | GO:0002177 | manchette(GO:0002177) |
| 0.1 | 2.6 | GO:0005942 | phosphatidylinositol 3-kinase complex(GO:0005942) |
| 0.1 | 0.8 | GO:0031314 | extrinsic component of mitochondrial inner membrane(GO:0031314) |
| 0.1 | 0.2 | GO:0002142 | stereocilia ankle link complex(GO:0002142) |
| 0.1 | 2.2 | GO:0035102 | PRC1 complex(GO:0035102) |
| 0.1 | 1.0 | GO:0036128 | CatSper complex(GO:0036128) |
| 0.1 | 0.2 | GO:0030137 | COPI-coated vesicle(GO:0030137) |
| 0.1 | 0.6 | GO:1990246 | uniplex complex(GO:1990246) |
| 0.1 | 0.8 | GO:0033503 | HULC complex(GO:0033503) |
| 0.1 | 2.2 | GO:0033017 | sarcoplasmic reticulum membrane(GO:0033017) |
| 0.1 | 0.3 | GO:0044194 | cytolytic granule(GO:0044194) |
| 0.1 | 0.2 | GO:0016222 | procollagen-proline 4-dioxygenase complex(GO:0016222) |
| 0.1 | 4.6 | GO:0005776 | autophagosome(GO:0005776) |
| 0.1 | 8.1 | GO:0043679 | axon terminus(GO:0043679) |
| 0.1 | 1.5 | GO:0036038 | MKS complex(GO:0036038) |
| 0.1 | 0.3 | GO:0035068 | micro-ribonucleoprotein complex(GO:0035068) |
| 0.1 | 0.4 | GO:0005826 | actomyosin contractile ring(GO:0005826) |
| 0.1 | 0.3 | GO:0036125 | mitochondrial fatty acid beta-oxidation multienzyme complex(GO:0016507) fatty acid beta-oxidation multienzyme complex(GO:0036125) |
| 0.1 | 0.4 | GO:0070436 | Grb2-EGFR complex(GO:0070436) |
| 0.1 | 0.3 | GO:0038045 | large latent transforming growth factor-beta complex(GO:0038045) |
| 0.1 | 455.6 | GO:0016021 | integral component of membrane(GO:0016021) |
| 0.1 | 3.5 | GO:0035861 | site of double-strand break(GO:0035861) |
| 0.1 | 1.1 | GO:0017119 | Golgi transport complex(GO:0017119) |
| 0.1 | 0.9 | GO:0031462 | Cul2-RING ubiquitin ligase complex(GO:0031462) |
| 0.1 | 0.2 | GO:0044307 | dendritic branch(GO:0044307) |
| 0.1 | 1.4 | GO:0035686 | sperm fibrous sheath(GO:0035686) |
| 0.1 | 0.6 | GO:0031083 | BLOC-1 complex(GO:0031083) |
| 0.1 | 0.2 | GO:0097443 | sorting endosome(GO:0097443) |
| 0.1 | 0.2 | GO:0030896 | checkpoint clamp complex(GO:0030896) |
| 0.1 | 1.8 | GO:0005849 | mRNA cleavage factor complex(GO:0005849) |
| 0.1 | 0.3 | GO:0002111 | BRCA2-BRAF35 complex(GO:0002111) |
| 0.1 | 0.8 | GO:0000812 | Swr1 complex(GO:0000812) |
| 0.1 | 0.8 | GO:0035869 | ciliary transition zone(GO:0035869) |
| 0.1 | 2.3 | GO:0031594 | neuromuscular junction(GO:0031594) |
| 0.1 | 0.7 | GO:0031332 | RISC complex(GO:0016442) RNAi effector complex(GO:0031332) |
| 0.1 | 0.2 | GO:0016939 | kinesin II complex(GO:0016939) |
| 0.1 | 0.2 | GO:1990745 | EARP complex(GO:1990745) |
| 0.1 | 0.6 | GO:0032797 | SMN complex(GO:0032797) |
| 0.1 | 0.7 | GO:0030992 | intraciliary transport particle B(GO:0030992) |
| 0.1 | 0.7 | GO:0030904 | retromer complex(GO:0030904) |
| 0.1 | 0.4 | GO:0033256 | I-kappaB/NF-kappaB complex(GO:0033256) |
| 0.1 | 2.9 | GO:0009897 | external side of plasma membrane(GO:0009897) |
| 0.1 | 0.2 | GO:0033165 | interphotoreceptor matrix(GO:0033165) |
| 0.1 | 0.1 | GO:0097513 | myosin II filament(GO:0097513) |
| 0.1 | 0.3 | GO:0072357 | PTW/PP1 phosphatase complex(GO:0072357) |
| 0.1 | 1.3 | GO:0031430 | M band(GO:0031430) |
| 0.1 | 0.3 | GO:0016602 | CCAAT-binding factor complex(GO:0016602) |
| 0.1 | 1.0 | GO:0071564 | npBAF complex(GO:0071564) |
| 0.0 | 0.1 | GO:0002080 | acrosomal membrane(GO:0002080) |
| 0.0 | 1.6 | GO:0080008 | Cul4-RING E3 ubiquitin ligase complex(GO:0080008) |
| 0.0 | 4.6 | GO:0005802 | trans-Golgi network(GO:0005802) |
| 0.0 | 0.6 | GO:0000407 | pre-autophagosomal structure(GO:0000407) |
| 0.0 | 0.3 | GO:0000125 | PCAF complex(GO:0000125) |
| 0.0 | 5.9 | GO:0030141 | secretory granule(GO:0030141) |
| 0.0 | 0.7 | GO:0005671 | Ada2/Gcn5/Ada3 transcription activator complex(GO:0005671) |
| 0.0 | 3.2 | GO:0036064 | ciliary basal body(GO:0036064) |
| 0.0 | 0.2 | GO:0035189 | Rb-E2F complex(GO:0035189) |
| 0.0 | 5.3 | GO:0000323 | lytic vacuole(GO:0000323) lysosome(GO:0005764) |
| 0.0 | 0.2 | GO:0072558 | NLRP1 inflammasome complex(GO:0072558) |
| 0.0 | 0.2 | GO:1990111 | spermatoproteasome complex(GO:1990111) |
| 0.0 | 0.2 | GO:0090665 | dystrophin-associated glycoprotein complex(GO:0016010) glycoprotein complex(GO:0090665) |
| 0.0 | 0.4 | GO:0042587 | glycogen granule(GO:0042587) |
| 0.0 | 0.2 | GO:0061700 | GATOR2 complex(GO:0061700) |
| 0.0 | 0.1 | GO:0005584 | collagen type I trimer(GO:0005584) |
| 0.0 | 0.1 | GO:0031417 | NatC complex(GO:0031417) |
| 0.0 | 0.3 | GO:0005869 | dynactin complex(GO:0005869) |
| 0.0 | 2.5 | GO:0005930 | axoneme(GO:0005930) |
| 0.0 | 0.5 | GO:0090544 | BAF-type complex(GO:0090544) |
| 0.0 | 0.2 | GO:0000813 | ESCRT I complex(GO:0000813) |
| 0.0 | 0.1 | GO:0060053 | neurofilament cytoskeleton(GO:0060053) |
| 0.0 | 0.5 | GO:0035327 | transcriptionally active chromatin(GO:0035327) |
| 0.0 | 0.2 | GO:1990907 | beta-catenin-TCF complex(GO:1990907) |
| 0.0 | 0.1 | GO:0097165 | nuclear stress granule(GO:0097165) |
| 0.0 | 2.0 | GO:0016605 | PML body(GO:0016605) |
| 0.0 | 1.4 | GO:0000786 | nucleosome(GO:0000786) |
| 0.0 | 0.1 | GO:0071942 | XPC complex(GO:0071942) |
| 0.0 | 0.1 | GO:0071148 | TEAD-1-YAP complex(GO:0071148) |
| 0.0 | 1.6 | GO:0016363 | nuclear matrix(GO:0016363) |
| 0.0 | 0.4 | GO:0008180 | COP9 signalosome(GO:0008180) |
| 0.0 | 0.0 | GO:0071797 | LUBAC complex(GO:0071797) |
| 0.0 | 0.1 | GO:0000127 | transcription factor TFIIIC complex(GO:0000127) |
| 0.0 | 0.1 | GO:0044530 | supraspliceosomal complex(GO:0044530) |
| 0.0 | 0.1 | GO:0071598 | neuronal ribonucleoprotein granule(GO:0071598) |
| 0.0 | 0.4 | GO:0035145 | exon-exon junction complex(GO:0035145) |
| 0.0 | 0.0 | GO:0001405 | presequence translocase-associated import motor(GO:0001405) |
Gene overrepresentation in molecular function category:
| Log-likelihood per target | Total log-likelihood | Term | Description |
|---|---|---|---|
| 12.1 | 48.3 | GO:0070506 | high-density lipoprotein particle receptor activity(GO:0070506) |
| 6.5 | 19.5 | GO:0004967 | glucagon receptor activity(GO:0004967) |
| 5.0 | 15.1 | GO:0017082 | mineralocorticoid receptor activity(GO:0017082) |
| 4.9 | 39.4 | GO:0032795 | heterotrimeric G-protein binding(GO:0032795) |
| 3.8 | 15.2 | GO:0001733 | galactosylceramide sulfotransferase activity(GO:0001733) |
| 3.4 | 10.2 | GO:0008107 | galactoside 2-alpha-L-fucosyltransferase activity(GO:0008107) alpha-(1,2)-fucosyltransferase activity(GO:0031127) |
| 3.1 | 9.2 | GO:0070737 | protein-glycine ligase activity, elongating(GO:0070737) |
| 3.0 | 23.7 | GO:0035727 | lysophosphatidic acid binding(GO:0035727) |
| 2.9 | 20.0 | GO:0008467 | [heparan sulfate]-glucosamine 3-sulfotransferase 1 activity(GO:0008467) |
| 2.9 | 11.4 | GO:0072320 | volume-sensitive chloride channel activity(GO:0072320) |
| 2.8 | 8.5 | GO:0008745 | N-acetylmuramoyl-L-alanine amidase activity(GO:0008745) peptidoglycan receptor activity(GO:0016019) |
| 2.8 | 11.0 | GO:0004668 | protein-arginine deiminase activity(GO:0004668) |
| 2.7 | 8.2 | GO:0071936 | coreceptor activity involved in Wnt signaling pathway(GO:0071936) |
| 2.7 | 8.1 | GO:0022865 | transmembrane electron transfer carrier(GO:0022865) |
| 2.7 | 10.8 | GO:0008859 | exoribonuclease II activity(GO:0008859) |
| 2.7 | 8.0 | GO:0030280 | structural constituent of epidermis(GO:0030280) |
| 2.6 | 7.9 | GO:0005118 | sevenless binding(GO:0005118) |
| 2.4 | 26.7 | GO:0015280 | ligand-gated sodium channel activity(GO:0015280) |
| 2.2 | 17.4 | GO:0005001 | transmembrane receptor protein tyrosine phosphatase activity(GO:0005001) transmembrane receptor protein phosphatase activity(GO:0019198) |
| 2.0 | 6.1 | GO:0019120 | hydrolase activity, acting on acid halide bonds(GO:0016824) hydrolase activity, acting on acid halide bonds, in C-halide compounds(GO:0019120) alkylhalidase activity(GO:0047651) |
| 2.0 | 31.5 | GO:0045294 | alpha-catenin binding(GO:0045294) |
| 2.0 | 5.9 | GO:0004800 | thyroxine 5'-deiodinase activity(GO:0004800) |
| 1.9 | 5.7 | GO:0045127 | N-acetylglucosamine kinase activity(GO:0045127) |
| 1.9 | 7.5 | GO:0048408 | epidermal growth factor binding(GO:0048408) |
| 1.9 | 9.4 | GO:0016941 | natriuretic peptide receptor activity(GO:0016941) |
| 1.8 | 9.2 | GO:0008427 | calcium-dependent protein kinase inhibitor activity(GO:0008427) |
| 1.8 | 5.5 | GO:0000253 | 3-keto sterol reductase activity(GO:0000253) |
| 1.8 | 16.3 | GO:0004571 | mannosyl-oligosaccharide 1,2-alpha-mannosidase activity(GO:0004571) |
| 1.7 | 5.2 | GO:0015272 | ATP-activated inward rectifier potassium channel activity(GO:0015272) |
| 1.7 | 1.7 | GO:0000900 | translation repressor activity, nucleic acid binding(GO:0000900) |
| 1.7 | 8.4 | GO:0004925 | prolactin receptor activity(GO:0004925) |
| 1.7 | 6.7 | GO:0008147 | structural constituent of bone(GO:0008147) |
| 1.7 | 5.0 | GO:0051429 | corticotropin-releasing hormone receptor binding(GO:0051429) |
| 1.5 | 9.2 | GO:0004028 | 3-chloroallyl aldehyde dehydrogenase activity(GO:0004028) |
| 1.5 | 1.5 | GO:0015440 | peptide-transporting ATPase activity(GO:0015440) |
| 1.5 | 10.6 | GO:0005000 | vasopressin receptor activity(GO:0005000) |
| 1.5 | 22.5 | GO:0070513 | death domain binding(GO:0070513) |
| 1.4 | 18.6 | GO:0019911 | structural constituent of myelin sheath(GO:0019911) |
| 1.4 | 4.3 | GO:0048030 | disaccharide binding(GO:0048030) |
| 1.4 | 8.5 | GO:0000155 | phosphorelay sensor kinase activity(GO:0000155) |
| 1.4 | 4.2 | GO:0004771 | sterol esterase activity(GO:0004771) |
| 1.3 | 5.4 | GO:0004566 | beta-glucuronidase activity(GO:0004566) |
| 1.3 | 4.0 | GO:0016901 | glycerol-3-phosphate dehydrogenase activity(GO:0004368) oxidoreductase activity, acting on the CH-OH group of donors, quinone or similar compound as acceptor(GO:0016901) |
| 1.3 | 5.3 | GO:0004008 | copper-exporting ATPase activity(GO:0004008) copper-transporting ATPase activity(GO:0043682) |
| 1.3 | 18.5 | GO:0022889 | L-serine transmembrane transporter activity(GO:0015194) serine transmembrane transporter activity(GO:0022889) |
| 1.3 | 6.6 | GO:0003839 | gamma-glutamylcyclotransferase activity(GO:0003839) |
| 1.3 | 6.5 | GO:0004994 | somatostatin receptor activity(GO:0004994) |
| 1.3 | 1.3 | GO:0005308 | creatine transmembrane transporter activity(GO:0005308) |
| 1.3 | 3.8 | GO:0033906 | hyaluronoglucuronidase activity(GO:0033906) |
| 1.2 | 11.1 | GO:0001609 | G-protein coupled adenosine receptor activity(GO:0001609) |
| 1.2 | 3.6 | GO:0016309 | 1-phosphatidylinositol-5-phosphate 4-kinase activity(GO:0016309) |
| 1.2 | 3.5 | GO:1902271 | lithocholic acid binding(GO:1902121) D3 vitamins binding(GO:1902271) |
| 1.2 | 1.2 | GO:0031798 | type 1 metabotropic glutamate receptor binding(GO:0031798) |
| 1.2 | 3.5 | GO:0019912 | cyclin-dependent protein kinase activating kinase activity(GO:0019912) |
| 1.2 | 3.5 | GO:0009041 | uridylate kinase activity(GO:0009041) |
| 1.1 | 3.3 | GO:0038100 | nodal binding(GO:0038100) |
| 1.1 | 19.8 | GO:0030169 | low-density lipoprotein particle binding(GO:0030169) |
| 1.1 | 3.3 | GO:0004560 | alpha-L-fucosidase activity(GO:0004560) fucosidase activity(GO:0015928) |
| 1.1 | 2.2 | GO:0070401 | NADP+ binding(GO:0070401) |
| 1.1 | 7.6 | GO:0001515 | opioid peptide activity(GO:0001515) |
| 1.1 | 5.4 | GO:1990254 | keratin filament binding(GO:1990254) |
| 1.1 | 4.3 | GO:0030348 | syntaxin-3 binding(GO:0030348) |
| 1.1 | 5.3 | GO:0008269 | JAK pathway signal transduction adaptor activity(GO:0008269) |
| 1.0 | 4.2 | GO:1902379 | chemoattractant activity involved in axon guidance(GO:1902379) |
| 1.0 | 13.6 | GO:0015386 | potassium:proton antiporter activity(GO:0015386) |
| 1.0 | 7.3 | GO:0042834 | peptidoglycan binding(GO:0042834) |
| 1.0 | 5.1 | GO:0015185 | gamma-aminobutyric acid:sodium symporter activity(GO:0005332) gamma-aminobutyric acid transmembrane transporter activity(GO:0015185) |
| 1.0 | 10.3 | GO:0071253 | connexin binding(GO:0071253) |
| 1.0 | 14.2 | GO:0008191 | metalloendopeptidase inhibitor activity(GO:0008191) |
| 1.0 | 7.1 | GO:0004351 | glutamate decarboxylase activity(GO:0004351) |
| 1.0 | 3.0 | GO:0016979 | lipoate-protein ligase activity(GO:0016979) |
| 1.0 | 6.0 | GO:0004528 | phosphodiesterase I activity(GO:0004528) |
| 1.0 | 7.0 | GO:0004013 | adenosylhomocysteinase activity(GO:0004013) trialkylsulfonium hydrolase activity(GO:0016802) |
| 1.0 | 4.0 | GO:0070976 | TIR domain binding(GO:0070976) |
| 1.0 | 14.7 | GO:0019531 | oxalate transmembrane transporter activity(GO:0019531) |
| 0.9 | 5.7 | GO:0017040 | ceramidase activity(GO:0017040) |
| 0.9 | 5.6 | GO:0019238 | cyclohydrolase activity(GO:0019238) |
| 0.9 | 2.8 | GO:0004605 | phosphatidate cytidylyltransferase activity(GO:0004605) |
| 0.9 | 3.7 | GO:0005146 | leukemia inhibitory factor receptor binding(GO:0005146) |
| 0.9 | 5.5 | GO:0008195 | phosphatidate phosphatase activity(GO:0008195) |
| 0.9 | 12.7 | GO:0005243 | gap junction channel activity(GO:0005243) |
| 0.9 | 18.5 | GO:0001618 | virus receptor activity(GO:0001618) |
| 0.9 | 4.4 | GO:0004850 | uridine phosphorylase activity(GO:0004850) |
| 0.9 | 5.2 | GO:0060698 | endoribonuclease inhibitor activity(GO:0060698) |
| 0.9 | 6.0 | GO:0030151 | molybdenum ion binding(GO:0030151) |
| 0.8 | 2.5 | GO:0045159 | myosin II binding(GO:0045159) |
| 0.8 | 33.7 | GO:0005154 | epidermal growth factor receptor binding(GO:0005154) |
| 0.8 | 43.5 | GO:0005158 | insulin receptor binding(GO:0005158) |
| 0.8 | 4.1 | GO:0032810 | sterol response element binding(GO:0032810) |
| 0.8 | 0.8 | GO:0008158 | hedgehog receptor activity(GO:0008158) |
| 0.8 | 2.5 | GO:0032190 | acrosin binding(GO:0032190) |
| 0.8 | 3.3 | GO:0034739 | histone deacetylase activity (H4-K16 specific)(GO:0034739) |
| 0.8 | 2.4 | GO:0042954 | lipoprotein transporter activity(GO:0042954) |
| 0.8 | 1.6 | GO:0052658 | inositol-1,4,5-trisphosphate 5-phosphatase activity(GO:0052658) |
| 0.8 | 4.0 | GO:0003835 | beta-galactoside alpha-2,6-sialyltransferase activity(GO:0003835) |
| 0.8 | 3.1 | GO:0005008 | hepatocyte growth factor-activated receptor activity(GO:0005008) |
| 0.8 | 3.1 | GO:0004104 | cholinesterase activity(GO:0004104) |
| 0.8 | 2.3 | GO:0015142 | citrate transmembrane transporter activity(GO:0015137) tricarboxylic acid transmembrane transporter activity(GO:0015142) |
| 0.8 | 5.4 | GO:0070699 | type II activin receptor binding(GO:0070699) |
| 0.8 | 20.0 | GO:0004198 | calcium-dependent cysteine-type endopeptidase activity(GO:0004198) |
| 0.8 | 3.0 | GO:0004839 | ubiquitin activating enzyme activity(GO:0004839) |
| 0.8 | 7.5 | GO:0036374 | glutathione hydrolase activity(GO:0036374) |
| 0.8 | 1.5 | GO:0086089 | voltage-gated potassium channel activity involved in atrial cardiac muscle cell action potential repolarization(GO:0086089) |
| 0.8 | 8.3 | GO:0008239 | dipeptidyl-peptidase activity(GO:0008239) |
| 0.7 | 2.2 | GO:0015184 | L-cystine transmembrane transporter activity(GO:0015184) |
| 0.7 | 5.2 | GO:0004499 | N,N-dimethylaniline monooxygenase activity(GO:0004499) |
| 0.7 | 2.9 | GO:0061628 | H3K27me3 modified histone binding(GO:0061628) |
| 0.7 | 2.2 | GO:0070573 | metallodipeptidase activity(GO:0070573) |
| 0.7 | 4.3 | GO:0055131 | C3HC4-type RING finger domain binding(GO:0055131) |
| 0.7 | 10.8 | GO:0042043 | neurexin family protein binding(GO:0042043) |
| 0.7 | 9.4 | GO:0045236 | CXCR chemokine receptor binding(GO:0045236) |
| 0.7 | 3.6 | GO:0008172 | S-methyltransferase activity(GO:0008172) |
| 0.7 | 2.9 | GO:0019808 | polyamine binding(GO:0019808) |
| 0.7 | 3.5 | GO:0005150 | interleukin-1, Type I receptor binding(GO:0005150) |
| 0.7 | 4.9 | GO:0015220 | choline transmembrane transporter activity(GO:0015220) |
| 0.7 | 12.6 | GO:0008331 | high voltage-gated calcium channel activity(GO:0008331) |
| 0.7 | 5.6 | GO:0015379 | potassium:chloride symporter activity(GO:0015379) potassium ion symporter activity(GO:0022820) |
| 0.7 | 7.6 | GO:0051870 | methotrexate binding(GO:0051870) |
| 0.7 | 4.1 | GO:0005030 | neurotrophin receptor activity(GO:0005030) |
| 0.7 | 3.4 | GO:0000293 | ferric-chelate reductase activity(GO:0000293) |
| 0.7 | 2.7 | GO:0033883 | pyridoxal phosphatase activity(GO:0033883) |
| 0.7 | 2.0 | GO:0047179 | platelet-activating factor acetyltransferase activity(GO:0047179) |
| 0.7 | 8.7 | GO:0034987 | immunoglobulin receptor binding(GO:0034987) |
| 0.7 | 5.2 | GO:0046870 | cadmium ion binding(GO:0046870) |
| 0.7 | 2.0 | GO:0008176 | tRNA (guanine-N7-)-methyltransferase activity(GO:0008176) |
| 0.7 | 1.3 | GO:0015277 | kainate selective glutamate receptor activity(GO:0015277) |
| 0.6 | 3.2 | GO:0004594 | pantothenate kinase activity(GO:0004594) |
| 0.6 | 2.5 | GO:0003844 | 1,4-alpha-glucan branching enzyme activity(GO:0003844) |
| 0.6 | 5.0 | GO:0097322 | 7SK snRNA binding(GO:0097322) |
| 0.6 | 24.5 | GO:0005227 | calcium activated cation channel activity(GO:0005227) |
| 0.6 | 4.3 | GO:0015923 | mannosidase activity(GO:0015923) |
| 0.6 | 5.5 | GO:0005432 | calcium:sodium antiporter activity(GO:0005432) |
| 0.6 | 18.9 | GO:0005104 | fibroblast growth factor receptor binding(GO:0005104) |
| 0.6 | 6.7 | GO:0034595 | phosphatidylinositol-4,5-bisphosphate 5-phosphatase activity(GO:0004439) phosphatidylinositol phosphate 5-phosphatase activity(GO:0034595) |
| 0.6 | 6.0 | GO:0005391 | sodium:potassium-exchanging ATPase activity(GO:0005391) potassium-transporting ATPase activity(GO:0008556) |
| 0.6 | 1.8 | GO:0015065 | uridine nucleotide receptor activity(GO:0015065) G-protein coupled pyrimidinergic nucleotide receptor activity(GO:0071553) |
| 0.6 | 5.9 | GO:0008429 | phosphatidylethanolamine binding(GO:0008429) |
| 0.6 | 4.7 | GO:0010385 | double-stranded methylated DNA binding(GO:0010385) |
| 0.6 | 1.8 | GO:0004489 | methylenetetrahydrofolate reductase (NAD(P)H) activity(GO:0004489) |
| 0.6 | 4.7 | GO:0030550 | acetylcholine receptor inhibitor activity(GO:0030550) |
| 0.6 | 2.9 | GO:0004849 | uridine kinase activity(GO:0004849) |
| 0.6 | 3.5 | GO:0005173 | stem cell factor receptor binding(GO:0005173) |
| 0.6 | 1.7 | GO:0046538 | bisphosphoglycerate mutase activity(GO:0004082) phosphoglycerate mutase activity(GO:0004619) 2,3-bisphosphoglycerate-dependent phosphoglycerate mutase activity(GO:0046538) |
| 0.6 | 9.3 | GO:0005161 | platelet-derived growth factor receptor binding(GO:0005161) |
| 0.6 | 2.9 | GO:0042610 | CD8 receptor binding(GO:0042610) |
| 0.6 | 3.5 | GO:0008597 | calcium-dependent protein serine/threonine phosphatase regulator activity(GO:0008597) |
| 0.6 | 1.7 | GO:0046592 | polyamine oxidase activity(GO:0046592) spermine:oxygen oxidoreductase (spermidine-forming) activity(GO:0052901) |
| 0.6 | 1.7 | GO:0090556 | apolipoprotein receptor activity(GO:0030226) apolipoprotein A-I receptor activity(GO:0034188) phosphatidylserine-translocating ATPase activity(GO:0090556) |
| 0.6 | 5.1 | GO:0001025 | RNA polymerase III transcription factor binding(GO:0001025) |
| 0.6 | 6.8 | GO:0019215 | intermediate filament binding(GO:0019215) |
| 0.5 | 4.9 | GO:0019534 | toxin transporter activity(GO:0019534) |
| 0.5 | 8.2 | GO:0030296 | protein tyrosine kinase activator activity(GO:0030296) |
| 0.5 | 3.8 | GO:0034711 | inhibin binding(GO:0034711) |
| 0.5 | 2.7 | GO:0005172 | vascular endothelial growth factor receptor binding(GO:0005172) |
| 0.5 | 2.2 | GO:0016230 | sphingomyelin phosphodiesterase activator activity(GO:0016230) |
| 0.5 | 32.2 | GO:0035255 | ionotropic glutamate receptor binding(GO:0035255) |
| 0.5 | 8.7 | GO:0046977 | TAP binding(GO:0046977) |
| 0.5 | 13.6 | GO:0031489 | myosin V binding(GO:0031489) |
| 0.5 | 1.1 | GO:0004660 | protein farnesyltransferase activity(GO:0004660) |
| 0.5 | 2.1 | GO:0015222 | serotonin transmembrane transporter activity(GO:0015222) |
| 0.5 | 1.6 | GO:0016401 | palmitoyl-CoA oxidase activity(GO:0016401) |
| 0.5 | 0.5 | GO:0004945 | angiotensin type II receptor activity(GO:0004945) |
| 0.5 | 4.2 | GO:0016312 | inositol bisphosphate phosphatase activity(GO:0016312) |
| 0.5 | 0.5 | GO:0043125 | ErbB-3 class receptor binding(GO:0043125) |
| 0.5 | 1.6 | GO:0016155 | formyltetrahydrofolate dehydrogenase activity(GO:0016155) |
| 0.5 | 2.6 | GO:0004565 | beta-galactosidase activity(GO:0004565) |
| 0.5 | 4.2 | GO:1990239 | steroid hormone binding(GO:1990239) |
| 0.5 | 2.1 | GO:0031708 | endothelin B receptor binding(GO:0031708) |
| 0.5 | 1.0 | GO:0015183 | L-aspartate transmembrane transporter activity(GO:0015183) |
| 0.5 | 6.7 | GO:0004576 | oligosaccharyl transferase activity(GO:0004576) dolichyl-diphosphooligosaccharide-protein glycotransferase activity(GO:0004579) |
| 0.5 | 1.5 | GO:0001225 | RNA polymerase II transcription coactivator binding(GO:0001225) |
| 0.5 | 1.5 | GO:0099602 | acetylcholine receptor regulator activity(GO:0030548) neurotransmitter receptor regulator activity(GO:0099602) |
| 0.5 | 12.2 | GO:0004181 | metallocarboxypeptidase activity(GO:0004181) |
| 0.5 | 3.9 | GO:0036312 | phosphatidylinositol 3-kinase regulatory subunit binding(GO:0036312) |
| 0.5 | 1.4 | GO:0015389 | pyrimidine- and adenine-specific:sodium symporter activity(GO:0015389) |
| 0.5 | 3.3 | GO:0099609 | microtubule lateral binding(GO:0099609) |
| 0.5 | 1.9 | GO:0034584 | piRNA binding(GO:0034584) |
| 0.5 | 61.3 | GO:0030165 | PDZ domain binding(GO:0030165) |
| 0.5 | 2.8 | GO:1990430 | extracellular matrix protein binding(GO:1990430) |
| 0.5 | 1.4 | GO:0004311 | farnesyltranstransferase activity(GO:0004311) |
| 0.5 | 1.4 | GO:0003829 | beta-1,3-galactosyl-O-glycosyl-glycoprotein beta-1,6-N-acetylglucosaminyltransferase activity(GO:0003829) |
| 0.5 | 3.3 | GO:0060229 | phospholipase activator activity(GO:0016004) lipase activator activity(GO:0060229) |
| 0.5 | 0.5 | GO:0005110 | frizzled-2 binding(GO:0005110) |
| 0.5 | 1.4 | GO:0002046 | opsin binding(GO:0002046) |
| 0.5 | 14.3 | GO:0005385 | zinc ion transmembrane transporter activity(GO:0005385) |
| 0.5 | 4.1 | GO:0061676 | importin-alpha family protein binding(GO:0061676) |
| 0.5 | 2.3 | GO:0019828 | aspartic-type endopeptidase inhibitor activity(GO:0019828) |
| 0.5 | 15.6 | GO:0016289 | CoA hydrolase activity(GO:0016289) |
| 0.5 | 1.8 | GO:0097108 | hedgehog family protein binding(GO:0097108) |
| 0.5 | 0.9 | GO:0043120 | tumor necrosis factor binding(GO:0043120) |
| 0.5 | 37.3 | GO:0005080 | protein kinase C binding(GO:0005080) |
| 0.5 | 1.8 | GO:0046923 | ER retention sequence binding(GO:0046923) |
| 0.5 | 1.4 | GO:0008242 | omega peptidase activity(GO:0008242) |
| 0.5 | 1.8 | GO:0004092 | carnitine O-acetyltransferase activity(GO:0004092) |
| 0.5 | 2.7 | GO:0005344 | oxygen transporter activity(GO:0005344) |
| 0.4 | 4.9 | GO:0003796 | lysozyme activity(GO:0003796) |
| 0.4 | 1.8 | GO:0016708 | nitric oxide dioxygenase activity(GO:0008941) oxidoreductase activity, acting on paired donors, with incorporation or reduction of molecular oxygen, NAD(P)H as one donor, and incorporation of two atoms of oxygen into one donor(GO:0016708) iron-cytochrome-c reductase activity(GO:0047726) |
| 0.4 | 1.3 | GO:0019981 | interleukin-6 receptor activity(GO:0004915) interleukin-6 binding(GO:0019981) |
| 0.4 | 1.8 | GO:0019966 | interleukin-1 binding(GO:0019966) |
| 0.4 | 3.5 | GO:0047623 | AMP deaminase activity(GO:0003876) adenosine-phosphate deaminase activity(GO:0047623) |
| 0.4 | 2.6 | GO:0034597 | phosphatidylinositol-4,5-bisphosphate 4-phosphatase activity(GO:0034597) |
| 0.4 | 1.7 | GO:0038132 | neuregulin binding(GO:0038132) |
| 0.4 | 2.6 | GO:0004126 | cytidine deaminase activity(GO:0004126) |
| 0.4 | 3.9 | GO:0016594 | glycine binding(GO:0016594) |
| 0.4 | 21.8 | GO:0017112 | Rab guanyl-nucleotide exchange factor activity(GO:0017112) |
| 0.4 | 1.3 | GO:0003977 | UDP-N-acetylglucosamine diphosphorylase activity(GO:0003977) |
| 0.4 | 2.5 | GO:0031730 | CCR5 chemokine receptor binding(GO:0031730) |
| 0.4 | 1.2 | GO:0005280 | hydrogen:amino acid symporter activity(GO:0005280) L-tyrosine transmembrane transporter activity(GO:0005302) |
| 0.4 | 3.7 | GO:0030976 | thiamine pyrophosphate binding(GO:0030976) |
| 0.4 | 28.9 | GO:0005179 | hormone activity(GO:0005179) |
| 0.4 | 5.0 | GO:0033130 | acetylcholine receptor binding(GO:0033130) |
| 0.4 | 1.6 | GO:0047710 | bis(5'-adenosyl)-triphosphatase activity(GO:0047710) |
| 0.4 | 1.2 | GO:0098809 | nitrite reductase activity(GO:0098809) |
| 0.4 | 2.8 | GO:0004556 | alpha-amylase activity(GO:0004556) |
| 0.4 | 2.8 | GO:0001851 | complement component C3b binding(GO:0001851) |
| 0.4 | 0.8 | GO:0005223 | intracellular cGMP activated cation channel activity(GO:0005223) |
| 0.4 | 1.2 | GO:0031694 | alpha-2A adrenergic receptor binding(GO:0031694) |
| 0.4 | 4.8 | GO:0004551 | nucleotide diphosphatase activity(GO:0004551) |
| 0.4 | 1.6 | GO:0032422 | purine-rich negative regulatory element binding(GO:0032422) |
| 0.4 | 1.2 | GO:0035650 | AP-1 adaptor complex binding(GO:0035650) |
| 0.4 | 3.2 | GO:0008821 | crossover junction endodeoxyribonuclease activity(GO:0008821) |
| 0.4 | 1.2 | GO:0005021 | vascular endothelial growth factor-activated receptor activity(GO:0005021) |
| 0.4 | 7.9 | GO:0004697 | protein kinase C activity(GO:0004697) |
| 0.4 | 1.2 | GO:0004060 | arylamine N-acetyltransferase activity(GO:0004060) |
| 0.4 | 15.3 | GO:0005164 | tumor necrosis factor receptor binding(GO:0005164) |
| 0.4 | 1.6 | GO:0004667 | prostaglandin-D synthase activity(GO:0004667) |
| 0.4 | 8.2 | GO:0004653 | polypeptide N-acetylgalactosaminyltransferase activity(GO:0004653) |
| 0.4 | 14.7 | GO:0042169 | SH2 domain binding(GO:0042169) |
| 0.4 | 4.2 | GO:0008140 | cAMP response element binding protein binding(GO:0008140) |
| 0.4 | 2.7 | GO:0004332 | fructose-bisphosphate aldolase activity(GO:0004332) |
| 0.4 | 1.5 | GO:0004574 | oligo-1,6-glucosidase activity(GO:0004574) |
| 0.4 | 1.5 | GO:0047389 | glycerophosphocholine phosphodiesterase activity(GO:0047389) |
| 0.4 | 7.5 | GO:0017075 | syntaxin-1 binding(GO:0017075) |
| 0.4 | 1.5 | GO:0004966 | galanin receptor activity(GO:0004966) |
| 0.4 | 2.6 | GO:0086080 | protein binding involved in heterotypic cell-cell adhesion(GO:0086080) |
| 0.4 | 0.4 | GO:0018479 | benzaldehyde dehydrogenase (NAD+) activity(GO:0018479) |
| 0.4 | 3.2 | GO:0008519 | ammonium transmembrane transporter activity(GO:0008519) |
| 0.4 | 2.5 | GO:0031419 | cobalamin binding(GO:0031419) |
| 0.4 | 7.8 | GO:0017110 | nucleoside-diphosphatase activity(GO:0017110) |
| 0.4 | 6.3 | GO:0045504 | dynein heavy chain binding(GO:0045504) |
| 0.3 | 2.1 | GO:0097603 | temperature-gated ion channel activity(GO:0097603) |
| 0.3 | 0.7 | GO:0005333 | norepinephrine transmembrane transporter activity(GO:0005333) |
| 0.3 | 2.4 | GO:0016176 | superoxide-generating NADPH oxidase activator activity(GO:0016176) |
| 0.3 | 1.4 | GO:0004052 | arachidonate 12-lipoxygenase activity(GO:0004052) |
| 0.3 | 9.3 | GO:0016675 | oxidoreductase activity, acting on a heme group of donors(GO:0016675) |
| 0.3 | 1.0 | GO:0003696 | satellite DNA binding(GO:0003696) |
| 0.3 | 1.0 | GO:0047631 | ADP-ribose diphosphatase activity(GO:0047631) |
| 0.3 | 0.7 | GO:0015925 | galactosidase activity(GO:0015925) |
| 0.3 | 1.0 | GO:0004735 | pyrroline-5-carboxylate reductase activity(GO:0004735) |
| 0.3 | 7.4 | GO:0016864 | protein disulfide isomerase activity(GO:0003756) intramolecular oxidoreductase activity, transposing S-S bonds(GO:0016864) |
| 0.3 | 13.1 | GO:0050699 | WW domain binding(GO:0050699) |
| 0.3 | 1.3 | GO:0033142 | progesterone receptor binding(GO:0033142) |
| 0.3 | 6.7 | GO:0051787 | misfolded protein binding(GO:0051787) |
| 0.3 | 5.6 | GO:0070330 | aromatase activity(GO:0070330) |
| 0.3 | 1.6 | GO:0004505 | phenylalanine 4-monooxygenase activity(GO:0004505) |
| 0.3 | 1.9 | GO:0046790 | virion binding(GO:0046790) |
| 0.3 | 1.3 | GO:0004758 | serine C-palmitoyltransferase activity(GO:0004758) C-palmitoyltransferase activity(GO:0016454) |
| 0.3 | 0.6 | GO:0008428 | ribonuclease inhibitor activity(GO:0008428) |
| 0.3 | 2.2 | GO:0042289 | MHC class II protein binding(GO:0042289) |
| 0.3 | 0.9 | GO:0030116 | glial cell-derived neurotrophic factor receptor binding(GO:0030116) |
| 0.3 | 0.9 | GO:0033699 | DNA 5'-adenosine monophosphate hydrolase activity(GO:0033699) |
| 0.3 | 0.3 | GO:0004365 | glyceraldehyde-3-phosphate dehydrogenase (NAD+) (phosphorylating) activity(GO:0004365) glyceraldehyde-3-phosphate dehydrogenase (NAD(P)+) (phosphorylating) activity(GO:0043891) |
| 0.3 | 0.9 | GO:1990050 | phosphatidic acid transporter activity(GO:1990050) |
| 0.3 | 58.7 | GO:0008236 | serine-type peptidase activity(GO:0008236) |
| 0.3 | 1.8 | GO:0003828 | alpha-N-acetylneuraminate alpha-2,8-sialyltransferase activity(GO:0003828) |
| 0.3 | 1.2 | GO:0003938 | IMP dehydrogenase activity(GO:0003938) |
| 0.3 | 2.4 | GO:0050544 | icosanoid binding(GO:0050542) arachidonic acid binding(GO:0050544) fatty acid derivative binding(GO:1901567) |
| 0.3 | 1.2 | GO:0042806 | fucose binding(GO:0042806) |
| 0.3 | 4.2 | GO:0017154 | semaphorin receptor activity(GO:0017154) |
| 0.3 | 5.1 | GO:0001848 | complement binding(GO:0001848) |
| 0.3 | 1.2 | GO:0001642 | group III metabotropic glutamate receptor activity(GO:0001642) |
| 0.3 | 1.8 | GO:0016300 | tRNA (uracil) methyltransferase activity(GO:0016300) |
| 0.3 | 2.4 | GO:0047498 | calcium-dependent phospholipase A2 activity(GO:0047498) |
| 0.3 | 1.5 | GO:0030171 | voltage-gated proton channel activity(GO:0030171) |
| 0.3 | 5.6 | GO:0043325 | phosphatidylinositol-3,4-bisphosphate binding(GO:0043325) |
| 0.3 | 1.7 | GO:0070290 | N-acylphosphatidylethanolamine-specific phospholipase D activity(GO:0070290) |
| 0.3 | 6.4 | GO:0043014 | alpha-tubulin binding(GO:0043014) |
| 0.3 | 2.6 | GO:0050700 | CARD domain binding(GO:0050700) |
| 0.3 | 3.2 | GO:0048531 | beta-1,3-galactosyltransferase activity(GO:0048531) |
| 0.3 | 0.6 | GO:0031871 | proteinase activated receptor binding(GO:0031871) |
| 0.3 | 1.2 | GO:0005459 | UDP-galactose transmembrane transporter activity(GO:0005459) |
| 0.3 | 4.0 | GO:0031435 | mitogen-activated protein kinase kinase kinase binding(GO:0031435) |
| 0.3 | 1.4 | GO:0005222 | intracellular cAMP activated cation channel activity(GO:0005222) |
| 0.3 | 5.3 | GO:0004745 | retinol dehydrogenase activity(GO:0004745) |
| 0.3 | 0.8 | GO:0005171 | hepatocyte growth factor receptor binding(GO:0005171) |
| 0.3 | 1.1 | GO:0045131 | pre-mRNA branch point binding(GO:0045131) |
| 0.3 | 1.1 | GO:0016509 | long-chain-3-hydroxyacyl-CoA dehydrogenase activity(GO:0016509) |
| 0.3 | 1.1 | GO:0015410 | manganese-transporting ATPase activity(GO:0015410) |
| 0.3 | 0.8 | GO:0019002 | GMP binding(GO:0019002) |
| 0.3 | 1.6 | GO:0043560 | insulin receptor substrate binding(GO:0043560) |
| 0.3 | 1.4 | GO:0003945 | N-acetyllactosamine synthase activity(GO:0003945) |
| 0.3 | 3.8 | GO:0016857 | racemase and epimerase activity, acting on carbohydrates and derivatives(GO:0016857) |
| 0.3 | 5.7 | GO:0034237 | protein kinase A regulatory subunit binding(GO:0034237) |
| 0.3 | 14.6 | GO:0019003 | GDP binding(GO:0019003) |
| 0.3 | 0.5 | GO:0051425 | PTB domain binding(GO:0051425) |
| 0.3 | 3.8 | GO:0035925 | mRNA 3'-UTR AU-rich region binding(GO:0035925) |
| 0.3 | 17.1 | GO:0019894 | kinesin binding(GO:0019894) |
| 0.3 | 1.3 | GO:0003997 | acyl-CoA oxidase activity(GO:0003997) |
| 0.3 | 2.1 | GO:0035473 | lipase binding(GO:0035473) |
| 0.3 | 10.5 | GO:0030552 | cAMP binding(GO:0030552) |
| 0.3 | 1.6 | GO:0034056 | estrogen response element binding(GO:0034056) |
| 0.3 | 2.1 | GO:0005078 | MAP-kinase scaffold activity(GO:0005078) |
| 0.3 | 3.1 | GO:0102336 | fatty acid elongase activity(GO:0009922) 3-oxo-arachidoyl-CoA synthase activity(GO:0102336) 3-oxo-cerotoyl-CoA synthase activity(GO:0102337) 3-oxo-lignoceronyl-CoA synthase activity(GO:0102338) |
| 0.3 | 0.8 | GO:0008109 | N-acetyllactosaminide beta-1,6-N-acetylglucosaminyltransferase activity(GO:0008109) |
| 0.3 | 5.7 | GO:0070006 | metalloaminopeptidase activity(GO:0070006) |
| 0.3 | 0.8 | GO:0003941 | L-serine ammonia-lyase activity(GO:0003941) L-threonine ammonia-lyase activity(GO:0004794) |
| 0.3 | 2.6 | GO:0001730 | 2'-5'-oligoadenylate synthetase activity(GO:0001730) |
| 0.3 | 2.3 | GO:0004634 | phosphopyruvate hydratase activity(GO:0004634) |
| 0.3 | 0.5 | GO:0008241 | peptidyl-dipeptidase activity(GO:0008241) |
| 0.3 | 0.3 | GO:0043183 | vascular endothelial growth factor receptor 1 binding(GO:0043183) |
| 0.3 | 3.8 | GO:0098641 | cadherin binding involved in cell-cell adhesion(GO:0098641) |
| 0.3 | 0.5 | GO:0005143 | interleukin-12 receptor binding(GO:0005143) |
| 0.3 | 0.3 | GO:0046899 | nucleoside triphosphate adenylate kinase activity(GO:0046899) |
| 0.2 | 3.0 | GO:0005149 | interleukin-1 receptor binding(GO:0005149) |
| 0.2 | 2.7 | GO:0070412 | R-SMAD binding(GO:0070412) |
| 0.2 | 0.7 | GO:0004385 | guanylate kinase activity(GO:0004385) |
| 0.2 | 7.7 | GO:0005031 | tumor necrosis factor-activated receptor activity(GO:0005031) death receptor activity(GO:0005035) |
| 0.2 | 0.2 | GO:0030229 | very-low-density lipoprotein particle receptor activity(GO:0030229) |
| 0.2 | 1.5 | GO:0003923 | GPI-anchor transamidase activity(GO:0003923) |
| 0.2 | 1.5 | GO:0008321 | Ral guanyl-nucleotide exchange factor activity(GO:0008321) |
| 0.2 | 3.4 | GO:0022841 | potassium ion leak channel activity(GO:0022841) |
| 0.2 | 3.4 | GO:0008349 | MAP kinase kinase kinase kinase activity(GO:0008349) |
| 0.2 | 3.8 | GO:0004550 | nucleoside diphosphate kinase activity(GO:0004550) |
| 0.2 | 1.2 | GO:0030618 | transforming growth factor beta receptor, pathway-specific cytoplasmic mediator activity(GO:0030618) |
| 0.2 | 3.3 | GO:0008327 | methyl-CpG binding(GO:0008327) |
| 0.2 | 3.3 | GO:0050308 | sugar-phosphatase activity(GO:0050308) |
| 0.2 | 3.3 | GO:0031386 | protein tag(GO:0031386) |
| 0.2 | 6.1 | GO:0017046 | peptide hormone binding(GO:0017046) |
| 0.2 | 4.4 | GO:0070273 | phosphatidylinositol-4-phosphate binding(GO:0070273) |
| 0.2 | 1.6 | GO:0004468 | lysine N-acetyltransferase activity, acting on acetyl phosphate as donor(GO:0004468) |
| 0.2 | 1.4 | GO:1990829 | C-rich single-stranded DNA binding(GO:1990829) |
| 0.2 | 2.5 | GO:0035005 | 1-phosphatidylinositol-4-phosphate 3-kinase activity(GO:0035005) |
| 0.2 | 1.4 | GO:0046975 | histone methyltransferase activity (H3-K36 specific)(GO:0046975) |
| 0.2 | 1.8 | GO:0015349 | thyroid hormone transmembrane transporter activity(GO:0015349) |
| 0.2 | 0.9 | GO:0015018 | galactosylgalactosylxylosylprotein 3-beta-glucuronosyltransferase activity(GO:0015018) |
| 0.2 | 1.8 | GO:0003810 | protein-glutamine gamma-glutamyltransferase activity(GO:0003810) |
| 0.2 | 1.3 | GO:0048403 | brain-derived neurotrophic factor binding(GO:0048403) |
| 0.2 | 0.4 | GO:0004367 | glycerol-3-phosphate dehydrogenase [NAD+] activity(GO:0004367) |
| 0.2 | 2.4 | GO:0017176 | phosphatidylinositol N-acetylglucosaminyltransferase activity(GO:0017176) |
| 0.2 | 0.7 | GO:0061578 | Lys63-specific deubiquitinase activity(GO:0061578) |
| 0.2 | 1.1 | GO:0016361 | activin receptor activity, type I(GO:0016361) activin-activated receptor activity(GO:0017002) |
| 0.2 | 1.7 | GO:0019788 | NEDD8 transferase activity(GO:0019788) |
| 0.2 | 0.4 | GO:0005350 | purine nucleobase transmembrane transporter activity(GO:0005345) pyrimidine nucleobase transmembrane transporter activity(GO:0005350) nucleobase transmembrane transporter activity(GO:0015205) |
| 0.2 | 0.6 | GO:0001069 | regulatory region RNA binding(GO:0001069) |
| 0.2 | 0.9 | GO:0051377 | mannose-ethanolamine phosphotransferase activity(GO:0051377) |
| 0.2 | 4.4 | GO:0000030 | mannosyltransferase activity(GO:0000030) |
| 0.2 | 0.4 | GO:0004965 | G-protein coupled GABA receptor activity(GO:0004965) |
| 0.2 | 7.4 | GO:0005544 | calcium-dependent phospholipid binding(GO:0005544) |
| 0.2 | 1.2 | GO:0030172 | troponin C binding(GO:0030172) |
| 0.2 | 12.0 | GO:0048306 | calcium-dependent protein binding(GO:0048306) |
| 0.2 | 0.4 | GO:0008330 | protein tyrosine/threonine phosphatase activity(GO:0008330) |
| 0.2 | 0.6 | GO:0004946 | bombesin receptor activity(GO:0004946) |
| 0.2 | 3.8 | GO:0008510 | sodium:bicarbonate symporter activity(GO:0008510) |
| 0.2 | 0.8 | GO:0042284 | sphingolipid delta-4 desaturase activity(GO:0042284) |
| 0.2 | 3.2 | GO:0017128 | phospholipid scramblase activity(GO:0017128) |
| 0.2 | 1.0 | GO:0090599 | alpha-glucosidase activity(GO:0090599) |
| 0.2 | 0.6 | GO:0004793 | threonine aldolase activity(GO:0004793) L-allo-threonine aldolase activity(GO:0008732) |
| 0.2 | 1.4 | GO:1901702 | urate transmembrane transporter activity(GO:0015143) salt transmembrane transporter activity(GO:1901702) |
| 0.2 | 1.6 | GO:0005522 | profilin binding(GO:0005522) |
| 0.2 | 0.4 | GO:0032052 | bile acid binding(GO:0032052) |
| 0.2 | 0.8 | GO:0004045 | aminoacyl-tRNA hydrolase activity(GO:0004045) |
| 0.2 | 1.0 | GO:0042030 | ATPase inhibitor activity(GO:0042030) |
| 0.2 | 1.0 | GO:0001010 | transcription factor activity, sequence-specific DNA binding transcription factor recruiting(GO:0001010) |
| 0.2 | 7.4 | GO:0003785 | actin monomer binding(GO:0003785) |
| 0.2 | 0.8 | GO:0004814 | arginine-tRNA ligase activity(GO:0004814) |
| 0.2 | 1.1 | GO:0004645 | phosphorylase activity(GO:0004645) |
| 0.2 | 0.4 | GO:0031628 | opioid receptor binding(GO:0031628) |
| 0.2 | 4.1 | GO:0001968 | fibronectin binding(GO:0001968) |
| 0.2 | 0.7 | GO:0031996 | thioesterase binding(GO:0031996) |
| 0.2 | 1.5 | GO:0005123 | death receptor binding(GO:0005123) |
| 0.2 | 0.7 | GO:0016755 | transferase activity, transferring amino-acyl groups(GO:0016755) |
| 0.2 | 1.3 | GO:1901612 | phosphatidylglycerol binding(GO:1901611) cardiolipin binding(GO:1901612) |
| 0.2 | 0.9 | GO:0032296 | ribonuclease III activity(GO:0004525) double-stranded RNA-specific ribonuclease activity(GO:0032296) |
| 0.2 | 0.6 | GO:0030284 | estrogen receptor activity(GO:0030284) |
| 0.2 | 2.9 | GO:0035612 | AP-2 adaptor complex binding(GO:0035612) |
| 0.2 | 1.1 | GO:0004931 | extracellular ATP-gated cation channel activity(GO:0004931) ATP-gated ion channel activity(GO:0035381) |
| 0.2 | 0.7 | GO:0048763 | calcium-induced calcium release activity(GO:0048763) |
| 0.2 | 0.9 | GO:0047493 | sphingomyelin synthase activity(GO:0033188) ceramide cholinephosphotransferase activity(GO:0047493) |
| 0.2 | 0.9 | GO:0097001 | ceramide binding(GO:0097001) |
| 0.2 | 0.7 | GO:0016832 | aldehyde-lyase activity(GO:0016832) |
| 0.2 | 0.9 | GO:0004704 | NF-kappaB-inducing kinase activity(GO:0004704) |
| 0.2 | 4.0 | GO:0016701 | oxidoreductase activity, acting on single donors with incorporation of molecular oxygen(GO:0016701) |
| 0.2 | 6.1 | GO:0005484 | SNAP receptor activity(GO:0005484) |
| 0.2 | 1.0 | GO:0005041 | low-density lipoprotein receptor activity(GO:0005041) |
| 0.2 | 0.3 | GO:0004859 | phospholipase inhibitor activity(GO:0004859) |
| 0.2 | 1.2 | GO:0035033 | histone deacetylase regulator activity(GO:0035033) |
| 0.2 | 3.4 | GO:0031683 | G-protein beta/gamma-subunit complex binding(GO:0031683) |
| 0.2 | 2.4 | GO:0015125 | bile acid transmembrane transporter activity(GO:0015125) |
| 0.2 | 0.7 | GO:0001639 | PLC activating G-protein coupled glutamate receptor activity(GO:0001639) G-protein coupled receptor activity involved in regulation of postsynaptic membrane potential(GO:0099530) |
| 0.2 | 19.6 | GO:0005089 | Rho guanyl-nucleotide exchange factor activity(GO:0005089) |
| 0.2 | 2.1 | GO:0004993 | G-protein coupled serotonin receptor activity(GO:0004993) |
| 0.2 | 1.5 | GO:0042301 | phosphate ion binding(GO:0042301) |
| 0.2 | 0.5 | GO:0001888 | glucuronyl-galactosyl-proteoglycan 4-alpha-N-acetylglucosaminyltransferase activity(GO:0001888) |
| 0.2 | 0.8 | GO:0000832 | inositol hexakisphosphate kinase activity(GO:0000828) inositol hexakisphosphate 5-kinase activity(GO:0000832) inositol hexakisphosphate 1-kinase activity(GO:0052723) inositol hexakisphosphate 3-kinase activity(GO:0052724) |
| 0.2 | 0.6 | GO:0016833 | oxo-acid-lyase activity(GO:0016833) |
| 0.2 | 0.6 | GO:0050833 | pyruvate transmembrane transporter activity(GO:0050833) |
| 0.2 | 0.6 | GO:0004430 | 1-phosphatidylinositol 4-kinase activity(GO:0004430) |
| 0.2 | 1.3 | GO:0022829 | wide pore channel activity(GO:0022829) |
| 0.2 | 0.6 | GO:0004694 | eukaryotic translation initiation factor 2alpha kinase activity(GO:0004694) |
| 0.2 | 2.7 | GO:0071889 | 14-3-3 protein binding(GO:0071889) |
| 0.2 | 3.5 | GO:0046965 | retinoid X receptor binding(GO:0046965) |
| 0.2 | 0.6 | GO:0003883 | CTP synthase activity(GO:0003883) |
| 0.2 | 0.5 | GO:0050510 | N-acetylgalactosaminyl-proteoglycan 3-beta-glucuronosyltransferase activity(GO:0050510) |
| 0.2 | 2.5 | GO:0030275 | LRR domain binding(GO:0030275) |
| 0.2 | 1.2 | GO:0019855 | calcium channel inhibitor activity(GO:0019855) |
| 0.2 | 0.8 | GO:0005095 | GTPase inhibitor activity(GO:0005095) |
| 0.2 | 0.8 | GO:0043423 | 3-phosphoinositide-dependent protein kinase binding(GO:0043423) |
| 0.2 | 6.4 | GO:0030507 | spectrin binding(GO:0030507) |
| 0.2 | 2.9 | GO:0005521 | lamin binding(GO:0005521) |
| 0.2 | 1.8 | GO:0017166 | vinculin binding(GO:0017166) |
| 0.2 | 0.5 | GO:0030350 | iron-responsive element binding(GO:0030350) |
| 0.1 | 2.1 | GO:0001784 | phosphotyrosine binding(GO:0001784) |
| 0.1 | 0.6 | GO:0004706 | JUN kinase kinase kinase activity(GO:0004706) |
| 0.1 | 0.4 | GO:0004677 | DNA-dependent protein kinase activity(GO:0004677) |
| 0.1 | 0.9 | GO:1990715 | mRNA CDS binding(GO:1990715) |
| 0.1 | 1.1 | GO:1990380 | Lys48-specific deubiquitinase activity(GO:1990380) |
| 0.1 | 2.0 | GO:0017049 | GTP-Rho binding(GO:0017049) |
| 0.1 | 4.1 | GO:0030145 | manganese ion binding(GO:0030145) |
| 0.1 | 2.1 | GO:1904264 | ubiquitin protein ligase activity involved in ERAD pathway(GO:1904264) |
| 0.1 | 0.4 | GO:0016854 | racemase and epimerase activity(GO:0016854) |
| 0.1 | 0.4 | GO:0019779 | Atg12 activating enzyme activity(GO:0019778) Atg8 activating enzyme activity(GO:0019779) |
| 0.1 | 2.4 | GO:0097493 | structural molecule activity conferring elasticity(GO:0097493) |
| 0.1 | 0.8 | GO:0016307 | phosphatidylinositol phosphate kinase activity(GO:0016307) |
| 0.1 | 1.0 | GO:0004920 | interleukin-10 receptor activity(GO:0004920) |
| 0.1 | 3.5 | GO:0019707 | protein-cysteine S-palmitoyltransferase activity(GO:0019706) protein-cysteine S-acyltransferase activity(GO:0019707) |
| 0.1 | 3.2 | GO:0051879 | Hsp90 protein binding(GO:0051879) |
| 0.1 | 0.4 | GO:0035575 | histone demethylase activity (H4-K20 specific)(GO:0035575) |
| 0.1 | 2.2 | GO:0008553 | hydrogen-exporting ATPase activity, phosphorylative mechanism(GO:0008553) |
| 0.1 | 2.3 | GO:0004708 | MAP kinase kinase activity(GO:0004708) |
| 0.1 | 3.1 | GO:0048487 | beta-tubulin binding(GO:0048487) |
| 0.1 | 0.5 | GO:0035497 | cAMP response element binding(GO:0035497) |
| 0.1 | 0.6 | GO:0046935 | 1-phosphatidylinositol-3-kinase regulator activity(GO:0046935) |
| 0.1 | 0.6 | GO:0015165 | pyrimidine nucleotide-sugar transmembrane transporter activity(GO:0015165) |
| 0.1 | 0.8 | GO:0004969 | histamine receptor activity(GO:0004969) |
| 0.1 | 0.5 | GO:0050649 | testosterone 6-beta-hydroxylase activity(GO:0050649) |
| 0.1 | 0.4 | GO:0050051 | alkane 1-monooxygenase activity(GO:0018685) leukotriene-B4 20-monooxygenase activity(GO:0050051) |
| 0.1 | 1.3 | GO:0004806 | triglyceride lipase activity(GO:0004806) |
| 0.1 | 0.5 | GO:0004937 | alpha1-adrenergic receptor activity(GO:0004937) |
| 0.1 | 0.3 | GO:0016262 | protein N-acetylglucosaminyltransferase activity(GO:0016262) |
| 0.1 | 0.5 | GO:0050436 | microfibril binding(GO:0050436) |
| 0.1 | 1.7 | GO:0001103 | RNA polymerase II repressing transcription factor binding(GO:0001103) |
| 0.1 | 1.4 | GO:0070403 | NAD+ binding(GO:0070403) |
| 0.1 | 0.7 | GO:0004791 | thioredoxin-disulfide reductase activity(GO:0004791) |
| 0.1 | 0.8 | GO:0004865 | protein serine/threonine phosphatase inhibitor activity(GO:0004865) |
| 0.1 | 7.5 | GO:0004984 | olfactory receptor activity(GO:0004984) |
| 0.1 | 0.4 | GO:0071723 | lipopeptide binding(GO:0071723) |
| 0.1 | 0.9 | GO:0071535 | RING-like zinc finger domain binding(GO:0071535) |
| 0.1 | 1.6 | GO:0008484 | sulfuric ester hydrolase activity(GO:0008484) |
| 0.1 | 0.2 | GO:0048019 | receptor antagonist activity(GO:0048019) |
| 0.1 | 48.7 | GO:0050839 | cell adhesion molecule binding(GO:0050839) |
| 0.1 | 0.7 | GO:0016812 | hydrolase activity, acting on carbon-nitrogen (but not peptide) bonds, in cyclic amides(GO:0016812) |
| 0.1 | 0.4 | GO:0015232 | heme transporter activity(GO:0015232) |
| 0.1 | 21.5 | GO:0044822 | mRNA binding(GO:0003729) poly(A) RNA binding(GO:0044822) |
| 0.1 | 1.5 | GO:0016493 | C-C chemokine receptor activity(GO:0016493) |
| 0.1 | 0.5 | GO:0031849 | olfactory receptor binding(GO:0031849) |
| 0.1 | 0.4 | GO:0022851 | GABA-gated chloride ion channel activity(GO:0022851) |
| 0.1 | 0.3 | GO:0035614 | snRNA stem-loop binding(GO:0035614) |
| 0.1 | 1.3 | GO:0047372 | acylglycerol lipase activity(GO:0047372) |
| 0.1 | 1.1 | GO:0008143 | poly(A) binding(GO:0008143) |
| 0.1 | 1.6 | GO:0032183 | SUMO binding(GO:0032183) |
| 0.1 | 0.5 | GO:0031543 | peptidyl-proline dioxygenase activity(GO:0031543) |
| 0.1 | 0.9 | GO:0000983 | transcription factor activity, RNA polymerase II core promoter sequence-specific(GO:0000983) |
| 0.1 | 0.6 | GO:0098821 | BMP receptor activity(GO:0098821) |
| 0.1 | 0.4 | GO:0052794 | exo-alpha-sialidase activity(GO:0004308) alpha-sialidase activity(GO:0016997) exo-alpha-(2->3)-sialidase activity(GO:0052794) exo-alpha-(2->6)-sialidase activity(GO:0052795) exo-alpha-(2->8)-sialidase activity(GO:0052796) |
| 0.1 | 0.9 | GO:0051525 | NFAT protein binding(GO:0051525) |
| 0.1 | 1.1 | GO:0023026 | MHC class II protein complex binding(GO:0023026) |
| 0.1 | 9.6 | GO:0017124 | SH3 domain binding(GO:0017124) |
| 0.1 | 0.5 | GO:0000150 | recombinase activity(GO:0000150) |
| 0.1 | 9.5 | GO:0000979 | RNA polymerase II core promoter sequence-specific DNA binding(GO:0000979) |
| 0.1 | 0.5 | GO:0016934 | extracellular-glycine-gated ion channel activity(GO:0016933) extracellular-glycine-gated chloride channel activity(GO:0016934) |
| 0.1 | 4.4 | GO:0004869 | cysteine-type endopeptidase inhibitor activity(GO:0004869) |
| 0.1 | 2.0 | GO:0015020 | glucuronosyltransferase activity(GO:0015020) |
| 0.1 | 0.4 | GO:0017162 | aryl hydrocarbon receptor binding(GO:0017162) |
| 0.1 | 2.0 | GO:0008373 | sialyltransferase activity(GO:0008373) |
| 0.1 | 0.3 | GO:2001069 | glycogen binding(GO:2001069) |
| 0.1 | 0.3 | GO:1904121 | propanoyl-CoA C-acyltransferase activity(GO:0033814) propionyl-CoA C2-trimethyltridecanoyltransferase activity(GO:0050632) phosphatidylethanolamine transporter activity(GO:1904121) |
| 0.1 | 2.3 | GO:0008157 | protein phosphatase 1 binding(GO:0008157) |
| 0.1 | 0.9 | GO:0015662 | ATPase activity, coupled to transmembrane movement of ions, phosphorylative mechanism(GO:0015662) |
| 0.1 | 0.4 | GO:0080019 | fatty-acyl-CoA reductase (alcohol-forming) activity(GO:0080019) |
| 0.1 | 0.7 | GO:0015187 | glycine transmembrane transporter activity(GO:0015187) |
| 0.1 | 0.4 | GO:0008641 | small protein activating enzyme activity(GO:0008641) |
| 0.1 | 0.4 | GO:0004142 | diacylglycerol cholinephosphotransferase activity(GO:0004142) |
| 0.1 | 1.4 | GO:0015095 | magnesium ion transmembrane transporter activity(GO:0015095) |
| 0.1 | 0.3 | GO:0008502 | melatonin receptor activity(GO:0008502) |
| 0.1 | 3.2 | GO:0051959 | dynein light intermediate chain binding(GO:0051959) |
| 0.1 | 0.8 | GO:0031432 | titin binding(GO:0031432) |
| 0.1 | 0.3 | GO:0045322 | unmethylated CpG binding(GO:0045322) |
| 0.1 | 0.6 | GO:0008454 | alpha-1,3-mannosylglycoprotein 4-beta-N-acetylglucosaminyltransferase activity(GO:0008454) |
| 0.1 | 2.0 | GO:0051019 | mitogen-activated protein kinase binding(GO:0051019) |
| 0.1 | 0.1 | GO:0016713 | oxidoreductase activity, acting on paired donors, with incorporation or reduction of molecular oxygen, reduced iron-sulfur protein as one donor, and incorporation of one atom of oxygen(GO:0016713) |
| 0.1 | 0.3 | GO:0004970 | ionotropic glutamate receptor activity(GO:0004970) |
| 0.1 | 0.3 | GO:0004103 | choline kinase activity(GO:0004103) |
| 0.1 | 0.4 | GO:0019784 | NEDD8-specific protease activity(GO:0019784) |
| 0.1 | 0.2 | GO:0072345 | NAADP-sensitive calcium-release channel activity(GO:0072345) |
| 0.1 | 0.6 | GO:0030368 | interleukin-17 receptor activity(GO:0030368) |
| 0.1 | 0.1 | GO:0031531 | thyrotropin-releasing hormone receptor binding(GO:0031531) |
| 0.1 | 0.3 | GO:0089720 | caspase binding(GO:0089720) |
| 0.1 | 0.5 | GO:0015016 | [heparan sulfate]-glucosamine N-sulfotransferase activity(GO:0015016) |
| 0.1 | 0.2 | GO:0097506 | uracil DNA N-glycosylase activity(GO:0004844) deaminated base DNA N-glycosylase activity(GO:0097506) |
| 0.1 | 0.3 | GO:0042979 | ornithine decarboxylase regulator activity(GO:0042979) |
| 0.1 | 0.3 | GO:1990381 | ubiquitin-specific protease binding(GO:1990381) |
| 0.1 | 0.2 | GO:0001716 | L-amino-acid oxidase activity(GO:0001716) |
| 0.1 | 0.5 | GO:0009374 | biotin binding(GO:0009374) |
| 0.1 | 0.5 | GO:0045028 | G-protein coupled nucleotide receptor activity(GO:0001608) G-protein coupled purinergic nucleotide receptor activity(GO:0045028) |
| 0.1 | 0.6 | GO:0004707 | MAP kinase activity(GO:0004707) |
| 0.1 | 0.3 | GO:0004345 | glucose-6-phosphate dehydrogenase activity(GO:0004345) |
| 0.1 | 1.9 | GO:0030276 | clathrin binding(GO:0030276) |
| 0.1 | 2.4 | GO:0004715 | non-membrane spanning protein tyrosine kinase activity(GO:0004715) |
| 0.1 | 0.2 | GO:0086007 | voltage-gated calcium channel activity involved in cardiac muscle cell action potential(GO:0086007) |
| 0.1 | 1.0 | GO:0016709 | oxidoreductase activity, acting on paired donors, with incorporation or reduction of molecular oxygen, NAD(P)H as one donor, and incorporation of one atom of oxygen(GO:0016709) |
| 0.1 | 0.5 | GO:0070567 | cytidylyltransferase activity(GO:0070567) |
| 0.1 | 0.9 | GO:0004596 | peptide alpha-N-acetyltransferase activity(GO:0004596) |
| 0.1 | 0.5 | GO:0032454 | histone demethylase activity (H3-K9 specific)(GO:0032454) |
| 0.1 | 0.4 | GO:0003847 | 1-alkyl-2-acetylglycerophosphocholine esterase activity(GO:0003847) |
| 0.1 | 0.3 | GO:0004342 | glucosamine-6-phosphate deaminase activity(GO:0004342) |
| 0.1 | 0.7 | GO:0038191 | neuropilin binding(GO:0038191) |
| 0.1 | 0.3 | GO:0045505 | dynein intermediate chain binding(GO:0045505) |
| 0.1 | 0.3 | GO:0016936 | galactoside binding(GO:0016936) |
| 0.1 | 0.2 | GO:0016898 | D-lactate dehydrogenase (cytochrome) activity(GO:0004458) oxidoreductase activity, acting on the CH-OH group of donors, cytochrome as acceptor(GO:0016898) |
| 0.1 | 0.2 | GO:0031699 | beta-3 adrenergic receptor binding(GO:0031699) |
| 0.1 | 0.2 | GO:0004947 | bradykinin receptor activity(GO:0004947) |
| 0.1 | 0.6 | GO:0005247 | voltage-gated chloride channel activity(GO:0005247) |
| 0.1 | 25.8 | GO:0001228 | transcriptional activator activity, RNA polymerase II transcription regulatory region sequence-specific binding(GO:0001228) |
| 0.1 | 0.3 | GO:0035374 | chondroitin sulfate binding(GO:0035374) |
| 0.1 | 0.5 | GO:0015279 | store-operated calcium channel activity(GO:0015279) |
| 0.1 | 5.0 | GO:0019902 | phosphatase binding(GO:0019902) |
| 0.1 | 0.2 | GO:0045545 | syndecan binding(GO:0045545) |
| 0.1 | 2.2 | GO:0015485 | cholesterol binding(GO:0015485) |
| 0.0 | 0.5 | GO:0031434 | mitogen-activated protein kinase kinase binding(GO:0031434) |
| 0.0 | 0.4 | GO:1990226 | histone methyltransferase binding(GO:1990226) |
| 0.0 | 1.1 | GO:0005487 | nucleocytoplasmic transporter activity(GO:0005487) |
| 0.0 | 0.2 | GO:0005166 | neurotrophin p75 receptor binding(GO:0005166) |
| 0.0 | 0.2 | GO:0047134 | protein-disulfide reductase activity(GO:0047134) |
| 0.0 | 0.5 | GO:0050750 | low-density lipoprotein particle receptor binding(GO:0050750) |
| 0.0 | 0.4 | GO:0042562 | hormone binding(GO:0042562) |
| 0.0 | 0.1 | GO:0019871 | sodium channel inhibitor activity(GO:0019871) |
| 0.0 | 0.2 | GO:0097003 | adiponectin binding(GO:0055100) adipokinetic hormone receptor activity(GO:0097003) |
| 0.0 | 0.2 | GO:0008823 | cupric reductase activity(GO:0008823) ferric-chelate reductase (NADPH) activity(GO:0052851) |
| 0.0 | 0.6 | GO:0004000 | adenosine deaminase activity(GO:0004000) |
| 0.0 | 0.4 | GO:0051864 | histone demethylase activity (H3-K36 specific)(GO:0051864) |
| 0.0 | 0.3 | GO:0017127 | sterol transporter activity(GO:0015248) cholesterol transporter activity(GO:0017127) |
| 0.0 | 6.5 | GO:0003714 | transcription corepressor activity(GO:0003714) |
| 0.0 | 1.8 | GO:0008138 | protein tyrosine/serine/threonine phosphatase activity(GO:0008138) |
| 0.0 | 0.5 | GO:0051018 | protein kinase A binding(GO:0051018) |
| 0.0 | 0.1 | GO:0008534 | oxidized purine nucleobase lesion DNA N-glycosylase activity(GO:0008534) |
| 0.0 | 0.1 | GO:0017151 | DEAD/H-box RNA helicase binding(GO:0017151) |
| 0.0 | 1.6 | GO:0004693 | cyclin-dependent protein serine/threonine kinase activity(GO:0004693) |
| 0.0 | 0.2 | GO:0070739 | protein-glutamic acid ligase activity(GO:0070739) |
| 0.0 | 0.3 | GO:0003964 | telomerase activity(GO:0003720) RNA-directed DNA polymerase activity(GO:0003964) |
| 0.0 | 0.3 | GO:0016918 | retinal binding(GO:0016918) |
| 0.0 | 0.2 | GO:0005025 | transforming growth factor beta receptor activity, type I(GO:0005025) |
| 0.0 | 0.1 | GO:0035197 | siRNA binding(GO:0035197) |
| 0.0 | 0.3 | GO:0001594 | trace-amine receptor activity(GO:0001594) |
| 0.0 | 0.1 | GO:0090554 | phosphatidylcholine-translocating ATPase activity(GO:0090554) |
| 0.0 | 0.1 | GO:0090079 | translation regulator activity, nucleic acid binding(GO:0090079) |
| 0.0 | 0.5 | GO:0042605 | peptide antigen binding(GO:0042605) |
| 0.0 | 0.3 | GO:0042166 | acetylcholine binding(GO:0042166) |
| 0.0 | 0.3 | GO:0015347 | sodium-independent organic anion transmembrane transporter activity(GO:0015347) |
| 0.0 | 0.1 | GO:0070137 | ubiquitin-like protein-specific endopeptidase activity(GO:0070137) SUMO-specific endopeptidase activity(GO:0070139) |
| 0.0 | 0.1 | GO:0046030 | inositol-polyphosphate 5-phosphatase activity(GO:0004445) inositol trisphosphate phosphatase activity(GO:0046030) |
| 0.0 | 0.1 | GO:0016801 | hydrolase activity, acting on ether bonds(GO:0016801) |
| 0.0 | 0.1 | GO:0051185 | coenzyme transporter activity(GO:0051185) |
| 0.0 | 1.2 | GO:0031490 | chromatin DNA binding(GO:0031490) |
| 0.0 | 0.4 | GO:0017160 | Ral GTPase binding(GO:0017160) |
| 0.0 | 0.6 | GO:0004114 | 3',5'-cyclic-nucleotide phosphodiesterase activity(GO:0004114) |
| 0.0 | 0.4 | GO:0031491 | nucleosome binding(GO:0031491) |
| 0.0 | 0.1 | GO:0061629 | RNA polymerase II sequence-specific DNA binding transcription factor binding(GO:0061629) |
| 0.0 | 0.1 | GO:0097157 | pre-mRNA intronic binding(GO:0097157) |
| 0.0 | 1.1 | GO:0035064 | methylated histone binding(GO:0035064) |
| 0.0 | 1.7 | GO:0004222 | metalloendopeptidase activity(GO:0004222) |
| 0.0 | 0.3 | GO:0005528 | macrolide binding(GO:0005527) FK506 binding(GO:0005528) |
| 0.0 | 0.1 | GO:0032554 | purine deoxyribonucleotide binding(GO:0032554) |
| 0.0 | 0.1 | GO:0008568 | microtubule-severing ATPase activity(GO:0008568) |
| 0.0 | 0.2 | GO:0004602 | glutathione peroxidase activity(GO:0004602) |
| 0.0 | 0.5 | GO:1902936 | phosphatidylinositol bisphosphate binding(GO:1902936) |
| 0.0 | 0.0 | GO:0016972 | flavin-linked sulfhydryl oxidase activity(GO:0016971) thiol oxidase activity(GO:0016972) |
| 0.0 | 0.1 | GO:0004983 | neuropeptide Y receptor activity(GO:0004983) |
| 0.0 | 0.4 | GO:1900750 | glutathione binding(GO:0043295) oligopeptide binding(GO:1900750) |
| 0.0 | 0.2 | GO:0043425 | bHLH transcription factor binding(GO:0043425) |
| 0.0 | 0.1 | GO:0005093 | Rab GDP-dissociation inhibitor activity(GO:0005093) |
| 0.0 | 0.2 | GO:0016922 | ligand-dependent nuclear receptor binding(GO:0016922) |
| 0.0 | 0.1 | GO:0016421 | CoA carboxylase activity(GO:0016421) |
| 0.0 | 0.1 | GO:0004416 | hydroxyacylglutathione hydrolase activity(GO:0004416) |
| 0.0 | 0.1 | GO:0004985 | opioid receptor activity(GO:0004985) |
| 0.0 | 0.0 | GO:0061505 | DNA topoisomerase type II (ATP-hydrolyzing) activity(GO:0003918) DNA topoisomerase II activity(GO:0061505) |
| 0.0 | 0.0 | GO:0015168 | glycerol transmembrane transporter activity(GO:0015168) glycerol channel activity(GO:0015254) |
| 0.0 | 0.1 | GO:0008381 | mechanically-gated ion channel activity(GO:0008381) mechanically gated channel activity(GO:0022833) |
| 0.0 | 0.1 | GO:0046703 | natural killer cell lectin-like receptor binding(GO:0046703) |
| 0.0 | 0.1 | GO:0016929 | SUMO-specific protease activity(GO:0016929) |
| 0.0 | 0.1 | GO:0016805 | dipeptidase activity(GO:0016805) |
| 0.0 | 0.4 | GO:0001046 | core promoter sequence-specific DNA binding(GO:0001046) |
Gene overrepresentation in curated gene sets: canonical pathways category:
| Log-likelihood per target | Total log-likelihood | Term | Description |
|---|---|---|---|
| 1.0 | 3.0 | PID TXA2PATHWAY | Thromboxane A2 receptor signaling |
| 0.9 | 69.1 | PID AJDISS 2PATHWAY | Posttranslational regulation of adherens junction stability and dissassembly |
| 0.6 | 7.9 | PID INTEGRIN4 PATHWAY | Alpha6 beta4 integrin-ligand interactions |
| 0.5 | 17.5 | PID INTEGRIN CS PATHWAY | Integrin family cell surface interactions |
| 0.5 | 3.8 | PID HIF1A PATHWAY | Hypoxic and oxygen homeostasis regulation of HIF-1-alpha |
| 0.5 | 24.3 | PID IL3 PATHWAY | IL3-mediated signaling events |
| 0.5 | 7.5 | ST INTERLEUKIN 4 PATHWAY | Interleukin 4 (IL-4) Pathway |
| 0.5 | 10.1 | PID ECADHERIN KERATINOCYTE PATHWAY | E-cadherin signaling in keratinocytes |
| 0.5 | 0.9 | SIG IL4RECEPTOR IN B LYPHOCYTES | Genes related to IL4 rceptor signaling in B lymphocytes |
| 0.4 | 15.1 | PID P38 ALPHA BETA PATHWAY | Regulation of p38-alpha and p38-beta |
| 0.4 | 6.9 | ST GA12 PATHWAY | G alpha 12 Pathway |
| 0.4 | 6.3 | PID EPO PATHWAY | EPO signaling pathway |
| 0.4 | 4.1 | SIG INSULIN RECEPTOR PATHWAY IN CARDIAC MYOCYTES | Genes related to the insulin receptor pathway |
| 0.4 | 8.6 | ST G ALPHA S PATHWAY | G alpha s Pathway |
| 0.4 | 8.2 | PID NECTIN PATHWAY | Nectin adhesion pathway |
| 0.3 | 4.2 | PID VEGF VEGFR PATHWAY | VEGF and VEGFR signaling network |
| 0.3 | 5.4 | PID ERBB NETWORK PATHWAY | ErbB receptor signaling network |
| 0.3 | 8.2 | PID NEPHRIN NEPH1 PATHWAY | Nephrin/Neph1 signaling in the kidney podocyte |
| 0.3 | 15.5 | PID IL6 7 PATHWAY | IL6-mediated signaling events |
| 0.3 | 0.6 | ST IL 13 PATHWAY | Interleukin 13 (IL-13) Pathway |
| 0.3 | 6.1 | PID BCR 5PATHWAY | BCR signaling pathway |
| 0.3 | 2.9 | SA G2 AND M PHASES | Cdc25 activates the cdc2/cyclin B complex to induce the G2/M transition. |
| 0.3 | 6.9 | PID NCADHERIN PATHWAY | N-cadherin signaling events |
| 0.3 | 2.2 | PID S1P S1P4 PATHWAY | S1P4 pathway |
| 0.3 | 1.5 | PID IL27 PATHWAY | IL27-mediated signaling events |
| 0.3 | 6.2 | PID P38 MKK3 6PATHWAY | p38 MAPK signaling pathway |
| 0.3 | 13.5 | PID ERBB4 PATHWAY | ErbB4 signaling events |
| 0.3 | 8.1 | PID RHODOPSIN PATHWAY | Visual signal transduction: Rods |
| 0.3 | 5.9 | PID A6B1 A6B4 INTEGRIN PATHWAY | a6b1 and a6b4 Integrin signaling |
| 0.3 | 2.5 | PID TCR RAS PATHWAY | Ras signaling in the CD4+ TCR pathway |
| 0.3 | 2.2 | SIG CD40PATHWAYMAP | Genes related to CD40 signaling |
| 0.3 | 0.8 | ST PHOSPHOINOSITIDE 3 KINASE PATHWAY | PI3K Pathway |
| 0.2 | 12.4 | PID RXR VDR PATHWAY | RXR and RAR heterodimerization with other nuclear receptor |
| 0.2 | 5.1 | PID IL2 1PATHWAY | IL2-mediated signaling events |
| 0.2 | 2.9 | SA MMP CYTOKINE CONNECTION | Cytokines can induce activation of matrix metalloproteinases, which degrade extracellular matrix. |
| 0.2 | 4.5 | PID IL23 PATHWAY | IL23-mediated signaling events |
| 0.2 | 12.6 | PID LYSOPHOSPHOLIPID PATHWAY | LPA receptor mediated events |
| 0.2 | 9.6 | PID PI3KCI PATHWAY | Class I PI3K signaling events |
| 0.2 | 5.6 | SIG BCR SIGNALING PATHWAY | Members of the BCR signaling pathway |
| 0.2 | 4.2 | PID IL12 STAT4 PATHWAY | IL12 signaling mediated by STAT4 |
| 0.2 | 2.7 | PID MAPK TRK PATHWAY | Trk receptor signaling mediated by the MAPK pathway |
| 0.2 | 1.0 | ST GRANULE CELL SURVIVAL PATHWAY | Granule Cell Survival Pathway is a specific case of more general PAC1 Receptor Pathway. |
| 0.2 | 1.2 | PID AVB3 INTEGRIN PATHWAY | Integrins in angiogenesis |
| 0.2 | 4.5 | PID ECADHERIN NASCENT AJ PATHWAY | E-cadherin signaling in the nascent adherens junction |
| 0.2 | 5.7 | PID IL1 PATHWAY | IL1-mediated signaling events |
| 0.2 | 4.7 | PID IL12 2PATHWAY | IL12-mediated signaling events |
| 0.2 | 5.7 | PID LIS1 PATHWAY | Lissencephaly gene (LIS1) in neuronal migration and development |
| 0.2 | 1.6 | SA FAS SIGNALING | The TNF-type receptor Fas induces apoptosis on ligand binding. |
| 0.2 | 8.1 | PID ERA GENOMIC PATHWAY | Validated nuclear estrogen receptor alpha network |
| 0.2 | 7.7 | PID FGF PATHWAY | FGF signaling pathway |
| 0.2 | 9.0 | PID HNF3A PATHWAY | FOXA1 transcription factor network |
| 0.2 | 2.7 | PID FCER1 PATHWAY | Fc-epsilon receptor I signaling in mast cells |
| 0.2 | 6.0 | PID MET PATHWAY | Signaling events mediated by Hepatocyte Growth Factor Receptor (c-Met) |
| 0.2 | 1.5 | PID INTEGRIN A9B1 PATHWAY | Alpha9 beta1 integrin signaling events |
| 0.2 | 0.9 | PID PDGFRA PATHWAY | PDGFR-alpha signaling pathway |
| 0.1 | 3.5 | PID HDAC CLASSIII PATHWAY | Signaling events mediated by HDAC Class III |
| 0.1 | 2.6 | PID DNA PK PATHWAY | DNA-PK pathway in nonhomologous end joining |
| 0.1 | 6.2 | PID REG GR PATHWAY | Glucocorticoid receptor regulatory network |
| 0.1 | 1.2 | PID VEGFR1 2 PATHWAY | Signaling events mediated by VEGFR1 and VEGFR2 |
| 0.1 | 5.5 | NABA PROTEOGLYCANS | Genes encoding proteoglycans |
| 0.1 | 0.8 | PID CXCR4 PATHWAY | CXCR4-mediated signaling events |
| 0.1 | 4.6 | PID CERAMIDE PATHWAY | Ceramide signaling pathway |
| 0.1 | 1.2 | PID SYNDECAN 2 PATHWAY | Syndecan-2-mediated signaling events |
| 0.1 | 2.8 | PID ARF 3PATHWAY | Arf1 pathway |
| 0.1 | 1.0 | PID BETA CATENIN DEG PATHWAY | Degradation of beta catenin |
| 0.1 | 2.4 | PID UPA UPAR PATHWAY | Urokinase-type plasminogen activator (uPA) and uPAR-mediated signaling |
| 0.1 | 0.4 | PID TCR JNK PATHWAY | JNK signaling in the CD4+ TCR pathway |
| 0.1 | 24.9 | NABA ECM REGULATORS | Genes encoding enzymes and their regulators involved in the remodeling of the extracellular matrix |
| 0.1 | 1.3 | ST TUMOR NECROSIS FACTOR PATHWAY | Tumor Necrosis Factor Pathway. |
| 0.1 | 1.6 | PID NOTCH PATHWAY | Notch signaling pathway |
| 0.1 | 0.6 | SA CASPASE CASCADE | Apoptosis is mediated by caspases, cysteine proteases arranged in a proteolytic cascade. |
| 0.1 | 2.0 | PID IL2 STAT5 PATHWAY | IL2 signaling events mediated by STAT5 |
| 0.1 | 2.5 | PID HEDGEHOG GLI PATHWAY | Hedgehog signaling events mediated by Gli proteins |
| 0.1 | 3.0 | PID ENDOTHELIN PATHWAY | Endothelins |
| 0.1 | 1.3 | PID CIRCADIAN PATHWAY | Circadian rhythm pathway |
| 0.1 | 5.9 | PID RAC1 REG PATHWAY | Regulation of RAC1 activity |
| 0.1 | 0.8 | ST DIFFERENTIATION PATHWAY IN PC12 CELLS | Differentiation Pathway in PC12 Cells; this is a specific case of PAC1 Receptor Pathway. |
| 0.1 | 2.6 | PID P38 ALPHA BETA DOWNSTREAM PATHWAY | Signaling mediated by p38-alpha and p38-beta |
| 0.1 | 1.2 | PID TOLL ENDOGENOUS PATHWAY | Endogenous TLR signaling |
| 0.1 | 2.3 | PID HIF2PATHWAY | HIF-2-alpha transcription factor network |
| 0.1 | 8.9 | WNT SIGNALING | Genes related to Wnt-mediated signal transduction |
| 0.1 | 2.5 | PID INTEGRIN3 PATHWAY | Beta3 integrin cell surface interactions |
| 0.1 | 0.4 | PID ARF6 DOWNSTREAM PATHWAY | Arf6 downstream pathway |
| 0.1 | 1.6 | PID SMAD2 3PATHWAY | Regulation of cytoplasmic and nuclear SMAD2/3 signaling |
| 0.1 | 0.2 | PID NFAT 3PATHWAY | Role of Calcineurin-dependent NFAT signaling in lymphocytes |
| 0.1 | 0.8 | PID RET PATHWAY | Signaling events regulated by Ret tyrosine kinase |
| 0.1 | 0.2 | ST WNT CA2 CYCLIC GMP PATHWAY | Wnt/Ca2+/cyclic GMP signaling. |
| 0.1 | 2.0 | PID AR TF PATHWAY | Regulation of Androgen receptor activity |
| 0.0 | 0.4 | ST ERK1 ERK2 MAPK PATHWAY | ERK1/ERK2 MAPK Pathway |
| 0.0 | 2.4 | PID TELOMERASE PATHWAY | Regulation of Telomerase |
| 0.0 | 0.4 | PID SYNDECAN 3 PATHWAY | Syndecan-3-mediated signaling events |
| 0.0 | 0.3 | ST GA13 PATHWAY | G alpha 13 Pathway |
| 0.0 | 0.2 | PID NFKAPPAB CANONICAL PATHWAY | Canonical NF-kappaB pathway |
| 0.0 | 5.6 | NABA ECM AFFILIATED | Genes encoding proteins affiliated structurally or functionally to extracellular matrix proteins |
| 0.0 | 0.5 | PID HEDGEHOG 2PATHWAY | Signaling events mediated by the Hedgehog family |
| 0.0 | 0.2 | PID PI3KCI AKT PATHWAY | Class I PI3K signaling events mediated by Akt |
| 0.0 | 0.4 | PID CD40 PATHWAY | CD40/CD40L signaling |
| 0.0 | 0.1 | PID RETINOIC ACID PATHWAY | Retinoic acid receptors-mediated signaling |
| 0.0 | 0.5 | PID IL4 2PATHWAY | IL4-mediated signaling events |
| 0.0 | 1.0 | PID MYC REPRESS PATHWAY | Validated targets of C-MYC transcriptional repression |
| 0.0 | 0.6 | PID BETA CATENIN NUC PATHWAY | Regulation of nuclear beta catenin signaling and target gene transcription |
Gene overrepresentation in curated gene sets: REACTOME pathways category:
| Log-likelihood per target | Total log-likelihood | Term | Description |
|---|---|---|---|
| 8.7 | 8.7 | REACTOME GLUCAGON SIGNALING IN METABOLIC REGULATION | Genes involved in Glucagon signaling in metabolic regulation |
| 3.4 | 144.7 | REACTOME TIGHT JUNCTION INTERACTIONS | Genes involved in Tight junction interactions |
| 3.0 | 48.5 | REACTOME APOPTOTIC CLEAVAGE OF CELL ADHESION PROTEINS | Genes involved in Apoptotic cleavage of cell adhesion proteins |
| 2.2 | 44.6 | REACTOME NUCLEOTIDE LIKE PURINERGIC RECEPTORS | Genes involved in Nucleotide-like (purinergic) receptors |
| 1.9 | 26.3 | REACTOME NEF MEDIATED DOWNREGULATION OF MHC CLASS I COMPLEX CELL SURFACE EXPRESSION | Genes involved in Nef mediated downregulation of MHC class I complex cell surface expression |
| 1.4 | 28.5 | REACTOME REGULATION OF WATER BALANCE BY RENAL AQUAPORINS | Genes involved in Regulation of Water Balance by Renal Aquaporins |
| 1.2 | 22.9 | REACTOME GAP JUNCTION ASSEMBLY | Genes involved in Gap junction assembly |
| 1.2 | 23.9 | REACTOME SIGNAL REGULATORY PROTEIN SIRP FAMILY INTERACTIONS | Genes involved in Signal regulatory protein (SIRP) family interactions |
| 1.1 | 17.0 | REACTOME SIGNALING BY FGFR3 MUTANTS | Genes involved in Signaling by FGFR3 mutants |
| 1.0 | 16.8 | REACTOME SYNTHESIS SECRETION AND DEACYLATION OF GHRELIN | Genes involved in Synthesis, Secretion, and Deacylation of Ghrelin |
| 0.9 | 3.5 | REACTOME HS GAG DEGRADATION | Genes involved in HS-GAG degradation |
| 0.7 | 8.8 | REACTOME CALNEXIN CALRETICULIN CYCLE | Genes involved in Calnexin/calreticulin cycle |
| 0.7 | 11.9 | REACTOME TGF BETA RECEPTOR SIGNALING IN EMT EPITHELIAL TO MESENCHYMAL TRANSITION | Genes involved in TGF-beta receptor signaling in EMT (epithelial to mesenchymal transition) |
| 0.6 | 5.1 | REACTOME ORGANIC CATION ANION ZWITTERION TRANSPORT | Genes involved in Organic cation/anion/zwitterion transport |
| 0.6 | 18.2 | REACTOME AMINE COMPOUND SLC TRANSPORTERS | Genes involved in Amine compound SLC transporters |
| 0.6 | 4.9 | REACTOME ACTIVATION OF CHAPERONE GENES BY ATF6 ALPHA | Genes involved in Activation of Chaperone Genes by ATF6-alpha |
| 0.6 | 7.2 | REACTOME GLUTAMATE NEUROTRANSMITTER RELEASE CYCLE | Genes involved in Glutamate Neurotransmitter Release Cycle |
| 0.6 | 13.1 | REACTOME ZINC TRANSPORTERS | Genes involved in Zinc transporters |
| 0.6 | 4.7 | REACTOME GAP JUNCTION DEGRADATION | Genes involved in Gap junction degradation |
| 0.5 | 10.8 | REACTOME PROLACTIN RECEPTOR SIGNALING | Genes involved in Prolactin receptor signaling |
| 0.5 | 9.9 | REACTOME INFLAMMASOMES | Genes involved in Inflammasomes |
| 0.5 | 19.7 | REACTOME GLYCOSPHINGOLIPID METABOLISM | Genes involved in Glycosphingolipid metabolism |
| 0.5 | 3.3 | REACTOME ENDOGENOUS STEROLS | Genes involved in Endogenous sterols |
| 0.5 | 1.9 | REACTOME DOWNSTREAM TCR SIGNALING | Genes involved in Downstream TCR signaling |
| 0.5 | 9.3 | REACTOME GABA SYNTHESIS RELEASE REUPTAKE AND DEGRADATION | Genes involved in GABA synthesis, release, reuptake and degradation |
| 0.5 | 16.3 | REACTOME CELL CELL JUNCTION ORGANIZATION | Genes involved in Cell-cell junction organization |
| 0.5 | 8.7 | REACTOME DCC MEDIATED ATTRACTIVE SIGNALING | Genes involved in DCC mediated attractive signaling |
| 0.4 | 0.9 | REACTOME GASTRIN CREB SIGNALLING PATHWAY VIA PKC AND MAPK | Genes involved in Gastrin-CREB signalling pathway via PKC and MAPK |
| 0.4 | 0.9 | REACTOME RETROGRADE NEUROTROPHIN SIGNALLING | Genes involved in Retrograde neurotrophin signalling |
| 0.4 | 8.0 | REACTOME TERMINATION OF O GLYCAN BIOSYNTHESIS | Genes involved in Termination of O-glycan biosynthesis |
| 0.4 | 2.0 | REACTOME TRAF6 MEDIATED NFKB ACTIVATION | Genes involved in TRAF6 mediated NF-kB activation |
| 0.4 | 14.0 | REACTOME NEPHRIN INTERACTIONS | Genes involved in Nephrin interactions |
| 0.4 | 7.6 | REACTOME GROWTH HORMONE RECEPTOR SIGNALING | Genes involved in Growth hormone receptor signaling |
| 0.4 | 4.6 | REACTOME COPI MEDIATED TRANSPORT | Genes involved in COPI Mediated Transport |
| 0.4 | 4.8 | REACTOME G ALPHA Z SIGNALLING EVENTS | Genes involved in G alpha (z) signalling events |
| 0.4 | 4.7 | REACTOME NEF MEDIATES DOWN MODULATION OF CELL SURFACE RECEPTORS BY RECRUITING THEM TO CLATHRIN ADAPTERS | Genes involved in Nef-mediates down modulation of cell surface receptors by recruiting them to clathrin adapters |
| 0.4 | 10.3 | REACTOME SULFUR AMINO ACID METABOLISM | Genes involved in Sulfur amino acid metabolism |
| 0.4 | 6.0 | REACTOME SHC1 EVENTS IN EGFR SIGNALING | Genes involved in SHC1 events in EGFR signaling |
| 0.4 | 18.0 | REACTOME ACTIVATION OF CHAPERONE GENES BY XBP1S | Genes involved in Activation of Chaperone Genes by XBP1(S) |
| 0.3 | 8.7 | REACTOME SYNTHESIS OF PC | Genes involved in Synthesis of PC |
| 0.3 | 13.2 | REACTOME ANTIGEN ACTIVATES B CELL RECEPTOR LEADING TO GENERATION OF SECOND MESSENGERS | Genes involved in Antigen Activates B Cell Receptor Leading to Generation of Second Messengers |
| 0.3 | 5.5 | REACTOME AMINE DERIVED HORMONES | Genes involved in Amine-derived hormones |
| 0.3 | 2.6 | REACTOME DEFENSINS | Genes involved in Defensins |
| 0.3 | 45.8 | REACTOME PEPTIDE LIGAND BINDING RECEPTORS | Genes involved in Peptide ligand-binding receptors |
| 0.3 | 5.4 | REACTOME PYRIMIDINE CATABOLISM | Genes involved in Pyrimidine catabolism |
| 0.3 | 25.3 | REACTOME NRAGE SIGNALS DEATH THROUGH JNK | Genes involved in NRAGE signals death through JNK |
| 0.3 | 0.6 | REACTOME RIG I MDA5 MEDIATED INDUCTION OF IFN ALPHA BETA PATHWAYS | Genes involved in RIG-I/MDA5 mediated induction of IFN-alpha/beta pathways |
| 0.3 | 9.8 | REACTOME PEROXISOMAL LIPID METABOLISM | Genes involved in Peroxisomal lipid metabolism |
| 0.3 | 3.7 | REACTOME CASPASE MEDIATED CLEAVAGE OF CYTOSKELETAL PROTEINS | Genes involved in Caspase-mediated cleavage of cytoskeletal proteins |
| 0.3 | 3.7 | REACTOME TRAF6 MEDIATED IRF7 ACTIVATION IN TLR7 8 OR 9 SIGNALING | Genes involved in TRAF6 mediated IRF7 activation in TLR7/8 or 9 signaling |
| 0.3 | 3.4 | REACTOME AKT PHOSPHORYLATES TARGETS IN THE CYTOSOL | Genes involved in AKT phosphorylates targets in the cytosol |
| 0.3 | 4.2 | REACTOME DOWNSTREAM SIGNAL TRANSDUCTION | Genes involved in Downstream signal transduction |
| 0.3 | 10.7 | REACTOME DARPP 32 EVENTS | Genes involved in DARPP-32 events |
| 0.3 | 4.4 | REACTOME SYNTHESIS OF PIPS AT THE LATE ENDOSOME MEMBRANE | Genes involved in Synthesis of PIPs at the late endosome membrane |
| 0.3 | 3.0 | REACTOME COMMON PATHWAY | Genes involved in Common Pathway |
| 0.3 | 2.9 | REACTOME ALPHA LINOLENIC ACID ALA METABOLISM | Genes involved in alpha-linolenic acid (ALA) metabolism |
| 0.3 | 1.0 | REACTOME HORMONE SENSITIVE LIPASE HSL MEDIATED TRIACYLGLYCEROL HYDROLYSIS | Genes involved in Hormone-sensitive lipase (HSL)-mediated triacylglycerol hydrolysis |
| 0.3 | 2.3 | REACTOME ADVANCED GLYCOSYLATION ENDPRODUCT RECEPTOR SIGNALING | Genes involved in Advanced glycosylation endproduct receptor signaling |
| 0.3 | 5.5 | REACTOME FORMATION OF FIBRIN CLOT CLOTTING CASCADE | Genes involved in Formation of Fibrin Clot (Clotting Cascade) |
| 0.3 | 1.0 | REACTOME PD1 SIGNALING | Genes involved in PD-1 signaling |
| 0.2 | 2.4 | REACTOME REGULATION OF COMPLEMENT CASCADE | Genes involved in Regulation of Complement cascade |
| 0.2 | 9.3 | REACTOME GLUCONEOGENESIS | Genes involved in Gluconeogenesis |
| 0.2 | 11.0 | REACTOME INTERFERON ALPHA BETA SIGNALING | Genes involved in Interferon alpha/beta signaling |
| 0.2 | 10.7 | REACTOME ION TRANSPORT BY P TYPE ATPASES | Genes involved in Ion transport by P-type ATPases |
| 0.2 | 0.9 | REACTOME DOPAMINE NEUROTRANSMITTER RELEASE CYCLE | Genes involved in Dopamine Neurotransmitter Release Cycle |
| 0.2 | 14.9 | REACTOME G ALPHA I SIGNALLING EVENTS | Genes involved in G alpha (i) signalling events |
| 0.2 | 2.5 | REACTOME SYNTHESIS SECRETION AND INACTIVATION OF GIP | Genes involved in Synthesis, Secretion, and Inactivation of Glucose-dependent Insulinotropic Polypeptide (GIP) |
| 0.2 | 7.8 | REACTOME GLUTATHIONE CONJUGATION | Genes involved in Glutathione conjugation |
| 0.2 | 2.3 | REACTOME CYTOSOLIC SULFONATION OF SMALL MOLECULES | Genes involved in Cytosolic sulfonation of small molecules |
| 0.2 | 0.6 | REACTOME IL 6 SIGNALING | Genes involved in Interleukin-6 signaling |
| 0.2 | 3.7 | REACTOME SIGNALING BY FGFR1 FUSION MUTANTS | Genes involved in Signaling by FGFR1 fusion mutants |
| 0.2 | 1.8 | REACTOME TRANSPORT OF ORGANIC ANIONS | Genes involved in Transport of organic anions |
| 0.2 | 22.2 | REACTOME TRANSPORT OF INORGANIC CATIONS ANIONS AND AMINO ACIDS OLIGOPEPTIDES | Genes involved in Transport of inorganic cations/anions and amino acids/oligopeptides |
| 0.2 | 2.9 | REACTOME TRAF6 MEDIATED IRF7 ACTIVATION | Genes involved in TRAF6 mediated IRF7 activation |
| 0.2 | 2.6 | REACTOME VITAMIN B5 PANTOTHENATE METABOLISM | Genes involved in Vitamin B5 (pantothenate) metabolism |
| 0.2 | 3.2 | REACTOME OXYGEN DEPENDENT PROLINE HYDROXYLATION OF HYPOXIA INDUCIBLE FACTOR ALPHA | Genes involved in Oxygen-dependent Proline Hydroxylation of Hypoxia-inducible Factor Alpha |
| 0.2 | 2.4 | REACTOME EXTRINSIC PATHWAY FOR APOPTOSIS | Genes involved in Extrinsic Pathway for Apoptosis |
| 0.2 | 2.1 | REACTOME SEROTONIN RECEPTORS | Genes involved in Serotonin receptors |
| 0.2 | 4.8 | REACTOME REGULATION OF GENE EXPRESSION IN BETA CELLS | Genes involved in Regulation of gene expression in beta cells |
| 0.2 | 1.8 | REACTOME REGULATED PROTEOLYSIS OF P75NTR | Genes involved in Regulated proteolysis of p75NTR |
| 0.2 | 1.1 | REACTOME TRANSFERRIN ENDOCYTOSIS AND RECYCLING | Genes involved in Transferrin endocytosis and recycling |
| 0.2 | 3.9 | REACTOME G ALPHA1213 SIGNALLING EVENTS | Genes involved in G alpha (12/13) signalling events |
| 0.2 | 1.9 | REACTOME REGULATION OF INSULIN SECRETION BY ACETYLCHOLINE | Genes involved in Regulation of Insulin Secretion by Acetylcholine |
| 0.2 | 5.9 | REACTOME LATENT INFECTION OF HOMO SAPIENS WITH MYCOBACTERIUM TUBERCULOSIS | Genes involved in Latent infection of Homo sapiens with Mycobacterium tuberculosis |
| 0.2 | 1.0 | REACTOME RECYCLING OF BILE ACIDS AND SALTS | Genes involved in Recycling of bile acids and salts |
| 0.2 | 6.4 | REACTOME POST TRANSLATIONAL MODIFICATION SYNTHESIS OF GPI ANCHORED PROTEINS | Genes involved in Post-translational modification: synthesis of GPI-anchored proteins |
| 0.2 | 0.5 | REACTOME NRIF SIGNALS CELL DEATH FROM THE NUCLEUS | Genes involved in NRIF signals cell death from the nucleus |
| 0.2 | 3.6 | REACTOME RORA ACTIVATES CIRCADIAN EXPRESSION | Genes involved in RORA Activates Circadian Expression |
| 0.2 | 2.3 | REACTOME AMINE LIGAND BINDING RECEPTORS | Genes involved in Amine ligand-binding receptors |
| 0.2 | 0.3 | REACTOME IRON UPTAKE AND TRANSPORT | Genes involved in Iron uptake and transport |
| 0.2 | 0.2 | REACTOME TRANSLOCATION OF ZAP 70 TO IMMUNOLOGICAL SYNAPSE | Genes involved in Translocation of ZAP-70 to Immunological synapse |
| 0.2 | 4.6 | REACTOME PHASE1 FUNCTIONALIZATION OF COMPOUNDS | Genes involved in Phase 1 - Functionalization of compounds |
| 0.2 | 4.3 | REACTOME ENDOSOMAL SORTING COMPLEX REQUIRED FOR TRANSPORT ESCRT | Genes involved in Endosomal Sorting Complex Required For Transport (ESCRT) |
| 0.2 | 3.2 | REACTOME ABCA TRANSPORTERS IN LIPID HOMEOSTASIS | Genes involved in ABCA transporters in lipid homeostasis |
| 0.1 | 3.6 | REACTOME NEGATIVE REGULATORS OF RIG I MDA5 SIGNALING | Genes involved in Negative regulators of RIG-I/MDA5 signaling |
| 0.1 | 5.9 | REACTOME IMMUNOREGULATORY INTERACTIONS BETWEEN A LYMPHOID AND A NON LYMPHOID CELL | Genes involved in Immunoregulatory interactions between a Lymphoid and a non-Lymphoid cell |
| 0.1 | 5.7 | REACTOME CELL JUNCTION ORGANIZATION | Genes involved in Cell junction organization |
| 0.1 | 0.6 | REACTOME G PROTEIN BETA GAMMA SIGNALLING | Genes involved in G-protein beta:gamma signalling |
| 0.1 | 0.7 | REACTOME SYNTHESIS OF PIPS AT THE EARLY ENDOSOME MEMBRANE | Genes involved in Synthesis of PIPs at the early endosome membrane |
| 0.1 | 13.2 | REACTOME NUCLEAR RECEPTOR TRANSCRIPTION PATHWAY | Genes involved in Nuclear Receptor transcription pathway |
| 0.1 | 10.2 | REACTOME REGULATION OF INSULIN SECRETION | Genes involved in Regulation of Insulin Secretion |
| 0.1 | 0.7 | REACTOME DESTABILIZATION OF MRNA BY AUF1 HNRNP D0 | Genes involved in Destabilization of mRNA by AUF1 (hnRNP D0) |
| 0.1 | 6.5 | REACTOME SPHINGOLIPID METABOLISM | Genes involved in Sphingolipid metabolism |
| 0.1 | 5.6 | REACTOME SIGNALING BY SCF KIT | Genes involved in Signaling by SCF-KIT |
| 0.1 | 2.1 | REACTOME PURINE SALVAGE | Genes involved in Purine salvage |
| 0.1 | 1.6 | REACTOME VEGF LIGAND RECEPTOR INTERACTIONS | Genes involved in VEGF ligand-receptor interactions |
| 0.1 | 1.7 | REACTOME ANTIGEN PRESENTATION FOLDING ASSEMBLY AND PEPTIDE LOADING OF CLASS I MHC | Genes involved in Antigen Presentation: Folding, assembly and peptide loading of class I MHC |
| 0.1 | 2.1 | REACTOME MITOCHONDRIAL FATTY ACID BETA OXIDATION | Genes involved in Mitochondrial Fatty Acid Beta-Oxidation |
| 0.1 | 0.1 | REACTOME ARMS MEDIATED ACTIVATION | Genes involved in ARMS-mediated activation |
| 0.1 | 1.8 | REACTOME FGFR LIGAND BINDING AND ACTIVATION | Genes involved in FGFR ligand binding and activation |
| 0.1 | 4.5 | REACTOME TRANSPORT TO THE GOLGI AND SUBSEQUENT MODIFICATION | Genes involved in Transport to the Golgi and subsequent modification |
| 0.1 | 1.3 | REACTOME PURINE CATABOLISM | Genes involved in Purine catabolism |
| 0.1 | 1.4 | REACTOME TETRAHYDROBIOPTERIN BH4 SYNTHESIS RECYCLING SALVAGE AND REGULATION | Genes involved in Tetrahydrobiopterin (BH4) synthesis, recycling, salvage and regulation |
| 0.1 | 1.1 | REACTOME CELL CELL COMMUNICATION | Genes involved in Cell-Cell communication |
| 0.1 | 0.7 | REACTOME ABACAVIR TRANSPORT AND METABOLISM | Genes involved in Abacavir transport and metabolism |
| 0.1 | 2.9 | REACTOME SYNTHESIS OF PIPS AT THE PLASMA MEMBRANE | Genes involved in Synthesis of PIPs at the plasma membrane |
| 0.1 | 1.0 | REACTOME REGULATION OF THE FANCONI ANEMIA PATHWAY | Genes involved in Regulation of the Fanconi anemia pathway |
| 0.1 | 1.4 | REACTOME SYNTHESIS OF SUBSTRATES IN N GLYCAN BIOSYTHESIS | Genes involved in Synthesis of substrates in N-glycan biosythesis |
| 0.1 | 1.4 | REACTOME TANDEM PORE DOMAIN POTASSIUM CHANNELS | Genes involved in Tandem pore domain potassium channels |
| 0.1 | 0.8 | REACTOME HYALURONAN UPTAKE AND DEGRADATION | Genes involved in Hyaluronan uptake and degradation |
| 0.1 | 9.6 | REACTOME GLYCEROPHOSPHOLIPID BIOSYNTHESIS | Genes involved in Glycerophospholipid biosynthesis |
| 0.1 | 3.9 | REACTOME HS GAG BIOSYNTHESIS | Genes involved in HS-GAG biosynthesis |
| 0.1 | 2.0 | REACTOME ASPARAGINE N LINKED GLYCOSYLATION | Genes involved in Asparagine N-linked glycosylation |
| 0.1 | 1.5 | REACTOME ACTIVATED TAK1 MEDIATES P38 MAPK ACTIVATION | Genes involved in activated TAK1 mediates p38 MAPK activation |
| 0.1 | 0.6 | REACTOME REGULATION OF ORNITHINE DECARBOXYLASE ODC | Genes involved in Regulation of ornithine decarboxylase (ODC) |
| 0.1 | 1.7 | REACTOME SYNTHESIS OF VERY LONG CHAIN FATTY ACYL COAS | Genes involved in Synthesis of very long-chain fatty acyl-CoAs |
| 0.1 | 2.8 | REACTOME CGMP EFFECTS | Genes involved in cGMP effects |
| 0.1 | 0.3 | REACTOME TRANSPORT OF RIBONUCLEOPROTEINS INTO THE HOST NUCLEUS | Genes involved in Transport of Ribonucleoproteins into the Host Nucleus |
| 0.1 | 1.2 | REACTOME IONOTROPIC ACTIVITY OF KAINATE RECEPTORS | Genes involved in Ionotropic activity of Kainate Receptors |
| 0.1 | 0.5 | REACTOME SIGNALLING TO P38 VIA RIT AND RIN | Genes involved in Signalling to p38 via RIT and RIN |
| 0.1 | 0.5 | REACTOME ACTIVATION OF IRF3 IRF7 MEDIATED BY TBK1 IKK EPSILON | Genes involved in Activation of IRF3/IRF7 mediated by TBK1/IKK epsilon |
| 0.1 | 0.8 | REACTOME PRESYNAPTIC NICOTINIC ACETYLCHOLINE RECEPTORS | Genes involved in Presynaptic nicotinic acetylcholine receptors |
| 0.1 | 2.7 | REACTOME INTERACTION BETWEEN L1 AND ANKYRINS | Genes involved in Interaction between L1 and Ankyrins |
| 0.1 | 2.4 | REACTOME O LINKED GLYCOSYLATION OF MUCINS | Genes involved in O-linked glycosylation of mucins |
| 0.1 | 1.6 | REACTOME TRANSCRIPTIONAL REGULATION OF WHITE ADIPOCYTE DIFFERENTIATION | Genes involved in Transcriptional Regulation of White Adipocyte Differentiation |
| 0.1 | 3.3 | REACTOME INTEGRIN CELL SURFACE INTERACTIONS | Genes involved in Integrin cell surface interactions |
| 0.1 | 0.5 | REACTOME PASSIVE TRANSPORT BY AQUAPORINS | Genes involved in Passive Transport by Aquaporins |
| 0.1 | 1.8 | REACTOME PACKAGING OF TELOMERE ENDS | Genes involved in Packaging Of Telomere Ends |
| 0.1 | 0.6 | REACTOME POST CHAPERONIN TUBULIN FOLDING PATHWAY | Genes involved in Post-chaperonin tubulin folding pathway |
| 0.0 | 2.2 | REACTOME G ALPHA Q SIGNALLING EVENTS | Genes involved in G alpha (q) signalling events |
| 0.0 | 0.3 | REACTOME GLYCOPROTEIN HORMONES | Genes involved in Glycoprotein hormones |
| 0.0 | 1.0 | REACTOME METABOLISM OF PORPHYRINS | Genes involved in Metabolism of porphyrins |
| 0.0 | 0.5 | REACTOME PROTEOLYTIC CLEAVAGE OF SNARE COMPLEX PROTEINS | Genes involved in Proteolytic cleavage of SNARE complex proteins |
| 0.0 | 0.3 | REACTOME PLATELET SENSITIZATION BY LDL | Genes involved in Platelet sensitization by LDL |
| 0.0 | 0.2 | REACTOME CD28 DEPENDENT VAV1 PATHWAY | Genes involved in CD28 dependent Vav1 pathway |
| 0.0 | 0.2 | REACTOME FORMATION OF INCISION COMPLEX IN GG NER | Genes involved in Formation of incision complex in GG-NER |
| 0.0 | 0.2 | REACTOME SIGNALING BY WNT | Genes involved in Signaling by Wnt |
| 0.0 | 1.1 | REACTOME NCAM SIGNALING FOR NEURITE OUT GROWTH | Genes involved in NCAM signaling for neurite out-growth |
| 0.0 | 1.1 | REACTOME MYD88 MAL CASCADE INITIATED ON PLASMA MEMBRANE | Genes involved in MyD88:Mal cascade initiated on plasma membrane |
| 0.0 | 0.4 | REACTOME PURINE RIBONUCLEOSIDE MONOPHOSPHATE BIOSYNTHESIS | Genes involved in Purine ribonucleoside monophosphate biosynthesis |
| 0.0 | 0.0 | REACTOME P53 INDEPENDENT G1 S DNA DAMAGE CHECKPOINT | Genes involved in p53-Independent G1/S DNA damage checkpoint |
| 0.0 | 0.3 | REACTOME METABOLISM OF NON CODING RNA | Genes involved in Metabolism of non-coding RNA |
| 0.0 | 0.8 | REACTOME VOLTAGE GATED POTASSIUM CHANNELS | Genes involved in Voltage gated Potassium channels |
| 0.0 | 0.2 | REACTOME REGULATION OF BETA CELL DEVELOPMENT | Genes involved in Regulation of beta-cell development |
| 0.0 | 0.3 | REACTOME AMYLOIDS | Genes involved in Amyloids |
| 0.0 | 0.2 | REACTOME GLYCOGEN BREAKDOWN GLYCOGENOLYSIS | Genes involved in Glycogen breakdown (glycogenolysis) |
| 0.0 | 0.1 | REACTOME DESTABILIZATION OF MRNA BY TRISTETRAPROLIN TTP | Genes involved in Destabilization of mRNA by Tristetraprolin (TTP) |
| 0.0 | 0.4 | REACTOME DOWNREGULATION OF SMAD2 3 SMAD4 TRANSCRIPTIONAL ACTIVITY | Genes involved in Downregulation of SMAD2/3:SMAD4 transcriptional activity |
| 0.0 | 0.3 | REACTOME IL1 SIGNALING | Genes involved in Interleukin-1 signaling |
| 0.0 | 0.9 | REACTOME PPARA ACTIVATES GENE EXPRESSION | Genes involved in PPARA Activates Gene Expression |
| 0.0 | 0.1 | REACTOME ENOS ACTIVATION AND REGULATION | Genes involved in eNOS activation and regulation |
| 0.0 | 0.0 | REACTOME PLATELET AGGREGATION PLUG FORMATION | Genes involved in Platelet Aggregation (Plug Formation) |