Project
DANIO-CODE
Navigation
Downloads
Results for fosaa+fosab+fosl1a_nfya_nfyal
Z-value: 5.34
Motif logo
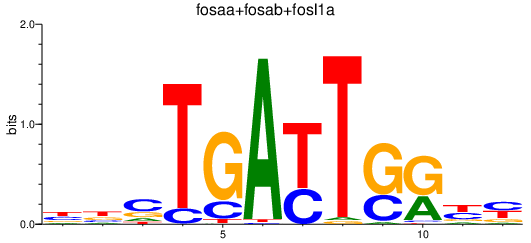
Transcription factors associated with fosaa+fosab+fosl1a_nfya_nfyal
| Gene Symbol | Gene ID | Gene Info |
|---|---|---|
|
fosl1a
|
ENSDARG00000015355 | FOS-like antigen 1a |
|
fosab
|
ENSDARG00000031683 | v-fos FBJ murine osteosarcoma viral oncogene homolog Ab |
|
fosaa
|
ENSDARG00000040135 | v-fos FBJ murine osteosarcoma viral oncogene homolog Aa |
|
nfya
|
ENSDARG00000042004 | nuclear transcription factor Y, alpha |
|
nfyal
|
ENSDARG00000001621 | nuclear transcription factor Y, alpha, like |
Activity-expression correlation:
| Gene | Promoter | Pearson corr. coef. | P-value | Plot |
|---|---|---|---|---|
| nfyal | dr10_dc_chr8_-_25015215_25015329 | 0.86 | 2.4e-05 | Click! |
| nfya | dr10_dc_chr11_-_36017572_36017661 | -0.77 | 4.7e-04 | Click! |
| fosab | dr10_dc_chr20_-_46650719_46650720 | -0.66 | 5.2e-03 | Click! |
Activity profile of fosaa+fosab+fosl1a_nfya_nfyal motif
Sorted Z-values of fosaa+fosab+fosl1a_nfya_nfyal motif
Network of associatons between targets according to the STRING database.

First level regulatory network of fosaa+fosab+fosl1a_nfya_nfyal
| Promoter | Score | Transcript | Gene | Gene Info |
|---|---|---|---|---|
| KN149735v1_-_1679 | 34.95 |
|
|
|
| chr1_-_32914487 | 19.59 |
ENSDART00000015547
|
cldng
|
claudin g |
| chr8_-_2557556 | 13.07 |
ENSDART00000140033
|
slc25a25a
|
solute carrier family 25 (mitochondrial carrier; phosphate carrier), member 25a |
| chr12_-_1435708 | 12.13 |
|
|
|
| chr16_+_39209567 | 11.03 |
ENSDART00000121756
|
sybu
|
syntabulin (syntaxin-interacting) |
| chr13_-_50150732 | 10.25 |
ENSDART00000083857
|
ccnj
|
cyclin J |
| chr21_+_3732973 | 9.92 |
ENSDART00000170653
|
dolpp1
|
dolichyldiphosphatase 1 |
| chr3_+_1398333 | 9.72 |
ENSDART00000031823
|
triobpb
|
TRIO and F-actin binding protein b |
| chr7_+_30355221 | 9.55 |
ENSDART00000173533
ENSDART00000052541 |
ccnb2
|
cyclin B2 |
| chr7_-_33414221 | 9.31 |
|
|
|
| chr18_-_199009 | 9.00 |
|
|
|
| chr6_-_53049946 | 8.96 |
ENSDART00000103267
|
fam212ab
|
family with sequence similarity 212, member Ab |
| chr13_-_50150796 | 8.89 |
ENSDART00000083857
|
ccnj
|
cyclin J |
| chr22_+_15933690 | 8.84 |
ENSDART00000033617
|
stil
|
scl/tal1 interrupting locus |
| chr22_+_37688839 | 8.70 |
ENSDART00000174664
ENSDART00000178200 |
FO704589.1
|
ENSDARG00000108910 |
| chr7_+_17695289 | 8.62 |
ENSDART00000101601
|
cth1
|
cysteine three histidine 1 |
| chr12_-_22116694 | 8.55 |
ENSDART00000038310
ENSDART00000132731 |
ormdl3
|
ORMDL sphingolipid biosynthesis regulator 3 |
| chr24_+_17190448 | 8.25 |
ENSDART00000159724
ENSDART00000081851 ENSDART00000018868 |
pdia4
|
protein disulfide isomerase family A, member 4 |
| chr22_+_15933837 | 8.17 |
ENSDART00000033617
|
stil
|
scl/tal1 interrupting locus |
| chr8_-_28359022 | 8.08 |
ENSDART00000062693
|
ptpn1
|
protein tyrosine phosphatase, non-receptor type 1 |
| chr16_+_54833107 | 8.02 |
ENSDART00000157641
|
fbxo43
|
F-box protein 43 |
| chr9_+_29737843 | 7.99 |
ENSDART00000176057
|
rnf17
|
ring finger protein 17 |
| chr23_-_35384257 | 7.99 |
ENSDART00000113643
|
fbxo25
|
F-box protein 25 |
| chr14_-_30604897 | 7.91 |
ENSDART00000161540
|
si:zfos-80g12.1
|
si:zfos-80g12.1 |
| chr1_-_18118467 | 7.84 |
ENSDART00000142026
|
si:dkey-167i21.2
|
si:dkey-167i21.2 |
| chr24_+_12689711 | 7.84 |
ENSDART00000114762
|
nanog
|
nanog homeobox |
| chr1_+_29919378 | 7.79 |
ENSDART00000127670
|
bora
|
bora, aurora kinase A activator |
| chr14_-_35552296 | 7.75 |
ENSDART00000052648
|
tmem144b
|
transmembrane protein 144b |
| chr12_+_48356793 | 7.66 |
ENSDART00000054788
ENSDART00000152899 |
ddit4
|
DNA-damage-inducible transcript 4 |
| chr8_+_10825036 | 7.62 |
ENSDART00000140717
|
brpf3b
|
bromodomain and PHD finger containing, 3b |
| chr12_-_1435616 | 7.59 |
|
|
|
| chr23_+_33981443 | 7.56 |
ENSDART00000159445
|
cs
|
citrate synthase |
| chr13_+_46652067 | 7.42 |
ENSDART00000056962
|
fbxo5
|
F-box protein 5 |
| chr7_-_26226451 | 7.39 |
ENSDART00000058910
|
sox19b
|
SRY (sex determining region Y)-box 19b |
| chr14_-_14353451 | 7.35 |
ENSDART00000170355
ENSDART00000159888 |
nsdhl
|
NAD(P) dependent steroid dehydrogenase-like |
| chr23_-_42918086 | 7.27 |
ENSDART00000102328
|
pfkfb2a
|
6-phosphofructo-2-kinase/fructose-2,6-biphosphatase 2a |
| chr3_-_20912934 | 7.26 |
ENSDART00000156275
|
fam57ba
|
family with sequence similarity 57, member Ba |
| chr7_+_34523283 | 7.20 |
ENSDART00000009698
|
esrp2
|
epithelial splicing regulatory protein 2 |
| chr7_+_17695173 | 7.10 |
ENSDART00000101601
|
cth1
|
cysteine three histidine 1 |
| chr17_-_2401636 | 6.99 |
ENSDART00000013506
|
zp3.2
|
zona pellucida glycoprotein 3, tandem duplicate 2 |
| chr3_+_62051674 | 6.97 |
ENSDART00000113144
|
zgc:173575
|
zgc:173575 |
| chr16_-_46613217 | 6.92 |
ENSDART00000127212
|
si:dkey-152b24.6
|
si:dkey-152b24.6 |
| chr10_-_39362315 | 6.89 |
ENSDART00000023831
|
cry5
|
cryptochrome circadian clock 5 |
| chr12_-_24711074 | 6.88 |
ENSDART00000066317
|
foxn2b
|
forkhead box N2b |
| chr23_-_36207066 | 6.87 |
ENSDART00000147598
|
cbx5
|
chromobox homolog 5 (HP1 alpha homolog, Drosophila) |
| chr3_-_45369628 | 6.87 |
ENSDART00000167179
|
asf1ba
|
anti-silencing function 1Ba histone chaperone |
| chr18_+_24490621 | 6.82 |
ENSDART00000143108
|
CR847971.1
|
ENSDARG00000091941 |
| chr16_-_13790348 | 6.81 |
ENSDART00000047452
|
ube2s
|
ubiquitin-conjugating enzyme E2S |
| chr11_+_36088518 | 6.80 |
|
|
|
| chr8_-_3354396 | 6.78 |
ENSDART00000169430
ENSDART00000167187 ENSDART00000170478 |
FUT9 (1 of many)
fut9b
|
fucosyltransferase 9 fucosyltransferase 9b |
| chr20_+_13987091 | 6.74 |
ENSDART00000152611
|
nek2
|
NIMA-related kinase 2 |
| chr16_-_39291647 | 6.53 |
ENSDART00000171342
|
tmem42a
|
transmembrane protein 42a |
| chr22_+_32274436 | 6.42 |
ENSDART00000092082
|
manf
|
mesencephalic astrocyte-derived neurotrophic factor |
| chr5_-_14000166 | 6.29 |
ENSDART00000099566
|
si:ch211-244o22.2
|
si:ch211-244o22.2 |
| chr3_-_25246452 | 6.21 |
ENSDART00000177576
|
kpna2
|
karyopherin alpha 2 (RAG cohort 1, importin alpha 1) |
| chr16_-_39209426 | 6.15 |
|
|
|
| chr3_-_26060787 | 6.08 |
ENSDART00000113843
|
ypel3
|
yippee-like 3 |
| chr7_+_36195803 | 6.03 |
ENSDART00000138893
|
aktip
|
akt interacting protein |
| chr12_-_33481445 | 6.02 |
ENSDART00000009794
ENSDART00000136617 |
tdrkh
|
tudor and KH domain containing |
| chr22_-_4787016 | 5.95 |
ENSDART00000140313
|
tnfaip8l1
|
tumor necrosis factor, alpha-induced protein 8-like 1 |
| chr25_+_29752983 | 5.94 |
ENSDART00000141167
|
hsd17b12a
|
hydroxysteroid (17-beta) dehydrogenase 12a |
| chr20_-_54160297 | 5.82 |
ENSDART00000153435
|
ppp2r5cb
|
protein phosphatase 2, regulatory subunit B', gamma b |
| chr18_-_24490329 | 5.79 |
ENSDART00000147961
|
CR847971.2
|
ENSDARG00000094853 |
| chr8_-_2557506 | 5.77 |
ENSDART00000140033
|
slc25a25a
|
solute carrier family 25 (mitochondrial carrier; phosphate carrier), member 25a |
| chr23_-_22146031 | 5.75 |
ENSDART00000054362
|
phc2a
|
polyhomeotic homolog 2a (Drosophila) |
| chr21_-_13593659 | 5.70 |
ENSDART00000065817
|
pou5f3
|
POU domain, class 5, transcription factor 3 |
| chr24_+_39339095 | 5.69 |
ENSDART00000168705
|
si:ch73-103b11.2
|
si:ch73-103b11.2 |
| chr14_+_31189527 | 5.65 |
ENSDART00000053026
|
fam122b
|
family with sequence similarity 122B |
| chr10_-_25737632 | 5.65 |
ENSDART00000135058
|
sod1
|
superoxide dismutase 1, soluble |
| chr12_-_33558248 | 5.62 |
ENSDART00000153457
|
tmem94
|
transmembrane protein 94 |
| chr14_-_47387481 | 5.60 |
ENSDART00000031498
|
ccna2
|
cyclin A2 |
| chr22_-_10509348 | 5.59 |
ENSDART00000131217
|
ippk
|
inositol 1,3,4,5,6-pentakisphosphate 2-kinase |
| chr22_-_38321005 | 5.58 |
ENSDART00000015117
|
elavl2
|
ELAV like neuron-specific RNA binding protein 2 |
| chr2_+_23351090 | 5.56 |
ENSDART00000145126
ENSDART00000163649 ENSDART00000027782 |
mknk2a
|
MAP kinase interacting serine/threonine kinase 2a |
| chr13_+_13814142 | 5.52 |
ENSDART00000142997
|
eif2ak3
|
eukaryotic translation initiation factor 2-alpha kinase 3 |
| chr12_-_10474942 | 5.51 |
ENSDART00000106163
ENSDART00000124562 |
zgc:152977
|
zgc:152977 |
| chr5_+_61136434 | 5.48 |
ENSDART00000113508
|
hnrnpul1l
|
heterogeneous nuclear ribonucleoprotein U-like 1 like |
| chr17_+_19606608 | 5.41 |
ENSDART00000044993
ENSDART00000131863 |
rgs7a
|
regulator of G protein signaling 7a |
| chr3_+_14421976 | 5.40 |
ENSDART00000171731
|
znf653
|
zinc finger protein 653 |
| chr25_+_35742745 | 5.38 |
ENSDART00000152649
|
bmb
|
brambleberry |
| chr24_-_9865837 | 5.37 |
ENSDART00000106244
|
zgc:171750
|
zgc:171750 |
| chr1_-_53052062 | 5.37 |
ENSDART00000162751
|
xpo1a
|
exportin 1 (CRM1 homolog, yeast) a |
| chr12_-_1435580 | 5.34 |
|
|
|
| chr25_-_8548041 | 5.34 |
ENSDART00000155280
|
GDPGP1
|
GDP-D-glucose phosphorylase 1 |
| chr3_+_1398365 | 5.32 |
ENSDART00000031823
|
triobpb
|
TRIO and F-actin binding protein b |
| KN150226v1_+_11535 | 5.24 |
|
|
|
| chr25_+_7261050 | 5.11 |
ENSDART00000163017
|
prc1a
|
protein regulator of cytokinesis 1a |
| chr18_+_15137751 | 5.06 |
ENSDART00000168639
|
cry1ab
|
cryptochrome circadian clock 1ab |
| chr12_+_38632987 | 5.04 |
ENSDART00000155563
|
abca5
|
ATP-binding cassette, sub-family A (ABC1), member 5 |
| chr13_-_2259880 | 5.02 |
ENSDART00000168595
|
elovl5
|
ELOVL fatty acid elongase 5 |
| chr18_+_17611571 | 5.00 |
ENSDART00000151850
|
herpud1
|
homocysteine-inducible, endoplasmic reticulum stress-inducible, ubiquitin-like domain member 1 |
| chr20_+_54544851 | 4.99 |
ENSDART00000144633
|
cipcb
|
CLOCK-interacting pacemaker b |
| chr17_+_25545565 | 4.96 |
ENSDART00000121700
|
qrsl1
|
glutaminyl-tRNA synthase (glutamine-hydrolyzing)-like 1 |
| chr25_-_17822194 | 4.95 |
ENSDART00000148660
|
arntl1a
|
aryl hydrocarbon receptor nuclear translocator-like 1a |
| chr21_-_41611308 | 4.94 |
ENSDART00000100039
|
pcyox1l
|
prenylcysteine oxidase 1 like |
| chr19_-_2148053 | 4.94 |
ENSDART00000020497
|
snx13
|
sorting nexin 13 |
| chr19_+_40558066 | 4.91 |
ENSDART00000049968
|
si:ch211-173p18.3
|
si:ch211-173p18.3 |
| chr10_-_33435736 | 4.91 |
ENSDART00000023509
|
ska2
|
spindle and kinetochore associated complex subunit 2 |
| chr3_-_61850783 | 4.91 |
ENSDART00000092665
|
srebf1
|
sterol regulatory element binding transcription factor 1 |
| chr8_-_1154220 | 4.89 |
ENSDART00000149969
ENSDART00000016800 |
znf367
|
zinc finger protein 367 |
| chr20_+_13987346 | 4.89 |
ENSDART00000152611
|
nek2
|
NIMA-related kinase 2 |
| chr6_-_7529384 | 4.89 |
ENSDART00000091836
ENSDART00000151697 |
ubn2a
|
ubinuclein 2a |
| chr22_-_3279707 | 4.88 |
ENSDART00000160305
|
si:zfos-943e10.1
|
si:zfos-943e10.1 |
| chr5_+_29996321 | 4.88 |
ENSDART00000124487
|
hinfp
|
histone H4 transcription factor |
| chr18_+_17611931 | 4.88 |
ENSDART00000141465
|
herpud1
|
homocysteine-inducible, endoplasmic reticulum stress-inducible, ubiquitin-like domain member 1 |
| chr19_+_791656 | 4.87 |
ENSDART00000138406
|
tmem79a
|
transmembrane protein 79a |
| chr13_-_2259820 | 4.83 |
ENSDART00000168595
|
elovl5
|
ELOVL fatty acid elongase 5 |
| chr25_-_17822363 | 4.82 |
ENSDART00000023959
|
arntl1a
|
aryl hydrocarbon receptor nuclear translocator-like 1a |
| chr19_-_9020995 | 4.76 |
ENSDART00000043507
|
ciarta
|
circadian associated repressor of transcription a |
| chr10_-_45182378 | 4.74 |
ENSDART00000161815
|
polm
|
polymerase (DNA directed), mu |
| chr7_-_3986977 | 4.73 |
|
|
|
| chr16_+_17857126 | 4.71 |
ENSDART00000149408
|
them4
|
thioesterase superfamily member 4 |
| chr14_-_22198134 | 4.69 |
ENSDART00000137167
|
ENSDARG00000056830
|
ENSDARG00000056830 |
| chr12_+_38633026 | 4.68 |
ENSDART00000155563
|
abca5
|
ATP-binding cassette, sub-family A (ABC1), member 5 |
| chr13_-_31267459 | 4.68 |
ENSDART00000008287
|
pgam1a
|
phosphoglycerate mutase 1a |
| chr9_+_20970156 | 4.67 |
ENSDART00000139174
|
fam46c
|
family with sequence similarity 46, member C |
| chr21_+_10609580 | 4.66 |
ENSDART00000102304
|
lman1
|
lectin, mannose-binding, 1 |
| chr18_+_17611865 | 4.64 |
ENSDART00000141465
|
herpud1
|
homocysteine-inducible, endoplasmic reticulum stress-inducible, ubiquitin-like domain member 1 |
| chr17_+_15205550 | 4.62 |
ENSDART00000058351
|
gnpnat1
|
glucosamine-phosphate N-acetyltransferase 1 |
| chr18_-_20476969 | 4.61 |
ENSDART00000060311
|
paqr5a
|
progestin and adipoQ receptor family member Va |
| chr5_-_68011971 | 4.58 |
ENSDART00000141699
|
mepce
|
methylphosphate capping enzyme |
| chr11_-_36088336 | 4.56 |
ENSDART00000141477
|
psma5
|
proteasome subunit alpha 5 |
| chr18_+_46153484 | 4.52 |
ENSDART00000015034
|
blvrb
|
biliverdin reductase B |
| chr22_-_10861268 | 4.49 |
ENSDART00000145229
|
arhgef18b
|
rho/rac guanine nucleotide exchange factor (GEF) 18b |
| chr11_+_29290515 | 4.49 |
ENSDART00000103388
|
wu:fi42e03
|
wu:fi42e03 |
| chr14_+_5554581 | 4.49 |
ENSDART00000041279
|
tubb4b
|
tubulin, beta 4B class IVb |
| chr17_+_28085497 | 4.49 |
ENSDART00000131638
|
ENSDARG00000054122
|
ENSDARG00000054122 |
| chr5_-_14000289 | 4.49 |
ENSDART00000099566
|
si:ch211-244o22.2
|
si:ch211-244o22.2 |
| chr17_+_20231630 | 4.48 |
ENSDART00000155584
|
BX005375.1
|
ENSDARG00000097982 |
| chr16_-_39527633 | 4.46 |
ENSDART00000102525
|
stt3b
|
STT3B, subunit of the oligosaccharyltransferase complex (catalytic) |
| chr7_-_18364873 | 4.45 |
ENSDART00000172419
|
si:ch211-119e14.1
|
si:ch211-119e14.1 |
| chr2_-_17443607 | 4.45 |
ENSDART00000136207
|
pif1
|
PIF1 5'-to-3' DNA helicase homolog (S. cerevisiae) |
| KN150699v1_-_15078 | 4.44 |
ENSDART00000159861
|
ENSDARG00000098739
|
ENSDARG00000098739 |
| chr14_-_38942 | 4.44 |
ENSDART00000054823
|
aurkb
|
aurora kinase B |
| chr24_+_12689887 | 4.41 |
ENSDART00000114762
|
nanog
|
nanog homeobox |
| chr8_+_49777525 | 4.41 |
ENSDART00000060657
|
rmi1
|
RMI1, RecQ mediated genome instability 1, homolog (S. cerevisiae) |
| chr7_+_69290790 | 4.38 |
ENSDART00000109507
|
RAP1GDS1
|
Rap1 GTPase-GDP dissociation stimulator 1 |
| chr7_+_37989122 | 4.38 |
ENSDART00000143611
|
cnep1r1
|
CTD nuclear envelope phosphatase 1 regulatory subunit 1 |
| chr3_+_16572387 | 4.37 |
ENSDART00000008711
|
gys1
|
glycogen synthase 1 (muscle) |
| chr5_-_23092592 | 4.37 |
ENSDART00000024815
|
fam76b
|
family with sequence similarity 76, member B |
| chr5_-_22099244 | 4.35 |
ENSDART00000161298
|
nono
|
non-POU domain containing, octamer-binding |
| chr14_-_31149030 | 4.34 |
ENSDART00000018347
|
cab39l1
|
calcium binding protein 39, like 1 |
| chr7_-_6309089 | 4.33 |
ENSDART00000172825
|
FP325123.5
|
Histone H3.2 |
| chr7_+_28844711 | 4.32 |
ENSDART00000052345
|
tradd
|
tnfrsf1a-associated via death domain |
| chr1_+_11707382 | 4.31 |
ENSDART00000139440
|
zgc:77739
|
zgc:77739 |
| chr1_+_18118735 | 4.31 |
ENSDART00000078610
|
slc25a51a
|
solute carrier family 25, member 51a |
| chr12_-_24711169 | 4.28 |
ENSDART00000066317
|
foxn2b
|
forkhead box N2b |
| chr3_+_18691103 | 4.26 |
ENSDART00000128626
|
tmem104
|
transmembrane protein 104 |
| chr3_-_7275821 | 4.25 |
ENSDART00000132197
|
BX005085.4
|
ENSDARG00000102658 |
| chr20_-_23327126 | 4.24 |
ENSDART00000153308
|
dcun1d4
|
DCN1, defective in cullin neddylation 1, domain containing 4 (S. cerevisiae) |
| chr5_-_1734159 | 4.22 |
ENSDART00000145781
|
ENSDARG00000094300
|
ENSDARG00000094300 |
| chr17_-_6225136 | 4.22 |
ENSDART00000137389
ENSDART00000115389 |
txlnbb
|
taxilin beta b |
| chr25_+_4414838 | 4.19 |
ENSDART00000129978
|
pnpla2
|
patatin-like phospholipase domain containing 2 |
| chr3_-_5157662 | 4.18 |
ENSDART00000169609
|
tefb
|
thyrotrophic embryonic factor b |
| chr24_-_24652054 | 4.18 |
ENSDART00000138741
ENSDART00000169581 |
pde7a
|
phosphodiesterase 7A |
| chr7_-_47978449 | 4.18 |
ENSDART00000127007
ENSDART00000024062 |
cpeb1b
|
cytoplasmic polyadenylation element binding protein 1b |
| chr10_+_384571 | 4.16 |
ENSDART00000129757
|
si:ch211-242f23.8
|
si:ch211-242f23.8 |
| chr1_+_42985065 | 4.16 |
ENSDART00000074604
|
cisd2
|
CDGSH iron sulfur domain 2 |
| chr16_-_39527598 | 4.15 |
ENSDART00000102525
|
stt3b
|
STT3B, subunit of the oligosaccharyltransferase complex (catalytic) |
| chr2_+_37224986 | 4.14 |
ENSDART00000138952
|
apoda.2
|
apolipoprotein Da, duplicate 2 |
| chr23_-_22145900 | 4.13 |
ENSDART00000132343
|
phc2a
|
polyhomeotic homolog 2a (Drosophila) |
| chr20_+_35535503 | 4.11 |
ENSDART00000153249
|
tdrd6
|
tudor domain containing 6 |
| chr22_+_24596299 | 4.09 |
ENSDART00000158303
ENSDART00000160924 |
mcoln2
|
mucolipin 2 |
| KN150593v1_+_10332 | 4.08 |
|
|
|
| chr21_-_32748287 | 4.08 |
ENSDART00000031028
|
cnot6a
|
CCR4-NOT transcription complex, subunit 6a |
| chr14_-_14353487 | 4.07 |
ENSDART00000172241
|
nsdhl
|
NAD(P) dependent steroid dehydrogenase-like |
| chr11_-_40383013 | 4.07 |
ENSDART00000112140
|
fam213b
|
family with sequence similarity 213, member B |
| chr15_-_27845198 | 4.05 |
|
|
|
| chr7_+_34523324 | 4.05 |
ENSDART00000173456
|
esrp2
|
epithelial splicing regulatory protein 2 |
| chr21_-_41611442 | 4.04 |
ENSDART00000100039
|
pcyox1l
|
prenylcysteine oxidase 1 like |
| chr7_+_15479700 | 4.04 |
|
|
|
| chr20_-_25587274 | 4.04 |
ENSDART00000141340
|
si:dkey-183n20.15
|
si:dkey-183n20.15 |
| chr2_+_1645259 | 4.01 |
ENSDART00000155956
|
ssx2ipa
|
synovial sarcoma, X breakpoint 2 interacting protein a |
| chr5_-_12592887 | 4.01 |
|
|
|
| chr7_+_36195907 | 4.00 |
ENSDART00000138893
|
aktip
|
akt interacting protein |
| chr22_-_29740737 | 4.00 |
ENSDART00000009223
|
pdcd4b
|
programmed cell death 4b |
| chr23_-_42918166 | 3.99 |
ENSDART00000102328
|
pfkfb2a
|
6-phosphofructo-2-kinase/fructose-2,6-biphosphatase 2a |
| chr10_-_35313462 | 3.96 |
ENSDART00000139107
|
prr11
|
proline rich 11 |
| chr12_+_46242558 | 3.95 |
ENSDART00000167510
|
hid1b
|
HID1 domain containing b |
| chr13_-_31267133 | 3.95 |
ENSDART00000008287
|
pgam1a
|
phosphoglycerate mutase 1a |
| chr17_+_15527923 | 3.94 |
ENSDART00000148443
|
marcksb
|
myristoylated alanine-rich protein kinase C substrate b |
| chr8_-_51612689 | 3.94 |
ENSDART00000175779
|
kctd9a
|
potassium channel tetramerization domain containing 9a |
| chr7_+_15781933 | 3.94 |
ENSDART00000161669
|
immp1l
|
inner mitochondrial membrane peptidase subunit 1 |
| chr24_+_39339391 | 3.93 |
ENSDART00000168705
|
si:ch73-103b11.2
|
si:ch73-103b11.2 |
| chr11_-_10472636 | 3.91 |
ENSDART00000081827
|
ect2
|
epithelial cell transforming 2 |
| chr25_+_29873412 | 3.91 |
ENSDART00000067056
|
ticrr
|
TopBP1-interacting, checkpoint, and replication regulator |
| chr7_+_17701896 | 3.89 |
ENSDART00000113120
|
taf6l
|
TAF6-like RNA polymerase II, p300/CBP-associated factor (PCAF)-associated factor |
| chr1_-_11707244 | 3.88 |
ENSDART00000146067
|
sclt1
|
sodium channel and clathrin linker 1 |
| chr10_-_7862983 | 3.85 |
ENSDART00000160606
ENSDART00000112201 |
mat2aa
|
methionine adenosyltransferase II, alpha a |
| chr25_-_36621626 | 3.85 |
ENSDART00000128108
|
urahb
|
urate (5-hydroxyiso-) hydrolase b |
| chr22_-_16244069 | 3.85 |
ENSDART00000105681
|
cdc14ab
|
cell division cycle 14Ab |
| chr16_+_48772036 | 3.84 |
ENSDART00000148709
|
brd2b
|
bromodomain containing 2b |
| chr24_-_9850765 | 3.84 |
ENSDART00000137794
|
zgc:152652
|
zgc:152652 |
| chr11_+_30400284 | 3.83 |
ENSDART00000169833
|
gb:eh507706
|
expressed sequence EH507706 |
| chr21_-_22338324 | 3.83 |
ENSDART00000142034
|
CU466287.1
|
ENSDARG00000093473 |
| chr18_-_16948109 | 3.82 |
ENSDART00000100117
|
znf143b
|
zinc finger protein 143b |
| chr25_-_3619590 | 3.82 |
ENSDART00000037973
|
morc2
|
MORC family CW-type zinc finger 2 |
| chr1_-_1204375 | 3.82 |
ENSDART00000165762
|
CR450787.1
|
ENSDARG00000103469 |
| chr3_+_48607256 | 3.80 |
ENSDART00000168449
|
raver1
|
ribonucleoprotein, PTB-binding 1 |
| chr3_-_30778382 | 3.79 |
ENSDART00000025046
|
ppp1caa
|
protein phosphatase 1, catalytic subunit, alpha isozyme a |
Gene Ontology Analysis
Gene overrepresentation in biological process category:
| Log-likelihood per target | Total log-likelihood | Term | Description |
|---|---|---|---|
| 4.2 | 16.9 | GO:1902235 | regulation of endoplasmic reticulum stress-induced intrinsic apoptotic signaling pathway(GO:1902235) negative regulation of endoplasmic reticulum stress-induced intrinsic apoptotic signaling pathway(GO:1902236) |
| 3.5 | 14.1 | GO:0043622 | cortical microtubule organization(GO:0043622) |
| 3.4 | 10.2 | GO:0010992 | ubiquitin homeostasis(GO:0010992) |
| 3.0 | 9.1 | GO:0038055 | epithelial cell morphogenesis involved in gastrulation(GO:0003381) BMP secretion(GO:0038055) positive regulation of BMP secretion(GO:1900144) regulation of BMP secretion(GO:2001284) |
| 3.0 | 9.0 | GO:0030327 | prenylated protein catabolic process(GO:0030327) prenylcysteine catabolic process(GO:0030328) prenylcysteine metabolic process(GO:0030329) |
| 2.9 | 14.6 | GO:1900026 | positive regulation of substrate adhesion-dependent cell spreading(GO:1900026) |
| 2.8 | 8.4 | GO:2000303 | regulation of sphingolipid biosynthetic process(GO:0090153) negative regulation of sphingolipid biosynthetic process(GO:0090155) negative regulation of ceramide biosynthetic process(GO:1900060) regulation of membrane lipid metabolic process(GO:1905038) regulation of ceramide biosynthetic process(GO:2000303) |
| 2.5 | 17.5 | GO:0071539 | protein localization to centrosome(GO:0071539) |
| 2.4 | 7.3 | GO:0042754 | negative regulation of circadian rhythm(GO:0042754) |
| 2.3 | 7.0 | GO:0008356 | asymmetric cell division(GO:0008356) |
| 1.9 | 15.4 | GO:0051447 | negative regulation of meiotic nuclear division(GO:0045835) negative regulation of meiotic cell cycle(GO:0051447) |
| 1.9 | 9.5 | GO:0034723 | DNA replication-dependent nucleosome assembly(GO:0006335) DNA replication-dependent nucleosome organization(GO:0034723) |
| 1.8 | 5.4 | GO:0000741 | karyogamy(GO:0000741) pronuclear fusion(GO:0007344) |
| 1.8 | 12.3 | GO:0045647 | negative regulation of erythrocyte differentiation(GO:0045647) |
| 1.7 | 1.7 | GO:0071163 | DNA replication preinitiation complex assembly(GO:0071163) |
| 1.7 | 6.9 | GO:0019408 | dolichol biosynthetic process(GO:0019408) |
| 1.6 | 4.9 | GO:1900037 | regulation of cellular response to hypoxia(GO:1900037) |
| 1.6 | 6.4 | GO:0010662 | negative regulation of muscle cell apoptotic process(GO:0010656) muscle cell apoptotic process(GO:0010657) striated muscle cell apoptotic process(GO:0010658) regulation of muscle cell apoptotic process(GO:0010660) regulation of striated muscle cell apoptotic process(GO:0010662) negative regulation of striated muscle cell apoptotic process(GO:0010664) |
| 1.6 | 14.1 | GO:0019896 | axonal transport of mitochondrion(GO:0019896) |
| 1.5 | 15.4 | GO:0046548 | retinal rod cell development(GO:0046548) |
| 1.5 | 21.3 | GO:0007032 | endosome organization(GO:0007032) |
| 1.5 | 4.4 | GO:2000106 | leukocyte apoptotic process(GO:0071887) regulation of leukocyte apoptotic process(GO:2000106) |
| 1.4 | 4.2 | GO:0010259 | multicellular organism aging(GO:0010259) |
| 1.3 | 4.0 | GO:0090166 | Golgi disassembly(GO:0090166) |
| 1.3 | 7.7 | GO:0008210 | estrogen biosynthetic process(GO:0006703) estrogen metabolic process(GO:0008210) |
| 1.3 | 5.1 | GO:0035889 | otolith tethering(GO:0035889) |
| 1.3 | 11.3 | GO:0000912 | assembly of actomyosin apparatus involved in cytokinesis(GO:0000912) actomyosin contractile ring assembly(GO:0000915) actomyosin contractile ring organization(GO:0044837) |
| 1.3 | 3.8 | GO:0071947 | protein deubiquitination involved in ubiquitin-dependent protein catabolic process(GO:0071947) |
| 1.2 | 6.2 | GO:0000212 | meiotic spindle organization(GO:0000212) |
| 1.2 | 7.3 | GO:0052746 | inositol phosphorylation(GO:0052746) |
| 1.2 | 16.9 | GO:0035306 | positive regulation of dephosphorylation(GO:0035306) positive regulation of protein dephosphorylation(GO:0035307) |
| 1.1 | 3.4 | GO:0007008 | outer mitochondrial membrane organization(GO:0007008) protein import into mitochondrial outer membrane(GO:0045040) |
| 1.1 | 4.5 | GO:0006011 | UDP-glucose metabolic process(GO:0006011) |
| 1.1 | 5.6 | GO:0009082 | branched-chain amino acid biosynthetic process(GO:0009082) valine biosynthetic process(GO:0009099) |
| 1.1 | 3.3 | GO:0046485 | ether lipid metabolic process(GO:0046485) |
| 1.1 | 5.4 | GO:0061641 | chromatin remodeling at centromere(GO:0031055) CENP-A containing nucleosome assembly(GO:0034080) CENP-A containing chromatin organization(GO:0061641) |
| 1.1 | 4.3 | GO:0061072 | iris morphogenesis(GO:0061072) |
| 1.0 | 4.2 | GO:1900365 | positive regulation of mRNA polyadenylation(GO:1900365) |
| 1.0 | 8.1 | GO:0046850 | regulation of bone remodeling(GO:0046850) |
| 1.0 | 9.1 | GO:0000056 | ribosomal small subunit export from nucleus(GO:0000056) |
| 1.0 | 19.1 | GO:0060236 | regulation of mitotic spindle organization(GO:0060236) |
| 1.0 | 6.0 | GO:0019433 | triglyceride catabolic process(GO:0019433) |
| 1.0 | 4.0 | GO:0040016 | embryonic cleavage(GO:0040016) |
| 1.0 | 1.0 | GO:0072698 | protein localization to microtubule cytoskeleton(GO:0072698) |
| 1.0 | 7.9 | GO:0071233 | response to leucine(GO:0043201) cellular response to leucine(GO:0071233) regulation of response to reactive oxygen species(GO:1901031) |
| 1.0 | 13.8 | GO:0006003 | fructose 2,6-bisphosphate metabolic process(GO:0006003) |
| 1.0 | 3.9 | GO:0006627 | protein processing involved in protein targeting to mitochondrion(GO:0006627) |
| 1.0 | 1.0 | GO:1990535 | neuron projection maintenance(GO:1990535) |
| 1.0 | 10.8 | GO:0044154 | histone H3-K14 acetylation(GO:0044154) |
| 1.0 | 2.9 | GO:0019376 | galactosylceramide catabolic process(GO:0006683) galactolipid catabolic process(GO:0019376) |
| 1.0 | 3.9 | GO:0030728 | ovulation(GO:0030728) |
| 1.0 | 7.8 | GO:0034219 | carbohydrate transmembrane transport(GO:0034219) |
| 0.9 | 11.4 | GO:0018298 | protein-chromophore linkage(GO:0018298) |
| 0.9 | 2.8 | GO:0009443 | pyridoxal 5'-phosphate salvage(GO:0009443) |
| 0.9 | 1.9 | GO:0044806 | G-quadruplex DNA unwinding(GO:0044806) |
| 0.9 | 11.1 | GO:0018279 | protein N-linked glycosylation via asparagine(GO:0018279) |
| 0.9 | 3.7 | GO:2001271 | negative regulation of execution phase of apoptosis(GO:1900118) regulation of cysteine-type endopeptidase activity involved in execution phase of apoptosis(GO:2001270) negative regulation of cysteine-type endopeptidase activity involved in execution phase of apoptosis(GO:2001271) |
| 0.9 | 4.6 | GO:0045448 | regulation of mitotic cell cycle, embryonic(GO:0009794) mitotic cell cycle, embryonic(GO:0045448) |
| 0.9 | 2.8 | GO:0090141 | positive regulation of mitochondrial fission(GO:0090141) |
| 0.9 | 4.6 | GO:1904871 | positive regulation of protein localization to nucleus(GO:1900182) regulation of protein localization to Cajal body(GO:1904869) positive regulation of protein localization to Cajal body(GO:1904871) |
| 0.9 | 2.7 | GO:0034316 | negative regulation of Arp2/3 complex-mediated actin nucleation(GO:0034316) actin filament debranching(GO:0071846) |
| 0.9 | 7.1 | GO:0032467 | positive regulation of cytokinesis(GO:0032467) |
| 0.9 | 2.6 | GO:0036037 | CD8-positive, alpha-beta T cell activation(GO:0036037) |
| 0.9 | 3.4 | GO:0006751 | glutathione catabolic process(GO:0006751) |
| 0.8 | 5.0 | GO:0006382 | adenosine to inosine editing(GO:0006382) |
| 0.8 | 5.0 | GO:0007080 | mitotic metaphase plate congression(GO:0007080) |
| 0.8 | 5.8 | GO:0051256 | mitotic spindle elongation(GO:0000022) spindle elongation(GO:0051231) mitotic spindle midzone assembly(GO:0051256) |
| 0.8 | 9.8 | GO:0006607 | NLS-bearing protein import into nucleus(GO:0006607) |
| 0.8 | 3.2 | GO:1904262 | negative regulation of TORC1 signaling(GO:1904262) |
| 0.8 | 5.6 | GO:0000305 | response to superoxide(GO:0000303) response to oxygen radical(GO:0000305) removal of superoxide radicals(GO:0019430) cellular response to oxygen radical(GO:0071450) cellular response to superoxide(GO:0071451) cellular oxidant detoxification(GO:0098869) cellular detoxification(GO:1990748) |
| 0.8 | 17.2 | GO:0032007 | negative regulation of TOR signaling(GO:0032007) |
| 0.8 | 3.9 | GO:0030174 | regulation of DNA-dependent DNA replication initiation(GO:0030174) |
| 0.8 | 6.2 | GO:0071594 | T cell differentiation in thymus(GO:0033077) thymocyte aggregation(GO:0071594) |
| 0.7 | 8.2 | GO:0000002 | mitochondrial genome maintenance(GO:0000002) |
| 0.7 | 3.7 | GO:0007143 | female meiotic division(GO:0007143) |
| 0.7 | 3.6 | GO:0060217 | hemangioblast cell differentiation(GO:0060217) |
| 0.7 | 2.1 | GO:0032480 | negative regulation of type I interferon production(GO:0032480) |
| 0.7 | 1.4 | GO:0007063 | regulation of sister chromatid cohesion(GO:0007063) regulation of cohesin loading(GO:0071922) |
| 0.7 | 2.1 | GO:1902808 | positive regulation of cell cycle G1/S phase transition(GO:1902808) |
| 0.7 | 3.4 | GO:0010159 | specification of organ position(GO:0010159) |
| 0.7 | 2.7 | GO:0042276 | error-prone translesion synthesis(GO:0042276) |
| 0.6 | 3.9 | GO:2000767 | positive regulation of cytoplasmic translation(GO:2000767) |
| 0.6 | 1.9 | GO:0033523 | histone H2B ubiquitination(GO:0033523) |
| 0.6 | 1.3 | GO:0046655 | folic acid metabolic process(GO:0046655) |
| 0.6 | 5.7 | GO:0043696 | dedifferentiation(GO:0043696) cell dedifferentiation(GO:0043697) |
| 0.6 | 16.4 | GO:0043297 | apical junction assembly(GO:0043297) bicellular tight junction assembly(GO:0070830) |
| 0.6 | 1.8 | GO:0046247 | carotene metabolic process(GO:0016119) carotene catabolic process(GO:0016121) terpene metabolic process(GO:0042214) terpene catabolic process(GO:0046247) |
| 0.6 | 3.7 | GO:0034035 | sulfate assimilation(GO:0000103) purine ribonucleoside bisphosphate metabolic process(GO:0034035) purine ribonucleoside bisphosphate biosynthetic process(GO:0034036) 3'-phosphoadenosine 5'-phosphosulfate metabolic process(GO:0050427) 3'-phosphoadenosine 5'-phosphosulfate biosynthetic process(GO:0050428) |
| 0.6 | 3.0 | GO:0006566 | threonine metabolic process(GO:0006566) threonine catabolic process(GO:0006567) |
| 0.6 | 10.2 | GO:0007339 | binding of sperm to zona pellucida(GO:0007339) sperm-egg recognition(GO:0035036) egg coat formation(GO:0035803) regulation of acrosome reaction(GO:0060046) positive regulation of acrosome reaction(GO:2000344) |
| 0.6 | 1.8 | GO:0000019 | regulation of mitotic recombination(GO:0000019) |
| 0.6 | 10.2 | GO:0009648 | photoperiodism(GO:0009648) |
| 0.6 | 4.1 | GO:0060282 | positive regulation of oocyte development(GO:0060282) |
| 0.6 | 1.8 | GO:0002793 | positive regulation of peptide secretion(GO:0002793) positive regulation of insulin secretion(GO:0032024) positive regulation of hormone secretion(GO:0046887) positive regulation of peptide hormone secretion(GO:0090277) |
| 0.6 | 1.8 | GO:0046048 | pyrimidine ribonucleoside diphosphate metabolic process(GO:0009193) UDP metabolic process(GO:0046048) |
| 0.6 | 5.2 | GO:0000290 | deadenylation-dependent decapping of nuclear-transcribed mRNA(GO:0000290) |
| 0.6 | 2.3 | GO:0031443 | fast-twitch skeletal muscle fiber contraction(GO:0031443) |
| 0.6 | 14.1 | GO:0030150 | protein import into mitochondrial matrix(GO:0030150) |
| 0.6 | 5.1 | GO:0034587 | piRNA metabolic process(GO:0034587) |
| 0.6 | 2.8 | GO:0042985 | negative regulation of glycoprotein biosynthetic process(GO:0010561) negative regulation of amyloid precursor protein biosynthetic process(GO:0042985) negative regulation of glycoprotein metabolic process(GO:1903019) |
| 0.6 | 1.7 | GO:0035964 | COPI-coated vesicle budding(GO:0035964) Golgi transport vesicle coating(GO:0048200) COPI coating of Golgi vesicle(GO:0048205) |
| 0.5 | 3.8 | GO:0016255 | attachment of GPI anchor to protein(GO:0016255) |
| 0.5 | 3.1 | GO:0003222 | ventricular trabecula myocardium morphogenesis(GO:0003222) |
| 0.5 | 5.7 | GO:0009303 | rRNA transcription(GO:0009303) |
| 0.5 | 1.0 | GO:0033211 | adiponectin-activated signaling pathway(GO:0033211) |
| 0.5 | 1.0 | GO:0045601 | regulation of endothelial cell differentiation(GO:0045601) |
| 0.5 | 6.0 | GO:0000302 | response to reactive oxygen species(GO:0000302) |
| 0.5 | 4.9 | GO:0008105 | asymmetric protein localization(GO:0008105) apical protein localization(GO:0045176) |
| 0.5 | 2.9 | GO:0032878 | regulation of establishment or maintenance of cell polarity(GO:0032878) |
| 0.5 | 9.2 | GO:0031100 | organ regeneration(GO:0031100) |
| 0.5 | 5.3 | GO:0045199 | maintenance of cell polarity(GO:0030011) maintenance of apical/basal cell polarity(GO:0035090) maintenance of epithelial cell apical/basal polarity(GO:0045199) |
| 0.5 | 1.9 | GO:0045337 | farnesyl diphosphate biosynthetic process(GO:0045337) |
| 0.5 | 6.1 | GO:0051443 | positive regulation of ubiquitin-protein transferase activity(GO:0051443) |
| 0.5 | 4.7 | GO:0031573 | intra-S DNA damage checkpoint(GO:0031573) |
| 0.5 | 8.7 | GO:0006144 | purine nucleobase metabolic process(GO:0006144) |
| 0.5 | 2.7 | GO:1904031 | positive regulation of cyclin-dependent protein serine/threonine kinase activity(GO:0045737) positive regulation of cyclin-dependent protein kinase activity(GO:1904031) |
| 0.5 | 0.9 | GO:1900180 | regulation of protein localization to nucleus(GO:1900180) |
| 0.4 | 1.8 | GO:1901522 | hatching gland development(GO:0048785) positive regulation of transcription from RNA polymerase II promoter involved in cellular response to chemical stimulus(GO:1901522) |
| 0.4 | 18.8 | GO:0009060 | aerobic respiration(GO:0009060) |
| 0.4 | 1.8 | GO:0030238 | male sex determination(GO:0030238) androst-4-ene-3,17-dione biosynthetic process(GO:1903449) |
| 0.4 | 16.6 | GO:0001878 | response to yeast(GO:0001878) |
| 0.4 | 1.3 | GO:0098535 | de novo centriole assembly(GO:0098535) |
| 0.4 | 5.1 | GO:0006556 | S-adenosylmethionine biosynthetic process(GO:0006556) |
| 0.4 | 2.5 | GO:0035264 | multicellular organism growth(GO:0035264) |
| 0.4 | 2.1 | GO:0031507 | heterochromatin assembly(GO:0031507) |
| 0.4 | 6.2 | GO:0010972 | negative regulation of G2/M transition of mitotic cell cycle(GO:0010972) |
| 0.4 | 1.7 | GO:0051150 | regulation of smooth muscle cell differentiation(GO:0051150) negative regulation of smooth muscle cell differentiation(GO:0051151) |
| 0.4 | 2.9 | GO:0070098 | chemokine-mediated signaling pathway(GO:0070098) |
| 0.4 | 2.9 | GO:0070987 | error-free translesion synthesis(GO:0070987) |
| 0.4 | 7.4 | GO:0019933 | cAMP-mediated signaling(GO:0019933) |
| 0.4 | 1.6 | GO:0032483 | regulation of Rab protein signal transduction(GO:0032483) |
| 0.4 | 0.8 | GO:0035513 | oxidative RNA demethylation(GO:0035513) |
| 0.4 | 1.6 | GO:0051121 | lipoxygenase pathway(GO:0019372) linoleic acid metabolic process(GO:0043651) hepoxilin metabolic process(GO:0051121) hepoxilin biosynthetic process(GO:0051122) |
| 0.4 | 0.8 | GO:0006857 | oligopeptide transport(GO:0006857) |
| 0.4 | 1.2 | GO:0006108 | malate metabolic process(GO:0006108) |
| 0.4 | 1.6 | GO:1903726 | negative regulation of phospholipid metabolic process(GO:1903726) |
| 0.4 | 2.4 | GO:0000492 | box C/D snoRNP assembly(GO:0000492) |
| 0.4 | 1.6 | GO:0006369 | termination of RNA polymerase II transcription(GO:0006369) |
| 0.4 | 2.8 | GO:0044773 | mitotic DNA damage checkpoint(GO:0044773) mitotic DNA integrity checkpoint(GO:0044774) |
| 0.4 | 1.2 | GO:0051659 | maintenance of mitochondrion location(GO:0051659) |
| 0.4 | 1.6 | GO:0010452 | histone H3-K36 methylation(GO:0010452) |
| 0.4 | 2.7 | GO:2000479 | regulation of cAMP-dependent protein kinase activity(GO:2000479) negative regulation of cAMP-dependent protein kinase activity(GO:2000480) |
| 0.4 | 2.3 | GO:0072386 | plus-end-directed vesicle transport along microtubule(GO:0072383) plus-end-directed organelle transport along microtubule(GO:0072386) |
| 0.4 | 4.6 | GO:2000601 | positive regulation of actin nucleation(GO:0051127) positive regulation of Arp2/3 complex-mediated actin nucleation(GO:2000601) |
| 0.4 | 1.1 | GO:0044375 | regulation of peroxisome size(GO:0044375) |
| 0.4 | 2.3 | GO:0006020 | inositol metabolic process(GO:0006020) |
| 0.4 | 1.5 | GO:1990519 | pyrimidine nucleotide transport(GO:0006864) mitochondrial pyrimidine nucleotide import(GO:1990519) |
| 0.4 | 4.1 | GO:0030719 | P granule organization(GO:0030719) |
| 0.4 | 16.5 | GO:1904029 | regulation of cyclin-dependent protein serine/threonine kinase activity(GO:0000079) regulation of cyclin-dependent protein kinase activity(GO:1904029) |
| 0.4 | 3.6 | GO:0033046 | negative regulation of sister chromatid segregation(GO:0033046) negative regulation of mitotic sister chromatid segregation(GO:0033048) negative regulation of chromosome segregation(GO:0051985) negative regulation of mitotic sister chromatid separation(GO:2000816) |
| 0.4 | 7.9 | GO:0038034 | signal transduction in absence of ligand(GO:0038034) extrinsic apoptotic signaling pathway in absence of ligand(GO:0097192) |
| 0.4 | 1.4 | GO:1901052 | sarcosine metabolic process(GO:1901052) |
| 0.4 | 2.1 | GO:0009446 | putrescine biosynthetic process(GO:0009446) |
| 0.4 | 3.9 | GO:0034030 | nucleoside bisphosphate biosynthetic process(GO:0033866) ribonucleoside bisphosphate biosynthetic process(GO:0034030) purine nucleoside bisphosphate biosynthetic process(GO:0034033) |
| 0.3 | 6.3 | GO:0016114 | terpenoid biosynthetic process(GO:0016114) |
| 0.3 | 4.5 | GO:0050852 | T cell receptor signaling pathway(GO:0050852) |
| 0.3 | 1.0 | GO:0034198 | cellular response to amino acid starvation(GO:0034198) |
| 0.3 | 1.0 | GO:0001961 | positive regulation of cytokine-mediated signaling pathway(GO:0001961) positive regulation of response to cytokine stimulus(GO:0060760) |
| 0.3 | 4.4 | GO:0031297 | replication fork processing(GO:0031297) |
| 0.3 | 1.7 | GO:0010826 | negative regulation of centrosome duplication(GO:0010826) negative regulation of centriole replication(GO:0046600) negative regulation of centrosome cycle(GO:0046606) |
| 0.3 | 3.0 | GO:1903432 | regulation of TORC1 signaling(GO:1903432) |
| 0.3 | 6.0 | GO:0071482 | cellular response to light stimulus(GO:0071482) |
| 0.3 | 1.0 | GO:0030279 | negative regulation of ossification(GO:0030279) |
| 0.3 | 3.2 | GO:0070252 | actin-mediated cell contraction(GO:0070252) |
| 0.3 | 3.8 | GO:0016926 | protein desumoylation(GO:0016926) |
| 0.3 | 6.8 | GO:0006998 | nuclear envelope organization(GO:0006998) |
| 0.3 | 1.5 | GO:0032367 | intracellular cholesterol transport(GO:0032367) |
| 0.3 | 5.9 | GO:0000077 | DNA damage checkpoint(GO:0000077) |
| 0.3 | 2.2 | GO:0070734 | histone H3-K27 methylation(GO:0070734) |
| 0.3 | 5.8 | GO:0006303 | double-strand break repair via nonhomologous end joining(GO:0006303) |
| 0.3 | 3.3 | GO:1902110 | positive regulation of mitochondrial membrane permeability(GO:0035794) mitochondrial outer membrane permeabilization(GO:0097345) positive regulation of mitochondrial membrane permeability involved in apoptotic process(GO:1902110) mitochondrial outer membrane permeabilization involved in programmed cell death(GO:1902686) |
| 0.3 | 2.1 | GO:1901911 | purine nucleoside monophosphate catabolic process(GO:0009128) ribonucleoside monophosphate catabolic process(GO:0009158) purine ribonucleoside monophosphate catabolic process(GO:0009169) diphosphoinositol polyphosphate metabolic process(GO:0071543) diadenosine pentaphosphate metabolic process(GO:1901906) diadenosine pentaphosphate catabolic process(GO:1901907) diadenosine hexaphosphate metabolic process(GO:1901908) diadenosine hexaphosphate catabolic process(GO:1901909) adenosine 5'-(hexahydrogen pentaphosphate) metabolic process(GO:1901910) adenosine 5'-(hexahydrogen pentaphosphate) catabolic process(GO:1901911) |
| 0.3 | 4.5 | GO:0032418 | lysosome localization(GO:0032418) |
| 0.3 | 1.5 | GO:1903513 | protein exit from endoplasmic reticulum(GO:0032527) endoplasmic reticulum to cytosol transport(GO:1903513) |
| 0.3 | 1.2 | GO:0019369 | arachidonic acid metabolic process(GO:0019369) |
| 0.3 | 6.5 | GO:0071391 | cellular response to estrogen stimulus(GO:0071391) |
| 0.3 | 1.9 | GO:0018160 | peptidyl-pyrromethane cofactor linkage(GO:0018160) |
| 0.3 | 1.7 | GO:0031112 | positive regulation of microtubule polymerization or depolymerization(GO:0031112) positive regulation of microtubule polymerization(GO:0031116) |
| 0.3 | 0.5 | GO:0045933 | positive regulation of muscle contraction(GO:0045933) |
| 0.3 | 2.2 | GO:0006693 | prostanoid metabolic process(GO:0006692) prostaglandin metabolic process(GO:0006693) |
| 0.3 | 14.4 | GO:0006096 | glycolytic process(GO:0006096) |
| 0.3 | 5.3 | GO:0072662 | protein targeting to peroxisome(GO:0006625) peroxisomal transport(GO:0043574) protein localization to peroxisome(GO:0072662) establishment of protein localization to peroxisome(GO:0072663) |
| 0.3 | 2.9 | GO:1902850 | mitotic spindle assembly(GO:0090307) microtubule cytoskeleton organization involved in mitosis(GO:1902850) |
| 0.3 | 2.3 | GO:0006754 | ATP biosynthetic process(GO:0006754) |
| 0.3 | 1.0 | GO:0010566 | regulation of ketone biosynthetic process(GO:0010566) protein demalonylation(GO:0036046) peptidyl-lysine demalonylation(GO:0036047) protein desuccinylation(GO:0036048) peptidyl-lysine desuccinylation(GO:0036049) protein deglutarylation(GO:0061698) |
| 0.2 | 0.7 | GO:0051988 | regulation of attachment of spindle microtubules to kinetochore(GO:0051988) |
| 0.2 | 1.0 | GO:0048208 | vesicle targeting, rough ER to cis-Golgi(GO:0048207) COPII vesicle coating(GO:0048208) |
| 0.2 | 8.4 | GO:0009615 | response to virus(GO:0009615) |
| 0.2 | 0.7 | GO:0019364 | pyridine nucleotide catabolic process(GO:0019364) NAD catabolic process(GO:0019677) pyridine-containing compound catabolic process(GO:0072526) |
| 0.2 | 3.6 | GO:0010737 | protein kinase A signaling(GO:0010737) |
| 0.2 | 3.5 | GO:0061647 | histone H3-K9 methylation(GO:0051567) histone H3-K9 modification(GO:0061647) |
| 0.2 | 2.8 | GO:0018095 | protein polyglutamylation(GO:0018095) |
| 0.2 | 6.5 | GO:0033559 | unsaturated fatty acid metabolic process(GO:0033559) |
| 0.2 | 1.2 | GO:0045162 | clustering of voltage-gated sodium channels(GO:0045162) |
| 0.2 | 1.8 | GO:0050829 | defense response to Gram-negative bacterium(GO:0050829) |
| 0.2 | 5.5 | GO:0021952 | central nervous system projection neuron axonogenesis(GO:0021952) |
| 0.2 | 4.1 | GO:0006363 | termination of RNA polymerase I transcription(GO:0006363) |
| 0.2 | 0.5 | GO:0003197 | endocardial cushion development(GO:0003197) |
| 0.2 | 2.9 | GO:0042407 | cristae formation(GO:0042407) |
| 0.2 | 0.9 | GO:0006210 | thymine catabolic process(GO:0006210) thymine metabolic process(GO:0019859) |
| 0.2 | 1.3 | GO:0061298 | retina vasculature development in camera-type eye(GO:0061298) |
| 0.2 | 2.6 | GO:0000712 | resolution of meiotic recombination intermediates(GO:0000712) |
| 0.2 | 3.0 | GO:0006048 | UDP-N-acetylglucosamine biosynthetic process(GO:0006048) amino sugar biosynthetic process(GO:0046349) |
| 0.2 | 0.6 | GO:0051255 | spindle midzone assembly(GO:0051255) |
| 0.2 | 1.7 | GO:0042953 | lipoprotein transport(GO:0042953) lipoprotein localization(GO:0044872) |
| 0.2 | 9.7 | GO:0006367 | transcription initiation from RNA polymerase II promoter(GO:0006367) |
| 0.2 | 1.3 | GO:0045880 | positive regulation of smoothened signaling pathway(GO:0045880) |
| 0.2 | 4.0 | GO:0031163 | iron-sulfur cluster assembly(GO:0016226) metallo-sulfur cluster assembly(GO:0031163) |
| 0.2 | 0.8 | GO:0003262 | endocardial progenitor cell migration to the midline involved in heart field formation(GO:0003262) |
| 0.2 | 5.0 | GO:0043039 | amino acid activation(GO:0043038) tRNA aminoacylation(GO:0043039) |
| 0.2 | 3.3 | GO:0071542 | dopaminergic neuron differentiation(GO:0071542) |
| 0.2 | 1.6 | GO:0010591 | regulation of lamellipodium assembly(GO:0010591) regulation of lamellipodium organization(GO:1902743) |
| 0.2 | 2.0 | GO:0035025 | positive regulation of Rho protein signal transduction(GO:0035025) |
| 0.2 | 1.2 | GO:0043162 | ubiquitin-dependent protein catabolic process via the multivesicular body sorting pathway(GO:0043162) |
| 0.2 | 2.8 | GO:0030593 | neutrophil chemotaxis(GO:0030593) granulocyte chemotaxis(GO:0071621) |
| 0.2 | 1.8 | GO:0007205 | protein kinase C-activating G-protein coupled receptor signaling pathway(GO:0007205) |
| 0.2 | 3.3 | GO:0035914 | skeletal muscle cell differentiation(GO:0035914) |
| 0.2 | 0.2 | GO:0016446 | somatic diversification of immune receptors via somatic mutation(GO:0002566) somatic hypermutation of immunoglobulin genes(GO:0016446) |
| 0.2 | 5.2 | GO:0045324 | late endosome to vacuole transport(GO:0045324) |
| 0.2 | 14.6 | GO:0006487 | protein N-linked glycosylation(GO:0006487) |
| 0.2 | 0.9 | GO:0003139 | secondary heart field specification(GO:0003139) |
| 0.2 | 2.6 | GO:0006884 | cell volume homeostasis(GO:0006884) |
| 0.2 | 1.7 | GO:0019682 | pentose-phosphate shunt(GO:0006098) glyceraldehyde-3-phosphate metabolic process(GO:0019682) |
| 0.2 | 0.6 | GO:0060876 | semicircular canal formation(GO:0060876) |
| 0.2 | 4.2 | GO:0097191 | extrinsic apoptotic signaling pathway(GO:0097191) |
| 0.2 | 8.6 | GO:0009950 | dorsal/ventral axis specification(GO:0009950) |
| 0.2 | 0.4 | GO:0007141 | male meiosis(GO:0007140) male meiosis I(GO:0007141) |
| 0.2 | 0.7 | GO:0010668 | ectodermal cell fate commitment(GO:0001712) ectodermal cell fate specification(GO:0001715) ectodermal cell differentiation(GO:0010668) regulation of ectodermal cell fate specification(GO:0042665) regulation of ectoderm development(GO:2000383) |
| 0.2 | 1.9 | GO:0016486 | peptide hormone processing(GO:0016486) |
| 0.2 | 1.7 | GO:0035493 | SNARE complex assembly(GO:0035493) |
| 0.2 | 1.7 | GO:0055117 | regulation of cardiac muscle contraction(GO:0055117) |
| 0.2 | 1.0 | GO:0042769 | DNA damage response, detection of DNA damage(GO:0042769) |
| 0.2 | 0.5 | GO:0097355 | protein localization to heterochromatin(GO:0097355) |
| 0.2 | 1.0 | GO:0099517 | anterograde synaptic vesicle transport(GO:0048490) synaptic vesicle cytoskeletal transport(GO:0099514) synaptic vesicle transport along microtubule(GO:0099517) |
| 0.2 | 0.3 | GO:0006013 | mannose metabolic process(GO:0006013) |
| 0.2 | 1.2 | GO:1901379 | regulation of potassium ion transmembrane transport(GO:1901379) |
| 0.2 | 10.6 | GO:0006334 | nucleosome assembly(GO:0006334) |
| 0.2 | 8.0 | GO:0018345 | protein palmitoylation(GO:0018345) |
| 0.2 | 0.5 | GO:0097201 | negative regulation of transcription from RNA polymerase II promoter in response to stress(GO:0097201) |
| 0.2 | 1.4 | GO:0006611 | protein export from nucleus(GO:0006611) |
| 0.2 | 1.4 | GO:0007052 | mitotic spindle organization(GO:0007052) |
| 0.2 | 2.7 | GO:0007093 | mitotic cell cycle checkpoint(GO:0007093) |
| 0.2 | 4.6 | GO:0051225 | spindle assembly(GO:0051225) |
| 0.2 | 7.5 | GO:0005977 | glycogen metabolic process(GO:0005977) cellular glucan metabolic process(GO:0006073) energy reserve metabolic process(GO:0006112) glucan metabolic process(GO:0044042) |
| 0.2 | 4.1 | GO:0000289 | nuclear-transcribed mRNA poly(A) tail shortening(GO:0000289) |
| 0.2 | 2.2 | GO:0035622 | intrahepatic bile duct development(GO:0035622) |
| 0.2 | 1.1 | GO:0046835 | carbohydrate phosphorylation(GO:0046835) |
| 0.2 | 2.4 | GO:0048268 | clathrin coat assembly(GO:0048268) |
| 0.2 | 0.3 | GO:0006101 | citrate metabolic process(GO:0006101) tricarboxylic acid metabolic process(GO:0072350) |
| 0.2 | 2.0 | GO:0098734 | protein depalmitoylation(GO:0002084) macromolecule depalmitoylation(GO:0098734) |
| 0.2 | 3.6 | GO:0051085 | chaperone mediated protein folding requiring cofactor(GO:0051085) |
| 0.1 | 1.5 | GO:0007584 | response to nutrient(GO:0007584) |
| 0.1 | 1.8 | GO:0015701 | bicarbonate transport(GO:0015701) |
| 0.1 | 8.8 | GO:0061640 | cytoskeleton-dependent cytokinesis(GO:0061640) |
| 0.1 | 0.9 | GO:0006750 | glutathione biosynthetic process(GO:0006750) |
| 0.1 | 1.8 | GO:0097499 | protein localization to nonmotile primary cilium(GO:0097499) |
| 0.1 | 0.4 | GO:0006772 | thiamine metabolic process(GO:0006772) thiamine diphosphate metabolic process(GO:0042357) thiamine-containing compound metabolic process(GO:0042723) |
| 0.1 | 0.4 | GO:0031293 | membrane protein intracellular domain proteolysis(GO:0031293) |
| 0.1 | 1.6 | GO:0015693 | magnesium ion transport(GO:0015693) |
| 0.1 | 1.5 | GO:0001973 | adenosine receptor signaling pathway(GO:0001973) purinergic receptor signaling pathway(GO:0035587) G-protein coupled purinergic receptor signaling pathway(GO:0035588) |
| 0.1 | 0.9 | GO:0010692 | regulation of alkaline phosphatase activity(GO:0010692) negative regulation of alkaline phosphatase activity(GO:0010693) |
| 0.1 | 2.3 | GO:0070816 | phosphorylation of RNA polymerase II C-terminal domain(GO:0070816) |
| 0.1 | 4.1 | GO:0031110 | regulation of microtubule polymerization or depolymerization(GO:0031110) |
| 0.1 | 0.3 | GO:2001244 | positive regulation of intrinsic apoptotic signaling pathway(GO:2001244) |
| 0.1 | 1.5 | GO:0043486 | histone exchange(GO:0043486) |
| 0.1 | 0.7 | GO:0070584 | mitochondrion morphogenesis(GO:0070584) |
| 0.1 | 3.4 | GO:0007050 | cell cycle arrest(GO:0007050) |
| 0.1 | 2.3 | GO:0007131 | reciprocal meiotic recombination(GO:0007131) |
| 0.1 | 13.7 | GO:0034976 | response to endoplasmic reticulum stress(GO:0034976) |
| 0.1 | 0.8 | GO:0060999 | positive regulation of dendritic spine development(GO:0060999) |
| 0.1 | 1.5 | GO:0006298 | mismatch repair(GO:0006298) |
| 0.1 | 2.6 | GO:0031952 | regulation of protein autophosphorylation(GO:0031952) |
| 0.1 | 0.5 | GO:0010677 | negative regulation of cellular carbohydrate metabolic process(GO:0010677) negative regulation of gluconeogenesis(GO:0045721) negative regulation of carbohydrate metabolic process(GO:0045912) |
| 0.1 | 0.8 | GO:1901223 | negative regulation of NIK/NF-kappaB signaling(GO:1901223) |
| 0.1 | 1.2 | GO:0042771 | intrinsic apoptotic signaling pathway in response to DNA damage by p53 class mediator(GO:0042771) |
| 0.1 | 0.8 | GO:0071108 | protein K48-linked deubiquitination(GO:0071108) |
| 0.1 | 1.4 | GO:0042632 | cholesterol homeostasis(GO:0042632) sterol homeostasis(GO:0055092) |
| 0.1 | 5.2 | GO:0006891 | intra-Golgi vesicle-mediated transport(GO:0006891) |
| 0.1 | 2.7 | GO:0031349 | positive regulation of defense response(GO:0031349) positive regulation of innate immune response(GO:0045089) |
| 0.1 | 2.3 | GO:0080171 | lysosome organization(GO:0007040) lytic vacuole organization(GO:0080171) |
| 0.1 | 0.5 | GO:0070189 | tryptophan catabolic process to kynurenine(GO:0019441) kynurenine metabolic process(GO:0070189) |
| 0.1 | 0.5 | GO:0000423 | macromitophagy(GO:0000423) |
| 0.1 | 1.0 | GO:0034312 | diol biosynthetic process(GO:0034312) sphingosine biosynthetic process(GO:0046512) |
| 0.1 | 2.2 | GO:0048263 | determination of dorsal identity(GO:0048263) |
| 0.1 | 0.2 | GO:0043252 | sodium-independent organic anion transport(GO:0043252) |
| 0.1 | 0.6 | GO:0060575 | intestinal epithelial cell differentiation(GO:0060575) |
| 0.1 | 0.5 | GO:0055064 | chloride ion homeostasis(GO:0055064) |
| 0.1 | 0.5 | GO:0046901 | tetrahydrofolylpolyglutamate biosynthetic process(GO:0046901) |
| 0.1 | 4.0 | GO:0015914 | phospholipid transport(GO:0015914) |
| 0.1 | 1.8 | GO:0060837 | blood vessel endothelial cell differentiation(GO:0060837) |
| 0.1 | 0.3 | GO:0070198 | negative regulation of telomere maintenance via telomerase(GO:0032211) protein localization to chromosome, telomeric region(GO:0070198) negative regulation of telomere maintenance via telomere lengthening(GO:1904357) |
| 0.1 | 3.6 | GO:0035023 | regulation of Rho protein signal transduction(GO:0035023) |
| 0.1 | 0.9 | GO:1903292 | protein localization to Golgi membrane(GO:1903292) |
| 0.1 | 5.4 | GO:0051260 | protein homooligomerization(GO:0051260) |
| 0.1 | 3.0 | GO:0006446 | regulation of translational initiation(GO:0006446) |
| 0.1 | 1.5 | GO:0036297 | interstrand cross-link repair(GO:0036297) |
| 0.1 | 2.0 | GO:0071230 | cellular response to amino acid stimulus(GO:0071230) |
| 0.1 | 1.1 | GO:0034472 | snRNA 3'-end processing(GO:0034472) |
| 0.1 | 0.5 | GO:0055129 | proline biosynthetic process(GO:0006561) L-proline biosynthetic process(GO:0055129) |
| 0.1 | 1.6 | GO:0032943 | mononuclear cell proliferation(GO:0032943) T cell proliferation(GO:0042098) lymphocyte proliferation(GO:0046651) leukocyte proliferation(GO:0070661) |
| 0.1 | 1.0 | GO:0043507 | activation of JUN kinase activity(GO:0007257) positive regulation of JUN kinase activity(GO:0043507) |
| 0.1 | 1.5 | GO:0035778 | pronephric nephron tubule epithelial cell differentiation(GO:0035778) cell differentiation involved in pronephros development(GO:0039014) |
| 0.1 | 2.4 | GO:0035845 | photoreceptor cell outer segment organization(GO:0035845) |
| 0.1 | 0.4 | GO:1904356 | regulation of telomere maintenance via telomere lengthening(GO:1904356) |
| 0.1 | 0.2 | GO:0043508 | negative regulation of JUN kinase activity(GO:0043508) |
| 0.1 | 0.4 | GO:0007100 | mitotic centrosome separation(GO:0007100) centrosome separation(GO:0051299) |
| 0.1 | 2.8 | GO:0000462 | maturation of SSU-rRNA from tricistronic rRNA transcript (SSU-rRNA, 5.8S rRNA, LSU-rRNA)(GO:0000462) |
| 0.1 | 10.3 | GO:0006869 | lipid transport(GO:0006869) |
| 0.1 | 0.2 | GO:0021979 | hypothalamus cell differentiation(GO:0021979) |
| 0.1 | 0.3 | GO:0006269 | DNA replication, synthesis of RNA primer(GO:0006269) |
| 0.1 | 0.7 | GO:0006686 | sphingomyelin biosynthetic process(GO:0006686) |
| 0.1 | 0.4 | GO:0032790 | ribosome disassembly(GO:0032790) |
| 0.1 | 7.5 | GO:0006888 | ER to Golgi vesicle-mediated transport(GO:0006888) |
| 0.1 | 42.0 | GO:0016567 | protein ubiquitination(GO:0016567) |
| 0.1 | 0.3 | GO:0071047 | U1 snRNA 3'-end processing(GO:0034473) U5 snRNA 3'-end processing(GO:0034476) nuclear polyadenylation-dependent mRNA catabolic process(GO:0071042) polyadenylation-dependent mRNA catabolic process(GO:0071047) |
| 0.1 | 4.6 | GO:0016575 | histone deacetylation(GO:0016575) |
| 0.1 | 0.2 | GO:1990402 | embryonic liver development(GO:1990402) |
| 0.1 | 0.5 | GO:0051601 | exocyst localization(GO:0051601) |
| 0.1 | 0.4 | GO:0070212 | protein poly-ADP-ribosylation(GO:0070212) |
| 0.1 | 1.6 | GO:0090502 | RNA phosphodiester bond hydrolysis, endonucleolytic(GO:0090502) |
| 0.1 | 2.5 | GO:0000184 | nuclear-transcribed mRNA catabolic process, nonsense-mediated decay(GO:0000184) |
| 0.1 | 0.2 | GO:0007340 | acrosome reaction(GO:0007340) |
| 0.1 | 0.9 | GO:2000779 | regulation of double-strand break repair(GO:2000779) |
| 0.1 | 0.2 | GO:0032119 | sequestering of zinc ion(GO:0032119) regulation of sequestering of zinc ion(GO:0061088) |
| 0.1 | 0.2 | GO:0051031 | tRNA transport(GO:0051031) |
| 0.1 | 0.6 | GO:0035775 | pronephric glomerulus morphogenesis(GO:0035775) |
| 0.1 | 1.6 | GO:0072015 | glomerular visceral epithelial cell development(GO:0072015) glomerular epithelial cell development(GO:0072310) |
| 0.1 | 0.3 | GO:0007096 | regulation of exit from mitosis(GO:0007096) |
| 0.1 | 0.8 | GO:0045747 | positive regulation of Notch signaling pathway(GO:0045747) |
| 0.1 | 1.0 | GO:0048026 | positive regulation of mRNA splicing, via spliceosome(GO:0048026) |
| 0.1 | 2.6 | GO:0046777 | protein autophosphorylation(GO:0046777) |
| 0.1 | 0.3 | GO:0018344 | protein geranylgeranylation(GO:0018344) |
| 0.1 | 0.2 | GO:0030950 | establishment or maintenance of actin cytoskeleton polarity(GO:0030950) |
| 0.1 | 1.2 | GO:0031146 | SCF-dependent proteasomal ubiquitin-dependent protein catabolic process(GO:0031146) |
| 0.1 | 0.3 | GO:0045161 | neuronal ion channel clustering(GO:0045161) |
| 0.1 | 1.1 | GO:0033627 | cell adhesion mediated by integrin(GO:0033627) |
| 0.1 | 4.0 | GO:0000819 | sister chromatid segregation(GO:0000819) |
| 0.1 | 0.7 | GO:0030202 | heparin metabolic process(GO:0030202) heparin biosynthetic process(GO:0030210) |
| 0.1 | 0.2 | GO:0033540 | fatty acid beta-oxidation using acyl-CoA oxidase(GO:0033540) |
| 0.1 | 0.8 | GO:0043966 | histone H3 acetylation(GO:0043966) |
| 0.1 | 1.7 | GO:0006376 | mRNA splice site selection(GO:0006376) |
| 0.1 | 0.4 | GO:0032534 | regulation of microvillus organization(GO:0032530) regulation of microvillus assembly(GO:0032534) |
| 0.1 | 0.5 | GO:0061384 | trabecula morphogenesis(GO:0061383) heart trabecula morphogenesis(GO:0061384) |
| 0.1 | 0.7 | GO:0090481 | pyrimidine nucleotide-sugar transport(GO:0015781) pyrimidine-containing compound transmembrane transport(GO:0072531) pyrimidine nucleotide-sugar transmembrane transport(GO:0090481) |
| 0.1 | 1.6 | GO:0000956 | nuclear-transcribed mRNA catabolic process(GO:0000956) |
| 0.1 | 1.4 | GO:0006635 | fatty acid beta-oxidation(GO:0006635) |
| 0.1 | 0.5 | GO:0031936 | negative regulation of chromatin silencing(GO:0031936) |
| 0.1 | 0.2 | GO:0071357 | response to type I interferon(GO:0034340) type I interferon signaling pathway(GO:0060337) cellular response to type I interferon(GO:0071357) |
| 0.1 | 0.8 | GO:0097352 | autophagosome maturation(GO:0097352) |
| 0.1 | 1.5 | GO:0050881 | multicellular organismal movement(GO:0050879) musculoskeletal movement(GO:0050881) |
| 0.1 | 1.9 | GO:0010862 | positive regulation of pathway-restricted SMAD protein phosphorylation(GO:0010862) |
| 0.1 | 1.2 | GO:0042149 | cellular response to glucose starvation(GO:0042149) |
| 0.1 | 2.6 | GO:0022406 | membrane docking(GO:0022406) vesicle docking(GO:0048278) |
| 0.1 | 0.7 | GO:0008345 | larval locomotory behavior(GO:0008345) larval behavior(GO:0030537) |
| 0.1 | 0.3 | GO:0043984 | histone H4-K16 acetylation(GO:0043984) |
| 0.0 | 1.2 | GO:0007292 | female gamete generation(GO:0007292) oogenesis(GO:0048477) |
| 0.0 | 3.6 | GO:0016579 | protein deubiquitination(GO:0016579) |
| 0.0 | 0.2 | GO:0060325 | face morphogenesis(GO:0060325) |
| 0.0 | 0.3 | GO:0006517 | protein deglycosylation(GO:0006517) |
| 0.0 | 0.4 | GO:0070646 | protein modification by small protein removal(GO:0070646) |
| 0.0 | 0.4 | GO:0007007 | inner mitochondrial membrane organization(GO:0007007) |
| 0.0 | 0.4 | GO:0035066 | positive regulation of histone modification(GO:0031058) positive regulation of histone acetylation(GO:0035066) |
| 0.0 | 1.8 | GO:0046856 | phosphatidylinositol dephosphorylation(GO:0046856) |
| 0.0 | 0.2 | GO:0008630 | intrinsic apoptotic signaling pathway in response to DNA damage(GO:0008630) |
| 0.0 | 0.1 | GO:0006272 | leading strand elongation(GO:0006272) |
| 0.0 | 0.1 | GO:0071800 | podosome assembly(GO:0071800) |
| 0.0 | 3.5 | GO:0006413 | translational initiation(GO:0006413) |
| 0.0 | 0.6 | GO:0060914 | heart formation(GO:0060914) |
| 0.0 | 0.6 | GO:0071456 | cellular response to hypoxia(GO:0071456) |
| 0.0 | 0.2 | GO:0009084 | glutamine family amino acid biosynthetic process(GO:0009084) |
| 0.0 | 2.6 | GO:0045055 | regulated exocytosis(GO:0045055) |
| 0.0 | 2.5 | GO:0015698 | inorganic anion transport(GO:0015698) |
| 0.0 | 0.2 | GO:0019720 | Mo-molybdopterin cofactor biosynthetic process(GO:0006777) Mo-molybdopterin cofactor metabolic process(GO:0019720) molybdopterin cofactor biosynthetic process(GO:0032324) molybdopterin cofactor metabolic process(GO:0043545) prosthetic group metabolic process(GO:0051189) |
| 0.0 | 0.9 | GO:0031167 | rRNA methylation(GO:0031167) |
| 0.0 | 0.2 | GO:0009204 | nucleoside triphosphate catabolic process(GO:0009143) deoxyribonucleoside triphosphate catabolic process(GO:0009204) |
| 0.0 | 6.3 | GO:0032259 | methylation(GO:0032259) |
| 0.0 | 0.5 | GO:0042462 | eye photoreceptor cell development(GO:0042462) |
| 0.0 | 0.7 | GO:0003171 | atrioventricular valve development(GO:0003171) |
| 0.0 | 0.3 | GO:1901678 | heme transport(GO:0015886) iron coordination entity transport(GO:1901678) |
| 0.0 | 0.1 | GO:0061588 | calcium activated phospholipid scrambling(GO:0061588) |
| 0.0 | 0.4 | GO:0045727 | positive regulation of translation(GO:0045727) |
| 0.0 | 0.4 | GO:0000245 | spliceosomal complex assembly(GO:0000245) |
| 0.0 | 0.9 | GO:0032456 | endocytic recycling(GO:0032456) |
| 0.0 | 0.7 | GO:0007030 | Golgi organization(GO:0007030) |
| 0.0 | 0.3 | GO:0014066 | regulation of phosphatidylinositol 3-kinase signaling(GO:0014066) positive regulation of phosphatidylinositol 3-kinase signaling(GO:0014068) |
| 0.0 | 0.6 | GO:0032543 | mitochondrial translation(GO:0032543) |
| 0.0 | 0.2 | GO:0006551 | leucine metabolic process(GO:0006551) |
| 0.0 | 0.2 | GO:0010675 | regulation of cellular carbohydrate metabolic process(GO:0010675) regulation of glucose metabolic process(GO:0010906) |
| 0.0 | 0.2 | GO:0032786 | positive regulation of DNA-templated transcription, elongation(GO:0032786) |
| 0.0 | 0.1 | GO:0051044 | positive regulation of membrane protein ectodomain proteolysis(GO:0051044) |
| 0.0 | 0.1 | GO:0001514 | selenocysteine incorporation(GO:0001514) translational readthrough(GO:0006451) |
| 0.0 | 0.4 | GO:0032922 | circadian regulation of gene expression(GO:0032922) |
| 0.0 | 0.2 | GO:0006465 | signal peptide processing(GO:0006465) |
| 0.0 | 0.7 | GO:0048015 | phosphatidylinositol-mediated signaling(GO:0048015) |
| 0.0 | 1.5 | GO:0008654 | phospholipid biosynthetic process(GO:0008654) |
| 0.0 | 0.4 | GO:0030282 | bone mineralization(GO:0030282) |
| 0.0 | 5.6 | GO:0006397 | mRNA processing(GO:0006397) |
| 0.0 | 0.1 | GO:0090178 | establishment of planar polarity of embryonic epithelium(GO:0042249) establishment of planar polarity involved in neural tube closure(GO:0090177) regulation of establishment of planar polarity involved in neural tube closure(GO:0090178) planar cell polarity pathway involved in neural tube closure(GO:0090179) |
| 0.0 | 0.1 | GO:0007023 | post-chaperonin tubulin folding pathway(GO:0007023) |
| 0.0 | 0.5 | GO:0016573 | histone acetylation(GO:0016573) |
| 0.0 | 0.2 | GO:0043001 | Golgi to plasma membrane protein transport(GO:0043001) |
| 0.0 | 1.3 | GO:0006338 | chromatin remodeling(GO:0006338) |
| 0.0 | 0.2 | GO:0060029 | convergent extension involved in organogenesis(GO:0060029) |
| 0.0 | 0.1 | GO:0016185 | synaptic vesicle budding from presynaptic endocytic zone membrane(GO:0016185) synaptic vesicle budding(GO:0070142) postsynaptic neurotransmitter receptor internalization(GO:0098884) |
| 0.0 | 0.3 | GO:1901663 | ubiquinone metabolic process(GO:0006743) ubiquinone biosynthetic process(GO:0006744) quinone biosynthetic process(GO:1901663) |
| 0.0 | 0.2 | GO:0045048 | protein insertion into ER membrane(GO:0045048) |
| 0.0 | 0.1 | GO:2000574 | regulation of microtubule motor activity(GO:2000574) |
Gene overrepresentation in cellular component category:
| Log-likelihood per target | Total log-likelihood | Term | Description |
|---|---|---|---|
| 3.7 | 18.6 | GO:0070695 | FHF complex(GO:0070695) |
| 2.8 | 8.5 | GO:0034663 | endoplasmic reticulum chaperone complex(GO:0034663) |
| 2.8 | 8.4 | GO:0035339 | SPOTS complex(GO:0035339) |
| 1.9 | 11.3 | GO:0031616 | spindle pole centrosome(GO:0031616) |
| 1.9 | 5.6 | GO:0097124 | cyclin A2-CDK2 complex(GO:0097124) |
| 1.7 | 8.4 | GO:0046695 | SLIK (SAGA-like) complex(GO:0046695) |
| 1.5 | 4.5 | GO:1904423 | dehydrodolichyl diphosphate synthase complex(GO:1904423) |
| 1.4 | 4.2 | GO:0032391 | photoreceptor connecting cilium(GO:0032391) |
| 1.4 | 4.1 | GO:0033391 | chromatoid body(GO:0033391) |
| 1.3 | 5.4 | GO:1902636 | kinociliary basal body(GO:1902636) |
| 1.3 | 4.0 | GO:0005797 | Golgi medial cisterna(GO:0005797) |
| 1.2 | 9.8 | GO:0005826 | actomyosin contractile ring(GO:0005826) |
| 1.2 | 3.6 | GO:0097196 | Shu complex(GO:0097196) |
| 1.1 | 3.3 | GO:0034709 | methylosome(GO:0034709) |
| 1.1 | 4.3 | GO:0098536 | deuterosome(GO:0098536) |
| 1.0 | 7.9 | GO:0061700 | GATOR2 complex(GO:0061700) |
| 1.0 | 6.8 | GO:0048269 | methionine adenosyltransferase complex(GO:0048269) |
| 0.9 | 10.8 | GO:0005742 | mitochondrial outer membrane translocase complex(GO:0005742) |
| 0.8 | 4.9 | GO:0000940 | condensed chromosome outer kinetochore(GO:0000940) |
| 0.8 | 4.0 | GO:0071546 | pi-body(GO:0071546) |
| 0.8 | 2.3 | GO:0099631 | postsynaptic endocytic zone cytoplasmic component(GO:0099631) |
| 0.7 | 10.8 | GO:0070776 | H3 histone acetyltransferase complex(GO:0070775) MOZ/MORF histone acetyltransferase complex(GO:0070776) |
| 0.7 | 9.2 | GO:0034992 | microtubule organizing center attachment site(GO:0034992) LINC complex(GO:0034993) |
| 0.6 | 3.2 | GO:0070531 | BRCA1-A complex(GO:0070531) |
| 0.6 | 4.4 | GO:0071595 | Nem1-Spo7 phosphatase complex(GO:0071595) |
| 0.6 | 8.6 | GO:0031083 | BLOC-1 complex(GO:0031083) |
| 0.6 | 1.8 | GO:0033063 | Rad51B-Rad51C-Rad51D-XRCC2 complex(GO:0033063) |
| 0.6 | 2.9 | GO:0033186 | CAF-1 complex(GO:0033186) |
| 0.6 | 3.5 | GO:0070876 | SOSS complex(GO:0070876) |
| 0.6 | 2.8 | GO:0005640 | nuclear outer membrane(GO:0005640) |
| 0.6 | 15.2 | GO:0005881 | cytoplasmic microtubule(GO:0005881) |
| 0.6 | 2.8 | GO:0005943 | phosphatidylinositol 3-kinase complex, class IA(GO:0005943) |
| 0.5 | 3.8 | GO:0042765 | GPI-anchor transamidase complex(GO:0042765) |
| 0.5 | 4.9 | GO:0005665 | DNA-directed RNA polymerase II, core complex(GO:0005665) |
| 0.5 | 2.7 | GO:0042575 | DNA polymerase complex(GO:0042575) |
| 0.5 | 9.6 | GO:0032588 | trans-Golgi network membrane(GO:0032588) |
| 0.5 | 5.8 | GO:1990023 | mitotic spindle midzone(GO:1990023) |
| 0.5 | 1.6 | GO:0031298 | replication fork protection complex(GO:0031298) |
| 0.5 | 2.0 | GO:0032133 | chromosome passenger complex(GO:0032133) |
| 0.5 | 2.5 | GO:0030062 | mitochondrial alpha-ketoglutarate dehydrogenase complex(GO:0005947) mitochondrial tricarboxylic acid cycle enzyme complex(GO:0030062) |
| 0.5 | 10.1 | GO:0005680 | anaphase-promoting complex(GO:0005680) |
| 0.5 | 2.4 | GO:0097255 | R2TP complex(GO:0097255) |
| 0.5 | 21.2 | GO:0000307 | cyclin-dependent protein kinase holoenzyme complex(GO:0000307) |
| 0.4 | 5.3 | GO:0000815 | ESCRT III complex(GO:0000815) |
| 0.4 | 4.3 | GO:0070652 | HAUS complex(GO:0070652) |
| 0.4 | 2.1 | GO:0034388 | Pwp2p-containing subcomplex of 90S preribosome(GO:0034388) |
| 0.4 | 4.4 | GO:1990124 | messenger ribonucleoprotein complex(GO:1990124) |
| 0.4 | 2.8 | GO:0000839 | Hrd1p ubiquitin ligase ERAD-L complex(GO:0000839) |
| 0.4 | 2.3 | GO:0001401 | mitochondrial sorting and assembly machinery complex(GO:0001401) |
| 0.4 | 19.4 | GO:0005793 | endoplasmic reticulum-Golgi intermediate compartment(GO:0005793) |
| 0.4 | 2.3 | GO:0005790 | smooth endoplasmic reticulum(GO:0005790) |
| 0.4 | 14.0 | GO:0005788 | endoplasmic reticulum lumen(GO:0005788) |
| 0.4 | 8.4 | GO:0035102 | PRC1 complex(GO:0035102) |
| 0.3 | 3.8 | GO:0005801 | cis-Golgi network(GO:0005801) |
| 0.3 | 25.7 | GO:0070160 | bicellular tight junction(GO:0005923) occluding junction(GO:0070160) |
| 0.3 | 14.8 | GO:0036064 | ciliary basal body(GO:0036064) |
| 0.3 | 1.6 | GO:0008290 | F-actin capping protein complex(GO:0008290) |
| 0.3 | 12.9 | GO:0030496 | midbody(GO:0030496) |
| 0.3 | 17.1 | GO:0005814 | centriole(GO:0005814) |
| 0.3 | 0.9 | GO:0097361 | CIA complex(GO:0097361) |
| 0.3 | 12.6 | GO:0005657 | replication fork(GO:0005657) |
| 0.3 | 1.8 | GO:0001669 | acrosomal vesicle(GO:0001669) |
| 0.3 | 1.8 | GO:0000127 | transcription factor TFIIIC complex(GO:0000127) |
| 0.3 | 4.1 | GO:0071144 | SMAD2-SMAD3 protein complex(GO:0071144) |
| 0.3 | 1.2 | GO:0044304 | main axon(GO:0044304) |
| 0.3 | 5.8 | GO:0005685 | U1 snRNP(GO:0005685) |
| 0.3 | 1.7 | GO:0016234 | inclusion body(GO:0016234) |
| 0.3 | 0.8 | GO:0031465 | Cul4B-RING E3 ubiquitin ligase complex(GO:0031465) |
| 0.3 | 0.8 | GO:0031310 | integral component of vacuolar membrane(GO:0031166) intrinsic component of vacuolar membrane(GO:0031310) |
| 0.3 | 9.5 | GO:0032432 | actin filament bundle(GO:0032432) |
| 0.3 | 1.6 | GO:0005655 | nucleolar ribonuclease P complex(GO:0005655) |
| 0.3 | 2.1 | GO:0097431 | mitotic spindle pole(GO:0097431) |
| 0.3 | 1.8 | GO:0000808 | origin recognition complex(GO:0000808) nuclear origin of replication recognition complex(GO:0005664) |
| 0.2 | 1.7 | GO:0031261 | DNA replication preinitiation complex(GO:0031261) |
| 0.2 | 1.0 | GO:0031211 | serine C-palmitoyltransferase complex(GO:0017059) endoplasmic reticulum palmitoyltransferase complex(GO:0031211) |
| 0.2 | 1.7 | GO:0034448 | EGO complex(GO:0034448) Gtr1-Gtr2 GTPase complex(GO:1990131) |
| 0.2 | 1.2 | GO:0044233 | ER-mitochondrion membrane contact site(GO:0044233) |
| 0.2 | 4.6 | GO:0070822 | Sin3-type complex(GO:0070822) |
| 0.2 | 3.6 | GO:0005736 | DNA-directed RNA polymerase I complex(GO:0005736) |
| 0.2 | 0.9 | GO:0035301 | Hedgehog signaling complex(GO:0035301) |
| 0.2 | 2.2 | GO:0030285 | integral component of synaptic vesicle membrane(GO:0030285) intrinsic component of synaptic vesicle membrane(GO:0098563) |
| 0.2 | 5.8 | GO:0005819 | spindle(GO:0005819) |
| 0.2 | 2.8 | GO:0061617 | MICOS complex(GO:0061617) |
| 0.2 | 3.7 | GO:0030014 | CCR4-NOT complex(GO:0030014) |
| 0.2 | 0.8 | GO:0005952 | cAMP-dependent protein kinase complex(GO:0005952) |
| 0.2 | 9.5 | GO:0005942 | phosphatidylinositol 3-kinase complex(GO:0005942) |
| 0.2 | 1.8 | GO:0005876 | spindle microtubule(GO:0005876) |
| 0.2 | 3.7 | GO:0016281 | eukaryotic translation initiation factor 4F complex(GO:0016281) |
| 0.2 | 1.9 | GO:0072686 | mitotic spindle(GO:0072686) |
| 0.2 | 1.5 | GO:0000812 | Swr1 complex(GO:0000812) |
| 0.2 | 0.7 | GO:0071818 | BAT3 complex(GO:0071818) |
| 0.2 | 1.1 | GO:0070187 | telosome(GO:0070187) |
| 0.2 | 25.5 | GO:0005815 | microtubule organizing center(GO:0005815) |
| 0.2 | 11.0 | GO:0019005 | SCF ubiquitin ligase complex(GO:0019005) |
| 0.1 | 1.0 | GO:0032593 | insulin-responsive compartment(GO:0032593) |
| 0.1 | 0.8 | GO:0000439 | core TFIIH complex(GO:0000439) |
| 0.1 | 1.3 | GO:0036449 | microtubule minus-end(GO:0036449) |
| 0.1 | 3.1 | GO:0031463 | Cul3-RING ubiquitin ligase complex(GO:0031463) |
| 0.1 | 4.4 | GO:0000159 | protein phosphatase type 2A complex(GO:0000159) |
| 0.1 | 2.0 | GO:0005669 | transcription factor TFIID complex(GO:0005669) |
| 0.1 | 0.4 | GO:0044326 | dendritic spine neck(GO:0044326) dendritic filopodium(GO:1902737) |
| 0.1 | 5.1 | GO:0031970 | mitochondrial intermembrane space(GO:0005758) organelle envelope lumen(GO:0031970) |
| 0.1 | 1.1 | GO:0008541 | proteasome regulatory particle, lid subcomplex(GO:0008541) |
| 0.1 | 0.7 | GO:0000110 | nucleotide-excision repair factor 1 complex(GO:0000110) |
| 0.1 | 1.2 | GO:0008278 | cohesin complex(GO:0008278) |
| 0.1 | 4.1 | GO:0005811 | lipid particle(GO:0005811) |
| 0.1 | 10.8 | GO:0098852 | lysosomal membrane(GO:0005765) lytic vacuole membrane(GO:0098852) |
| 0.1 | 7.0 | GO:0000775 | chromosome, centromeric region(GO:0000775) |
| 0.1 | 1.4 | GO:0005744 | mitochondrial inner membrane presequence translocase complex(GO:0005744) |
| 0.1 | 1.1 | GO:0032155 | cell division site part(GO:0032155) |
| 0.1 | 1.1 | GO:0032039 | integrator complex(GO:0032039) |
| 0.1 | 1.5 | GO:0035098 | ESC/E(Z) complex(GO:0035098) |
| 0.1 | 8.6 | GO:0005777 | peroxisome(GO:0005777) microbody(GO:0042579) |
| 0.1 | 18.1 | GO:0016604 | nuclear body(GO:0016604) |
| 0.1 | 1.2 | GO:0000813 | ESCRT I complex(GO:0000813) |
| 0.1 | 1.6 | GO:0005849 | mRNA cleavage factor complex(GO:0005849) |
| 0.1 | 0.9 | GO:0032783 | ELL-EAF complex(GO:0032783) |
| 0.1 | 2.6 | GO:0030864 | cortical actin cytoskeleton(GO:0030864) |
| 0.1 | 1.9 | GO:0031941 | filamentous actin(GO:0031941) |
| 0.1 | 2.9 | GO:0048786 | presynaptic active zone(GO:0048786) |
| 0.1 | 2.7 | GO:0080008 | Cul4-RING E3 ubiquitin ligase complex(GO:0080008) |
| 0.1 | 8.0 | GO:0000151 | ubiquitin ligase complex(GO:0000151) |
| 0.1 | 0.8 | GO:0005956 | protein kinase CK2 complex(GO:0005956) |
| 0.1 | 0.8 | GO:0035145 | exon-exon junction complex(GO:0035145) |
| 0.1 | 0.5 | GO:0016363 | nuclear matrix(GO:0016363) |
| 0.1 | 9.8 | GO:0030176 | integral component of endoplasmic reticulum membrane(GO:0030176) |
| 0.1 | 0.6 | GO:0072357 | PTW/PP1 phosphatase complex(GO:0072357) |
| 0.1 | 1.1 | GO:0043186 | P granule(GO:0043186) |
| 0.1 | 20.1 | GO:0005730 | nucleolus(GO:0005730) |
| 0.1 | 1.1 | GO:0005689 | U12-type spliceosomal complex(GO:0005689) |
| 0.1 | 6.5 | GO:0048475 | membrane coat(GO:0030117) coated membrane(GO:0048475) |
| 0.1 | 1.7 | GO:0055038 | recycling endosome membrane(GO:0055038) |
| 0.1 | 0.6 | GO:0043240 | Fanconi anaemia nuclear complex(GO:0043240) |
| 0.1 | 0.3 | GO:0000506 | glycosylphosphatidylinositol-N-acetylglucosaminyltransferase (GPI-GnT) complex(GO:0000506) |
| 0.1 | 0.7 | GO:0031588 | nucleotide-activated protein kinase complex(GO:0031588) |
| 0.1 | 35.8 | GO:0005654 | nucleoplasm(GO:0005654) |
| 0.1 | 5.4 | GO:0019867 | outer membrane(GO:0019867) organelle outer membrane(GO:0031968) |
| 0.1 | 1.0 | GO:0032156 | septin ring(GO:0005940) septin complex(GO:0031105) septin cytoskeleton(GO:0032156) |
| 0.1 | 0.2 | GO:0071005 | U2-type precatalytic spliceosome(GO:0071005) |
| 0.1 | 1.0 | GO:1990907 | beta-catenin-TCF complex(GO:1990907) |
| 0.1 | 0.2 | GO:1905202 | methylcrotonoyl-CoA carboxylase complex(GO:1905202) |
| 0.1 | 44.9 | GO:0005739 | mitochondrion(GO:0005739) |
| 0.1 | 0.6 | GO:0031209 | SCAR complex(GO:0031209) |
| 0.1 | 4.3 | GO:0036464 | ribonucleoprotein granule(GO:0035770) cytoplasmic ribonucleoprotein granule(GO:0036464) |
| 0.1 | 0.6 | GO:0005869 | dynactin complex(GO:0005869) |
| 0.0 | 2.3 | GO:0005884 | actin filament(GO:0005884) |
| 0.0 | 2.4 | GO:0005834 | heterotrimeric G-protein complex(GO:0005834) |
| 0.0 | 1.2 | GO:0016514 | SWI/SNF complex(GO:0016514) |
| 0.0 | 4.2 | GO:0005681 | spliceosomal complex(GO:0005681) |
| 0.0 | 1.2 | GO:0031234 | extrinsic component of cytoplasmic side of plasma membrane(GO:0031234) |
| 0.0 | 0.4 | GO:0016602 | CCAAT-binding factor complex(GO:0016602) |
| 0.0 | 0.2 | GO:0005787 | signal peptidase complex(GO:0005787) |
| 0.0 | 0.3 | GO:0000176 | nuclear exosome (RNase complex)(GO:0000176) |
| 0.0 | 22.4 | GO:0005783 | endoplasmic reticulum(GO:0005783) |
| 0.0 | 1.0 | GO:0098636 | integrin complex(GO:0008305) protein complex involved in cell adhesion(GO:0098636) |
| 0.0 | 0.3 | GO:0032300 | mismatch repair complex(GO:0032300) |
| 0.0 | 1.8 | GO:0005802 | trans-Golgi network(GO:0005802) |
| 0.0 | 0.3 | GO:0030915 | Smc5-Smc6 complex(GO:0030915) |
| 0.0 | 0.1 | GO:0097546 | ciliary base(GO:0097546) |
| 0.0 | 0.1 | GO:0005883 | neurofilament(GO:0005883) |
| 0.0 | 0.1 | GO:0002102 | podosome(GO:0002102) |
| 0.0 | 0.1 | GO:0071065 | alpha9-beta1 integrin-vascular cell adhesion molecule-1 complex(GO:0071065) |
| 0.0 | 0.2 | GO:0031932 | TORC2 complex(GO:0031932) |
| 0.0 | 0.2 | GO:0017119 | Golgi transport complex(GO:0017119) |
| 0.0 | 1.1 | GO:0005938 | cell cortex(GO:0005938) |
| 0.0 | 0.1 | GO:0000794 | condensed nuclear chromosome(GO:0000794) |
| 0.0 | 0.1 | GO:0032045 | guanyl-nucleotide exchange factor complex(GO:0032045) |
Gene overrepresentation in molecular function category:
| Log-likelihood per target | Total log-likelihood | Term | Description |
|---|---|---|---|
| 3.6 | 10.7 | GO:0035174 | histone serine kinase activity(GO:0035174) |
| 3.0 | 9.0 | GO:0001735 | prenylcysteine oxidase activity(GO:0001735) |
| 2.6 | 7.7 | GO:0071889 | 14-3-3 protein binding(GO:0071889) |
| 2.1 | 6.4 | GO:0004576 | oligosaccharyl transferase activity(GO:0004576) dolichyl-diphosphooligosaccharide-protein glycotransferase activity(GO:0004579) |
| 2.0 | 2.0 | GO:0019871 | sodium channel inhibitor activity(GO:0019871) |
| 1.8 | 10.6 | GO:0043139 | 5'-3' DNA helicase activity(GO:0043139) |
| 1.8 | 10.5 | GO:0004619 | bisphosphoglycerate mutase activity(GO:0004082) phosphoglycerate mutase activity(GO:0004619) |
| 1.7 | 8.4 | GO:0004694 | eukaryotic translation initiation factor 2alpha kinase activity(GO:0004694) |
| 1.6 | 4.9 | GO:0001055 | RNA polymerase II activity(GO:0001055) |
| 1.6 | 12.6 | GO:0003854 | 3-beta-hydroxy-delta5-steroid dehydrogenase activity(GO:0003854) |
| 1.5 | 6.1 | GO:0033971 | hydroxyisourate hydrolase activity(GO:0033971) |
| 1.5 | 4.5 | GO:0045547 | dehydrodolichyl diphosphate synthase activity(GO:0045547) |
| 1.5 | 10.4 | GO:0005049 | nuclear export signal receptor activity(GO:0005049) |
| 1.3 | 3.9 | GO:0004140 | dephospho-CoA kinase activity(GO:0004140) |
| 1.2 | 8.3 | GO:0005537 | mannose binding(GO:0005537) |
| 1.2 | 4.7 | GO:0003980 | UDP-glucose:glycoprotein glucosyltransferase activity(GO:0003980) |
| 1.1 | 10.2 | GO:0035804 | structural constituent of egg coat(GO:0035804) |
| 1.1 | 4.5 | GO:0051748 | UTP:glucose-1-phosphate uridylyltransferase activity(GO:0003983) UTP-monosaccharide-1-phosphate uridylyltransferase activity(GO:0051748) |
| 1.1 | 5.6 | GO:0004784 | superoxide dismutase activity(GO:0004784) oxidoreductase activity, acting on superoxide radicals as acceptor(GO:0016721) |
| 1.1 | 5.4 | GO:0015439 | heme-transporting ATPase activity(GO:0015439) |
| 1.1 | 13.8 | GO:0003873 | 6-phosphofructo-2-kinase activity(GO:0003873) |
| 1.1 | 4.2 | GO:0015189 | L-lysine transmembrane transporter activity(GO:0015189) |
| 1.0 | 14.4 | GO:0019894 | kinesin binding(GO:0019894) |
| 1.0 | 7.9 | GO:0070728 | leucine binding(GO:0070728) |
| 1.0 | 3.0 | GO:0052654 | branched-chain-amino-acid transaminase activity(GO:0004084) L-leucine transaminase activity(GO:0052654) L-valine transaminase activity(GO:0052655) L-isoleucine transaminase activity(GO:0052656) |
| 1.0 | 10.8 | GO:0010484 | H3 histone acetyltransferase activity(GO:0010484) histone acetyltransferase activity (H3-K23 specific)(GO:0043994) |
| 1.0 | 2.9 | GO:0004336 | galactosylceramidase activity(GO:0004336) |
| 1.0 | 7.7 | GO:0004303 | estradiol 17-beta-dehydrogenase activity(GO:0004303) |
| 1.0 | 2.9 | GO:0031729 | CCR1 chemokine receptor binding(GO:0031726) CCR4 chemokine receptor binding(GO:0031729) CCR5 chemokine receptor binding(GO:0031730) |
| 1.0 | 3.9 | GO:0004105 | choline-phosphate cytidylyltransferase activity(GO:0004105) |
| 0.9 | 2.8 | GO:0008478 | pyridoxal kinase activity(GO:0008478) |
| 0.9 | 3.7 | GO:0016715 | oxidoreductase activity, acting on paired donors, with incorporation or reduction of molecular oxygen, reduced ascorbate as one donor, and incorporation of one atom of oxygen(GO:0016715) |
| 0.9 | 2.6 | GO:0008743 | L-threonine 3-dehydrogenase activity(GO:0008743) |
| 0.8 | 2.5 | GO:0004743 | pyruvate kinase activity(GO:0004743) |
| 0.8 | 5.1 | GO:0004478 | methionine adenosyltransferase activity(GO:0004478) |
| 0.8 | 5.0 | GO:0003726 | double-stranded RNA adenosine deaminase activity(GO:0003726) |
| 0.8 | 2.5 | GO:0004735 | pyrroline-5-carboxylate reductase activity(GO:0004735) |
| 0.8 | 6.3 | GO:0046912 | transferase activity, transferring acyl groups, acyl groups converted into alkyl on transfer(GO:0046912) |
| 0.8 | 5.5 | GO:0046974 | histone methyltransferase activity (H3-K9 specific)(GO:0046974) |
| 0.8 | 5.5 | GO:0043495 | protein anchor(GO:0043495) |
| 0.8 | 3.1 | GO:0004809 | tRNA (guanine-N2-)-methyltransferase activity(GO:0004809) |
| 0.8 | 2.3 | GO:0000829 | inositol heptakisphosphate kinase activity(GO:0000829) diphosphoinositol-pentakisphosphate kinase activity(GO:0033857) |
| 0.7 | 4.3 | GO:0005068 | transmembrane receptor protein tyrosine kinase adaptor activity(GO:0005068) |
| 0.7 | 2.2 | GO:0047522 | 15-oxoprostaglandin 13-oxidase activity(GO:0047522) |
| 0.7 | 4.2 | GO:0004430 | 1-phosphatidylinositol 4-kinase activity(GO:0004430) |
| 0.7 | 11.1 | GO:0061608 | nucleocytoplasmic transporter activity(GO:0005487) nuclear import signal receptor activity(GO:0061608) |
| 0.7 | 7.4 | GO:0050072 | m7G(5')pppN diphosphatase activity(GO:0050072) |
| 0.7 | 2.6 | GO:0016744 | transferase activity, transferring aldehyde or ketonic groups(GO:0016744) |
| 0.7 | 17.7 | GO:0044325 | ion channel binding(GO:0044325) |
| 0.6 | 11.0 | GO:0016864 | protein disulfide isomerase activity(GO:0003756) intramolecular oxidoreductase activity, transposing S-S bonds(GO:0016864) |
| 0.6 | 3.8 | GO:0051920 | peroxiredoxin activity(GO:0051920) |
| 0.6 | 4.4 | GO:0035251 | UDP-glucosyltransferase activity(GO:0035251) |
| 0.6 | 1.9 | GO:0004706 | JUN kinase kinase kinase activity(GO:0004706) |
| 0.6 | 1.8 | GO:0003834 | beta-carotene 15,15'-monooxygenase activity(GO:0003834) carotenoid dioxygenase activity(GO:0010436) |
| 0.6 | 3.7 | GO:0004781 | adenylylsulfate kinase activity(GO:0004020) sulfate adenylyltransferase activity(GO:0004779) sulfate adenylyltransferase (ATP) activity(GO:0004781) |
| 0.6 | 1.8 | GO:0009041 | uridylate kinase activity(GO:0009041) |
| 0.6 | 11.5 | GO:0003887 | DNA-directed DNA polymerase activity(GO:0003887) |
| 0.6 | 10.5 | GO:0016251 | obsolete general RNA polymerase II transcription factor activity(GO:0016251) |
| 0.5 | 1.6 | GO:0052657 | guanine phosphoribosyltransferase activity(GO:0052657) |
| 0.5 | 1.6 | GO:0005260 | channel-conductance-controlling ATPase activity(GO:0005260) |
| 0.5 | 2.1 | GO:1990050 | phosphatidic acid transporter activity(GO:1990050) |
| 0.5 | 4.7 | GO:0030619 | U1 snRNA binding(GO:0030619) |
| 0.5 | 7.2 | GO:0046975 | histone methyltransferase activity (H3-K36 specific)(GO:0046975) |
| 0.5 | 2.0 | GO:0045145 | single-stranded DNA 5'-3' exodeoxyribonuclease activity(GO:0045145) |
| 0.5 | 1.5 | GO:0008454 | alpha-1,3-mannosylglycoprotein 4-beta-N-acetylglucosaminyltransferase activity(GO:0008454) |
| 0.5 | 6.8 | GO:0051959 | dynein light intermediate chain binding(GO:0051959) |
| 0.5 | 29.3 | GO:0061631 | ubiquitin conjugating enzyme activity(GO:0061631) |
| 0.5 | 10.4 | GO:0022884 | protein transmembrane transporter activity(GO:0008320) macromolecule transmembrane transporter activity(GO:0022884) |
| 0.5 | 1.8 | GO:0003823 | antigen binding(GO:0003823) lipid antigen binding(GO:0030882) |
| 0.4 | 1.3 | GO:0030626 | U12 snRNA binding(GO:0030626) |
| 0.4 | 1.3 | GO:0008603 | cAMP-dependent protein kinase regulator activity(GO:0008603) |
| 0.4 | 4.4 | GO:0072345 | NAADP-sensitive calcium-release channel activity(GO:0072345) |
| 0.4 | 1.8 | GO:0047006 | 17-alpha,20-alpha-dihydroxypregn-4-en-3-one dehydrogenase activity(GO:0047006) |
| 0.4 | 1.3 | GO:0047464 | heparosan-N-sulfate-glucuronate 5-epimerase activity(GO:0047464) |
| 0.4 | 1.7 | GO:1990381 | ubiquitin-specific protease binding(GO:1990381) |
| 0.4 | 18.3 | GO:0005347 | ATP transmembrane transporter activity(GO:0005347) |
| 0.4 | 5.8 | GO:0000774 | adenyl-nucleotide exchange factor activity(GO:0000774) |
| 0.4 | 1.2 | GO:0004471 | malic enzyme activity(GO:0004470) malate dehydrogenase (decarboxylating) (NAD+) activity(GO:0004471) malate dehydrogenase (decarboxylating) (NADP+) activity(GO:0004473) |
| 0.4 | 3.2 | GO:0070740 | protein-glutamic acid ligase activity(GO:0070739) tubulin-glutamic acid ligase activity(GO:0070740) |
| 0.4 | 1.6 | GO:0016453 | C-acetyltransferase activity(GO:0016453) |
| 0.4 | 3.2 | GO:0032050 | clathrin heavy chain binding(GO:0032050) |
| 0.4 | 3.6 | GO:0008172 | S-methyltransferase activity(GO:0008172) |
| 0.4 | 0.8 | GO:0015183 | L-aspartate transmembrane transporter activity(GO:0015183) |
| 0.4 | 2.7 | GO:0004862 | cAMP-dependent protein kinase inhibitor activity(GO:0004862) |
| 0.4 | 2.3 | GO:0005219 | ryanodine-sensitive calcium-release channel activity(GO:0005219) calcium-induced calcium release activity(GO:0048763) |
| 0.4 | 1.9 | GO:0008526 | phosphatidylinositol transporter activity(GO:0008526) |
| 0.4 | 3.8 | GO:0004115 | 3',5'-cyclic-AMP phosphodiesterase activity(GO:0004115) |
| 0.4 | 1.5 | GO:0004558 | alpha-1,4-glucosidase activity(GO:0004558) |
| 0.4 | 1.5 | GO:0008142 | oxysterol binding(GO:0008142) |
| 0.4 | 1.8 | GO:0016805 | dipeptidase activity(GO:0016805) |
| 0.4 | 4.4 | GO:0000900 | translation repressor activity, nucleic acid binding(GO:0000900) |
| 0.4 | 5.1 | GO:0005080 | protein kinase C binding(GO:0005080) |
| 0.4 | 6.1 | GO:0097602 | cullin family protein binding(GO:0097602) |
| 0.3 | 4.5 | GO:0044183 | protein binding involved in protein folding(GO:0044183) |
| 0.3 | 3.1 | GO:0016783 | sulfurtransferase activity(GO:0016783) |
| 0.3 | 1.0 | GO:0070513 | death domain binding(GO:0070513) |
| 0.3 | 3.8 | GO:0070530 | K63-linked polyubiquitin binding(GO:0070530) |
| 0.3 | 1.7 | GO:0004586 | ornithine decarboxylase activity(GO:0004586) |
| 0.3 | 3.4 | GO:0097200 | cysteine-type endopeptidase activity involved in apoptotic signaling pathway(GO:0097199) cysteine-type endopeptidase activity involved in execution phase of apoptosis(GO:0097200) |
| 0.3 | 2.3 | GO:0031419 | cobalamin binding(GO:0031419) |
| 0.3 | 3.7 | GO:0050321 | tau-protein kinase activity(GO:0050321) |
| 0.3 | 1.0 | GO:0004044 | amidophosphoribosyltransferase activity(GO:0004044) |
| 0.3 | 2.3 | GO:0004679 | AMP-activated protein kinase activity(GO:0004679) |
| 0.3 | 1.0 | GO:0008887 | glycerate kinase activity(GO:0008887) |
| 0.3 | 2.9 | GO:0004551 | nucleotide diphosphatase activity(GO:0004551) |
| 0.3 | 2.8 | GO:0071933 | Arp2/3 complex binding(GO:0071933) |
| 0.3 | 3.8 | GO:0016929 | SUMO-specific protease activity(GO:0016929) |
| 0.3 | 1.3 | GO:0030507 | spectrin binding(GO:0030507) |
| 0.3 | 2.8 | GO:0004332 | fructose-bisphosphate aldolase activity(GO:0004332) |
| 0.3 | 5.3 | GO:0043539 | protein serine/threonine kinase activator activity(GO:0043539) |
| 0.3 | 8.4 | GO:0045182 | translation regulator activity(GO:0045182) |
| 0.3 | 2.8 | GO:0052812 | phosphatidylinositol-4,5-bisphosphate 3-kinase activity(GO:0046934) phosphatidylinositol-3,4-bisphosphate 5-kinase activity(GO:0052812) |
| 0.3 | 9.5 | GO:0046935 | 1-phosphatidylinositol-3-kinase regulator activity(GO:0046935) |
| 0.3 | 2.1 | GO:0061665 | SUMO ligase activity(GO:0061665) |
| 0.3 | 4.6 | GO:0004535 | poly(A)-specific ribonuclease activity(GO:0004535) |
| 0.3 | 6.0 | GO:0015248 | sterol transporter activity(GO:0015248) |
| 0.3 | 4.1 | GO:0070411 | I-SMAD binding(GO:0070411) |
| 0.3 | 2.0 | GO:0000400 | four-way junction DNA binding(GO:0000400) |
| 0.3 | 19.1 | GO:0016538 | cyclin-dependent protein serine/threonine kinase regulator activity(GO:0016538) |
| 0.3 | 3.3 | GO:0016413 | O-acetyltransferase activity(GO:0016413) |
| 0.3 | 1.9 | GO:0004418 | hydroxymethylbilane synthase activity(GO:0004418) |
| 0.3 | 0.8 | GO:0035515 | oxidative RNA demethylase activity(GO:0035515) |
| 0.3 | 8.7 | GO:0071949 | FAD binding(GO:0071949) |
| 0.3 | 4.7 | GO:0005112 | Notch binding(GO:0005112) |
| 0.3 | 5.4 | GO:0051537 | 2 iron, 2 sulfur cluster binding(GO:0051537) |
| 0.3 | 1.8 | GO:0008510 | sodium:bicarbonate symporter activity(GO:0008510) |
| 0.3 | 2.0 | GO:0052744 | phosphatidylinositol-3-phosphatase activity(GO:0004438) phosphatidylinositol monophosphate phosphatase activity(GO:0052744) |
| 0.3 | 1.0 | GO:0036054 | protein-malonyllysine demalonylase activity(GO:0036054) protein-succinyllysine desuccinylase activity(GO:0036055) protein-glutaryllysine deglutarylase activity(GO:0061697) |
| 0.3 | 2.5 | GO:0051864 | histone demethylase activity (H3-K36 specific)(GO:0051864) |
| 0.2 | 23.1 | GO:0004722 | protein serine/threonine phosphatase activity(GO:0004722) |
| 0.2 | 4.8 | GO:0008171 | O-methyltransferase activity(GO:0008171) |
| 0.2 | 3.1 | GO:0004806 | triglyceride lipase activity(GO:0004806) |
| 0.2 | 41.3 | GO:0042393 | histone binding(GO:0042393) |
| 0.2 | 4.4 | GO:0072542 | phosphatase activator activity(GO:0019211) protein phosphatase activator activity(GO:0072542) |
| 0.2 | 2.3 | GO:0070403 | NAD+ binding(GO:0070403) |
| 0.2 | 2.1 | GO:0052629 | phosphatidylinositol-3,5-bisphosphate 3-phosphatase activity(GO:0052629) |
| 0.2 | 0.9 | GO:0043739 | G/U mismatch-specific uracil-DNA glycosylase activity(GO:0043739) |
| 0.2 | 0.9 | GO:0070016 | armadillo repeat domain binding(GO:0070016) |
| 0.2 | 0.9 | GO:0008296 | 3'-5'-exodeoxyribonuclease activity(GO:0008296) |
| 0.2 | 1.1 | GO:0004335 | galactokinase activity(GO:0004335) |
| 0.2 | 1.3 | GO:0043531 | ADP binding(GO:0043531) |
| 0.2 | 1.9 | GO:0070700 | BMP receptor binding(GO:0070700) |
| 0.2 | 2.3 | GO:0003828 | alpha-N-acetylneuraminate alpha-2,8-sialyltransferase activity(GO:0003828) |
| 0.2 | 8.5 | GO:0019707 | protein-cysteine S-palmitoyltransferase activity(GO:0019706) protein-cysteine S-acyltransferase activity(GO:0019707) |
| 0.2 | 20.3 | GO:0005516 | calmodulin binding(GO:0005516) |
| 0.2 | 0.8 | GO:0019145 | aminobutyraldehyde dehydrogenase activity(GO:0019145) glyceraldehyde-3-phosphate dehydrogenase (NAD+) (non-phosphorylating) activity(GO:0043878) 4-trimethylammoniobutyraldehyde dehydrogenase activity(GO:0047105) |
| 0.2 | 1.0 | GO:0004758 | serine C-palmitoyltransferase activity(GO:0004758) C-palmitoyltransferase activity(GO:0016454) |
| 0.2 | 1.0 | GO:1990756 | protein binding, bridging involved in substrate recognition for ubiquitination(GO:1990756) |
| 0.2 | 35.7 | GO:0042802 | identical protein binding(GO:0042802) |
| 0.2 | 3.7 | GO:0000340 | RNA 7-methylguanosine cap binding(GO:0000340) |
| 0.2 | 2.8 | GO:0001540 | beta-amyloid binding(GO:0001540) |
| 0.2 | 5.4 | GO:0048029 | monosaccharide binding(GO:0048029) |
| 0.2 | 5.0 | GO:0019003 | GDP binding(GO:0019003) |
| 0.2 | 7.8 | GO:0004715 | non-membrane spanning protein tyrosine kinase activity(GO:0004715) |
| 0.2 | 2.1 | GO:0016409 | palmitoyltransferase activity(GO:0016409) |
| 0.2 | 1.8 | GO:0004143 | diacylglycerol kinase activity(GO:0004143) |
| 0.2 | 1.0 | GO:0005225 | volume-sensitive anion channel activity(GO:0005225) |
| 0.2 | 0.9 | GO:0061133 | peptidase activator activity(GO:0016504) endopeptidase activator activity(GO:0061133) |
| 0.2 | 1.8 | GO:0005158 | insulin receptor binding(GO:0005158) |
| 0.2 | 0.3 | GO:0005078 | MAP-kinase scaffold activity(GO:0005078) |
| 0.2 | 2.7 | GO:0030544 | Hsp70 protein binding(GO:0030544) |
| 0.2 | 0.5 | GO:0019779 | Atg12 activating enzyme activity(GO:0019778) Atg8 activating enzyme activity(GO:0019779) |
| 0.2 | 1.3 | GO:0030552 | cAMP binding(GO:0030552) |
| 0.2 | 2.1 | GO:0016868 | intramolecular transferase activity, phosphotransferases(GO:0016868) |
| 0.2 | 2.4 | GO:0016866 | intramolecular transferase activity(GO:0016866) |
| 0.2 | 1.6 | GO:0004526 | ribonuclease P activity(GO:0004526) |
| 0.2 | 4.0 | GO:0044390 | ubiquitin-like protein conjugating enzyme binding(GO:0044390) |
| 0.2 | 1.5 | GO:0005459 | UDP-galactose transmembrane transporter activity(GO:0005459) |
| 0.2 | 1.8 | GO:0008409 | 5'-3' exonuclease activity(GO:0008409) |
| 0.1 | 0.4 | GO:0046592 | polyamine oxidase activity(GO:0046592) |
| 0.1 | 1.6 | GO:0043028 | cysteine-type endopeptidase inhibitor activity involved in apoptotic process(GO:0043027) cysteine-type endopeptidase regulator activity involved in apoptotic process(GO:0043028) |
| 0.1 | 1.5 | GO:0030332 | cyclin binding(GO:0030332) |
| 0.1 | 3.9 | GO:0102336 | fatty acid elongase activity(GO:0009922) 3-oxo-arachidoyl-CoA synthase activity(GO:0102336) 3-oxo-cerotoyl-CoA synthase activity(GO:0102337) 3-oxo-lignoceronyl-CoA synthase activity(GO:0102338) |
| 0.1 | 1.1 | GO:0003993 | acid phosphatase activity(GO:0003993) |
| 0.1 | 0.4 | GO:0045131 | pre-mRNA branch point binding(GO:0045131) |
| 0.1 | 1.9 | GO:0008093 | cytoskeletal adaptor activity(GO:0008093) |
| 0.1 | 0.8 | GO:0008641 | small protein activating enzyme activity(GO:0008641) |
| 0.1 | 1.9 | GO:0008574 | ATP-dependent microtubule motor activity, plus-end-directed(GO:0008574) |
| 0.1 | 0.8 | GO:0015616 | DNA translocase activity(GO:0015616) |
| 0.1 | 2.0 | GO:0005540 | hyaluronic acid binding(GO:0005540) |
| 0.1 | 4.6 | GO:0005496 | steroid binding(GO:0005496) |
| 0.1 | 2.6 | GO:0000993 | RNA polymerase II core binding(GO:0000993) |
| 0.1 | 0.9 | GO:0043295 | glutathione binding(GO:0043295) |
| 0.1 | 0.5 | GO:0004061 | arylformamidase activity(GO:0004061) |
| 0.1 | 0.4 | GO:0036312 | phosphatidylinositol 3-kinase regulatory subunit binding(GO:0036312) |
| 0.1 | 4.3 | GO:0042826 | histone deacetylase binding(GO:0042826) |
| 0.1 | 0.7 | GO:0033188 | sphingomyelin synthase activity(GO:0033188) ceramide cholinephosphotransferase activity(GO:0047493) |
| 0.1 | 0.5 | GO:0004326 | tetrahydrofolylpolyglutamate synthase activity(GO:0004326) |
| 0.1 | 1.1 | GO:0031826 | type 2A serotonin receptor binding(GO:0031826) |
| 0.1 | 2.2 | GO:0015144 | carbohydrate transmembrane transporter activity(GO:0015144) carbohydrate transporter activity(GO:1901476) |
| 0.1 | 0.8 | GO:0008545 | JUN kinase kinase activity(GO:0008545) |
| 0.1 | 2.0 | GO:0008474 | palmitoyl-(protein) hydrolase activity(GO:0008474) palmitoyl hydrolase activity(GO:0098599) |
| 0.1 | 4.3 | GO:0004864 | protein phosphatase inhibitor activity(GO:0004864) |
| 0.1 | 0.4 | GO:0042500 | aspartic endopeptidase activity, intramembrane cleaving(GO:0042500) |
| 0.1 | 1.3 | GO:0004181 | metallocarboxypeptidase activity(GO:0004181) |
| 0.1 | 0.6 | GO:0047238 | glucuronosyl-N-acetylgalactosaminyl-proteoglycan 4-beta-N-acetylgalactosaminyltransferase activity(GO:0047238) |
| 0.1 | 12.1 | GO:0019901 | protein kinase binding(GO:0019901) |
| 0.1 | 3.6 | GO:0003899 | DNA-directed RNA polymerase activity(GO:0003899) RNA polymerase activity(GO:0034062) |
| 0.1 | 0.6 | GO:0047631 | ADP-ribose diphosphatase activity(GO:0047631) |
| 0.1 | 0.4 | GO:0004046 | aminoacylase activity(GO:0004046) |
| 0.1 | 4.1 | GO:0003777 | microtubule motor activity(GO:0003777) |
| 0.1 | 10.9 | GO:0004721 | phosphoprotein phosphatase activity(GO:0004721) |
| 0.1 | 3.8 | GO:0003746 | translation elongation factor activity(GO:0003746) |
| 0.1 | 0.5 | GO:0030296 | protein tyrosine kinase activator activity(GO:0030296) |
| 0.1 | 1.9 | GO:0043022 | ribosome binding(GO:0043022) |
| 0.1 | 4.7 | GO:0030276 | clathrin binding(GO:0030276) |
| 0.1 | 2.0 | GO:0004659 | prenyltransferase activity(GO:0004659) |
| 0.1 | 0.4 | GO:0004630 | phospholipase D activity(GO:0004630) |
| 0.1 | 0.6 | GO:0016833 | oxo-acid-lyase activity(GO:0016833) |
| 0.1 | 1.6 | GO:0016702 | oxidoreductase activity, acting on single donors with incorporation of molecular oxygen, incorporation of two atoms of oxygen(GO:0016702) |
| 0.1 | 1.5 | GO:0015095 | magnesium ion transmembrane transporter activity(GO:0015095) |
| 0.1 | 0.5 | GO:0099589 | G-protein coupled serotonin receptor activity(GO:0004993) serotonin receptor activity(GO:0099589) |
| 0.1 | 1.5 | GO:0005164 | tumor necrosis factor receptor binding(GO:0005164) |
| 0.1 | 2.1 | GO:0030515 | snoRNA binding(GO:0030515) |
| 0.1 | 1.2 | GO:0004711 | ribosomal protein S6 kinase activity(GO:0004711) |
| 0.1 | 1.6 | GO:0004089 | carbonate dehydratase activity(GO:0004089) |
| 0.1 | 0.4 | GO:1990404 | protein ADP-ribosylase activity(GO:1990404) |
| 0.1 | 1.5 | GO:0051087 | chaperone binding(GO:0051087) |
| 0.1 | 10.3 | GO:0008237 | metallopeptidase activity(GO:0008237) |
| 0.1 | 0.2 | GO:0015347 | sodium-independent organic anion transmembrane transporter activity(GO:0015347) |
| 0.1 | 0.6 | GO:0016421 | CoA carboxylase activity(GO:0016421) |
| 0.1 | 5.5 | GO:0008081 | phosphoric diester hydrolase activity(GO:0008081) |
| 0.1 | 0.3 | GO:0048039 | ubiquinone binding(GO:0048039) |
| 0.1 | 0.2 | GO:0004359 | glutaminase activity(GO:0004359) |
| 0.1 | 2.2 | GO:0051539 | 4 iron, 4 sulfur cluster binding(GO:0051539) |
| 0.1 | 1.0 | GO:0005388 | calcium-transporting ATPase activity(GO:0005388) |
| 0.1 | 0.8 | GO:0008353 | RNA polymerase II carboxy-terminal domain kinase activity(GO:0008353) |
| 0.1 | 1.6 | GO:0031683 | G-protein beta/gamma-subunit complex binding(GO:0031683) |
| 0.1 | 2.4 | GO:0005484 | SNAP receptor activity(GO:0005484) |
| 0.1 | 0.4 | GO:0047134 | protein-disulfide reductase activity(GO:0047134) |
| 0.1 | 0.5 | GO:0048038 | quinone binding(GO:0048038) |
| 0.1 | 1.3 | GO:0018024 | histone-lysine N-methyltransferase activity(GO:0018024) |
| 0.1 | 0.6 | GO:0004571 | mannosyl-oligosaccharide 1,2-alpha-mannosidase activity(GO:0004571) mannosyl-oligosaccharide mannosidase activity(GO:0015924) |
| 0.1 | 2.8 | GO:0019905 | syntaxin binding(GO:0019905) |
| 0.1 | 0.3 | GO:0070182 | DNA polymerase binding(GO:0070182) |
| 0.1 | 1.7 | GO:0050661 | NADP binding(GO:0050661) |
| 0.1 | 4.8 | GO:0060090 | binding, bridging(GO:0060090) |
| 0.1 | 0.4 | GO:0003954 | NADH dehydrogenase activity(GO:0003954) NADH dehydrogenase (ubiquinone) activity(GO:0008137) NADH dehydrogenase (quinone) activity(GO:0050136) |
| 0.0 | 0.3 | GO:0017176 | phosphatidylinositol N-acetylglucosaminyltransferase activity(GO:0017176) |
| 0.0 | 3.1 | GO:0015405 | primary active transmembrane transporter activity(GO:0015399) P-P-bond-hydrolysis-driven transmembrane transporter activity(GO:0015405) |
| 0.0 | 0.9 | GO:0004532 | exoribonuclease activity(GO:0004532) exoribonuclease activity, producing 5'-phosphomonoesters(GO:0016896) |
| 0.0 | 0.3 | GO:0004559 | alpha-mannosidase activity(GO:0004559) |
| 0.0 | 2.6 | GO:0001227 | transcriptional repressor activity, RNA polymerase II transcription regulatory region sequence-specific binding(GO:0001227) |
| 0.0 | 2.6 | GO:0003724 | RNA helicase activity(GO:0003724) |
| 0.0 | 0.4 | GO:0016813 | hydrolase activity, acting on carbon-nitrogen (but not peptide) bonds, in linear amidines(GO:0016813) |
| 0.0 | 0.2 | GO:0004740 | pyruvate dehydrogenase (acetyl-transferring) kinase activity(GO:0004740) |
| 0.0 | 0.4 | GO:0004169 | dolichyl-phosphate-mannose-protein mannosyltransferase activity(GO:0004169) |
| 0.0 | 0.9 | GO:0004712 | protein serine/threonine/tyrosine kinase activity(GO:0004712) |
| 0.0 | 0.2 | GO:0019136 | deoxynucleoside kinase activity(GO:0019136) |
| 0.0 | 1.0 | GO:0005178 | integrin binding(GO:0005178) |
| 0.0 | 3.2 | GO:0008236 | serine-type peptidase activity(GO:0008236) serine hydrolase activity(GO:0017171) |
| 0.0 | 11.1 | GO:0004674 | protein serine/threonine kinase activity(GO:0004674) |
| 0.0 | 0.2 | GO:0036122 | BMP binding(GO:0036122) |
| 0.0 | 0.2 | GO:0004594 | pantothenate kinase activity(GO:0004594) |
| 0.0 | 0.3 | GO:0015926 | glucosidase activity(GO:0015926) |
| 0.0 | 2.4 | GO:0004843 | thiol-dependent ubiquitin-specific protease activity(GO:0004843) thiol-dependent ubiquitinyl hydrolase activity(GO:0036459) ubiquitinyl hydrolase activity(GO:0101005) |
| 0.0 | 0.1 | GO:0034237 | protein kinase A regulatory subunit binding(GO:0034237) |
| 0.0 | 1.6 | GO:0003730 | mRNA 3'-UTR binding(GO:0003730) |
| 0.0 | 6.9 | GO:0004842 | ubiquitin-protein transferase activity(GO:0004842) |
| 0.0 | 0.5 | GO:0015036 | disulfide oxidoreductase activity(GO:0015036) |
| 0.0 | 0.2 | GO:0042054 | histone methyltransferase activity(GO:0042054) |
| 0.0 | 0.7 | GO:0043130 | ubiquitin binding(GO:0043130) |
| 0.0 | 0.6 | GO:0005544 | calcium-dependent phospholipid binding(GO:0005544) |
| 0.0 | 0.5 | GO:0005546 | phosphatidylinositol-4,5-bisphosphate binding(GO:0005546) |
| 0.0 | 0.1 | GO:0016838 | carbon-oxygen lyase activity, acting on phosphates(GO:0016838) |
| 0.0 | 0.1 | GO:0008408 | 3'-5' exonuclease activity(GO:0008408) |
| 0.0 | 0.2 | GO:0051010 | microtubule plus-end binding(GO:0051010) |
| 0.0 | 0.1 | GO:0030983 | mismatched DNA binding(GO:0030983) |
Gene overrepresentation in curated gene sets: canonical pathways category:
| Log-likelihood per target | Total log-likelihood | Term | Description |
|---|---|---|---|
| 2.1 | 19.0 | ST JAK STAT PATHWAY | Jak-STAT Pathway |
| 1.5 | 62.9 | PID PLK1 PATHWAY | PLK1 signaling events |
| 1.0 | 40.7 | PID FOXM1 PATHWAY | FOXM1 transcription factor network |
| 0.9 | 13.9 | PID SMAD2 3PATHWAY | Regulation of cytoplasmic and nuclear SMAD2/3 signaling |
| 0.8 | 6.4 | ST G ALPHA S PATHWAY | G alpha s Pathway |
| 0.7 | 9.6 | PID NFAT TFPATHWAY | Calcineurin-regulated NFAT-dependent transcription in lymphocytes |
| 0.7 | 8.1 | PID CIRCADIAN PATHWAY | Circadian rhythm pathway |
| 0.6 | 17.8 | PID AURORA B PATHWAY | Aurora B signaling |
| 0.6 | 11.8 | PID HEDGEHOG 2PATHWAY | Signaling events mediated by the Hedgehog family |
| 0.6 | 4.4 | PID RXR VDR PATHWAY | RXR and RAR heterodimerization with other nuclear receptor |
| 0.5 | 4.4 | PID INSULIN GLUCOSE PATHWAY | Insulin-mediated glucose transport |
| 0.5 | 3.8 | ST WNT BETA CATENIN PATHWAY | Wnt/beta-catenin Pathway |
| 0.5 | 15.7 | PID HIV NEF PATHWAY | HIV-1 Nef: Negative effector of Fas and TNF-alpha |
| 0.4 | 0.8 | SA FAS SIGNALING | The TNF-type receptor Fas induces apoptosis on ligand binding. |
| 0.4 | 2.3 | PID AURORA A PATHWAY | Aurora A signaling |
| 0.3 | 5.9 | PID RAS PATHWAY | Regulation of Ras family activation |
| 0.3 | 1.3 | PID ECADHERIN STABILIZATION PATHWAY | Stabilization and expansion of the E-cadherin adherens junction |
| 0.3 | 1.8 | PID INTEGRIN5 PATHWAY | Beta5 beta6 beta7 and beta8 integrin cell surface interactions |
| 0.3 | 4.5 | PID DNA PK PATHWAY | DNA-PK pathway in nonhomologous end joining |
| 0.3 | 2.8 | PID IL8 CXCR1 PATHWAY | IL8- and CXCR1-mediated signaling events |
| 0.3 | 1.3 | PID HIF2PATHWAY | HIF-2-alpha transcription factor network |
| 0.3 | 11.9 | PID FANCONI PATHWAY | Fanconi anemia pathway |
| 0.3 | 5.2 | PID TCPTP PATHWAY | Signaling events mediated by TCPTP |
| 0.3 | 1.5 | PID ATM PATHWAY | ATM pathway |
| 0.3 | 8.4 | PID MTOR 4PATHWAY | mTOR signaling pathway |
| 0.2 | 1.4 | ST GA12 PATHWAY | G alpha 12 Pathway |
| 0.2 | 8.0 | PID TELOMERASE PATHWAY | Regulation of Telomerase |
| 0.2 | 4.6 | PID IL6 7 PATHWAY | IL6-mediated signaling events |
| 0.2 | 0.5 | ST PHOSPHOINOSITIDE 3 KINASE PATHWAY | PI3K Pathway |
| 0.2 | 2.5 | PID IL12 2PATHWAY | IL12-mediated signaling events |
| 0.2 | 3.2 | PID BARD1 PATHWAY | BARD1 signaling events |
| 0.2 | 8.5 | PID ERA GENOMIC PATHWAY | Validated nuclear estrogen receptor alpha network |
| 0.2 | 3.1 | PID ARF 3PATHWAY | Arf1 pathway |
| 0.2 | 0.3 | SA G2 AND M PHASES | Cdc25 activates the cdc2/cyclin B complex to induce the G2/M transition. |
| 0.2 | 6.3 | PID MYC ACTIV PATHWAY | Validated targets of C-MYC transcriptional activation |
| 0.2 | 1.3 | PID CERAMIDE PATHWAY | Ceramide signaling pathway |
| 0.1 | 0.3 | PID NECTIN PATHWAY | Nectin adhesion pathway |
| 0.1 | 4.1 | ST FAS SIGNALING PATHWAY | Fas Signaling Pathway |
| 0.1 | 1.3 | ST DIFFERENTIATION PATHWAY IN PC12 CELLS | Differentiation Pathway in PC12 Cells; this is a specific case of PAC1 Receptor Pathway. |
| 0.1 | 3.6 | PID ECADHERIN NASCENT AJ PATHWAY | E-cadherin signaling in the nascent adherens junction |
| 0.1 | 4.2 | PID CMYB PATHWAY | C-MYB transcription factor network |
| 0.1 | 2.0 | PID TNF PATHWAY | TNF receptor signaling pathway |
| 0.1 | 2.1 | PID TRKR PATHWAY | Neurotrophic factor-mediated Trk receptor signaling |
| 0.1 | 1.5 | PID LKB1 PATHWAY | LKB1 signaling events |
| 0.1 | 0.4 | PID ECADHERIN KERATINOCYTE PATHWAY | E-cadherin signaling in keratinocytes |
| 0.1 | 1.2 | PID FOXO PATHWAY | FoxO family signaling |
| 0.1 | 0.3 | PID ERBB2 ERBB3 PATHWAY | ErbB2/ErbB3 signaling events |
| 0.1 | 0.8 | PID HIF1A PATHWAY | Hypoxic and oxygen homeostasis regulation of HIF-1-alpha |
| 0.0 | 0.7 | PID ERBB4 PATHWAY | ErbB4 signaling events |
| 0.0 | 0.5 | PID ARF6 PATHWAY | Arf6 signaling events |
| 0.0 | 0.4 | PID WNT NONCANONICAL PATHWAY | Noncanonical Wnt signaling pathway |
| 0.0 | 1.1 | PID AR PATHWAY | Coregulation of Androgen receptor activity |
| 0.0 | 0.3 | PID LIS1 PATHWAY | Lissencephaly gene (LIS1) in neuronal migration and development |
Gene overrepresentation in curated gene sets: REACTOME pathways category:
| Log-likelihood per target | Total log-likelihood | Term | Description |
|---|---|---|---|
| 3.5 | 3.5 | REACTOME APC C CDC20 MEDIATED DEGRADATION OF MITOTIC PROTEINS | Genes involved in APC/C:Cdc20 mediated degradation of mitotic proteins |
| 3.1 | 6.2 | REACTOME APC C CDH1 MEDIATED DEGRADATION OF CDC20 AND OTHER APC C CDH1 TARGETED PROTEINS IN LATE MITOSIS EARLY G1 | Genes involved in APC/C:Cdh1 mediated degradation of Cdc20 and other APC/C:Cdh1 targeted proteins in late mitosis/early G1 |
| 2.4 | 16.5 | REACTOME REGULATION OF IFNG SIGNALING | Genes involved in Regulation of IFNG signaling |
| 1.8 | 10.8 | REACTOME NEGATIVE REGULATION OF THE PI3K AKT NETWORK | Genes involved in Negative regulation of the PI3K/AKT network |
| 1.8 | 1.8 | REACTOME ACTIVATION OF CHAPERONE GENES BY ATF6 ALPHA | Genes involved in Activation of Chaperone Genes by ATF6-alpha |
| 1.7 | 5.1 | REACTOME MRNA DECAY BY 3 TO 5 EXORIBONUCLEASE | Genes involved in mRNA Decay by 3' to 5' Exoribonuclease |
| 1.5 | 28.9 | REACTOME CYCLIN A B1 ASSOCIATED EVENTS DURING G2 M TRANSITION | Genes involved in Cyclin A/B1 associated events during G2/M transition |
| 1.2 | 6.1 | REACTOME TRAFFICKING AND PROCESSING OF ENDOSOMAL TLR | Genes involved in Trafficking and processing of endosomal TLR |
| 1.0 | 6.3 | REACTOME G2 M DNA DAMAGE CHECKPOINT | Genes involved in G2/M DNA damage checkpoint |
| 0.9 | 6.2 | REACTOME ALPHA LINOLENIC ACID ALA METABOLISM | Genes involved in alpha-linolenic acid (ALA) metabolism |
| 0.9 | 14.9 | REACTOME SYNTHESIS OF SUBSTRATES IN N GLYCAN BIOSYTHESIS | Genes involved in Synthesis of substrates in N-glycan biosythesis |
| 0.9 | 4.3 | REACTOME EXTRINSIC PATHWAY FOR APOPTOSIS | Genes involved in Extrinsic Pathway for Apoptosis |
| 0.8 | 5.7 | REACTOME SEMA3A PLEXIN REPULSION SIGNALING BY INHIBITING INTEGRIN ADHESION | Genes involved in SEMA3A-Plexin repulsion signaling by inhibiting Integrin adhesion |
| 0.8 | 14.3 | REACTOME GROWTH HORMONE RECEPTOR SIGNALING | Genes involved in Growth hormone receptor signaling |
| 0.7 | 26.1 | REACTOME PERK REGULATED GENE EXPRESSION | Genes involved in PERK regulated gene expression |
| 0.7 | 10.3 | REACTOME KINESINS | Genes involved in Kinesins |
| 0.6 | 4.4 | REACTOME HYALURONAN UPTAKE AND DEGRADATION | Genes involved in Hyaluronan uptake and degradation |
| 0.6 | 2.4 | REACTOME CYTOSOLIC SULFONATION OF SMALL MOLECULES | Genes involved in Cytosolic sulfonation of small molecules |
| 0.5 | 22.8 | REACTOME LOSS OF NLP FROM MITOTIC CENTROSOMES | Genes involved in Loss of Nlp from mitotic centrosomes |
| 0.5 | 10.4 | REACTOME G1 S SPECIFIC TRANSCRIPTION | Genes involved in G1/S-Specific Transcription |
| 0.5 | 1.5 | REACTOME REGULATION OF ORNITHINE DECARBOXYLASE ODC | Genes involved in Regulation of ornithine decarboxylase (ODC) |
| 0.5 | 8.3 | REACTOME SIGNALING BY NODAL | Genes involved in Signaling by NODAL |
| 0.4 | 4.8 | REACTOME METABOLISM OF PORPHYRINS | Genes involved in Metabolism of porphyrins |
| 0.4 | 1.2 | REACTOME PURINE CATABOLISM | Genes involved in Purine catabolism |
| 0.4 | 8.6 | REACTOME CITRIC ACID CYCLE TCA CYCLE | Genes involved in Citric acid cycle (TCA cycle) |
| 0.4 | 4.9 | REACTOME VIRAL MESSENGER RNA SYNTHESIS | Genes involved in Viral Messenger RNA Synthesis |
| 0.4 | 7.6 | REACTOME MITOCHONDRIAL FATTY ACID BETA OXIDATION | Genes involved in Mitochondrial Fatty Acid Beta-Oxidation |
| 0.4 | 4.3 | REACTOME NEF MEDIATED DOWNREGULATION OF MHC CLASS I COMPLEX CELL SURFACE EXPRESSION | Genes involved in Nef mediated downregulation of MHC class I complex cell surface expression |
| 0.4 | 1.8 | REACTOME E2F ENABLED INHIBITION OF PRE REPLICATION COMPLEX FORMATION | Genes involved in E2F-enabled inhibition of pre-replication complex formation |
| 0.3 | 6.6 | REACTOME CHOLESTEROL BIOSYNTHESIS | Genes involved in Cholesterol biosynthesis |
| 0.3 | 3.1 | REACTOME REVERSIBLE HYDRATION OF CARBON DIOXIDE | Genes involved in Reversible Hydration of Carbon Dioxide |
| 0.3 | 6.5 | REACTOME BRANCHED CHAIN AMINO ACID CATABOLISM | Genes involved in Branched-chain amino acid catabolism |
| 0.3 | 16.0 | REACTOME TRANSPORT TO THE GOLGI AND SUBSEQUENT MODIFICATION | Genes involved in Transport to the Golgi and subsequent modification |
| 0.3 | 2.3 | REACTOME GAP JUNCTION DEGRADATION | Genes involved in Gap junction degradation |
| 0.3 | 6.5 | REACTOME N GLYCAN TRIMMING IN THE ER AND CALNEXIN CALRETICULIN CYCLE | Genes involved in N-glycan trimming in the ER and Calnexin/Calreticulin cycle |
| 0.3 | 0.6 | REACTOME ACTIVATION OF CHAPERONES BY ATF6 ALPHA | Genes involved in Activation of Chaperones by ATF6-alpha |
| 0.3 | 5.0 | REACTOME RORA ACTIVATES CIRCADIAN EXPRESSION | Genes involved in RORA Activates Circadian Expression |
| 0.3 | 0.9 | REACTOME TRAF6 MEDIATED IRF7 ACTIVATION | Genes involved in TRAF6 mediated IRF7 activation |
| 0.3 | 2.5 | REACTOME PEROXISOMAL LIPID METABOLISM | Genes involved in Peroxisomal lipid metabolism |
| 0.3 | 14.6 | REACTOME MITOCHONDRIAL PROTEIN IMPORT | Genes involved in Mitochondrial Protein Import |
| 0.3 | 15.1 | REACTOME MITOTIC PROMETAPHASE | Genes involved in Mitotic Prometaphase |
| 0.3 | 5.9 | REACTOME RNA POL I TRANSCRIPTION TERMINATION | Genes involved in RNA Polymerase I Transcription Termination |
| 0.2 | 8.2 | REACTOME ACTIVATION OF CHAPERONE GENES BY XBP1S | Genes involved in Activation of Chaperone Genes by XBP1(S) |
| 0.2 | 4.4 | REACTOME PROCESSING OF INTRONLESS PRE MRNAS | Genes involved in Processing of Intronless Pre-mRNAs |
| 0.2 | 1.6 | REACTOME PURINE SALVAGE | Genes involved in Purine salvage |
| 0.2 | 2.7 | REACTOME BMAL1 CLOCK NPAS2 ACTIVATES CIRCADIAN EXPRESSION | Genes involved in BMAL1:CLOCK/NPAS2 Activates Circadian Expression |
| 0.2 | 7.5 | REACTOME SYNTHESIS OF PIPS AT THE PLASMA MEMBRANE | Genes involved in Synthesis of PIPs at the plasma membrane |
| 0.2 | 5.3 | REACTOME NOD1 2 SIGNALING PATHWAY | Genes involved in NOD1/2 Signaling Pathway |
| 0.2 | 1.8 | REACTOME ANDROGEN BIOSYNTHESIS | Genes involved in Androgen biosynthesis |
| 0.2 | 2.2 | REACTOME PROTEOLYTIC CLEAVAGE OF SNARE COMPLEX PROTEINS | Genes involved in Proteolytic cleavage of SNARE complex proteins |
| 0.2 | 4.8 | REACTOME POST TRANSLATIONAL MODIFICATION SYNTHESIS OF GPI ANCHORED PROTEINS | Genes involved in Post-translational modification: synthesis of GPI-anchored proteins |
| 0.2 | 7.0 | REACTOME DEPOSITION OF NEW CENPA CONTAINING NUCLEOSOMES AT THE CENTROMERE | Genes involved in Deposition of New CENPA-containing Nucleosomes at the Centromere |
| 0.2 | 3.3 | REACTOME METABOLISM OF NON CODING RNA | Genes involved in Metabolism of non-coding RNA |
| 0.2 | 2.2 | REACTOME SIGNALING BY ROBO RECEPTOR | Genes involved in Signaling by Robo receptor |
| 0.2 | 2.1 | REACTOME MEIOTIC SYNAPSIS | Genes involved in Meiotic Synapsis |
| 0.2 | 1.1 | REACTOME TAK1 ACTIVATES NFKB BY PHOSPHORYLATION AND ACTIVATION OF IKKS COMPLEX | Genes involved in TAK1 activates NFkB by phosphorylation and activation of IKKs complex |
| 0.2 | 0.8 | REACTOME GLUCOSE TRANSPORT | Genes involved in Glucose transport |
| 0.2 | 0.9 | REACTOME CS DS DEGRADATION | Genes involved in CS/DS degradation |
| 0.2 | 1.4 | REACTOME SYNTHESIS OF PE | Genes involved in Synthesis of PE |
| 0.1 | 6.8 | REACTOME ANTIVIRAL MECHANISM BY IFN STIMULATED GENES | Genes involved in Antiviral mechanism by IFN-stimulated genes |
| 0.1 | 0.6 | REACTOME CIRCADIAN CLOCK | Genes involved in Circadian Clock |
| 0.1 | 8.8 | REACTOME FACTORS INVOLVED IN MEGAKARYOCYTE DEVELOPMENT AND PLATELET PRODUCTION | Genes involved in Factors involved in megakaryocyte development and platelet production |
| 0.1 | 2.9 | REACTOME SMAD2 SMAD3 SMAD4 HETEROTRIMER REGULATES TRANSCRIPTION | Genes involved in SMAD2/SMAD3:SMAD4 heterotrimer regulates transcription |
| 0.1 | 2.3 | REACTOME FANCONI ANEMIA PATHWAY | Genes involved in Fanconi Anemia pathway |
| 0.1 | 24.8 | REACTOME ANTIGEN PROCESSING UBIQUITINATION PROTEASOME DEGRADATION | Genes involved in Antigen processing: Ubiquitination & Proteasome degradation |
| 0.1 | 1.7 | REACTOME TRYPTOPHAN CATABOLISM | Genes involved in Tryptophan catabolism |
| 0.1 | 1.5 | REACTOME PRE NOTCH PROCESSING IN GOLGI | Genes involved in Pre-NOTCH Processing in Golgi |
| 0.1 | 0.8 | REACTOME JNK C JUN KINASES PHOSPHORYLATION AND ACTIVATION MEDIATED BY ACTIVATED HUMAN TAK1 | Genes involved in JNK (c-Jun kinases) phosphorylation and activation mediated by activated human TAK1 |
| 0.1 | 0.5 | REACTOME ROLE OF DCC IN REGULATING APOPTOSIS | Genes involved in Role of DCC in regulating apoptosis |
| 0.1 | 4.3 | REACTOME G ALPHA S SIGNALLING EVENTS | Genes involved in G alpha (s) signalling events |
| 0.1 | 1.8 | REACTOME RNA POL III TRANSCRIPTION INITIATION FROM TYPE 2 PROMOTER | Genes involved in RNA Polymerase III Transcription Initiation From Type 2 Promoter |
| 0.1 | 2.2 | REACTOME ENDOSOMAL SORTING COMPLEX REQUIRED FOR TRANSPORT ESCRT | Genes involved in Endosomal Sorting Complex Required For Transport (ESCRT) |
| 0.1 | 0.5 | REACTOME NITRIC OXIDE STIMULATES GUANYLATE CYCLASE | Genes involved in Nitric oxide stimulates guanylate cyclase |
| 0.1 | 1.1 | REACTOME COPI MEDIATED TRANSPORT | Genes involved in COPI Mediated Transport |
| 0.1 | 0.2 | REACTOME CA DEPENDENT EVENTS | Genes involved in Ca-dependent events |
| 0.1 | 1.2 | REACTOME SMOOTH MUSCLE CONTRACTION | Genes involved in Smooth Muscle Contraction |
| 0.1 | 0.9 | REACTOME GLUTATHIONE CONJUGATION | Genes involved in Glutathione conjugation |
| 0.1 | 0.3 | REACTOME GABA A RECEPTOR ACTIVATION | Genes involved in GABA A receptor activation |
| 0.1 | 0.5 | REACTOME IONOTROPIC ACTIVITY OF KAINATE RECEPTORS | Genes involved in Ionotropic activity of Kainate Receptors |
| 0.1 | 0.4 | REACTOME TIE2 SIGNALING | Genes involved in Tie2 Signaling |
| 0.1 | 0.1 | REACTOME NFKB IS ACTIVATED AND SIGNALS SURVIVAL | Genes involved in NF-kB is activated and signals survival |
| 0.1 | 0.7 | REACTOME MRNA 3 END PROCESSING | Genes involved in mRNA 3'-end processing |
| 0.0 | 0.5 | REACTOME GABA SYNTHESIS RELEASE REUPTAKE AND DEGRADATION | Genes involved in GABA synthesis, release, reuptake and degradation |
| 0.0 | 0.7 | REACTOME RNA POL II TRANSCRIPTION PRE INITIATION AND PROMOTER OPENING | Genes involved in RNA Polymerase II Transcription Pre-Initiation And Promoter Opening |
| 0.0 | 1.3 | REACTOME ASSOCIATION OF TRIC CCT WITH TARGET PROTEINS DURING BIOSYNTHESIS | Genes involved in Association of TriC/CCT with target proteins during biosynthesis |
| 0.0 | 0.7 | REACTOME SIGNALING BY HIPPO | Genes involved in Signaling by Hippo |
| 0.0 | 0.5 | REACTOME VITAMIN B5 PANTOTHENATE METABOLISM | Genes involved in Vitamin B5 (pantothenate) metabolism |
| 0.0 | 0.2 | REACTOME CD28 DEPENDENT PI3K AKT SIGNALING | Genes involved in CD28 dependent PI3K/Akt signaling |
| 0.0 | 0.5 | REACTOME PYRIMIDINE METABOLISM | Genes involved in Pyrimidine metabolism |
| 0.0 | 0.7 | REACTOME FORMATION OF INCISION COMPLEX IN GG NER | Genes involved in Formation of incision complex in GG-NER |
| 0.0 | 0.6 | REACTOME GLYCOLYSIS | Genes involved in Glycolysis |
| 0.0 | 0.3 | REACTOME ACYL CHAIN REMODELLING OF PS | Genes involved in Acyl chain remodelling of PS |
| 0.0 | 1.5 | REACTOME L1CAM INTERACTIONS | Genes involved in L1CAM interactions |
| 0.0 | 1.1 | REACTOME GASTRIN CREB SIGNALLING PATHWAY VIA PKC AND MAPK | Genes involved in Gastrin-CREB signalling pathway via PKC and MAPK |
| 0.0 | 0.7 | REACTOME HS GAG DEGRADATION | Genes involved in HS-GAG degradation |
| 0.0 | 0.4 | REACTOME CELL EXTRACELLULAR MATRIX INTERACTIONS | Genes involved in Cell-extracellular matrix interactions |
| 0.0 | 1.6 | REACTOME FORMATION OF THE TERNARY COMPLEX AND SUBSEQUENTLY THE 43S COMPLEX | Genes involved in Formation of the ternary complex, and subsequently, the 43S complex |
| 0.0 | 0.3 | REACTOME GLYCOGEN BREAKDOWN GLYCOGENOLYSIS | Genes involved in Glycogen breakdown (glycogenolysis) |
| 0.0 | 0.4 | REACTOME INTERFERON ALPHA BETA SIGNALING | Genes involved in Interferon alpha/beta signaling |
| 0.0 | 0.3 | REACTOME INHIBITION OF REPLICATION INITIATION OF DAMAGED DNA BY RB1 E2F1 | Genes involved in Inhibition of replication initiation of damaged DNA by RB1/E2F1 |
| 0.0 | 0.5 | REACTOME MRNA SPLICING MINOR PATHWAY | Genes involved in mRNA Splicing - Minor Pathway |
| 0.0 | 0.1 | REACTOME THE ROLE OF NEF IN HIV1 REPLICATION AND DISEASE PATHOGENESIS | Genes involved in The role of Nef in HIV-1 replication and disease pathogenesis |
| 0.0 | 0.8 | REACTOME NRAGE SIGNALS DEATH THROUGH JNK | Genes involved in NRAGE signals death through JNK |
| 0.0 | 0.7 | REACTOME O LINKED GLYCOSYLATION OF MUCINS | Genes involved in O-linked glycosylation of mucins |
| 0.0 | 0.4 | REACTOME MEIOTIC RECOMBINATION | Genes involved in Meiotic Recombination |
| 0.0 | 0.2 | REACTOME SYNTHESIS SECRETION AND DEACYLATION OF GHRELIN | Genes involved in Synthesis, Secretion, and Deacylation of Ghrelin |
| 0.0 | 0.7 | REACTOME TRANSPORT OF INORGANIC CATIONS ANIONS AND AMINO ACIDS OLIGOPEPTIDES | Genes involved in Transport of inorganic cations/anions and amino acids/oligopeptides |
| 0.0 | 0.7 | REACTOME DNA REPAIR | Genes involved in DNA Repair |