Project
DANIO-CODE
Navigation
Downloads
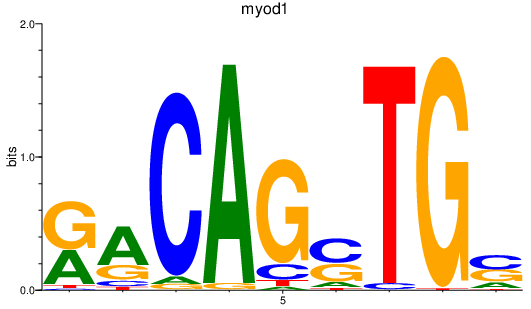
Results for myod1
Z-value: 2.41
Motif logo
Transcription factors associated with myod1
| Gene Symbol | Gene ID | Gene Info |
|---|---|---|
|
myod1
|
ENSDARG00000030110 | myogenic differentiation 1 |
Activity-expression correlation:
| Gene | Promoter | Pearson corr. coef. | P-value | Plot |
|---|---|---|---|---|
| myod1 | dr10_dc_chr25_-_30845998_30846012 | 0.90 | 1.5e-06 | Click! |
Activity profile of myod1 motif
Sorted Z-values of myod1 motif
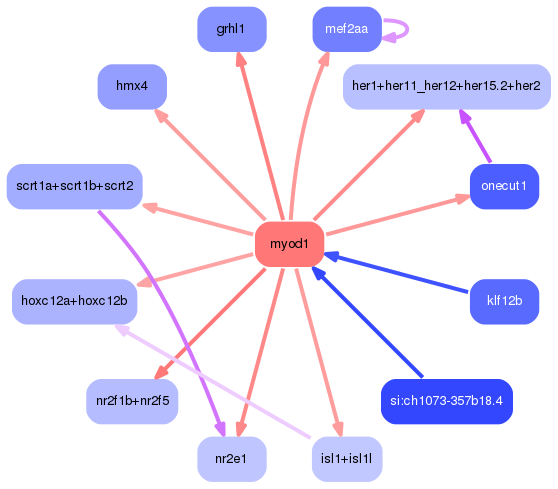
Network of associatons between targets according to the STRING database.

First level regulatory network of myod1
| Promoter | Score | Transcript | Gene | Gene Info |
|---|---|---|---|---|
| chr8_-_11191783 | 8.49 |
ENSDART00000131171
|
unc45b
|
unc-45 myosin chaperone B |
| chr8_-_985673 | 7.23 |
ENSDART00000170737
|
smyd1b
|
SET and MYND domain containing 1b |
| chr17_-_124685 | 7.23 |
ENSDART00000158825
|
actc1b
|
actin, alpha, cardiac muscle 1b |
| chr7_+_49442972 | 7.21 |
ENSDART00000019446
|
ascl1b
|
achaete-scute family bHLH transcription factor 1b |
| chr7_+_39131795 | 6.30 |
ENSDART00000025852
|
tnni2b.1
|
troponin I type 2b (skeletal, fast), tandem duplicate 1 |
| chr7_+_6517248 | 5.92 |
ENSDART00000102681
|
pnp5a
|
purine nucleoside phosphorylase 5a |
| chr11_-_5868257 | 5.84 |
ENSDART00000104360
|
gamt
|
guanidinoacetate N-methyltransferase |
| chr8_-_7049946 | 5.68 |
ENSDART00000045669
ENSDART00000162950 |
KRT73
|
keratin 73 |
| chr22_+_26543146 | 5.61 |
|
|
|
| chr21_-_25704662 | 5.47 |
ENSDART00000101211
|
cldnh
|
claudin h |
| chr6_-_42006033 | 5.40 |
ENSDART00000032527
|
cav3
|
caveolin 3 |
| chr21_+_27346176 | 5.10 |
ENSDART00000005682
|
actn3a
|
actinin alpha 3a |
| chr20_-_19646761 | 4.98 |
|
|
|
| chr3_+_32394653 | 4.87 |
ENSDART00000150897
|
si:ch73-367p23.2
|
si:ch73-367p23.2 |
| chr6_+_3519697 | 4.83 |
ENSDART00000013588
|
klhl41b
|
kelch-like family member 41b |
| chr16_+_46327528 | 4.79 |
ENSDART00000040769
|
nr2f5
|
nuclear receptor subfamily 2, group F, member 5 |
| chr24_+_7832020 | 4.66 |
ENSDART00000019705
|
bmp6
|
bone morphogenetic protein 6 |
| chr7_+_40972616 | 4.60 |
ENSDART00000173814
|
scrib
|
scribbled planar cell polarity protein |
| chr2_+_55859099 | 4.42 |
ENSDART00000097753
ENSDART00000141688 |
nmrk2
|
nicotinamide riboside kinase 2 |
| chr17_-_32473712 | 4.34 |
ENSDART00000148455
ENSDART00000149885 |
grhl1
|
grainyhead-like transcription factor 1 |
| chr11_-_18542803 | 4.26 |
ENSDART00000059732
|
id1
|
inhibitor of DNA binding 1 |
| chr9_-_23081250 | 4.26 |
|
|
|
| chr24_-_33817169 | 4.23 |
ENSDART00000079292
|
cavin4b
|
caveolae associated protein 4b |
| chr16_-_42990753 | 4.04 |
ENSDART00000149317
|
hfe2
|
hemochromatosis type 2 |
| chr22_-_613948 | 4.04 |
ENSDART00000148692
|
apobec2a
|
apolipoprotein B mRNA editing enzyme, catalytic polypeptide-like 2a |
| chr17_+_27417635 | 4.03 |
ENSDART00000052446
|
vgll2b
|
vestigial-like family member 2b |
| chr24_+_20430778 | 4.00 |
ENSDART00000010488
|
klhl40b
|
kelch-like family member 40b |
| chr10_+_33227967 | 3.98 |
ENSDART00000159666
|
myl10
|
myosin, light chain 10, regulatory |
| chr10_+_15819127 | 3.95 |
ENSDART00000140511
|
apba1b
|
amyloid beta (A4) precursor protein-binding, family A, member 1b |
| chr15_+_19902697 | 3.94 |
ENSDART00000101204
|
alcamb
|
activated leukocyte cell adhesion molecule b |
| chr2_-_21677086 | 3.94 |
ENSDART00000057022
|
klhl40a
|
kelch-like family member 40a |
| chr18_+_38307946 | 3.89 |
ENSDART00000134247
|
lmo2
|
LIM domain only 2 (rhombotin-like 1) |
| chr20_-_32543497 | 3.88 |
ENSDART00000026635
|
nr2e1
|
nuclear receptor subfamily 2, group E, member 1 |
| chr12_-_36138709 | 3.86 |
ENSDART00000130985
|
st6galnac
|
ST6 (alpha-N-acetyl-neuraminyl-2,3-beta-galactosyl-1,3)-N-acetylgalactosaminide alpha-2,6-sialyltransferase |
| chr6_+_7092350 | 3.82 |
ENSDART00000049695
ENSDART00000136088 ENSDART00000083424 ENSDART00000125912 |
dzip1
|
DAZ interacting zinc finger protein 1 |
| chr20_+_35010140 | 3.80 |
ENSDART00000172001
|
snap25a
|
synaptosomal-associated protein, 25a |
| chr1_+_38834751 | 3.78 |
ENSDART00000137676
|
tenm3
|
teneurin transmembrane protein 3 |
| chr4_+_12033088 | 3.78 |
ENSDART00000044154
|
tnnt2c
|
troponin T2c, cardiac |
| chr10_+_42530040 | 3.77 |
ENSDART00000025691
|
dbnla
|
drebrin-like a |
| chr6_+_47845002 | 3.71 |
ENSDART00000140943
|
padi2
|
peptidyl arginine deiminase, type II |
| chr11_-_41357639 | 3.69 |
ENSDART00000055709
|
her2
|
hairy-related 2 |
| chr22_+_21997000 | 3.56 |
ENSDART00000046174
|
gna15.1
|
guanine nucleotide binding protein (G protein), alpha 15 (Gq class), tandem duplicate 1 |
| chr22_-_14103942 | 3.54 |
ENSDART00000140323
|
ENSDARG00000042857
|
ENSDARG00000042857 |
| chr24_+_17125429 | 3.51 |
ENSDART00000017605
|
spag6
|
sperm associated antigen 6 |
| chr12_+_31558667 | 3.48 |
ENSDART00000152971
|
dnmbp
|
dynamin binding protein |
| chr3_-_31672763 | 3.46 |
ENSDART00000028270
|
gfap
|
glial fibrillary acidic protein |
| chr3_+_37433008 | 3.41 |
ENSDART00000055225
|
wnt9b
|
wingless-type MMTV integration site family, member 9B |
| chr23_-_3466041 | 3.40 |
ENSDART00000002309
|
mafba
|
v-maf avian musculoaponeurotic fibrosarcoma oncogene homolog Ba |
| chr1_+_51925783 | 3.38 |
ENSDART00000167514
|
abca1a
|
ATP-binding cassette, sub-family A (ABC1), member 1A |
| chr11_-_42934175 | 3.37 |
ENSDART00000172929
|
sptbn1
|
spectrin, beta, non-erythrocytic 1 |
| chr15_-_15421065 | 3.35 |
ENSDART00000106120
|
ywhag2
|
3-monooxygenase/tryptophan 5-monooxygenase activation protein, gamma polypeptide 2 |
| chr11_-_22211478 | 3.33 |
ENSDART00000065996
|
tmem183a
|
transmembrane protein 183A |
| KN149932v1_+_27584 | 3.30 |
|
|
|
| chr14_-_30363703 | 3.27 |
ENSDART00000134098
|
efemp2a
|
EGF containing fibulin-like extracellular matrix protein 2a |
| chr24_+_4341242 | 3.26 |
ENSDART00000133360
|
ccny
|
cyclin Y |
| chr19_-_22894525 | 3.17 |
ENSDART00000090679
|
pleca
|
plectin a |
| chr21_+_549788 | 3.16 |
ENSDART00000175116
|
CABZ01100207.1
|
ENSDARG00000106163 |
| chr7_+_58718614 | 3.14 |
ENSDART00000157873
|
hacd1
|
3-hydroxyacyl-CoA dehydratase 1 |
| chr14_+_5852295 | 3.14 |
ENSDART00000128638
|
bscl2l
|
Bernardinelli-Seip congenital lipodystrophy 2, like |
| chr10_+_19069375 | 3.14 |
ENSDART00000111952
|
igsf9a
|
immunoglobulin superfamily, member 9a |
| chr14_-_17258072 | 3.11 |
ENSDART00000082667
|
fgfrl1a
|
fibroblast growth factor receptor-like 1a |
| chr14_-_32704626 | 3.11 |
ENSDART00000170626
|
kdrl
|
kinase insert domain receptor like |
| chr16_+_39396358 | 3.07 |
|
|
|
| chr17_-_5816135 | 3.04 |
|
|
|
| chr10_+_16634200 | 3.04 |
ENSDART00000101142
|
chsy3
|
chondroitin sulfate synthase 3 |
| chr10_+_31358236 | 3.03 |
ENSDART00000145562
|
robo4
|
roundabout, axon guidance receptor, homolog 4 (Drosophila) |
| chr18_+_23198330 | 3.02 |
ENSDART00000143977
|
mef2aa
|
myocyte enhancer factor 2aa |
| chr11_-_32461160 | 3.02 |
ENSDART00000155592
|
pcdh17
|
protocadherin 17 |
| chr5_+_36093701 | 3.01 |
ENSDART00000019259
|
dlb
|
deltaB |
| chr16_+_5625301 | 2.99 |
|
|
|
| chr14_+_21816442 | 2.99 |
ENSDART00000109759
|
tmx2a
|
thioredoxin-related transmembrane protein 2a |
| chr22_+_11726312 | 2.98 |
ENSDART00000155366
|
krt96
|
keratin 96 |
| chr2_-_32372801 | 2.97 |
ENSDART00000143348
|
BX663499.1
|
ENSDARG00000093778 |
| chr16_+_3090170 | 2.95 |
ENSDART00000110395
|
limd1a
|
LIM domains containing 1a |
| chr11_+_41401893 | 2.94 |
ENSDART00000171655
|
AL929185.1
|
ENSDARG00000103982 |
| chr18_+_38773971 | 2.92 |
ENSDART00000010177
|
onecut1
|
one cut homeobox 1 |
| chr5_-_39910235 | 2.90 |
ENSDART00000146237
ENSDART00000163302 |
fsta
|
follistatin a |
| chr16_+_29716279 | 2.89 |
ENSDART00000137153
|
tmod4
|
tropomodulin 4 (muscle) |
| chr24_-_2278409 | 2.88 |
|
|
|
| chr6_-_42006225 | 2.87 |
ENSDART00000032527
|
cav3
|
caveolin 3 |
| chr23_+_36832325 | 2.86 |
|
|
|
| chr8_+_46319434 | 2.83 |
ENSDART00000145618
|
si:dkey-75a21.2
|
si:dkey-75a21.2 |
| chr4_-_76620869 | 2.83 |
|
|
|
| chr22_-_14103803 | 2.83 |
ENSDART00000062902
|
ENSDARG00000042857
|
ENSDARG00000042857 |
| chr21_-_7703717 | 2.81 |
ENSDART00000158852
|
egfl7
|
EGF-like-domain, multiple 7 |
| KN149968v1_+_15749 | 2.81 |
ENSDART00000168977
|
ENSDARG00000102503
|
ENSDARG00000102503 |
| chr12_+_22734974 | 2.78 |
ENSDART00000130594
|
afap1
|
actin filament associated protein 1 |
| chr6_-_39053400 | 2.78 |
ENSDART00000165839
|
tns2b
|
tensin 2b |
| chr16_-_14184394 | 2.75 |
ENSDART00000090234
|
trim109
|
tripartite motif containing 109 |
| chr7_-_69639922 | 2.75 |
|
|
|
| chr20_+_27068031 | 2.74 |
ENSDART00000153294
|
ahsa1a
|
AHA1, activator of heat shock protein ATPase homolog 1a |
| chr1_-_50147413 | 2.71 |
ENSDART00000080389
|
fam13a
|
family with sequence similarity 13, member A |
| chr22_+_24131239 | 2.71 |
ENSDART00000159165
|
b3galt2
|
UDP-Gal:betaGlcNAc beta 1,3-galactosyltransferase, polypeptide 2 |
| chr5_-_40133824 | 2.71 |
ENSDART00000010896
|
isl1
|
ISL LIM homeobox 1 |
| chr2_-_44402486 | 2.70 |
ENSDART00000011188
ENSDART00000093298 |
atp1a2a
|
ATPase, Na+/K+ transporting, alpha 2a polypeptide |
| chr2_-_42784609 | 2.67 |
|
|
|
| chr1_-_40208469 | 2.64 |
ENSDART00000027463
|
hmx4
|
H6 family homeobox 4 |
| chr18_-_6494014 | 2.61 |
ENSDART00000062423
|
tnni1c
|
troponin I, skeletal, slow c |
| chr6_-_9964616 | 2.61 |
|
|
|
| chr10_+_26020615 | 2.60 |
ENSDART00000128292
ENSDART00000170275 ENSDART00000166164 ENSDART00000108808 |
frem2a
|
Fras1 related extracellular matrix protein 2a |
| chr23_+_20522512 | 2.58 |
ENSDART00000137294
|
slc35c2
|
solute carrier family 35 (GDP-fucose transporter), member C2 |
| chr16_+_5256773 | 2.56 |
ENSDART00000012053
|
elovl4a
|
ELOVL fatty acid elongase 4a |
| chr13_-_7435355 | 2.56 |
ENSDART00000121952
|
h2afy2
|
H2A histone family, member Y2 |
| chr11_+_3940085 | 2.55 |
ENSDART00000122953
|
gnl3
|
guanine nucleotide binding protein-like 3 (nucleolar) |
| chr13_-_7434672 | 2.55 |
ENSDART00000159453
|
h2afy2
|
H2A histone family, member Y2 |
| chr13_-_49983998 | 2.51 |
|
|
|
| chr15_-_12484651 | 2.50 |
ENSDART00000162258
|
BX901957.1
|
ENSDARG00000098363 |
| chr20_+_34417665 | 2.48 |
ENSDART00000153207
|
ivns1abpa
|
influenza virus NS1A binding protein a |
| chr11_-_6004509 | 2.47 |
ENSDART00000108628
|
ano8b
|
anoctamin 8b |
| chr18_-_3244618 | 2.46 |
ENSDART00000161520
|
gdpd4a
|
glycerophosphodiester phosphodiesterase domain containing 4a |
| chr19_-_6466494 | 2.45 |
ENSDART00000104950
|
atp1a3a
|
ATPase, Na+/K+ transporting, alpha 3a polypeptide |
| chr8_+_999710 | 2.45 |
ENSDART00000081432
|
sprb
|
sepiapterin reductase b |
| chr11_-_25803101 | 2.44 |
ENSDART00000088888
|
kaznb
|
kazrin, periplakin interacting protein b |
| KN150487v1_+_15409 | 2.42 |
ENSDART00000166996
|
CABZ01074304.1
|
ENSDARG00000100224 |
| chr10_+_34377959 | 2.41 |
|
|
|
| chr19_-_7531709 | 2.39 |
ENSDART00000104750
|
mllt11
|
myeloid/lymphoid or mixed-lineage leukemia; translocated to, 11 |
| chr4_-_24298444 | 2.37 |
ENSDART00000077926
ENSDART00000128368 |
celf2
|
cugbp, Elav-like family member 2 |
| chr19_+_1626598 | 2.35 |
ENSDART00000163539
|
scrt1a
|
scratch family zinc finger 1a |
| chr7_-_70219217 | 2.35 |
ENSDART00000097710
|
ppargc1a
|
peroxisome proliferator-activated receptor gamma, coactivator 1 alpha |
| chr23_+_35964754 | 2.34 |
ENSDART00000103147
|
hoxc12a
|
homeobox C12a |
| chr14_-_45887823 | 2.33 |
ENSDART00000178932
ENSDART00000160657 |
cltb
|
clathrin, light chain B |
| chr23_+_2193582 | 2.32 |
ENSDART00000106336
|
cpeb2
|
cytoplasmic polyadenylation element binding protein 2 |
| chr1_-_40587797 | 2.31 |
ENSDART00000170895
|
rgs12b
|
regulator of G protein signaling 12b |
| chr13_-_31165867 | 2.31 |
ENSDART00000030946
|
prdm8
|
PR domain containing 8 |
| chr22_+_16282153 | 2.30 |
ENSDART00000162685
ENSDART00000105678 |
lrrc39
|
leucine rich repeat containing 39 |
| chr21_+_17505748 | 2.28 |
ENSDART00000163238
|
stom
|
stomatin |
| chr10_-_28474085 | 2.26 |
|
|
|
| chr22_+_11745592 | 2.26 |
ENSDART00000140272
|
krt96
|
keratin 96 |
| chr24_-_33817036 | 2.26 |
ENSDART00000079292
|
cavin4b
|
caveolae associated protein 4b |
| chr12_+_18403055 | 2.26 |
ENSDART00000090332
|
neurl2
|
neuralized E3 ubiquitin protein ligase 2 |
| chr4_-_4825948 | 2.25 |
ENSDART00000141539
|
coa6
|
cytochrome c oxidase assembly factor 6 |
| chr7_-_38288929 | 2.25 |
|
|
|
| chr16_+_55167489 | 2.25 |
ENSDART00000149795
|
nr0b2a
|
nuclear receptor subfamily 0, group B, member 2a |
| chr19_+_41488385 | 2.25 |
ENSDART00000138687
|
ppp1r9a
|
protein phosphatase 1, regulatory subunit 9A |
| chr14_+_24543732 | 2.24 |
ENSDART00000106039
|
arhgef37
|
Rho guanine nucleotide exchange factor (GEF) 37 |
| chr17_+_27383737 | 2.24 |
ENSDART00000156756
|
FP017274.1
|
ENSDARG00000097369 |
| chr14_-_41311458 | 2.23 |
ENSDART00000163039
|
fgfrl1b
|
fibroblast growth factor receptor-like 1b |
| chr17_+_52736192 | 2.22 |
ENSDART00000158273
ENSDART00000161414 |
meis2a
|
Meis homeobox 2a |
| chr2_-_42279180 | 2.22 |
ENSDART00000047055
|
trim55a
|
tripartite motif containing 55a |
| chr15_-_47277391 | 2.22 |
ENSDART00000151600
|
h3f3b.1
|
H3 histone, family 3B.1 |
| chr11_-_42933969 | 2.21 |
ENSDART00000172929
|
sptbn1
|
spectrin, beta, non-erythrocytic 1 |
| chr9_+_30774173 | 2.20 |
ENSDART00000160590
|
tbc1d4
|
TBC1 domain family, member 4 |
| chr14_-_32877752 | 2.20 |
ENSDART00000163046
|
si:dkey-31j3.11
|
si:dkey-31j3.11 |
| chr17_+_38314814 | 2.19 |
ENSDART00000017493
|
nkx2.1
|
NK2 homeobox 1 |
| chr6_+_1873957 | 2.19 |
|
|
|
| chr13_+_41998500 | 2.19 |
ENSDART00000074707
|
cdc42ep3
|
CDC42 effector protein (Rho GTPase binding) 3 |
| chr8_-_50299273 | 2.19 |
ENSDART00000023639
|
nkx2.7
|
NK2 transcription factor related 7 |
| chr1_-_48853800 | 2.19 |
ENSDART00000137357
|
zgc:175214
|
zgc:175214 |
| chr1_-_24297477 | 2.18 |
|
|
|
| chr15_-_20297270 | 2.17 |
ENSDART00000123910
|
ppp1r14ab
|
protein phosphatase 1, regulatory (inhibitor) subunit 14Ab |
| KN149909v1_+_1319 | 2.16 |
|
|
|
| chr2_-_53210330 | 2.16 |
ENSDART00000024629
|
rab31
|
RAB31, member RAS oncogene family |
| chr15_+_15580544 | 2.16 |
ENSDART00000016024
|
traf4a
|
tnf receptor-associated factor 4a |
| chr5_-_47656197 | 2.15 |
|
|
|
| chr7_-_29021031 | 2.15 |
ENSDART00000086753
|
dapk2a
|
death-associated protein kinase 2a |
| chr6_+_52064243 | 2.14 |
ENSDART00000153468
|
abraa
|
actin binding Rho activating protein a |
| chr3_-_44113070 | 2.14 |
ENSDART00000160717
|
znf750
|
zinc finger protein 750 |
| chr16_+_46435014 | 2.13 |
ENSDART00000144000
|
rpz2
|
rapunzel 2 |
| chr17_-_6219019 | 2.13 |
|
|
|
| chr15_+_9351511 | 2.11 |
ENSDART00000144381
|
sgcg
|
sarcoglycan, gamma |
| chr7_-_18629056 | 2.11 |
ENSDART00000021502
|
mllt3
|
myeloid/lymphoid or mixed-lineage leukemia (trithorax homolog, Drosophila); translocated to, 3 |
| chr10_-_23939618 | 2.10 |
|
|
|
| chr23_-_24755654 | 2.09 |
ENSDART00000104035
|
ctdsp2
|
CTD (carboxy-terminal domain, RNA polymerase II, polypeptide A) small phosphatase 2 |
| chr8_+_53173227 | 2.09 |
ENSDART00000131514
|
nadka
|
NAD kinase a |
| chr12_+_30245620 | 2.09 |
ENSDART00000153116
ENSDART00000152900 |
ENSDARG00000020224
|
ENSDARG00000020224 |
| chr21_-_25704793 | 2.08 |
ENSDART00000101211
|
cldnh
|
claudin h |
| chr3_+_14238188 | 2.06 |
ENSDART00000165452
ENSDART00000171726 |
tmem56b
|
transmembrane protein 56b |
| chr10_-_8336541 | 2.06 |
ENSDART00000163803
|
plpp1a
|
phospholipid phosphatase 1a |
| chr16_-_29229687 | 2.05 |
ENSDART00000132589
|
mef2d
|
myocyte enhancer factor 2d |
| chr17_+_45824480 | 2.05 |
|
|
|
| chr18_+_9524331 | 2.04 |
ENSDART00000053125
|
sema3e
|
sema domain, immunoglobulin domain (Ig), short basic domain, secreted, (semaphorin) 3E |
| chr15_-_4537178 | 2.04 |
ENSDART00000155619
ENSDART00000128602 |
tfdp2
|
transcription factor Dp-2 |
| chr3_-_19218660 | 2.04 |
ENSDART00000132987
|
s1pr5a
|
sphingosine-1-phosphate receptor 5a |
| chr8_-_23744125 | 2.03 |
ENSDART00000141871
|
INAVA
|
innate immunity activator |
| chr6_-_49674729 | 2.03 |
ENSDART00000112226
|
apcdd1l
|
adenomatosis polyposis coli down-regulated 1-like |
| chr17_+_53224434 | 2.03 |
ENSDART00000166517
|
asb2b
|
ankyrin repeat and SOCS box containing 2b |
| chr20_+_51388214 | 2.03 |
ENSDART00000153452
|
hsp90ab1
|
heat shock protein 90, alpha (cytosolic), class B member 1 |
| chr6_-_39767452 | 2.03 |
ENSDART00000085277
|
pfkmb
|
phosphofructokinase, muscle b |
| chr1_-_37990863 | 2.02 |
ENSDART00000132402
|
gpm6ab
|
glycoprotein M6Ab |
| chr3_+_42380497 | 2.01 |
ENSDART00000163579
|
si:dkey-43p13.5
|
si:dkey-43p13.5 |
| chr6_+_45917081 | 2.01 |
ENSDART00000149450
ENSDART00000149642 |
h6pd
|
hexose-6-phosphate dehydrogenase (glucose 1-dehydrogenase) |
| chr20_-_21773202 | 2.01 |
ENSDART00000133286
|
si:ch211-207i1.2
|
si:ch211-207i1.2 |
| chr8_-_37011436 | 2.00 |
ENSDART00000139567
|
renbp
|
renin binding protein |
| chr23_-_20402258 | 2.00 |
ENSDART00000136204
|
CR749762.2
|
ENSDARG00000093223 |
| chr15_+_24064257 | 2.00 |
ENSDART00000156714
|
CR394545.1
|
ENSDARG00000097097 |
| chr5_-_54150484 | 1.99 |
ENSDART00000058470
|
pik3r1
|
phosphoinositide-3-kinase, regulatory subunit 1 (alpha) |
| chr19_-_5453469 | 1.99 |
ENSDART00000105004
|
krt17
|
keratin 17 |
| chr10_+_32739166 | 1.99 |
ENSDART00000063551
|
ppm1e
|
protein phosphatase, Mg2+/Mn2+ dependent, 1E |
| chr18_+_30391910 | 1.97 |
ENSDART00000158871
|
gse1
|
Gse1 coiled-coil protein |
| chr10_+_33926312 | 1.97 |
ENSDART00000174730
|
BX569785.2
|
ENSDARG00000106629 |
| chr3_-_36339966 | 1.96 |
ENSDART00000176547
|
ppl
|
periplakin |
| chr19_-_5452918 | 1.96 |
ENSDART00000105004
|
krt17
|
keratin 17 |
| chr1_-_10391257 | 1.95 |
ENSDART00000102903
|
dmd
|
dystrophin |
| chr25_-_34648956 | 1.95 |
ENSDART00000154851
|
zgc:153405
|
zgc:153405 |
| chr25_-_16658906 | 1.94 |
ENSDART00000124729
ENSDART00000110859 |
ribc2
|
RIB43A domain with coiled-coils 2 |
| chr1_-_51862897 | 1.94 |
ENSDART00000136469
|
acy3.2
|
aspartoacylase (aminocyclase) 3, tandem duplicate 2 |
| chr24_+_21200975 | 1.93 |
ENSDART00000126519
|
shisa2b
|
shisa family member 2b |
| chr7_+_31567166 | 1.91 |
ENSDART00000099785
ENSDART00000122506 |
mybpc3
|
myosin binding protein C, cardiac |
| chr21_-_4842528 | 1.90 |
ENSDART00000097796
|
rnf165a
|
ring finger protein 165a |
| KN149970v1_-_1072 | 1.89 |
|
|
Gene Ontology Analysis
Gene overrepresentation in biological process category:
| Log-likelihood per target | Total log-likelihood | Term | Description |
|---|---|---|---|
| 2.4 | 7.1 | GO:0098528 | skeletal muscle fiber differentiation(GO:0098528) |
| 1.9 | 5.8 | GO:0006601 | creatine metabolic process(GO:0006600) creatine biosynthetic process(GO:0006601) |
| 1.4 | 4.3 | GO:0010084 | specification of organ axis polarity(GO:0010084) |
| 1.3 | 4.0 | GO:0051101 | regulation of DNA binding(GO:0051101) |
| 1.3 | 3.8 | GO:1903385 | dendrite guidance(GO:0070983) regulation of homophilic cell adhesion(GO:1903385) |
| 1.3 | 5.0 | GO:0071634 | transforming growth factor beta activation(GO:0036363) transforming growth factor beta production(GO:0071604) regulation of transforming growth factor beta production(GO:0071634) negative regulation of transforming growth factor beta production(GO:0071635) regulation of transforming growth factor beta activation(GO:1901388) negative regulation of transforming growth factor beta activation(GO:1901389) |
| 1.1 | 3.4 | GO:0021742 | abducens nucleus development(GO:0021742) |
| 1.1 | 4.3 | GO:0003334 | keratinocyte development(GO:0003334) |
| 1.0 | 9.2 | GO:0001765 | membrane raft assembly(GO:0001765) plasma membrane raft assembly(GO:0044854) plasma membrane raft organization(GO:0044857) caveola assembly(GO:0070836) |
| 1.0 | 7.1 | GO:0048769 | sarcomerogenesis(GO:0048769) |
| 1.0 | 6.8 | GO:0061162 | establishment of apical/basal cell polarity(GO:0035089) establishment of monopolar cell polarity(GO:0061162) establishment or maintenance of monopolar cell polarity(GO:0061339) |
| 0.9 | 3.8 | GO:0098974 | postsynaptic actin cytoskeleton organization(GO:0098974) |
| 0.9 | 5.3 | GO:0061298 | retina vasculature development in camera-type eye(GO:0061298) |
| 0.8 | 3.3 | GO:0035022 | positive regulation of Rac protein signal transduction(GO:0035022) |
| 0.8 | 2.4 | GO:0072025 | distal convoluted tubule development(GO:0072025) late distal convoluted tubule development(GO:0072068) |
| 0.7 | 3.3 | GO:0048251 | elastic fiber assembly(GO:0048251) |
| 0.6 | 6.5 | GO:0033292 | T-tubule organization(GO:0033292) |
| 0.6 | 2.6 | GO:0018101 | protein citrullination(GO:0018101) histone citrullination(GO:0036414) |
| 0.6 | 1.9 | GO:0031062 | positive regulation of histone methylation(GO:0031062) |
| 0.6 | 3.7 | GO:0007405 | neuroblast proliferation(GO:0007405) |
| 0.6 | 3.1 | GO:0051881 | regulation of mitochondrial membrane potential(GO:0051881) membrane depolarization(GO:0051899) regulation of release of cytochrome c from mitochondria(GO:0090199) positive regulation of release of cytochrome c from mitochondria(GO:0090200) |
| 0.6 | 5.2 | GO:0060385 | axonogenesis involved in innervation(GO:0060385) |
| 0.6 | 2.3 | GO:0021910 | smoothened signaling pathway involved in ventral spinal cord patterning(GO:0021910) |
| 0.6 | 3.4 | GO:0032374 | regulation of sterol transport(GO:0032371) regulation of cholesterol transport(GO:0032374) |
| 0.6 | 1.7 | GO:0003091 | renal water homeostasis(GO:0003091) renal water transport(GO:0003097) carbon dioxide transport(GO:0015670) |
| 0.5 | 4.2 | GO:0003207 | cardiac chamber formation(GO:0003207) |
| 0.5 | 1.5 | GO:0010752 | regulation of cGMP-mediated signaling(GO:0010752) |
| 0.5 | 2.5 | GO:0031646 | positive regulation of neurological system process(GO:0031646) |
| 0.5 | 2.9 | GO:0032926 | negative regulation of activin receptor signaling pathway(GO:0032926) |
| 0.5 | 2.9 | GO:0051694 | pointed-end actin filament capping(GO:0051694) |
| 0.5 | 11.8 | GO:0003009 | skeletal muscle contraction(GO:0003009) |
| 0.5 | 2.8 | GO:2001239 | histone dephosphorylation(GO:0016576) negative regulation of signal transduction in absence of ligand(GO:1901099) regulation of extrinsic apoptotic signaling pathway in absence of ligand(GO:2001239) negative regulation of extrinsic apoptotic signaling pathway in absence of ligand(GO:2001240) |
| 0.5 | 3.3 | GO:1904031 | positive regulation of cyclin-dependent protein serine/threonine kinase activity(GO:0045737) positive regulation of cyclin-dependent protein kinase activity(GO:1904031) |
| 0.5 | 1.9 | GO:0030104 | water homeostasis(GO:0030104) |
| 0.5 | 1.8 | GO:0051823 | regulation of synapse structural plasticity(GO:0051823) |
| 0.4 | 3.0 | GO:0060148 | negative regulation of hippo signaling(GO:0035331) positive regulation of posttranscriptional gene silencing(GO:0060148) positive regulation of gene silencing by miRNA(GO:2000637) |
| 0.4 | 2.4 | GO:0071688 | myosin filament assembly(GO:0031034) striated muscle myosin thick filament assembly(GO:0071688) |
| 0.4 | 1.4 | GO:0060259 | positive regulation of epithelial cell differentiation(GO:0030858) regulation of feeding behavior(GO:0060259) |
| 0.4 | 1.1 | GO:0070278 | extracellular matrix constituent secretion(GO:0070278) |
| 0.4 | 2.8 | GO:0030183 | B cell differentiation(GO:0030183) |
| 0.3 | 4.1 | GO:0032781 | positive regulation of ATPase activity(GO:0032781) |
| 0.3 | 12.9 | GO:0045214 | sarcomere organization(GO:0045214) |
| 0.3 | 3.8 | GO:0006607 | NLS-bearing protein import into nucleus(GO:0006607) |
| 0.3 | 3.8 | GO:0016082 | synaptic vesicle priming(GO:0016082) |
| 0.3 | 4.4 | GO:0030309 | poly-N-acetyllactosamine metabolic process(GO:0030309) poly-N-acetyllactosamine biosynthetic process(GO:0030311) |
| 0.3 | 3.1 | GO:0021592 | fourth ventricle development(GO:0021592) |
| 0.3 | 3.0 | GO:0030206 | chondroitin sulfate biosynthetic process(GO:0030206) |
| 0.3 | 3.6 | GO:0031272 | pseudopodium organization(GO:0031268) pseudopodium assembly(GO:0031269) regulation of pseudopodium assembly(GO:0031272) positive regulation of pseudopodium assembly(GO:0031274) |
| 0.3 | 0.6 | GO:0051660 | establishment of centrosome localization(GO:0051660) |
| 0.3 | 1.7 | GO:0060579 | ventral spinal cord interneuron fate commitment(GO:0060579) |
| 0.3 | 3.1 | GO:0060158 | phospholipase C-activating dopamine receptor signaling pathway(GO:0060158) |
| 0.3 | 2.0 | GO:0061718 | glucose catabolic process(GO:0006007) NADH regeneration(GO:0006735) glycolytic process through fructose-6-phosphate(GO:0061615) glycolytic process through glucose-6-phosphate(GO:0061620) canonical glycolysis(GO:0061621) glucose catabolic process to pyruvate(GO:0061718) |
| 0.3 | 0.9 | GO:0052803 | imidazole-containing compound metabolic process(GO:0052803) imidazole-containing compound catabolic process(GO:0052805) |
| 0.3 | 1.7 | GO:0033198 | response to ATP(GO:0033198) |
| 0.3 | 2.2 | GO:0034389 | lipid particle organization(GO:0034389) |
| 0.3 | 4.8 | GO:0032526 | response to retinoic acid(GO:0032526) |
| 0.3 | 1.3 | GO:0006741 | NADP biosynthetic process(GO:0006741) |
| 0.3 | 1.5 | GO:0046487 | glyoxylate metabolic process(GO:0046487) |
| 0.2 | 2.4 | GO:0046146 | tetrahydrobiopterin biosynthetic process(GO:0006729) tetrahydrobiopterin metabolic process(GO:0046146) |
| 0.2 | 1.2 | GO:2000651 | positive regulation of sodium ion transport(GO:0010765) positive regulation of potassium ion transport(GO:0043268) positive regulation of potassium ion transmembrane transport(GO:1901381) positive regulation of sodium ion transmembrane transport(GO:1902307) regulation of potassium ion import(GO:1903286) positive regulation of potassium ion import(GO:1903288) positive regulation of sodium ion transmembrane transporter activity(GO:2000651) |
| 0.2 | 2.6 | GO:0006337 | nucleosome disassembly(GO:0006337) chromatin disassembly(GO:0031498) protein-DNA complex disassembly(GO:0032986) |
| 0.2 | 2.1 | GO:0035025 | positive regulation of Rho protein signal transduction(GO:0035025) |
| 0.2 | 2.0 | GO:0019262 | N-acetylneuraminate catabolic process(GO:0019262) |
| 0.2 | 1.1 | GO:2001256 | regulation of store-operated calcium entry(GO:2001256) |
| 0.2 | 8.5 | GO:0061077 | chaperone-mediated protein folding(GO:0061077) |
| 0.2 | 1.9 | GO:2000766 | negative regulation of cytoplasmic translation(GO:2000766) |
| 0.2 | 1.3 | GO:0035279 | mRNA cleavage involved in gene silencing by miRNA(GO:0035279) mRNA cleavage involved in gene silencing(GO:0098795) |
| 0.2 | 1.5 | GO:0003209 | cardiac atrium morphogenesis(GO:0003209) |
| 0.2 | 1.0 | GO:1901841 | regulation of high voltage-gated calcium channel activity(GO:1901841) negative regulation of high voltage-gated calcium channel activity(GO:1901842) |
| 0.2 | 2.6 | GO:1900052 | regulation of isoprenoid metabolic process(GO:0019747) regulation of vitamin metabolic process(GO:0030656) regulation of retinoic acid biosynthetic process(GO:1900052) |
| 0.2 | 2.0 | GO:0006098 | pentose-phosphate shunt(GO:0006098) |
| 0.2 | 3.2 | GO:0031581 | hemidesmosome assembly(GO:0031581) |
| 0.2 | 1.2 | GO:2001106 | regulation of guanyl-nucleotide exchange factor activity(GO:1905097) regulation of Rho guanyl-nucleotide exchange factor activity(GO:2001106) |
| 0.2 | 0.6 | GO:2000136 | cell proliferation involved in heart morphogenesis(GO:0061323) regulation of cell proliferation involved in heart morphogenesis(GO:2000136) |
| 0.2 | 0.8 | GO:0015865 | intracellular nucleoside transport(GO:0015859) purine nucleoside transmembrane transport(GO:0015860) purine nucleotide transport(GO:0015865) ATP transport(GO:0015867) purine ribonucleotide transport(GO:0015868) adenine nucleotide transport(GO:0051503) mitochondrial ATP transmembrane transport(GO:1990544) |
| 0.2 | 1.1 | GO:0045670 | regulation of osteoclast differentiation(GO:0045670) |
| 0.2 | 1.1 | GO:0006798 | polyphosphate metabolic process(GO:0006797) polyphosphate catabolic process(GO:0006798) |
| 0.2 | 3.3 | GO:0035622 | intrahepatic bile duct development(GO:0035622) |
| 0.2 | 5.0 | GO:0006376 | mRNA splice site selection(GO:0006376) |
| 0.2 | 2.9 | GO:0051489 | regulation of filopodium assembly(GO:0051489) |
| 0.2 | 1.7 | GO:0042572 | retinol metabolic process(GO:0042572) |
| 0.2 | 3.0 | GO:0097120 | receptor localization to synapse(GO:0097120) |
| 0.2 | 3.5 | GO:0048268 | clathrin coat assembly(GO:0048268) |
| 0.2 | 0.7 | GO:2001032 | positive regulation of double-strand break repair via homologous recombination(GO:1905168) regulation of double-strand break repair via nonhomologous end joining(GO:2001032) |
| 0.2 | 2.5 | GO:0030007 | cellular potassium ion homeostasis(GO:0030007) sodium ion export from cell(GO:0036376) sodium ion export(GO:0071436) |
| 0.2 | 2.1 | GO:0045471 | response to ethanol(GO:0045471) |
| 0.2 | 1.9 | GO:0018401 | peptidyl-proline hydroxylation to 4-hydroxy-L-proline(GO:0018401) 4-hydroxyproline metabolic process(GO:0019471) |
| 0.2 | 1.4 | GO:0051156 | glucose 6-phosphate metabolic process(GO:0051156) |
| 0.2 | 3.1 | GO:0032011 | ARF protein signal transduction(GO:0032011) regulation of ARF protein signal transduction(GO:0032012) |
| 0.2 | 3.1 | GO:0030878 | thyroid gland development(GO:0030878) |
| 0.2 | 0.9 | GO:0032793 | positive regulation of CREB transcription factor activity(GO:0032793) |
| 0.2 | 0.3 | GO:0035479 | angioblast cell migration from lateral mesoderm to midline(GO:0035479) |
| 0.2 | 2.1 | GO:0000467 | exonucleolytic trimming involved in rRNA processing(GO:0000459) exonucleolytic trimming to generate mature 3'-end of 5.8S rRNA from tricistronic rRNA transcript (SSU-rRNA, 5.8S rRNA, LSU-rRNA)(GO:0000467) |
| 0.1 | 1.0 | GO:2001045 | negative regulation of integrin-mediated signaling pathway(GO:2001045) |
| 0.1 | 4.2 | GO:0030835 | regulation of actin filament depolymerization(GO:0030834) negative regulation of actin filament depolymerization(GO:0030835) actin filament capping(GO:0051693) |
| 0.1 | 0.7 | GO:0098700 | neurotransmitter loading into synaptic vesicle(GO:0098700) |
| 0.1 | 2.0 | GO:0055003 | cardiac myofibril assembly(GO:0055003) |
| 0.1 | 3.0 | GO:0060219 | camera-type eye photoreceptor cell differentiation(GO:0060219) |
| 0.1 | 1.2 | GO:0032264 | IMP salvage(GO:0032264) |
| 0.1 | 1.8 | GO:0003310 | pancreatic A cell differentiation(GO:0003310) |
| 0.1 | 1.0 | GO:0090178 | establishment of planar polarity of embryonic epithelium(GO:0042249) establishment of planar polarity involved in neural tube closure(GO:0090177) regulation of establishment of planar polarity involved in neural tube closure(GO:0090178) planar cell polarity pathway involved in neural tube closure(GO:0090179) |
| 0.1 | 2.3 | GO:0007097 | nuclear migration(GO:0007097) establishment of nucleus localization(GO:0040023) |
| 0.1 | 1.1 | GO:0044211 | pyrimidine-containing compound salvage(GO:0008655) pyrimidine ribonucleotide salvage(GO:0010138) pyrimidine nucleotide salvage(GO:0032262) pyrimidine nucleoside salvage(GO:0043097) UMP salvage(GO:0044206) CTP salvage(GO:0044211) |
| 0.1 | 2.0 | GO:0043550 | regulation of lipid kinase activity(GO:0043550) regulation of phosphatidylinositol 3-kinase activity(GO:0043551) |
| 0.1 | 2.3 | GO:0043433 | negative regulation of sequence-specific DNA binding transcription factor activity(GO:0043433) |
| 0.1 | 4.9 | GO:0021575 | hindbrain morphogenesis(GO:0021575) |
| 0.1 | 1.0 | GO:0032486 | Rap protein signal transduction(GO:0032486) |
| 0.1 | 2.3 | GO:0014003 | oligodendrocyte development(GO:0014003) |
| 0.1 | 0.8 | GO:0006228 | UTP biosynthetic process(GO:0006228) UTP metabolic process(GO:0046051) |
| 0.1 | 0.7 | GO:0045943 | positive regulation of transcription from RNA polymerase I promoter(GO:0045943) |
| 0.1 | 1.2 | GO:0045773 | positive regulation of axon extension(GO:0045773) |
| 0.1 | 5.5 | GO:0048843 | negative regulation of axon extension involved in axon guidance(GO:0048843) negative regulation of axon guidance(GO:1902668) |
| 0.1 | 3.8 | GO:0050768 | negative regulation of neurogenesis(GO:0050768) |
| 0.1 | 1.3 | GO:0061337 | cardiac conduction(GO:0061337) |
| 0.1 | 0.3 | GO:1903059 | N-terminal protein palmitoylation(GO:0006500) regulation of lipoprotein metabolic process(GO:0050746) negative regulation of lipoprotein metabolic process(GO:0050748) regulation of N-terminal protein palmitoylation(GO:0060254) negative regulation of N-terminal protein palmitoylation(GO:0060262) regulation of protein lipidation(GO:1903059) negative regulation of protein lipidation(GO:1903060) |
| 0.1 | 1.0 | GO:0050728 | negative regulation of inflammatory response(GO:0050728) |
| 0.1 | 2.2 | GO:0045103 | intermediate filament-based process(GO:0045103) intermediate filament cytoskeleton organization(GO:0045104) |
| 0.1 | 0.3 | GO:0046655 | folic acid metabolic process(GO:0046655) |
| 0.1 | 1.1 | GO:0006388 | tRNA splicing, via endonucleolytic cleavage and ligation(GO:0006388) |
| 0.1 | 4.8 | GO:0021782 | glial cell development(GO:0021782) |
| 0.1 | 2.0 | GO:0048484 | enteric nervous system development(GO:0048484) |
| 0.1 | 0.5 | GO:1902624 | positive regulation of neutrophil migration(GO:1902624) |
| 0.1 | 2.8 | GO:0010862 | positive regulation of pathway-restricted SMAD protein phosphorylation(GO:0010862) |
| 0.1 | 3.4 | GO:0030901 | midbrain development(GO:0030901) |
| 0.1 | 1.5 | GO:0060729 | maintenance of gastrointestinal epithelium(GO:0030277) intestinal epithelial structure maintenance(GO:0060729) |
| 0.1 | 0.5 | GO:0017182 | peptidyl-diphthamide metabolic process(GO:0017182) peptidyl-diphthamide biosynthetic process from peptidyl-histidine(GO:0017183) |
| 0.1 | 1.4 | GO:0021952 | central nervous system projection neuron axonogenesis(GO:0021952) |
| 0.1 | 1.3 | GO:0006120 | mitochondrial electron transport, NADH to ubiquinone(GO:0006120) |
| 0.1 | 0.2 | GO:0090153 | regulation of sphingolipid biosynthetic process(GO:0090153) negative regulation of sphingolipid biosynthetic process(GO:0090155) negative regulation of ceramide biosynthetic process(GO:1900060) regulation of membrane lipid metabolic process(GO:1905038) regulation of ceramide biosynthetic process(GO:2000303) |
| 0.1 | 0.2 | GO:0010259 | multicellular organism aging(GO:0010259) |
| 0.1 | 7.2 | GO:0060047 | heart contraction(GO:0060047) |
| 0.1 | 1.0 | GO:0060319 | primitive erythrocyte differentiation(GO:0060319) |
| 0.1 | 2.0 | GO:0030497 | fatty acid elongation(GO:0030497) |
| 0.1 | 5.2 | GO:0031101 | fin regeneration(GO:0031101) |
| 0.1 | 2.2 | GO:0019722 | calcium-mediated signaling(GO:0019722) |
| 0.1 | 0.7 | GO:0002474 | antigen processing and presentation of peptide antigen via MHC class I(GO:0002474) |
| 0.1 | 0.4 | GO:0043173 | nucleotide salvage(GO:0043173) |
| 0.1 | 6.1 | GO:0008284 | positive regulation of cell proliferation(GO:0008284) |
| 0.1 | 0.8 | GO:0045332 | phospholipid translocation(GO:0045332) |
| 0.1 | 0.8 | GO:0045947 | negative regulation of translational initiation(GO:0045947) |
| 0.1 | 0.5 | GO:0060012 | synaptic transmission, glycinergic(GO:0060012) |
| 0.1 | 0.9 | GO:0032958 | inositol phosphate biosynthetic process(GO:0032958) |
| 0.1 | 2.0 | GO:1902850 | mitotic spindle assembly(GO:0090307) microtubule cytoskeleton organization involved in mitosis(GO:1902850) |
| 0.1 | 0.1 | GO:0048211 | Golgi vesicle docking(GO:0048211) |
| 0.1 | 1.0 | GO:0030199 | collagen fibril organization(GO:0030199) |
| 0.1 | 1.1 | GO:0008535 | respiratory chain complex IV assembly(GO:0008535) |
| 0.1 | 0.3 | GO:0019934 | cGMP-mediated signaling(GO:0019934) |
| 0.1 | 0.4 | GO:0045050 | protein insertion into ER membrane by stop-transfer membrane-anchor sequence(GO:0045050) |
| 0.1 | 2.2 | GO:0007189 | adenylate cyclase-activating G-protein coupled receptor signaling pathway(GO:0007189) |
| 0.1 | 1.2 | GO:0030150 | protein import into mitochondrial matrix(GO:0030150) |
| 0.0 | 2.6 | GO:0033334 | fin morphogenesis(GO:0033334) |
| 0.0 | 7.2 | GO:0007268 | chemical synaptic transmission(GO:0007268) anterograde trans-synaptic signaling(GO:0098916) |
| 0.0 | 1.7 | GO:0032456 | endocytic recycling(GO:0032456) |
| 0.0 | 2.1 | GO:0046839 | phospholipid dephosphorylation(GO:0046839) |
| 0.0 | 0.7 | GO:0015914 | phospholipid transport(GO:0015914) |
| 0.0 | 1.3 | GO:0010906 | regulation of cellular carbohydrate metabolic process(GO:0010675) regulation of glucose metabolic process(GO:0010906) |
| 0.0 | 0.3 | GO:0070262 | peptidyl-serine dephosphorylation(GO:0070262) |
| 0.0 | 2.0 | GO:0006469 | negative regulation of protein kinase activity(GO:0006469) negative regulation of kinase activity(GO:0033673) |
| 0.0 | 1.8 | GO:0015718 | monocarboxylic acid transport(GO:0015718) |
| 0.0 | 1.9 | GO:0006633 | fatty acid biosynthetic process(GO:0006633) |
| 0.0 | 0.8 | GO:0030239 | myofibril assembly(GO:0030239) |
| 0.0 | 1.0 | GO:0035272 | exocrine pancreas development(GO:0031017) exocrine system development(GO:0035272) |
| 0.0 | 0.2 | GO:0006450 | regulation of translational fidelity(GO:0006450) |
| 0.0 | 1.1 | GO:0008045 | motor neuron axon guidance(GO:0008045) |
| 0.0 | 0.4 | GO:0046475 | glycerophospholipid catabolic process(GO:0046475) |
| 0.0 | 2.1 | GO:0008544 | epidermis development(GO:0008544) |
| 0.0 | 0.2 | GO:1904825 | protein localization to microtubule(GO:0035372) protein localization to microtubule plus-end(GO:1904825) |
| 0.0 | 5.3 | GO:0009116 | nucleoside metabolic process(GO:0009116) |
| 0.0 | 1.8 | GO:0002040 | sprouting angiogenesis(GO:0002040) |
| 0.0 | 0.3 | GO:0015701 | bicarbonate transport(GO:0015701) |
| 0.0 | 0.5 | GO:0036269 | swimming behavior(GO:0036269) |
| 0.0 | 0.1 | GO:0042769 | DNA damage response, detection of DNA damage(GO:0042769) |
| 0.0 | 0.3 | GO:0070830 | apical junction assembly(GO:0043297) bicellular tight junction assembly(GO:0070830) |
| 0.0 | 0.7 | GO:0007229 | integrin-mediated signaling pathway(GO:0007229) |
| 0.0 | 0.5 | GO:0006383 | transcription from RNA polymerase III promoter(GO:0006383) |
| 0.0 | 0.2 | GO:0034340 | response to type I interferon(GO:0034340) type I interferon signaling pathway(GO:0060337) cellular response to type I interferon(GO:0071357) |
| 0.0 | 4.6 | GO:0098609 | cell-cell adhesion(GO:0098609) |
| 0.0 | 0.9 | GO:0042471 | ear morphogenesis(GO:0042471) |
| 0.0 | 1.4 | GO:0043068 | positive regulation of cell death(GO:0010942) positive regulation of apoptotic process(GO:0043065) positive regulation of programmed cell death(GO:0043068) |
| 0.0 | 0.3 | GO:0031163 | iron-sulfur cluster assembly(GO:0016226) metallo-sulfur cluster assembly(GO:0031163) |
| 0.0 | 1.0 | GO:0007051 | spindle organization(GO:0007051) |
| 0.0 | 0.5 | GO:0035383 | acyl-CoA metabolic process(GO:0006637) thioester metabolic process(GO:0035383) |
| 0.0 | 0.3 | GO:0001570 | vasculogenesis(GO:0001570) |
| 0.0 | 0.4 | GO:0006506 | GPI anchor biosynthetic process(GO:0006506) |
Gene overrepresentation in cellular component category:
| Log-likelihood per target | Total log-likelihood | Term | Description |
|---|---|---|---|
| 1.4 | 25.8 | GO:0031672 | A band(GO:0031672) |
| 1.2 | 3.5 | GO:0099631 | postsynaptic endocytic zone cytoplasmic component(GO:0099631) |
| 1.0 | 4.9 | GO:0008091 | spectrin(GO:0008091) |
| 0.7 | 15.6 | GO:0005861 | troponin complex(GO:0005861) |
| 0.6 | 1.8 | GO:0005854 | nascent polypeptide-associated complex(GO:0005854) |
| 0.6 | 7.3 | GO:0005869 | dynactin complex(GO:0005869) |
| 0.5 | 4.4 | GO:0002102 | podosome(GO:0002102) |
| 0.5 | 15.9 | GO:0005901 | caveola(GO:0005901) plasma membrane raft(GO:0044853) |
| 0.4 | 2.9 | GO:0044295 | axonal growth cone(GO:0044295) |
| 0.4 | 2.1 | GO:0016012 | sarcoglycan complex(GO:0016012) |
| 0.3 | 1.2 | GO:0070062 | extracellular exosome(GO:0070062) |
| 0.3 | 1.4 | GO:0031462 | Cul2-RING ubiquitin ligase complex(GO:0031462) |
| 0.3 | 3.2 | GO:0030056 | hemidesmosome(GO:0030056) |
| 0.3 | 2.0 | GO:0005945 | 6-phosphofructokinase complex(GO:0005945) |
| 0.3 | 1.1 | GO:0033263 | CORVET complex(GO:0033263) |
| 0.3 | 3.8 | GO:0031083 | BLOC-1 complex(GO:0031083) |
| 0.3 | 4.8 | GO:0033017 | sarcoplasmic reticulum membrane(GO:0033017) |
| 0.2 | 3.0 | GO:0098839 | postsynaptic density membrane(GO:0098839) postsynaptic specialization membrane(GO:0099634) |
| 0.2 | 2.9 | GO:0005865 | striated muscle thin filament(GO:0005865) myofilament(GO:0036379) |
| 0.2 | 4.1 | GO:0008328 | ionotropic glutamate receptor complex(GO:0008328) neurotransmitter receptor complex(GO:0098878) |
| 0.2 | 2.3 | GO:0005640 | nuclear outer membrane(GO:0005640) |
| 0.2 | 1.1 | GO:0072669 | tRNA-splicing ligase complex(GO:0072669) |
| 0.2 | 5.7 | GO:0043197 | dendritic spine(GO:0043197) neuron spine(GO:0044309) |
| 0.2 | 1.9 | GO:1990124 | messenger ribonucleoprotein complex(GO:1990124) |
| 0.2 | 2.6 | GO:0071564 | npBAF complex(GO:0071564) |
| 0.2 | 1.2 | GO:0005892 | acetylcholine-gated channel complex(GO:0005892) |
| 0.2 | 1.7 | GO:0005639 | integral component of nuclear inner membrane(GO:0005639) intrinsic component of nuclear inner membrane(GO:0031229) nuclear membrane part(GO:0044453) |
| 0.2 | 2.0 | GO:0090665 | dystrophin-associated glycoprotein complex(GO:0016010) glycoprotein complex(GO:0090665) |
| 0.1 | 2.8 | GO:0034751 | aryl hydrocarbon receptor complex(GO:0034751) |
| 0.1 | 1.7 | GO:0097431 | mitotic spindle pole(GO:0097431) |
| 0.1 | 10.0 | GO:0005882 | intermediate filament(GO:0005882) |
| 0.1 | 4.1 | GO:0060076 | excitatory synapse(GO:0060076) |
| 0.1 | 0.4 | GO:0000506 | glycosylphosphatidylinositol-N-acetylglucosaminyltransferase (GPI-GnT) complex(GO:0000506) |
| 0.1 | 0.3 | GO:0016586 | RSC complex(GO:0016586) |
| 0.1 | 6.2 | GO:0005795 | Golgi stack(GO:0005795) |
| 0.1 | 11.4 | GO:0030424 | axon(GO:0030424) |
| 0.1 | 0.2 | GO:0035339 | SPOTS complex(GO:0035339) |
| 0.1 | 4.1 | GO:0005581 | collagen trimer(GO:0005581) |
| 0.1 | 5.0 | GO:0030017 | sarcomere(GO:0030017) |
| 0.1 | 1.5 | GO:0005891 | voltage-gated calcium channel complex(GO:0005891) |
| 0.1 | 1.4 | GO:0032587 | ruffle membrane(GO:0032587) |
| 0.1 | 1.1 | GO:0030127 | COPII vesicle coat(GO:0030127) |
| 0.1 | 8.7 | GO:0005911 | cell-cell junction(GO:0005911) |
| 0.1 | 4.2 | GO:0000932 | cytoplasmic mRNA processing body(GO:0000932) |
| 0.1 | 2.8 | GO:0005834 | heterotrimeric G-protein complex(GO:0005834) |
| 0.1 | 2.8 | GO:0005814 | centriole(GO:0005814) |
| 0.1 | 3.1 | GO:0030425 | dendrite(GO:0030425) |
| 0.0 | 1.5 | GO:0031225 | anchored component of membrane(GO:0031225) |
| 0.0 | 8.7 | GO:0043235 | receptor complex(GO:0043235) |
| 0.0 | 2.1 | GO:0005924 | cell-substrate adherens junction(GO:0005924) focal adhesion(GO:0005925) |
| 0.0 | 5.2 | GO:0090575 | RNA polymerase II transcription factor complex(GO:0090575) |
| 0.0 | 1.4 | GO:0055038 | recycling endosome membrane(GO:0055038) |
| 0.0 | 0.6 | GO:0016471 | vacuolar proton-transporting V-type ATPase complex(GO:0016471) |
| 0.0 | 1.2 | GO:0045211 | postsynaptic membrane(GO:0045211) |
| 0.0 | 0.7 | GO:0005885 | Arp2/3 protein complex(GO:0005885) |
| 0.0 | 1.3 | GO:0030964 | mitochondrial respiratory chain complex I(GO:0005747) NADH dehydrogenase complex(GO:0030964) respiratory chain complex I(GO:0045271) |
| 0.0 | 4.3 | GO:0030054 | cell junction(GO:0030054) |
| 0.0 | 1.7 | GO:0005942 | phosphatidylinositol 3-kinase complex(GO:0005942) |
| 0.0 | 16.5 | GO:0005615 | extracellular space(GO:0005615) |
| 0.0 | 2.8 | GO:0009986 | cell surface(GO:0009986) |
| 0.0 | 0.6 | GO:0005666 | DNA-directed RNA polymerase III complex(GO:0005666) |
| 0.0 | 1.0 | GO:0030027 | lamellipodium(GO:0030027) |
| 0.0 | 1.4 | GO:0043005 | neuron projection(GO:0043005) |
| 0.0 | 0.2 | GO:0035371 | microtubule plus-end(GO:0035371) |
Gene overrepresentation in molecular function category:
| Log-likelihood per target | Total log-likelihood | Term | Description |
|---|---|---|---|
| 1.5 | 5.9 | GO:0004731 | purine-nucleoside phosphorylase activity(GO:0004731) |
| 1.3 | 4.0 | GO:0004126 | cytidine deaminase activity(GO:0004126) |
| 1.3 | 9.2 | GO:0071253 | connexin binding(GO:0071253) |
| 1.0 | 3.1 | GO:0102345 | 3-hydroxyacyl-CoA dehydratase activity(GO:0018812) 3-hydroxy-behenoyl-CoA dehydratase activity(GO:0102344) 3-hydroxy-lignoceroyl-CoA dehydratase activity(GO:0102345) |
| 0.9 | 4.4 | GO:0050262 | ribosylnicotinamide kinase activity(GO:0050262) |
| 0.8 | 12.6 | GO:0051879 | Hsp90 protein binding(GO:0051879) |
| 0.7 | 2.8 | GO:0042169 | SH2 domain binding(GO:0042169) |
| 0.7 | 2.0 | GO:0004345 | glucose-6-phosphate dehydrogenase activity(GO:0004345) |
| 0.7 | 6.7 | GO:0005391 | sodium:potassium-exchanging ATPase activity(GO:0005391) |
| 0.6 | 2.6 | GO:0004668 | protein-arginine deiminase activity(GO:0004668) |
| 0.6 | 3.0 | GO:0047238 | glucuronosyl-N-acetylgalactosaminyl-proteoglycan 4-beta-N-acetylgalactosaminyltransferase activity(GO:0047238) |
| 0.6 | 1.7 | GO:0070330 | aromatase activity(GO:0070330) |
| 0.6 | 3.4 | GO:0090556 | phospholipid-translocating ATPase activity(GO:0004012) phosphatidylcholine-translocating ATPase activity(GO:0090554) phosphatidylserine-translocating ATPase activity(GO:0090556) |
| 0.6 | 1.7 | GO:0015166 | polyol transmembrane transporter activity(GO:0015166) glycerol transmembrane transporter activity(GO:0015168) |
| 0.5 | 2.0 | GO:0038036 | sphingosine-1-phosphate receptor activity(GO:0038036) |
| 0.5 | 6.7 | GO:0005523 | tropomyosin binding(GO:0005523) |
| 0.5 | 1.8 | GO:0016936 | galactoside binding(GO:0016936) |
| 0.4 | 1.3 | GO:0030553 | cGMP-dependent protein kinase activity(GO:0004692) cGMP binding(GO:0030553) |
| 0.4 | 7.1 | GO:0042800 | histone methyltransferase activity (H3-K4 specific)(GO:0042800) |
| 0.4 | 3.5 | GO:0032050 | clathrin heavy chain binding(GO:0032050) |
| 0.4 | 5.5 | GO:0038191 | neuropilin binding(GO:0038191) |
| 0.4 | 5.8 | GO:0001540 | beta-amyloid binding(GO:0001540) |
| 0.4 | 1.8 | GO:0072349 | modified amino acid transmembrane transporter activity(GO:0072349) |
| 0.4 | 1.8 | GO:0008467 | [heparan sulfate]-glucosamine 3-sulfotransferase 1 activity(GO:0008467) |
| 0.3 | 5.3 | GO:0005007 | fibroblast growth factor-activated receptor activity(GO:0005007) |
| 0.3 | 1.3 | GO:0036042 | long-chain fatty acyl-CoA binding(GO:0036042) |
| 0.3 | 2.8 | GO:0070700 | BMP receptor binding(GO:0070700) |
| 0.3 | 4.4 | GO:0008532 | N-acetyllactosaminide beta-1,3-N-acetylglucosaminyltransferase activity(GO:0008532) |
| 0.3 | 3.2 | GO:0030506 | ankyrin binding(GO:0030506) |
| 0.3 | 2.0 | GO:0003872 | 6-phosphofructokinase activity(GO:0003872) fructose-6-phosphate binding(GO:0070095) |
| 0.3 | 1.7 | GO:0004931 | purinergic nucleotide receptor activity(GO:0001614) extracellular ATP-gated cation channel activity(GO:0004931) nucleotide receptor activity(GO:0016502) ATP-gated ion channel activity(GO:0035381) |
| 0.3 | 1.1 | GO:0035256 | G-protein coupled glutamate receptor binding(GO:0035256) |
| 0.3 | 2.9 | GO:0048185 | activin binding(GO:0048185) |
| 0.3 | 1.3 | GO:0004740 | pyruvate dehydrogenase (acetyl-transferring) kinase activity(GO:0004740) |
| 0.3 | 2.3 | GO:0031826 | type 2A serotonin receptor binding(GO:0031826) |
| 0.3 | 1.5 | GO:0016833 | oxo-acid-lyase activity(GO:0016833) |
| 0.3 | 2.0 | GO:0032036 | myosin heavy chain binding(GO:0032036) |
| 0.2 | 1.2 | GO:0003876 | AMP deaminase activity(GO:0003876) adenosine-phosphate deaminase activity(GO:0047623) |
| 0.2 | 1.2 | GO:0019870 | chloride channel regulator activity(GO:0017081) chloride channel inhibitor activity(GO:0019869) potassium channel inhibitor activity(GO:0019870) |
| 0.2 | 1.8 | GO:0016316 | phosphatidylinositol-3,4-bisphosphate 4-phosphatase activity(GO:0016316) |
| 0.2 | 0.9 | GO:0031433 | telethonin binding(GO:0031433) FATZ binding(GO:0051373) |
| 0.2 | 2.3 | GO:0008449 | N-acetylglucosamine-6-sulfatase activity(GO:0008449) |
| 0.2 | 0.8 | GO:0099528 | G-protein coupled neurotransmitter receptor activity(GO:0099528) |
| 0.2 | 0.6 | GO:0015272 | ATP-activated inward rectifier potassium channel activity(GO:0015272) |
| 0.2 | 0.8 | GO:0005471 | ATP:ADP antiporter activity(GO:0005471) |
| 0.2 | 1.1 | GO:0004309 | exopolyphosphatase activity(GO:0004309) |
| 0.2 | 2.2 | GO:0000900 | translation repressor activity, nucleic acid binding(GO:0000900) |
| 0.2 | 3.3 | GO:0098632 | protein binding involved in cell-cell adhesion(GO:0098632) |
| 0.2 | 0.7 | GO:0005326 | neurotransmitter transporter activity(GO:0005326) |
| 0.2 | 1.0 | GO:0005231 | excitatory extracellular ligand-gated ion channel activity(GO:0005231) |
| 0.2 | 0.7 | GO:0004046 | aminoacylase activity(GO:0004046) |
| 0.2 | 0.9 | GO:0010314 | phosphatidylinositol-5-phosphate binding(GO:0010314) |
| 0.2 | 2.2 | GO:0004865 | protein serine/threonine phosphatase inhibitor activity(GO:0004865) |
| 0.2 | 2.0 | GO:0016857 | racemase and epimerase activity, acting on carbohydrates and derivatives(GO:0016857) |
| 0.2 | 1.9 | GO:0031545 | peptidyl-proline 4-dioxygenase activity(GO:0031545) |
| 0.2 | 1.1 | GO:0016886 | ligase activity, forming phosphoric ester bonds(GO:0016886) |
| 0.2 | 0.8 | GO:0050998 | nitric-oxide synthase binding(GO:0050998) |
| 0.1 | 1.4 | GO:0022848 | acetylcholine-gated cation channel activity(GO:0022848) |
| 0.1 | 0.7 | GO:0019136 | deoxynucleoside kinase activity(GO:0019136) |
| 0.1 | 0.7 | GO:0008526 | phosphatidylinositol transporter activity(GO:0008526) |
| 0.1 | 2.0 | GO:0005005 | transmembrane-ephrin receptor activity(GO:0005005) |
| 0.1 | 1.1 | GO:0004849 | uridine kinase activity(GO:0004849) |
| 0.1 | 0.9 | GO:0008140 | cAMP response element binding protein binding(GO:0008140) |
| 0.1 | 4.9 | GO:0005200 | structural constituent of cytoskeleton(GO:0005200) |
| 0.1 | 2.1 | GO:0008195 | phosphatidate phosphatase activity(GO:0008195) |
| 0.1 | 2.2 | GO:0005164 | tumor necrosis factor receptor binding(GO:0005164) |
| 0.1 | 2.3 | GO:0005112 | Notch binding(GO:0005112) |
| 0.1 | 2.0 | GO:0004724 | magnesium-dependent protein serine/threonine phosphatase activity(GO:0004724) |
| 0.1 | 4.4 | GO:0005109 | frizzled binding(GO:0005109) |
| 0.1 | 3.9 | GO:0008373 | sialyltransferase activity(GO:0008373) |
| 0.1 | 12.9 | GO:0001228 | transcriptional activator activity, RNA polymerase II transcription regulatory region sequence-specific binding(GO:0001228) |
| 0.1 | 2.4 | GO:0030374 | ligand-dependent nuclear receptor transcription coactivator activity(GO:0030374) |
| 0.1 | 7.9 | GO:0004879 | RNA polymerase II transcription factor activity, ligand-activated sequence-specific DNA binding(GO:0004879) transcription factor activity, direct ligand regulated sequence-specific DNA binding(GO:0098531) |
| 0.1 | 2.8 | GO:0008157 | protein phosphatase 1 binding(GO:0008157) |
| 0.1 | 3.7 | GO:0042826 | histone deacetylase binding(GO:0042826) |
| 0.1 | 3.4 | GO:0017147 | Wnt-protein binding(GO:0017147) |
| 0.1 | 1.6 | GO:0004114 | 3',5'-cyclic-nucleotide phosphodiesterase activity(GO:0004114) |
| 0.1 | 12.2 | GO:0050839 | cell adhesion molecule binding(GO:0050839) |
| 0.1 | 3.0 | GO:0015036 | disulfide oxidoreductase activity(GO:0015036) |
| 0.1 | 1.4 | GO:0016861 | intramolecular oxidoreductase activity, interconverting aldoses and ketoses(GO:0016861) |
| 0.1 | 1.2 | GO:0005184 | neuropeptide hormone activity(GO:0005184) |
| 0.1 | 1.0 | GO:0005246 | calcium channel regulator activity(GO:0005246) |
| 0.1 | 4.6 | GO:0004714 | transmembrane receptor protein tyrosine kinase activity(GO:0004714) |
| 0.1 | 2.3 | GO:0005249 | voltage-gated potassium channel activity(GO:0005249) |
| 0.1 | 0.4 | GO:0048156 | tau protein binding(GO:0048156) |
| 0.1 | 0.9 | GO:0000828 | inositol hexakisphosphate kinase activity(GO:0000828) |
| 0.1 | 1.3 | GO:0050136 | NADH dehydrogenase (ubiquinone) activity(GO:0008137) NADH dehydrogenase (quinone) activity(GO:0050136) |
| 0.1 | 0.8 | GO:0008190 | eukaryotic initiation factor 4E binding(GO:0008190) |
| 0.1 | 0.5 | GO:0031682 | G-protein gamma-subunit binding(GO:0031682) |
| 0.1 | 1.5 | GO:0044325 | ion channel binding(GO:0044325) |
| 0.1 | 1.5 | GO:0004180 | carboxypeptidase activity(GO:0004180) |
| 0.1 | 1.3 | GO:0003951 | NAD+ kinase activity(GO:0003951) |
| 0.1 | 1.0 | GO:0005540 | hyaluronic acid binding(GO:0005540) |
| 0.1 | 1.7 | GO:0016881 | acid-amino acid ligase activity(GO:0016881) |
| 0.1 | 27.3 | GO:0046983 | protein dimerization activity(GO:0046983) |
| 0.1 | 2.0 | GO:0046935 | 1-phosphatidylinositol-3-kinase regulator activity(GO:0046935) |
| 0.1 | 3.9 | GO:0042802 | identical protein binding(GO:0042802) |
| 0.1 | 0.4 | GO:0017176 | phosphatidylinositol N-acetylglucosaminyltransferase activity(GO:0017176) |
| 0.1 | 1.1 | GO:0030898 | actin-dependent ATPase activity(GO:0030898) |
| 0.1 | 1.3 | GO:0098748 | clathrin adaptor activity(GO:0035615) endocytic adaptor activity(GO:0098748) |
| 0.1 | 1.5 | GO:0005245 | voltage-gated calcium channel activity(GO:0005245) |
| 0.0 | 0.8 | GO:0004550 | nucleoside diphosphate kinase activity(GO:0004550) |
| 0.0 | 0.3 | GO:0004559 | alpha-mannosidase activity(GO:0004559) |
| 0.0 | 1.2 | GO:0051087 | chaperone binding(GO:0051087) |
| 0.0 | 9.5 | GO:0051015 | actin filament binding(GO:0051015) |
| 0.0 | 4.1 | GO:0003730 | mRNA 3'-UTR binding(GO:0003730) |
| 0.0 | 1.4 | GO:0005179 | hormone activity(GO:0005179) |
| 0.0 | 17.3 | GO:0005198 | structural molecule activity(GO:0005198) |
| 0.0 | 4.9 | GO:0003714 | transcription corepressor activity(GO:0003714) |
| 0.0 | 0.3 | GO:0008510 | sodium:bicarbonate symporter activity(GO:0008510) |
| 0.0 | 0.4 | GO:0032977 | membrane insertase activity(GO:0032977) |
| 0.0 | 1.0 | GO:0019003 | GDP binding(GO:0019003) |
| 0.0 | 0.4 | GO:0004622 | lysophospholipase activity(GO:0004622) |
| 0.0 | 1.3 | GO:0030215 | semaphorin receptor binding(GO:0030215) |
| 0.0 | 1.0 | GO:0009055 | electron carrier activity(GO:0009055) |
| 0.0 | 0.5 | GO:0051010 | microtubule plus-end binding(GO:0051010) |
| 0.0 | 0.6 | GO:0000062 | fatty-acyl-CoA binding(GO:0000062) |
| 0.0 | 7.9 | GO:0061630 | ubiquitin protein ligase activity(GO:0061630) |
| 0.0 | 4.5 | GO:0019901 | protein kinase binding(GO:0019901) |
| 0.0 | 1.6 | GO:0016811 | hydrolase activity, acting on carbon-nitrogen (but not peptide) bonds, in linear amides(GO:0016811) |
| 0.0 | 2.0 | GO:0004222 | metalloendopeptidase activity(GO:0004222) |
| 0.0 | 0.2 | GO:0002161 | aminoacyl-tRNA editing activity(GO:0002161) |
| 0.0 | 2.5 | GO:0016616 | oxidoreductase activity, acting on the CH-OH group of donors, NAD or NADP as acceptor(GO:0016616) |
| 0.0 | 4.6 | GO:0008168 | methyltransferase activity(GO:0008168) |
| 0.0 | 0.6 | GO:0017124 | SH3 domain binding(GO:0017124) |
| 0.0 | 1.9 | GO:0020037 | heme binding(GO:0020037) |
| 0.0 | 0.9 | GO:0016836 | hydro-lyase activity(GO:0016836) |
| 0.0 | 10.0 | GO:0005509 | calcium ion binding(GO:0005509) |
| 0.0 | 20.8 | GO:0000981 | RNA polymerase II transcription factor activity, sequence-specific DNA binding(GO:0000981) |
| 0.0 | 0.2 | GO:0008420 | CTD phosphatase activity(GO:0008420) |
| 0.0 | 0.2 | GO:0017046 | peptide hormone binding(GO:0017046) |
| 0.0 | 0.7 | GO:0004715 | non-membrane spanning protein tyrosine kinase activity(GO:0004715) |
| 0.0 | 2.5 | GO:0003779 | actin binding(GO:0003779) |
| 0.0 | 0.2 | GO:0016709 | oxidoreductase activity, acting on paired donors, with incorporation or reduction of molecular oxygen, NAD(P)H as one donor, and incorporation of one atom of oxygen(GO:0016709) |
Gene overrepresentation in curated gene sets: canonical pathways category:
| Log-likelihood per target | Total log-likelihood | Term | Description |
|---|---|---|---|
| 0.5 | 8.6 | ST MYOCYTE AD PATHWAY | Myocyte Adrenergic Pathway is a specific case of the generalized Adrenergic Pathway. |
| 0.3 | 4.3 | PID ALK1 PATHWAY | ALK1 signaling events |
| 0.3 | 9.0 | PID BMP PATHWAY | BMP receptor signaling |
| 0.2 | 3.6 | PID ARF 3PATHWAY | Arf1 pathway |
| 0.2 | 3.6 | PID INSULIN GLUCOSE PATHWAY | Insulin-mediated glucose transport |
| 0.2 | 4.7 | PID HDAC CLASSIII PATHWAY | Signaling events mediated by HDAC Class III |
| 0.2 | 2.0 | PID IL23 PATHWAY | IL23-mediated signaling events |
| 0.1 | 1.8 | PID INTEGRIN A9B1 PATHWAY | Alpha9 beta1 integrin signaling events |
| 0.1 | 7.0 | NABA ECM AFFILIATED | Genes encoding proteins affiliated structurally or functionally to extracellular matrix proteins |
| 0.1 | 4.4 | PID VEGFR1 2 PATHWAY | Signaling events mediated by VEGFR1 and VEGFR2 |
| 0.1 | 3.4 | PID CDC42 REG PATHWAY | Regulation of CDC42 activity |
| 0.1 | 1.2 | PID HIF1A PATHWAY | Hypoxic and oxygen homeostasis regulation of HIF-1-alpha |
| 0.1 | 2.2 | PID TGFBR PATHWAY | TGF-beta receptor signaling |
| 0.1 | 1.0 | NABA PROTEOGLYCANS | Genes encoding proteoglycans |
| 0.1 | 1.4 | PID WNT SIGNALING PATHWAY | Wnt signaling network |
| 0.0 | 1.2 | PID AJDISS 2PATHWAY | Posttranslational regulation of adherens junction stability and dissassembly |
| 0.0 | 3.9 | NABA SECRETED FACTORS | Genes encoding secreted soluble factors |
| 0.0 | 1.4 | PID MET PATHWAY | Signaling events mediated by Hepatocyte Growth Factor Receptor (c-Met) |
| 0.0 | 0.3 | PID NFAT TFPATHWAY | Calcineurin-regulated NFAT-dependent transcription in lymphocytes |
| 0.0 | 2.1 | NABA ECM REGULATORS | Genes encoding enzymes and their regulators involved in the remodeling of the extracellular matrix |
Gene overrepresentation in curated gene sets: REACTOME pathways category:
| Log-likelihood per target | Total log-likelihood | Term | Description |
|---|---|---|---|
| 0.9 | 2.7 | REACTOME SYNTHESIS SECRETION AND INACTIVATION OF GIP | Genes involved in Synthesis, Secretion, and Inactivation of Glucose-dependent Insulinotropic Polypeptide (GIP) |
| 0.7 | 5.0 | REACTOME SEMA3A PAK DEPENDENT AXON REPULSION | Genes involved in Sema3A PAK dependent Axon repulsion |
| 0.7 | 4.9 | REACTOME INTERACTION BETWEEN L1 AND ANKYRINS | Genes involved in Interaction between L1 and Ankyrins |
| 0.6 | 5.5 | REACTOME OTHER SEMAPHORIN INTERACTIONS | Genes involved in Other semaphorin interactions |
| 0.5 | 3.5 | REACTOME GAP JUNCTION DEGRADATION | Genes involved in Gap junction degradation |
| 0.3 | 3.0 | REACTOME CHONDROITIN SULFATE BIOSYNTHESIS | Genes involved in Chondroitin sulfate biosynthesis |
| 0.2 | 3.9 | REACTOME NUCLEAR RECEPTOR TRANSCRIPTION PATHWAY | Genes involved in Nuclear Receptor transcription pathway |
| 0.2 | 2.0 | REACTOME IL 7 SIGNALING | Genes involved in Interleukin-7 signaling |
| 0.2 | 4.4 | REACTOME REGULATION OF BETA CELL DEVELOPMENT | Genes involved in Regulation of beta-cell development |
| 0.2 | 3.4 | REACTOME OXYGEN DEPENDENT PROLINE HYDROXYLATION OF HYPOXIA INDUCIBLE FACTOR ALPHA | Genes involved in Oxygen-dependent Proline Hydroxylation of Hypoxia-inducible Factor Alpha |
| 0.2 | 1.8 | REACTOME CGMP EFFECTS | Genes involved in cGMP effects |
| 0.2 | 1.6 | REACTOME TIGHT JUNCTION INTERACTIONS | Genes involved in Tight junction interactions |
| 0.2 | 2.4 | REACTOME CIRCADIAN REPRESSION OF EXPRESSION BY REV ERBA | Genes involved in Circadian Repression of Expression by REV-ERBA |
| 0.2 | 1.7 | REACTOME ENDOGENOUS STEROLS | Genes involved in Endogenous sterols |
| 0.1 | 2.4 | REACTOME CIRCADIAN CLOCK | Genes involved in Circadian Clock |
| 0.1 | 1.0 | REACTOME KERATAN SULFATE DEGRADATION | Genes involved in Keratan sulfate degradation |
| 0.1 | 0.6 | REACTOME INWARDLY RECTIFYING K CHANNELS | Genes involved in Inwardly rectifying K+ channels |
| 0.1 | 4.8 | REACTOME CLASS B 2 SECRETIN FAMILY RECEPTORS | Genes involved in Class B/2 (Secretin family receptors) |
| 0.1 | 1.8 | REACTOME SYNTHESIS OF PIPS AT THE EARLY ENDOSOME MEMBRANE | Genes involved in Synthesis of PIPs at the early endosome membrane |
| 0.1 | 1.2 | REACTOME PEPTIDE LIGAND BINDING RECEPTORS | Genes involved in Peptide ligand-binding receptors |
| 0.1 | 2.0 | REACTOME STRIATED MUSCLE CONTRACTION | Genes involved in Striated Muscle Contraction |
| 0.1 | 0.8 | REACTOME MTORC1 MEDIATED SIGNALLING | Genes involved in mTORC1-mediated signalling |
| 0.1 | 0.7 | REACTOME PURINE SALVAGE | Genes involved in Purine salvage |
| 0.1 | 1.8 | REACTOME SIGNALING BY ROBO RECEPTOR | Genes involved in Signaling by Robo receptor |
| 0.1 | 4.3 | REACTOME PPARA ACTIVATES GENE EXPRESSION | Genes involved in PPARA Activates Gene Expression |
| 0.1 | 0.6 | REACTOME INSULIN RECEPTOR RECYCLING | Genes involved in Insulin receptor recycling |
| 0.1 | 1.1 | REACTOME ANTIGEN PRESENTATION FOLDING ASSEMBLY AND PEPTIDE LOADING OF CLASS I MHC | Genes involved in Antigen Presentation: Folding, assembly and peptide loading of class I MHC |
| 0.1 | 1.1 | REACTOME NUCLEAR SIGNALING BY ERBB4 | Genes involved in Nuclear signaling by ERBB4 |
| 0.1 | 0.8 | REACTOME ION TRANSPORT BY P TYPE ATPASES | Genes involved in Ion transport by P-type ATPases |
| 0.0 | 2.1 | REACTOME ACTIVATION OF CHAPERONE GENES BY XBP1S | Genes involved in Activation of Chaperone Genes by XBP1(S) |
| 0.0 | 1.1 | REACTOME CYTOSOLIC TRNA AMINOACYLATION | Genes involved in Cytosolic tRNA aminoacylation |
| 0.0 | 6.8 | REACTOME METABOLISM OF AMINO ACIDS AND DERIVATIVES | Genes involved in Metabolism of amino acids and derivatives |
| 0.0 | 0.7 | REACTOME NETRIN1 SIGNALING | Genes involved in Netrin-1 signaling |
| 0.0 | 2.3 | REACTOME RESPIRATORY ELECTRON TRANSPORT | Genes involved in Respiratory electron transport |
| 0.0 | 2.9 | REACTOME SIGNALING BY RHO GTPASES | Genes involved in Signaling by Rho GTPases |
| 0.0 | 0.5 | REACTOME AMINO ACID TRANSPORT ACROSS THE PLASMA MEMBRANE | Genes involved in Amino acid transport across the plasma membrane |
| 0.0 | 0.8 | REACTOME INTERACTIONS OF VPR WITH HOST CELLULAR PROTEINS | Genes involved in Interactions of Vpr with host cellular proteins |
| 0.0 | 1.0 | REACTOME GOLGI ASSOCIATED VESICLE BIOGENESIS | Genes involved in Golgi Associated Vesicle Biogenesis |
| 0.0 | 0.4 | REACTOME SYNTHESIS OF GLYCOSYLPHOSPHATIDYLINOSITOL GPI | Genes involved in Synthesis of glycosylphosphatidylinositol (GPI) |