Project
DANIO-CODE
Navigation
Downloads
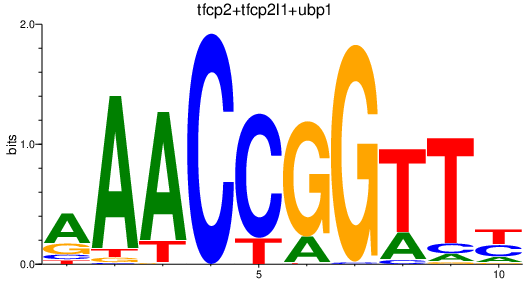
Results for tfcp2+tfcp2l1+ubp1
Z-value: 2.91
Motif logo
Transcription factors associated with tfcp2+tfcp2l1+ubp1
| Gene Symbol | Gene ID | Gene Info |
|---|---|---|
|
ubp1
|
ENSDARG00000018000 | upstream binding protein 1 |
|
tfcp2l1
|
ENSDARG00000029497 | transcription factor CP2-like 1 |
|
tfcp2
|
ENSDARG00000060306 | transcription factor CP2 |
Activity-expression correlation:
| Gene | Promoter | Pearson corr. coef. | P-value | Plot |
|---|---|---|---|---|
| tfcp2 | dr10_dc_chr23_-_33753484_33753531 | -0.27 | 3.1e-01 | Click! |
| ubp1 | dr10_dc_chr19_+_43237078_43237198 | 0.26 | 3.4e-01 | Click! |
Activity profile of tfcp2+tfcp2l1+ubp1 motif
Sorted Z-values of tfcp2+tfcp2l1+ubp1 motif
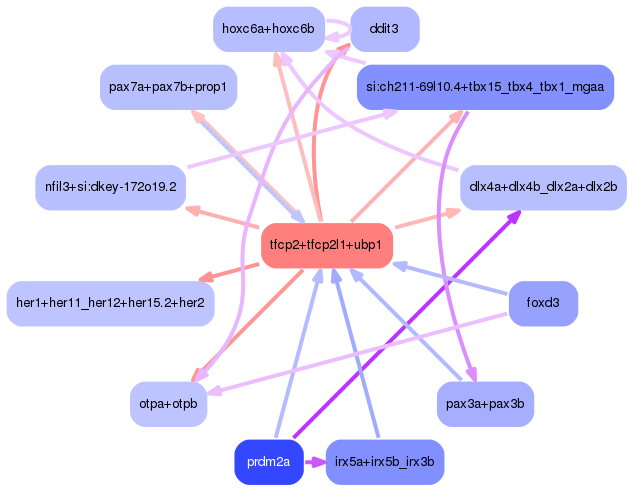
Network of associatons between targets according to the STRING database.

First level regulatory network of tfcp2+tfcp2l1+ubp1
| Promoter | Score | Transcript | Gene | Gene Info |
|---|---|---|---|---|
| chr3_-_27516974 | 12.14 |
ENSDART00000151675
|
si:ch211-157c3.4
|
si:ch211-157c3.4 |
| chr10_+_39141022 | 6.56 |
ENSDART00000158245
|
si:ch73-1a9.3
|
si:ch73-1a9.3 |
| chr12_-_7572970 | 6.08 |
ENSDART00000158095
|
slc16a9b
|
solute carrier family 16, member 9b |
| chr13_+_28364942 | 5.54 |
ENSDART00000025583
|
fgf8a
|
fibroblast growth factor 8a |
| chr22_+_21996941 | 5.49 |
ENSDART00000149586
|
gna15.1
|
guanine nucleotide binding protein (G protein), alpha 15 (Gq class), tandem duplicate 1 |
| chr10_+_39140943 | 5.48 |
ENSDART00000158245
|
si:ch73-1a9.3
|
si:ch73-1a9.3 |
| chr21_+_25651712 | 5.48 |
ENSDART00000135123
|
si:dkey-17e16.17
|
si:dkey-17e16.17 |
| chr8_-_3253562 | 5.40 |
ENSDART00000035965
|
fut9b
|
fucosyltransferase 9b |
| chr10_-_15090647 | 5.19 |
ENSDART00000038401
ENSDART00000155674 |
si:ch211-95j8.2
|
si:ch211-95j8.2 |
| chr24_+_38783264 | 4.94 |
ENSDART00000154214
|
si:ch73-70c5.1
|
si:ch73-70c5.1 |
| chr13_+_28365036 | 4.81 |
ENSDART00000025583
|
fgf8a
|
fibroblast growth factor 8a |
| chr20_-_23184142 | 4.80 |
ENSDART00000176282
|
CU693368.2
|
ENSDARG00000108718 |
| chr24_+_5906087 | 4.67 |
ENSDART00000131768
|
abi1a
|
abl-interactor 1a |
| chr21_+_26684617 | 4.61 |
ENSDART00000053797
|
slc3a2b
|
solute carrier family 3 (amino acid transporter heavy chain), member 2b |
| chr22_+_21997000 | 4.49 |
ENSDART00000046174
|
gna15.1
|
guanine nucleotide binding protein (G protein), alpha 15 (Gq class), tandem duplicate 1 |
| chr14_+_37206949 | 4.46 |
|
|
|
| chr1_-_46015367 | 4.45 |
ENSDART00000074519
|
kpna3
|
karyopherin alpha 3 (importin alpha 4) |
| chr9_-_45802484 | 4.42 |
ENSDART00000139019
|
agr1
|
anterior gradient 1 |
| chr16_+_51316772 | 4.31 |
ENSDART00000169022
|
hmgn2
|
high mobility group nucleosomal binding domain 2 |
| chr17_-_33463482 | 4.28 |
ENSDART00000164064
|
ccdc28a
|
coiled-coil domain containing 28A |
| chr1_+_57944027 | 4.28 |
ENSDART00000123441
ENSDART00000160728 |
zmp:0000000981
|
zmp:0000000981 |
| chr3_-_27517052 | 4.01 |
ENSDART00000151625
|
si:ch211-157c3.4
|
si:ch211-157c3.4 |
| chr3_-_29846530 | 3.97 |
ENSDART00000077111
|
hsd17b14
|
hydroxysteroid (17-beta) dehydrogenase 14 |
| chr1_+_57944135 | 3.95 |
ENSDART00000123441
ENSDART00000160728 |
zmp:0000000981
|
zmp:0000000981 |
| chr21_+_25588388 | 3.90 |
ENSDART00000134678
|
ENSDARG00000078256
|
ENSDARG00000078256 |
| chr21_-_32403403 | 3.90 |
ENSDART00000076974
|
gfpt2
|
glutamine-fructose-6-phosphate transaminase 2 |
| chr11_+_7518953 | 3.70 |
ENSDART00000171813
|
adgrl2a
|
adhesion G protein-coupled receptor L2a |
| chr10_-_8029671 | 3.64 |
ENSDART00000141445
|
ewsr1a
|
EWS RNA-binding protein 1a |
| chr8_+_53173227 | 3.55 |
ENSDART00000131514
|
nadka
|
NAD kinase a |
| chr5_-_27441539 | 3.42 |
ENSDART00000134871
|
zgc:113436
|
zgc:113436 |
| chr20_-_25732091 | 3.38 |
ENSDART00000048164
|
paics
|
phosphoribosylaminoimidazole carboxylase, phosphoribosylaminoimidazole succinocarboxamide synthetase |
| chr7_+_24770873 | 3.28 |
ENSDART00000165314
|
AL954715.1
|
ENSDARG00000103682 |
| chr5_-_68024401 | 3.08 |
ENSDART00000016307
|
her1
|
hairy-related 1 |
| chr6_+_58921655 | 3.07 |
ENSDART00000083628
|
ddit3
|
DNA-damage-inducible transcript 3 |
| chr5_+_30141562 | 3.05 |
ENSDART00000098246
|
ftr83
|
finTRIM family, member 83 |
| chr8_-_13503775 | 2.96 |
ENSDART00000063834
|
ENSDARG00000043482
|
ENSDARG00000043482 |
| chr1_-_50831155 | 2.95 |
ENSDART00000152719
|
spred2a
|
sprouty-related, EVH1 domain containing 2a |
| chr5_-_50972677 | 2.95 |
ENSDART00000134606
|
otpb
|
orthopedia homeobox b |
| chr5_-_30114539 | 2.95 |
ENSDART00000016758
|
ftr82
|
finTRIM family, member 82 |
| chr7_+_73448324 | 2.85 |
ENSDART00000050357
ENSDART00000110769 |
btr12
|
bloodthirsty-related gene family, member 12 |
| chr4_-_76594677 | 2.81 |
ENSDART00000049170
|
zgc:85975
|
zgc:85975 |
| chr24_-_26334717 | 2.78 |
ENSDART00000079984
ENSDART00000136871 |
rpl22l1
|
ribosomal protein L22-like 1 |
| chr7_+_23782982 | 2.75 |
|
|
|
| chr24_+_13780640 | 2.73 |
ENSDART00000136443
ENSDART00000081595 ENSDART00000012253 |
eya1
|
EYA transcriptional coactivator and phosphatase 1 |
| chr23_+_17428740 | 2.70 |
|
|
|
| chr4_+_13453879 | 2.61 |
ENSDART00000145069
|
dyrk2
|
dual-specificity tyrosine-(Y)-phosphorylation regulated kinase 2 |
| chr16_-_6484112 | 2.58 |
ENSDART00000164864
ENSDART00000141860 ENSDART00000019813 |
mboat1
|
membrane bound O-acyltransferase domain containing 1 |
| chr11_+_7570027 | 2.54 |
ENSDART00000091550
|
adgrl2a
|
adhesion G protein-coupled receptor L2a |
| chr15_+_5914095 | 2.49 |
ENSDART00000114134
|
wrb
|
tryptophan rich basic protein |
| chr17_+_23947816 | 2.49 |
|
|
|
| chr7_-_55214437 | 2.42 |
ENSDART00000108646
|
piezo1
|
piezo-type mechanosensitive ion channel component 1 |
| chr14_-_25659535 | 2.39 |
ENSDART00000135627
|
sparc
|
secreted protein, acidic, cysteine-rich (osteonectin) |
| chr24_-_38782898 | 2.38 |
ENSDART00000155542
|
FP102170.1
|
ENSDARG00000097123 |
| chr7_-_38521262 | 2.37 |
ENSDART00000157416
|
si:dkey-23n7.10
|
si:dkey-23n7.10 |
| chr25_-_13631707 | 2.32 |
ENSDART00000169865
|
lcat
|
lecithin-cholesterol acyltransferase |
| chr2_+_27835370 | 2.31 |
ENSDART00000078305
|
zswim5
|
zinc finger, SWIM-type containing 5 |
| chr13_+_12901332 | 2.26 |
ENSDART00000109906
|
letm1
|
leucine zipper-EF-hand containing transmembrane protein 1 |
| chr5_+_39067074 | 2.25 |
ENSDART00000085388
|
bmp3
|
bone morphogenetic protein 3 |
| chr15_+_14048904 | 2.24 |
ENSDART00000159438
|
zgc:162730
|
zgc:162730 |
| chr24_-_16993914 | 2.24 |
|
|
|
| chr3_+_12432686 | 2.18 |
|
|
|
| chr7_+_57423271 | 2.16 |
ENSDART00000056466
|
camk2d1
|
calcium/calmodulin-dependent protein kinase (CaM kinase) II delta 1 |
| chr13_+_18401965 | 2.15 |
ENSDART00000136024
|
ftr14l
|
finTRIM family, member 14-like |
| chr6_-_56127516 | 2.14 |
ENSDART00000154397
|
gcnt7
|
glucosaminyl (N-acetyl) transferase family member 7 |
| chr14_-_30747448 | 2.14 |
ENSDART00000002250
|
hs6st2
|
heparan sulfate 6-O-sulfotransferase 2 |
| chr13_-_11873376 | 2.14 |
ENSDART00000111438
|
mgea5
|
meningioma expressed antigen 5 (hyaluronidase) |
| chr8_-_52729505 | 2.12 |
ENSDART00000168241
|
tubb2b
|
tubulin, beta 2b |
| chr1_-_45709828 | 2.10 |
ENSDART00000150029
|
atp11a
|
ATPase, class VI, type 11A |
| chr3_-_38642067 | 2.10 |
ENSDART00000155518
|
znf281a
|
zinc finger protein 281a |
| chr11_+_7570097 | 2.08 |
ENSDART00000091550
|
adgrl2a
|
adhesion G protein-coupled receptor L2a |
| chr17_-_13072982 | 2.06 |
ENSDART00000178859
|
CABZ01047998.1
|
ENSDARG00000105945 |
| chr12_+_30119269 | 2.06 |
ENSDART00000102081
|
afap1l2
|
actin filament associated protein 1-like 2 |
| chr11_+_44460956 | 2.05 |
ENSDART00000168531
|
irf2bp2b
|
interferon regulatory factor 2 binding protein 2b |
| chr3_-_12432661 | 2.05 |
|
|
|
| chr4_+_6024067 | 2.04 |
|
|
|
| chr23_-_9556986 | 2.02 |
ENSDART00000139688
|
soga1
|
suppressor of glucose, autophagy associated 1 |
| chr21_-_36338704 | 2.01 |
ENSDART00000157826
|
mpp1
|
membrane protein, palmitoylated 1 |
| chr6_-_49527428 | 1.98 |
ENSDART00000128025
|
rps26l
|
ribosomal protein S26, like |
| chr9_+_25117850 | 1.97 |
|
|
|
| chr19_+_25288143 | 1.95 |
ENSDART00000158490
|
si:ch211-195b13.1
|
si:ch211-195b13.1 |
| chr17_-_23947646 | 1.95 |
|
|
|
| chr5_+_25604463 | 1.94 |
ENSDART00000137178
|
marveld2b
|
MARVEL domain containing 2b |
| chr13_-_7435355 | 1.86 |
ENSDART00000121952
|
h2afy2
|
H2A histone family, member Y2 |
| chr20_+_27017427 | 1.85 |
ENSDART00000077787
|
serpinb1l2
|
serpin peptidase inhibitor, clade B (ovalbumin), member 1, like 2 |
| chr6_-_35417797 | 1.85 |
ENSDART00000016586
|
rgs5a
|
regulator of G protein signaling 5a |
| chr23_+_7537089 | 1.84 |
ENSDART00000135551
|
si:ch211-200e2.1
|
si:ch211-200e2.1 |
| chr24_-_38899781 | 1.83 |
ENSDART00000112318
|
ntn2
|
netrin 2 |
| chr18_-_54695 | 1.80 |
|
|
|
| chr19_+_5054263 | 1.78 |
|
|
|
| chr2_+_48052054 | 1.77 |
ENSDART00000159701
|
ftr23
|
finTRIM family, member 23 |
| chr7_-_52142689 | 1.72 |
ENSDART00000110265
|
myzap
|
myocardial zonula adherens protein |
| chr11_-_176933 | 1.72 |
ENSDART00000172920
|
cdk4
|
cyclin-dependent kinase 4 |
| chr5_-_45729685 | 1.70 |
ENSDART00000156577
|
si:ch211-130m23.5
|
si:ch211-130m23.5 |
| chr23_-_21520413 | 1.70 |
ENSDART00000044080
ENSDART00000112929 |
her12
|
hairy-related 12 |
| chr23_+_17428538 | 1.69 |
|
|
|
| chr17_-_33463210 | 1.68 |
ENSDART00000135218
|
ccdc28a
|
coiled-coil domain containing 28A |
| chr20_+_16982314 | 1.67 |
ENSDART00000146625
|
nfkbiaa
|
nuclear factor of kappa light polypeptide gene enhancer in B-cells inhibitor, alpha a |
| chr23_-_35392359 | 1.65 |
ENSDART00000166167
|
fam110c
|
family with sequence similarity 110, member C |
| chr24_-_16994956 | 1.64 |
ENSDART00000111079
|
CR376737.1
|
ENSDARG00000077318 |
| chr10_-_8430916 | 1.63 |
ENSDART00000059322
|
ENSDARG00000040535
|
ENSDARG00000040535 |
| chr15_-_5913508 | 1.62 |
ENSDART00000155252
|
si:ch73-281n10.2
|
si:ch73-281n10.2 |
| chr4_-_48619116 | 1.62 |
ENSDART00000150372
|
znf1061
|
zinc finger protein 1061 |
| chr14_+_49921861 | 1.61 |
ENSDART00000173240
|
zgc:154054
|
zgc:154054 |
| chr15_+_1043976 | 1.61 |
ENSDART00000157310
|
si:dkey-77f5.8
|
si:dkey-77f5.8 |
| chr5_+_35998939 | 1.61 |
ENSDART00000141668
|
micu2
|
mitochondrial calcium uptake 2 |
| chr3_+_32360862 | 1.59 |
ENSDART00000151329
|
trpm4a
|
transient receptor potential cation channel, subfamily M, member 4a |
| chr6_-_49527616 | 1.59 |
ENSDART00000128025
|
rps26l
|
ribosomal protein S26, like |
| chr20_+_10179249 | 1.59 |
ENSDART00000141877
|
kcnk10a
|
potassium channel, subfamily K, member 10a |
| chr10_+_5413893 | 1.57 |
ENSDART00000138821
|
nfil3
|
nuclear factor, interleukin 3 regulated |
| chr23_-_34060195 | 1.56 |
ENSDART00000144609
|
tmed4
|
transmembrane p24 trafficking protein 4 |
| chr24_+_20815964 | 1.54 |
ENSDART00000133008
|
si:ch211-161h7.8
|
si:ch211-161h7.8 |
| chr14_+_4489377 | 1.53 |
ENSDART00000041468
|
ap1ar
|
adaptor-related protein complex 1 associated regulatory protein |
| chr21_-_32403459 | 1.52 |
ENSDART00000076974
|
gfpt2
|
glutamine-fructose-6-phosphate transaminase 2 |
| chr3_+_32293441 | 1.51 |
ENSDART00000156464
|
prr12b
|
proline rich 12b |
| chr4_-_22798521 | 1.51 |
ENSDART00000002851
ENSDART00000123801 ENSDART00000130409 |
kdm7aa
|
lysine (K)-specific demethylase 7Aa |
| chr5_+_39066996 | 1.50 |
ENSDART00000085388
|
bmp3
|
bone morphogenetic protein 3 |
| chr19_-_7235125 | 1.48 |
|
|
|
| KN149990v1_+_7243 | 1.46 |
|
|
|
| chr10_+_34482404 | 1.43 |
ENSDART00000102566
|
nbeaa
|
neurobeachin a |
| chr22_+_528076 | 1.42 |
|
|
|
| chr4_+_56996802 | 1.42 |
|
|
|
| chr2_-_23331500 | 1.42 |
ENSDART00000146497
|
mllt1b
|
myeloid/lymphoid or mixed-lineage leukemia; translocated to, 1b |
| chr19_-_35642440 | 1.39 |
ENSDART00000167853
ENSDART00000054274 |
macf1a
|
microtubule-actin crosslinking factor 1a |
| chr17_+_52024610 | 1.38 |
|
|
|
| chr3_-_22083446 | 1.37 |
ENSDART00000154818
|
maptb
|
microtubule-associated protein tau b |
| chr1_-_37475807 | 1.35 |
ENSDART00000020409
|
hand2
|
heart and neural crest derivatives expressed 2 |
| KN149682v1_+_59396 | 1.35 |
ENSDART00000164990
|
BX005448.2
|
ENSDARG00000101349 |
| chr5_+_14703190 | 1.32 |
ENSDART00000040826
|
tbx1
|
T-box 1 |
| chr16_+_5256773 | 1.32 |
ENSDART00000012053
|
elovl4a
|
ELOVL fatty acid elongase 4a |
| chr4_-_46821459 | 1.32 |
ENSDART00000168605
|
znf1063
|
zinc finger protein 1063 |
| chr7_+_60992745 | 1.31 |
ENSDART00000083255
|
adam19a
|
ADAM metallopeptidase domain 19a |
| chr15_-_12484651 | 1.30 |
ENSDART00000162258
|
BX901957.1
|
ENSDARG00000098363 |
| chr3_+_1381679 | 1.30 |
ENSDART00000148524
|
nol12
|
nucleolar protein 12 |
| chr11_-_36088889 | 1.29 |
ENSDART00000146495
|
psma5
|
proteasome subunit alpha 5 |
| chr24_+_13780553 | 1.27 |
ENSDART00000138119
ENSDART00000134221 |
eya1
|
EYA transcriptional coactivator and phosphatase 1 |
| chr13_-_44676277 | 1.25 |
|
|
|
| chr7_+_19583578 | 1.25 |
ENSDART00000149812
|
ovol1
|
ovo-like zinc finger 1 |
| chr10_+_22566353 | 1.25 |
ENSDART00000079514
|
efnb3a
|
ephrin-B3a |
| chr6_-_56127409 | 1.24 |
ENSDART00000154397
|
gcnt7
|
glucosaminyl (N-acetyl) transferase family member 7 |
| chr12_-_31609517 | 1.24 |
ENSDART00000080173
|
srsf2a
|
serine/arginine-rich splicing factor 2a |
| chr21_+_26684728 | 1.21 |
ENSDART00000053797
|
slc3a2b
|
solute carrier family 3 (amino acid transporter heavy chain), member 2b |
| chr19_+_31989527 | 1.20 |
ENSDART00000088401
|
acot13
|
acyl-CoA thioesterase 13 |
| chr4_-_71856428 | 1.18 |
ENSDART00000158977
|
si:ch73-266f23.1
|
si:ch73-266f23.1 |
| chr9_-_3429153 | 1.18 |
ENSDART00000111386
|
dlx2a
|
distal-less homeobox 2a |
| chr7_+_20251345 | 1.14 |
ENSDART00000157699
|
si:dkey-19b23.12
|
si:dkey-19b23.12 |
| chr4_+_10707861 | 1.14 |
ENSDART00000102543
|
wnt16
|
wingless-type MMTV integration site family, member 16 |
| chr7_+_63014869 | 1.13 |
ENSDART00000161436
|
pcdh7b
|
protocadherin 7b |
| chr21_-_13052143 | 1.13 |
ENSDART00000172578
|
si:dkey-228b2.6
|
si:dkey-228b2.6 |
| chr12_-_31609402 | 1.12 |
ENSDART00000080173
|
srsf2a
|
serine/arginine-rich splicing factor 2a |
| chr4_-_76594399 | 1.12 |
ENSDART00000049170
|
zgc:85975
|
zgc:85975 |
| KN149764v1_-_1960 | 1.11 |
|
|
|
| chr2_-_58272475 | 1.09 |
ENSDART00000166282
ENSDART00000159040 |
pnp5b
|
purine nucleoside phosphorylase 5b |
| chr1_+_46794847 | 1.09 |
ENSDART00000140846
|
lrrc58a
|
leucine rich repeat containing 58a |
| chr5_+_64159481 | 1.08 |
ENSDART00000073953
|
lrrc8ab
|
leucine rich repeat containing 8 family, member Ab |
| chr14_-_46649324 | 1.07 |
|
|
|
| chr25_+_17148124 | 1.07 |
ENSDART00000050379
|
kdm7ab
|
lysine (K)-specific demethylase 7Ab |
| chr4_+_10065956 | 1.07 |
ENSDART00000026492
|
flncb
|
filamin C, gamma b (actin binding protein 280) |
| chr2_-_57502941 | 1.06 |
|
|
|
| chr7_-_40385050 | 1.06 |
ENSDART00000142315
|
nom1
|
nucleolar protein with MIF4G domain 1 |
| chr7_+_28862183 | 1.04 |
ENSDART00000052346
|
gnao1b
|
guanine nucleotide binding protein (G protein), alpha activating activity polypeptide O, b |
| chr20_+_22813503 | 1.04 |
|
|
|
| chr12_+_30119447 | 1.04 |
ENSDART00000102081
|
afap1l2
|
actin filament associated protein 1-like 2 |
| chr2_+_314278 | 1.03 |
ENSDART00000155595
|
zgc:174263
|
zgc:174263 |
| chr20_-_27193158 | 1.03 |
ENSDART00000062096
|
si:dkeyp-55f12.3
|
si:dkeyp-55f12.3 |
| chr2_-_15894180 | 1.00 |
ENSDART00000172588
|
col11a1b
|
collagen, type XI, alpha 1b |
| chr4_-_35856278 | 1.00 |
ENSDART00000162568
|
znf1125
|
zinc finger protein 1125 |
| chr11_+_7570326 | 0.99 |
ENSDART00000091550
|
adgrl2a
|
adhesion G protein-coupled receptor L2a |
| chr4_+_13453584 | 0.99 |
ENSDART00000145069
|
dyrk2
|
dual-specificity tyrosine-(Y)-phosphorylation regulated kinase 2 |
| chr12_+_26971596 | 0.98 |
|
|
|
| chr10_+_34482499 | 0.98 |
ENSDART00000102566
|
nbeaa
|
neurobeachin a |
| chr4_+_20093762 | 0.98 |
ENSDART00000066961
|
ppp6r2a
|
protein phosphatase 6, regulatory subunit 2a |
| chr1_-_54505398 | 0.96 |
ENSDART00000100619
ENSDART00000163796 |
LUC7L2
|
zgc:158803 |
| chr21_-_13052351 | 0.95 |
ENSDART00000172578
|
si:dkey-228b2.6
|
si:dkey-228b2.6 |
| chr15_-_47234665 | 0.93 |
ENSDART00000124474
|
CU633855.1
|
ENSDARG00000089563 |
| chr2_+_289138 | 0.93 |
ENSDART00000157246
|
znf1008
|
zinc finger protein 1008 |
| KN149990v1_+_7315 | 0.93 |
|
|
|
| chr17_-_24548534 | 0.92 |
|
|
|
| chr2_-_42185811 | 0.90 |
ENSDART00000140788
|
gbp1
|
guanylate binding protein 1 |
| chr19_-_19883594 | 0.89 |
|
|
|
| chr1_+_57944228 | 0.88 |
ENSDART00000123441
ENSDART00000160728 |
zmp:0000000981
|
zmp:0000000981 |
| chr4_+_28506601 | 0.88 |
ENSDART00000113296
|
si:ch73-289h5.4
|
si:ch73-289h5.4 |
| chr24_-_34449257 | 0.85 |
ENSDART00000128690
|
agap3
|
ArfGAP with GTPase domain, ankyrin repeat and PH domain 3 |
| chr24_+_20391758 | 0.85 |
ENSDART00000082082
|
gars
|
glycyl-tRNA synthetase |
| chr5_-_67580755 | 0.83 |
ENSDART00000169350
|
ENSDARG00000098655
|
ENSDARG00000098655 |
| chr14_-_33604914 | 0.83 |
ENSDART00000168546
|
zdhhc24
|
zinc finger, DHHC-type containing 24 |
| chr20_-_34742647 | 0.82 |
|
|
|
| chr17_+_22359660 | 0.82 |
ENSDART00000162670
|
slc8a1b
|
solute carrier family 8 (sodium/calcium exchanger), member 1b |
| chr3_+_22724101 | 0.79 |
ENSDART00000167127
|
BX322574.1
|
ENSDARG00000098353 |
| chr4_+_75509365 | 0.79 |
|
|
|
| chr21_-_43020159 | 0.78 |
ENSDART00000065097
|
dpysl3
|
dihydropyrimidinase-like 3 |
| chr23_+_36016450 | 0.77 |
ENSDART00000103035
|
hoxc6a
|
homeobox C6a |
| chr23_+_14834670 | 0.77 |
ENSDART00000143675
|
si:rp71-79p20.2
|
si:rp71-79p20.2 |
| KN149695v1_+_135563 | 0.76 |
|
|
|
| chr20_-_36513964 | 0.76 |
ENSDART00000076419
|
lbr
|
lamin B receptor |
| chr6_+_3703684 | 0.76 |
ENSDART00000013743
|
gorasp2
|
golgi reassembly stacking protein 2 |
| chr12_-_31609321 | 0.75 |
ENSDART00000165299
|
srsf2a
|
serine/arginine-rich splicing factor 2a |
| chr7_+_36267647 | 0.75 |
ENSDART00000173653
|
chd9
|
chromodomain helicase DNA binding protein 9 |
| chr4_+_10066018 | 0.75 |
ENSDART00000026492
|
flncb
|
filamin C, gamma b (actin binding protein 280) |
| chr9_+_7477732 | 0.74 |
ENSDART00000061723
|
tmem198a
|
transmembrane protein 198a |
| chr10_+_22566556 | 0.74 |
ENSDART00000079514
|
efnb3a
|
ephrin-B3a |
Gene Ontology Analysis
Gene overrepresentation in biological process category:
| Log-likelihood per target | Total log-likelihood | Term | Description |
|---|---|---|---|
| 2.6 | 10.3 | GO:0043587 | tongue development(GO:0043586) tongue morphogenesis(GO:0043587) taste bud development(GO:0061193) taste bud morphogenesis(GO:0061194) taste bud formation(GO:0061195) |
| 1.0 | 3.1 | GO:0032675 | interleukin-6 production(GO:0032635) regulation of interleukin-6 production(GO:0032675) |
| 1.0 | 3.1 | GO:2001244 | positive regulation of intrinsic apoptotic signaling pathway(GO:2001244) |
| 0.9 | 10.0 | GO:0060158 | phospholipase C-activating dopamine receptor signaling pathway(GO:0060158) |
| 0.7 | 2.9 | GO:0010799 | regulation of peptidyl-threonine phosphorylation(GO:0010799) negative regulation of peptidyl-threonine phosphorylation(GO:0010801) |
| 0.7 | 5.8 | GO:0060142 | regulation of syncytium formation by plasma membrane fusion(GO:0060142) |
| 0.7 | 4.0 | GO:2001240 | histone dephosphorylation(GO:0016576) negative regulation of signal transduction in absence of ligand(GO:1901099) regulation of extrinsic apoptotic signaling pathway in absence of ligand(GO:2001239) negative regulation of extrinsic apoptotic signaling pathway in absence of ligand(GO:2001240) |
| 0.6 | 2.4 | GO:0010482 | epidermal cell division(GO:0010481) regulation of epidermal cell division(GO:0010482) |
| 0.5 | 1.6 | GO:0002706 | regulation of lymphocyte mediated immunity(GO:0002706) |
| 0.5 | 2.6 | GO:0033169 | histone H3-K9 demethylation(GO:0033169) |
| 0.5 | 2.1 | GO:0002762 | negative regulation of myeloid leukocyte differentiation(GO:0002762) |
| 0.5 | 3.9 | GO:0006851 | mitochondrial calcium ion transport(GO:0006851) |
| 0.5 | 2.3 | GO:0006741 | NADP biosynthetic process(GO:0006741) |
| 0.5 | 1.4 | GO:0060832 | oocyte animal/vegetal axis specification(GO:0060832) |
| 0.5 | 1.4 | GO:0071908 | determination of intestine left/right asymmetry(GO:0071908) |
| 0.5 | 5.4 | GO:0006002 | fructose 6-phosphate metabolic process(GO:0006002) |
| 0.4 | 1.3 | GO:0061323 | cell proliferation involved in heart morphogenesis(GO:0061323) regulation of cell proliferation involved in heart morphogenesis(GO:2000136) |
| 0.4 | 1.2 | GO:1902871 | negative regulation of photoreceptor cell differentiation(GO:0046533) regulation of amacrine cell differentiation(GO:1902869) positive regulation of amacrine cell differentiation(GO:1902871) |
| 0.4 | 4.4 | GO:0006607 | NLS-bearing protein import into nucleus(GO:0006607) |
| 0.4 | 3.6 | GO:0000022 | mitotic spindle elongation(GO:0000022) spindle elongation(GO:0051231) mitotic spindle midzone assembly(GO:0051256) |
| 0.3 | 0.9 | GO:0071236 | cellular response to antibiotic(GO:0071236) cellular response to toxic substance(GO:0097237) |
| 0.3 | 2.1 | GO:0015015 | heparan sulfate proteoglycan biosynthetic process, enzymatic modification(GO:0015015) |
| 0.3 | 1.5 | GO:1900024 | regulation of substrate adhesion-dependent cell spreading(GO:1900024) |
| 0.2 | 2.8 | GO:0006189 | 'de novo' IMP biosynthetic process(GO:0006189) |
| 0.2 | 0.6 | GO:0070254 | mucus secretion(GO:0070254) |
| 0.2 | 2.3 | GO:0021767 | mammillary body development(GO:0021767) |
| 0.2 | 4.3 | GO:0001649 | osteoblast differentiation(GO:0001649) |
| 0.2 | 1.1 | GO:0007343 | egg activation(GO:0007343) |
| 0.2 | 1.1 | GO:0072498 | embryonic skeletal joint development(GO:0072498) |
| 0.2 | 0.7 | GO:0034505 | tooth mineralization(GO:0034505) |
| 0.2 | 2.1 | GO:0045332 | phospholipid translocation(GO:0045332) |
| 0.2 | 8.8 | GO:0007189 | adenylate cyclase-activating G-protein coupled receptor signaling pathway(GO:0007189) |
| 0.2 | 1.6 | GO:0030322 | stabilization of membrane potential(GO:0030322) |
| 0.2 | 0.8 | GO:0051491 | positive regulation of filopodium assembly(GO:0051491) |
| 0.1 | 1.0 | GO:0007212 | dopamine receptor signaling pathway(GO:0007212) |
| 0.1 | 3.1 | GO:0001757 | somite specification(GO:0001757) |
| 0.1 | 0.7 | GO:0045053 | protein retention in Golgi apparatus(GO:0045053) |
| 0.1 | 0.5 | GO:0050938 | regulation of xanthophore differentiation(GO:0050938) |
| 0.1 | 1.8 | GO:0046716 | muscle cell cellular homeostasis(GO:0046716) |
| 0.1 | 1.7 | GO:1903707 | negative regulation of hemopoiesis(GO:1903707) |
| 0.1 | 6.1 | GO:0015718 | monocarboxylic acid transport(GO:0015718) |
| 0.1 | 2.0 | GO:0048013 | ephrin receptor signaling pathway(GO:0048013) |
| 0.1 | 4.1 | GO:0018107 | peptidyl-threonine phosphorylation(GO:0018107) |
| 0.1 | 2.4 | GO:0048752 | semicircular canal morphogenesis(GO:0048752) |
| 0.1 | 0.2 | GO:0034370 | triglyceride-rich lipoprotein particle remodeling(GO:0034370) very-low-density lipoprotein particle remodeling(GO:0034372) reverse cholesterol transport(GO:0043691) phospholipid homeostasis(GO:0055091) |
| 0.1 | 0.7 | GO:1900449 | regulation of glutamate receptor signaling pathway(GO:1900449) |
| 0.1 | 4.2 | GO:0016358 | dendrite development(GO:0016358) |
| 0.1 | 0.2 | GO:0060397 | JAK-STAT cascade involved in growth hormone signaling pathway(GO:0060397) |
| 0.1 | 1.3 | GO:0010499 | proteasomal ubiquitin-independent protein catabolic process(GO:0010499) |
| 0.0 | 1.3 | GO:0034626 | fatty acid elongation, saturated fatty acid(GO:0019367) fatty acid elongation, unsaturated fatty acid(GO:0019368) fatty acid elongation, monounsaturated fatty acid(GO:0034625) fatty acid elongation, polyunsaturated fatty acid(GO:0034626) |
| 0.0 | 0.1 | GO:0019884 | antigen processing and presentation of exogenous peptide antigen(GO:0002478) antigen processing and presentation of exogenous antigen(GO:0019884) antigen processing and presentation of exogenous peptide antigen via MHC class I(GO:0042590) |
| 0.0 | 3.7 | GO:0000381 | regulation of alternative mRNA splicing, via spliceosome(GO:0000381) |
| 0.0 | 0.5 | GO:0009303 | rRNA transcription(GO:0009303) |
| 0.0 | 4.4 | GO:0031101 | fin regeneration(GO:0031101) |
| 0.0 | 0.6 | GO:0030007 | cellular potassium ion homeostasis(GO:0030007) sodium ion export from cell(GO:0036376) sodium ion export(GO:0071436) |
| 0.0 | 0.1 | GO:0051045 | negative regulation of membrane protein ectodomain proteolysis(GO:0051045) |
| 0.0 | 2.6 | GO:0007030 | Golgi organization(GO:0007030) |
| 0.0 | 0.2 | GO:0036445 | neuronal stem cell division(GO:0036445) somatic stem cell division(GO:0048103) |
| 0.0 | 2.3 | GO:1902667 | regulation of axon guidance(GO:1902667) |
| 0.0 | 2.5 | GO:0060216 | definitive hemopoiesis(GO:0060216) |
| 0.0 | 0.2 | GO:0046487 | glyoxylate metabolic process(GO:0046487) |
| 0.0 | 0.2 | GO:0043516 | regulation of DNA damage response, signal transduction by p53 class mediator(GO:0043516) |
| 0.0 | 0.5 | GO:0090503 | RNA phosphodiester bond hydrolysis, exonucleolytic(GO:0090503) |
| 0.0 | 0.3 | GO:0014896 | regulation of muscle hypertrophy(GO:0014743) muscle hypertrophy(GO:0014896) |
| 0.0 | 5.3 | GO:0008154 | actin polymerization or depolymerization(GO:0008154) |
| 0.0 | 0.4 | GO:0006490 | oligosaccharide-lipid intermediate biosynthetic process(GO:0006490) |
| 0.0 | 0.8 | GO:0018230 | peptidyl-L-cysteine S-palmitoylation(GO:0018230) peptidyl-S-diacylglycerol-L-cysteine biosynthetic process from peptidyl-cysteine(GO:0018231) |
| 0.0 | 2.0 | GO:0010506 | regulation of autophagy(GO:0010506) |
| 0.0 | 1.6 | GO:0061515 | myeloid cell development(GO:0061515) |
| 0.0 | 0.9 | GO:0010951 | negative regulation of endopeptidase activity(GO:0010951) |
| 0.0 | 1.4 | GO:0006487 | protein N-linked glycosylation(GO:0006487) |
| 0.0 | 0.4 | GO:0030032 | lamellipodium assembly(GO:0030032) lamellipodium organization(GO:0097581) |
| 0.0 | 0.3 | GO:0008277 | regulation of G-protein coupled receptor protein signaling pathway(GO:0008277) |
| 0.0 | 1.7 | GO:0001756 | somitogenesis(GO:0001756) |
| 0.0 | 1.1 | GO:0042274 | ribosomal small subunit biogenesis(GO:0042274) |
| 0.0 | 0.6 | GO:0030917 | midbrain-hindbrain boundary development(GO:0030917) |
| 0.0 | 0.7 | GO:0035725 | sodium ion transmembrane transport(GO:0035725) |
| 0.0 | 1.4 | GO:0003015 | heart process(GO:0003015) heart contraction(GO:0060047) |
| 0.0 | 0.3 | GO:0006919 | activation of cysteine-type endopeptidase activity involved in apoptotic process(GO:0006919) activation of cysteine-type endopeptidase activity(GO:0097202) |
Gene overrepresentation in cellular component category:
| Log-likelihood per target | Total log-likelihood | Term | Description |
|---|---|---|---|
| 0.5 | 2.3 | GO:0031462 | Cul2-RING ubiquitin ligase complex(GO:0031462) |
| 0.3 | 1.4 | GO:0032019 | mitochondrial cloud(GO:0032019) |
| 0.3 | 1.0 | GO:0098643 | fibrillar collagen trimer(GO:0005583) banded collagen fibril(GO:0098643) |
| 0.3 | 1.6 | GO:1990246 | uniplex complex(GO:1990246) |
| 0.2 | 0.6 | GO:0098594 | mucin granule(GO:0098594) |
| 0.2 | 11.0 | GO:0005834 | heterotrimeric G-protein complex(GO:0005834) |
| 0.2 | 16.1 | GO:0098852 | lysosomal membrane(GO:0005765) lytic vacuole membrane(GO:0098852) |
| 0.1 | 1.0 | GO:0000408 | EKC/KEOPS complex(GO:0000408) |
| 0.1 | 4.7 | GO:0030175 | filopodium(GO:0030175) |
| 0.1 | 1.3 | GO:0019773 | proteasome core complex, alpha-subunit complex(GO:0019773) |
| 0.1 | 10.3 | GO:0005764 | lysosome(GO:0005764) |
| 0.1 | 3.6 | GO:0022627 | cytosolic small ribosomal subunit(GO:0022627) |
| 0.1 | 0.3 | GO:0061702 | inflammasome complex(GO:0061702) |
| 0.1 | 10.1 | GO:0030424 | axon(GO:0030424) |
| 0.0 | 15.0 | GO:0000785 | chromatin(GO:0000785) |
| 0.0 | 1.8 | GO:0044420 | basement membrane(GO:0005604) extracellular matrix component(GO:0044420) |
| 0.0 | 0.9 | GO:0005637 | nuclear inner membrane(GO:0005637) |
| 0.0 | 1.8 | GO:0016592 | mediator complex(GO:0016592) |
| 0.0 | 0.2 | GO:0030121 | AP-1 adaptor complex(GO:0030121) |
| 0.0 | 0.5 | GO:0005736 | DNA-directed RNA polymerase I complex(GO:0005736) |
| 0.0 | 0.5 | GO:0000177 | cytoplasmic exosome (RNase complex)(GO:0000177) |
| 0.0 | 3.6 | GO:0016607 | nuclear speck(GO:0016607) |
| 0.0 | 0.2 | GO:0034364 | high-density lipoprotein particle(GO:0034364) |
| 0.0 | 1.6 | GO:0030134 | ER to Golgi transport vesicle(GO:0030134) |
| 0.0 | 0.2 | GO:0000974 | Prp19 complex(GO:0000974) |
| 0.0 | 2.2 | GO:0090575 | RNA polymerase II transcription factor complex(GO:0090575) |
| 0.0 | 0.1 | GO:0097225 | sperm midpiece(GO:0097225) |
| 0.0 | 0.7 | GO:0001725 | stress fiber(GO:0001725) contractile actin filament bundle(GO:0097517) |
| 0.0 | 0.5 | GO:0031225 | anchored component of membrane(GO:0031225) |
| 0.0 | 0.2 | GO:0030992 | intraciliary transport particle B(GO:0030992) |
| 0.0 | 1.3 | GO:0030176 | integral component of endoplasmic reticulum membrane(GO:0030176) |
Gene overrepresentation in molecular function category:
| Log-likelihood per target | Total log-likelihood | Term | Description |
|---|---|---|---|
| 2.1 | 10.3 | GO:0005105 | type 1 fibroblast growth factor receptor binding(GO:0005105) |
| 1.8 | 5.4 | GO:0004360 | glutamine-fructose-6-phosphate transaminase (isomerizing) activity(GO:0004360) L-glutamine aminotransferase activity(GO:0070548) |
| 1.1 | 10.0 | GO:0031826 | type 2A serotonin receptor binding(GO:0031826) |
| 0.9 | 4.7 | GO:0030296 | protein tyrosine kinase activator activity(GO:0030296) |
| 0.9 | 2.6 | GO:0035575 | histone demethylase activity (H4-K20 specific)(GO:0035575) |
| 0.8 | 3.1 | GO:0042169 | SH2 domain binding(GO:0042169) |
| 0.6 | 2.4 | GO:0022833 | mechanically-gated ion channel activity(GO:0008381) mechanically gated channel activity(GO:0022833) |
| 0.6 | 2.8 | GO:0004639 | phosphoribosylaminoimidazolesuccinocarboxamide synthase activity(GO:0004639) |
| 0.4 | 2.1 | GO:0017095 | heparan sulfate 6-O-sulfotransferase activity(GO:0017095) |
| 0.4 | 15.6 | GO:0031492 | nucleosomal DNA binding(GO:0031492) |
| 0.3 | 4.4 | GO:0061608 | nuclear import signal receptor activity(GO:0061608) |
| 0.3 | 1.1 | GO:0004731 | purine-nucleoside phosphorylase activity(GO:0004731) |
| 0.2 | 6.1 | GO:0008028 | monocarboxylic acid transmembrane transporter activity(GO:0008028) |
| 0.2 | 2.3 | GO:0004806 | triglyceride lipase activity(GO:0004806) |
| 0.2 | 2.3 | GO:0015299 | solute:proton antiporter activity(GO:0015299) |
| 0.1 | 1.6 | GO:0022842 | leak channel activity(GO:0022840) potassium ion leak channel activity(GO:0022841) narrow pore channel activity(GO:0022842) |
| 0.1 | 1.1 | GO:0050699 | WW domain binding(GO:0050699) |
| 0.1 | 2.3 | GO:0003951 | NAD+ kinase activity(GO:0003951) |
| 0.1 | 2.4 | GO:0005518 | collagen binding(GO:0005518) |
| 0.1 | 1.0 | GO:0051429 | mu-type opioid receptor binding(GO:0031852) corticotropin-releasing hormone receptor binding(GO:0051429) corticotropin-releasing hormone receptor 1 binding(GO:0051430) |
| 0.1 | 0.8 | GO:0004157 | dihydropyrimidinase activity(GO:0004157) |
| 0.1 | 4.2 | GO:0004712 | protein serine/threonine/tyrosine kinase activity(GO:0004712) |
| 0.1 | 1.5 | GO:0019894 | kinesin binding(GO:0019894) |
| 0.1 | 2.0 | GO:0046875 | ephrin receptor binding(GO:0046875) |
| 0.1 | 1.8 | GO:0015459 | potassium channel regulator activity(GO:0015459) |
| 0.1 | 0.3 | GO:0032090 | Pyrin domain binding(GO:0032090) |
| 0.1 | 2.2 | GO:0004683 | calmodulin-dependent protein kinase activity(GO:0004683) |
| 0.1 | 0.7 | GO:0015149 | glucose transmembrane transporter activity(GO:0005355) monosaccharide transmembrane transporter activity(GO:0015145) hexose transmembrane transporter activity(GO:0015149) |
| 0.1 | 1.2 | GO:0047617 | acyl-CoA hydrolase activity(GO:0047617) |
| 0.1 | 1.7 | GO:0008353 | RNA polymerase II carboxy-terminal domain kinase activity(GO:0008353) |
| 0.1 | 0.7 | GO:0015026 | coreceptor activity(GO:0015026) |
| 0.1 | 1.6 | GO:0099604 | ligand-gated calcium channel activity(GO:0099604) |
| 0.1 | 0.8 | GO:0005432 | calcium:sodium antiporter activity(GO:0005432) |
| 0.1 | 3.8 | GO:0008375 | acetylglucosaminyltransferase activity(GO:0008375) |
| 0.1 | 0.6 | GO:0005391 | sodium:potassium-exchanging ATPase activity(GO:0005391) |
| 0.1 | 7.8 | GO:0004930 | G-protein coupled receptor activity(GO:0004930) |
| 0.1 | 0.4 | GO:0004376 | glycolipid mannosyltransferase activity(GO:0004376) |
| 0.0 | 1.3 | GO:0102338 | fatty acid elongase activity(GO:0009922) 3-oxo-arachidoyl-CoA synthase activity(GO:0102336) 3-oxo-cerotoyl-CoA synthase activity(GO:0102337) 3-oxo-lignoceronyl-CoA synthase activity(GO:0102338) |
| 0.0 | 0.8 | GO:0016628 | oxidoreductase activity, acting on the CH-CH group of donors, NAD or NADP as acceptor(GO:0016628) |
| 0.0 | 0.1 | GO:0015272 | ATP-activated inward rectifier potassium channel activity(GO:0015272) |
| 0.0 | 0.7 | GO:0005388 | calcium-transporting ATPase activity(GO:0005388) |
| 0.0 | 2.1 | GO:0005200 | structural constituent of cytoskeleton(GO:0005200) |
| 0.0 | 4.1 | GO:0004725 | protein tyrosine phosphatase activity(GO:0004725) |
| 0.0 | 0.2 | GO:0016833 | oxo-acid-lyase activity(GO:0016833) |
| 0.0 | 5.7 | GO:0046982 | protein heterodimerization activity(GO:0046982) |
| 0.0 | 1.1 | GO:0005109 | frizzled binding(GO:0005109) |
| 0.0 | 0.1 | GO:0008191 | metalloendopeptidase inhibitor activity(GO:0008191) |
| 0.0 | 0.1 | GO:0042287 | MHC protein binding(GO:0042287) |
| 0.0 | 6.0 | GO:0005085 | guanyl-nucleotide exchange factor activity(GO:0005085) |
| 0.0 | 1.3 | GO:0004867 | serine-type endopeptidase inhibitor activity(GO:0004867) |
| 0.0 | 1.3 | GO:0019843 | rRNA binding(GO:0019843) |
| 0.0 | 0.2 | GO:0042800 | histone methyltransferase activity (H3-K4 specific)(GO:0042800) |
| 0.0 | 0.3 | GO:0008190 | eukaryotic initiation factor 4E binding(GO:0008190) |
| 0.0 | 0.1 | GO:0043495 | protein anchor(GO:0043495) |
| 0.0 | 0.6 | GO:0046915 | transition metal ion transmembrane transporter activity(GO:0046915) |
| 0.0 | 0.8 | GO:0019707 | protein-cysteine S-palmitoyltransferase activity(GO:0019706) protein-cysteine S-acyltransferase activity(GO:0019707) |
| 0.0 | 2.8 | GO:0019901 | protein kinase binding(GO:0019901) |
| 0.0 | 0.1 | GO:0005225 | volume-sensitive anion channel activity(GO:0005225) |
| 0.0 | 1.0 | GO:0005201 | extracellular matrix structural constituent(GO:0005201) |
| 0.0 | 2.5 | GO:0003735 | structural constituent of ribosome(GO:0003735) |
| 0.0 | 1.3 | GO:0042803 | protein homodimerization activity(GO:0042803) |
| 0.0 | 2.3 | GO:0003714 | transcription corepressor activity(GO:0003714) |
| 0.0 | 10.3 | GO:0008270 | zinc ion binding(GO:0008270) |
| 0.0 | 3.4 | GO:0000989 | transcription factor activity, transcription factor binding(GO:0000989) transcription cofactor activity(GO:0003712) |
| 0.0 | 3.1 | GO:0046983 | protein dimerization activity(GO:0046983) |
| 0.0 | 0.6 | GO:0005484 | SNAP receptor activity(GO:0005484) |
| 0.0 | 0.2 | GO:0031210 | phosphatidylcholine binding(GO:0031210) |
Gene overrepresentation in curated gene sets: canonical pathways category:
| Log-likelihood per target | Total log-likelihood | Term | Description |
|---|---|---|---|
| 0.1 | 1.7 | PID NFAT TFPATHWAY | Calcineurin-regulated NFAT-dependent transcription in lymphocytes |
| 0.1 | 3.1 | PID ATF2 PATHWAY | ATF-2 transcription factor network |
| 0.1 | 3.5 | PID P53 REGULATION PATHWAY | p53 pathway |
| 0.0 | 2.4 | NABA ECM GLYCOPROTEINS | Genes encoding structural ECM glycoproteins |
| 0.0 | 0.2 | PID IL5 PATHWAY | IL5-mediated signaling events |
| 0.0 | 1.1 | WNT SIGNALING | Genes related to Wnt-mediated signal transduction |
| 0.0 | 0.2 | PID SYNDECAN 4 PATHWAY | Syndecan-4-mediated signaling events |
| 0.0 | 0.1 | PID VEGFR1 PATHWAY | VEGFR1 specific signals |
Gene overrepresentation in curated gene sets: REACTOME pathways category:
| Log-likelihood per target | Total log-likelihood | Term | Description |
|---|---|---|---|
| 0.4 | 2.6 | REACTOME HDL MEDIATED LIPID TRANSPORT | Genes involved in HDL-mediated lipid transport |
| 0.3 | 3.1 | REACTOME ACTIVATION OF CHAPERONE GENES BY ATF6 ALPHA | Genes involved in Activation of Chaperone Genes by ATF6-alpha |
| 0.1 | 2.8 | REACTOME PURINE RIBONUCLEOSIDE MONOPHOSPHATE BIOSYNTHESIS | Genes involved in Purine ribonucleoside monophosphate biosynthesis |
| 0.1 | 2.1 | REACTOME POST CHAPERONIN TUBULIN FOLDING PATHWAY | Genes involved in Post-chaperonin tubulin folding pathway |
| 0.1 | 2.1 | REACTOME ION TRANSPORT BY P TYPE ATPASES | Genes involved in Ion transport by P-type ATPases |
| 0.1 | 2.3 | REACTOME HS GAG BIOSYNTHESIS | Genes involved in HS-GAG biosynthesis |
| 0.1 | 0.8 | REACTOME ACYL CHAIN REMODELLING OF PS | Genes involved in Acyl chain remodelling of PS |
| 0.1 | 0.8 | REACTOME CRMPS IN SEMA3A SIGNALING | Genes involved in CRMPs in Sema3A signaling |
| 0.1 | 4.4 | REACTOME ANTIVIRAL MECHANISM BY IFN STIMULATED GENES | Genes involved in Antiviral mechanism by IFN-stimulated genes |
| 0.1 | 0.9 | REACTOME INTERFERON GAMMA SIGNALING | Genes involved in Interferon gamma signaling |
| 0.1 | 1.0 | REACTOME SYNTHESIS OF SUBSTRATES IN N GLYCAN BIOSYTHESIS | Genes involved in Synthesis of substrates in N-glycan biosythesis |
| 0.1 | 1.1 | REACTOME MITOCHONDRIAL TRNA AMINOACYLATION | Genes involved in Mitochondrial tRNA aminoacylation |
| 0.1 | 2.4 | REACTOME RESPONSE TO ELEVATED PLATELET CYTOSOLIC CA2 | Genes involved in Response to elevated platelet cytosolic Ca2+ |
| 0.0 | 1.7 | REACTOME G1 PHASE | Genes involved in G1 Phase |
| 0.0 | 0.2 | REACTOME IL 7 SIGNALING | Genes involved in Interleukin-7 signaling |
| 0.0 | 1.4 | REACTOME CLASS B 2 SECRETIN FAMILY RECEPTORS | Genes involved in Class B/2 (Secretin family receptors) |
| 0.0 | 1.3 | REACTOME VIF MEDIATED DEGRADATION OF APOBEC3G | Genes involved in Vif-mediated degradation of APOBEC3G |
| 0.0 | 0.8 | REACTOME LYSOSOME VESICLE BIOGENESIS | Genes involved in Lysosome Vesicle Biogenesis |
| 0.0 | 0.1 | REACTOME INWARDLY RECTIFYING K CHANNELS | Genes involved in Inwardly rectifying K+ channels |
| 0.0 | 0.4 | REACTOME BIOSYNTHESIS OF THE N GLYCAN PRECURSOR DOLICHOL LIPID LINKED OLIGOSACCHARIDE LLO AND TRANSFER TO A NASCENT PROTEIN | Genes involved in Biosynthesis of the N-glycan precursor (dolichol lipid-linked oligosaccharide, LLO) and transfer to a nascent protein |
| 0.0 | 0.5 | REACTOME RNA POL I TRANSCRIPTION TERMINATION | Genes involved in RNA Polymerase I Transcription Termination |
| 0.0 | 1.7 | REACTOME MRNA SPLICING | Genes involved in mRNA Splicing |