Project
DANIO-CODE
Navigation
Downloads
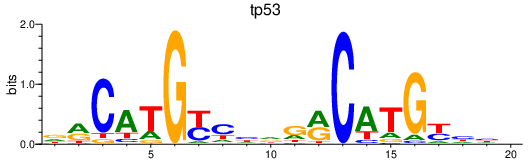
Results for tp53
Z-value: 1.61
Motif logo
Transcription factors associated with tp53
| Gene Symbol | Gene ID | Gene Info |
|---|---|---|
|
tp53
|
ENSDARG00000035559 | tumor protein p53 |
Activity-expression correlation:
| Gene | Promoter | Pearson corr. coef. | P-value | Plot |
|---|---|---|---|---|
| tp53 | dr10_dc_chr5_+_23585492_23585555 | 0.76 | 6.5e-04 | Click! |
Activity profile of tp53 motif
Sorted Z-values of tp53 motif
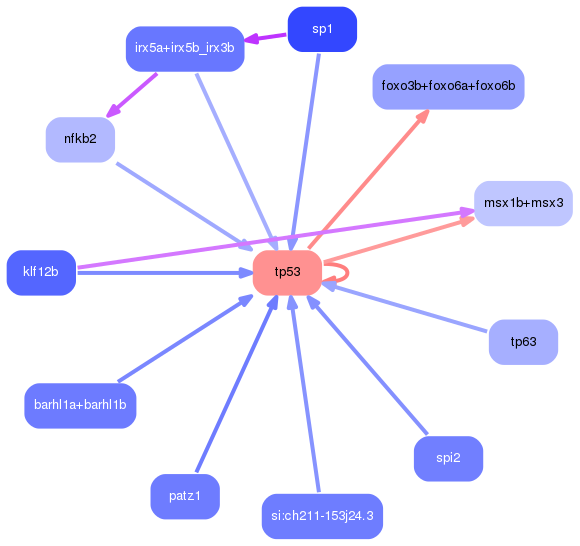
Network of associatons between targets according to the STRING database.

First level regulatory network of tp53
| Promoter | Score | Transcript | Gene | Gene Info |
|---|---|---|---|---|
| chr15_+_35184996 | 4.98 |
ENSDART00000086954
ENSDART00000161594 |
sesn3
|
sestrin 3 |
| chr3_+_22412059 | 4.90 |
|
|
|
| chr23_+_23305483 | 4.29 |
ENSDART00000126479
|
plekhn1
|
pleckstrin homology domain containing, family N member 1 |
| chr16_+_43468861 | 4.14 |
|
|
|
| chr25_-_7346766 | 4.13 |
ENSDART00000170050
|
cdkn1cb
|
cyclin-dependent kinase inhibitor 1Cb |
| chr1_-_40536800 | 3.78 |
ENSDART00000134739
|
rgs12b
|
regulator of G protein signaling 12b |
| chr25_+_35438530 | 3.64 |
ENSDART00000171369
|
hsd17b2
|
hydroxysteroid (17-beta) dehydrogenase 2 |
| chr4_+_23406078 | 3.49 |
ENSDART00000139543
|
mdm2
|
MDM2 oncogene, E3 ubiquitin protein ligase |
| chr21_+_25651712 | 3.44 |
ENSDART00000135123
|
si:dkey-17e16.17
|
si:dkey-17e16.17 |
| chr6_+_49096966 | 2.89 |
ENSDART00000141042
ENSDART00000143369 |
slc25a22
|
solute carrier family 25 (mitochondrial carrier: glutamate), member 22 |
| chr11_-_25962291 | 2.85 |
|
|
|
| chr15_-_29454583 | 2.84 |
ENSDART00000145976
|
serpinh1b
|
serpin peptidase inhibitor, clade H (heat shock protein 47), member 1b |
| chr22_+_37934447 | 2.71 |
ENSDART00000076082
|
fetub
|
fetuin B |
| chr10_+_8670564 | 2.52 |
ENSDART00000129643
|
aplnrb
|
apelin receptor b |
| chr15_+_4027133 | 2.42 |
|
|
|
| chr19_-_27878747 | 2.35 |
ENSDART00000137638
|
si:ch73-25f10.6
|
si:ch73-25f10.6 |
| chr15_-_23826312 | 2.17 |
ENSDART00000137918
|
bbc3
|
BCL2 binding component 3 |
| chr24_-_3334678 | 2.15 |
|
|
|
| chr23_+_22649686 | 2.05 |
ENSDART00000146709
|
CR388207.1
|
ENSDARG00000095377 |
| KN150108v1_-_8893 | 2.05 |
ENSDART00000167033
|
ENSDARG00000100513
|
ENSDARG00000100513 |
| chr5_+_23585492 | 2.02 |
ENSDART00000135083
|
tp53
|
tumor protein p53 |
| chr10_-_4979688 | 1.81 |
ENSDART00000093228
|
mat2al
|
methionine adenosyltransferase II, alpha-like |
| chr23_-_5825177 | 1.81 |
ENSDART00000055087
|
phlda3
|
pleckstrin homology-like domain, family A, member 3 |
| chr20_-_32429820 | 1.68 |
ENSDART00000062982
|
foxo3b
|
forkhead box O3b |
| chr18_+_45203251 | 1.67 |
ENSDART00000015786
|
gyltl1b
|
glycosyltransferase-like 1b |
| chr2_-_28244864 | 1.67 |
ENSDART00000137542
|
zgc:163121
|
zgc:163121 |
| chr19_+_25569817 | 1.64 |
ENSDART00000163220
|
si:ch211-239d6.2
|
si:ch211-239d6.2 |
| chr17_-_8111181 | 1.60 |
ENSDART00000149873
ENSDART00000148403 |
ahi1
|
Abelson helper integration site 1 |
| chr8_-_45043860 | 1.57 |
ENSDART00000138269
|
BX005065.1
|
ENSDARG00000092243 |
| chr16_-_25793780 | 1.57 |
|
|
|
| chr7_+_34482282 | 1.57 |
|
|
|
| chr16_+_21436660 | 1.54 |
ENSDART00000145886
|
osbpl3b
|
oxysterol binding protein-like 3b |
| chr10_+_38568464 | 1.49 |
ENSDART00000109752
|
serpinh1a
|
serpin peptidase inhibitor, clade H (heat shock protein 47), member 1a |
| chr15_+_666833 | 1.49 |
ENSDART00000157207
|
si:ch211-210b2.1
|
si:ch211-210b2.1 |
| chr17_+_21433543 | 1.48 |
ENSDART00000079030
|
pla2g4f.1
|
phospholipase A2, group IVF, tandem duplicate 1 |
| chr10_+_4987494 | 1.37 |
ENSDART00000121959
|
si:ch73-234b20.5
|
si:ch73-234b20.5 |
| chr3_-_49242655 | 1.37 |
ENSDART00000142200
ENSDART00000139524 |
arl16
|
ADP-ribosylation factor-like 16 |
| chr8_+_28584427 | 1.33 |
ENSDART00000097213
|
tcf15
|
transcription factor 15 |
| chr7_+_48532749 | 1.30 |
ENSDART00000145375
|
cpt1aa
|
carnitine palmitoyltransferase 1Aa (liver) |
| chr13_+_24531753 | 1.27 |
ENSDART00000014176
|
msx3
|
muscle segment homeobox 3 |
| chr14_+_35890811 | 1.26 |
ENSDART00000141766
|
elovl6
|
ELOVL fatty acid elongase 6 |
| chr23_-_5825236 | 1.22 |
ENSDART00000055087
|
phlda3
|
pleckstrin homology-like domain, family A, member 3 |
| chr19_-_27878556 | 1.20 |
ENSDART00000137638
|
si:ch73-25f10.6
|
si:ch73-25f10.6 |
| chr23_+_22649652 | 1.19 |
ENSDART00000146709
|
CR388207.1
|
ENSDARG00000095377 |
| chr25_-_35530474 | 1.18 |
|
|
|
| chr21_+_15339960 | 1.18 |
ENSDART00000137491
|
si:dkey-11o15.10
|
si:dkey-11o15.10 |
| chr11_+_6284324 | 1.16 |
ENSDART00000002459
|
ctns
|
cystinosin, lysosomal cystine transporter |
| chr7_+_25778546 | 1.14 |
ENSDART00000173611
|
si:dkey-6n21.12
|
si:dkey-6n21.12 |
| chr5_-_34940744 | 1.14 |
ENSDART00000145779
|
si:dkey-204l11.1
|
si:dkey-204l11.1 |
| chr22_-_11712371 | 1.12 |
|
|
|
| chr17_-_10682357 | 1.10 |
ENSDART00000064597
|
lgals3b
|
lectin, galactoside binding soluble 3b |
| chr14_+_4489377 | 1.03 |
ENSDART00000041468
|
ap1ar
|
adaptor-related protein complex 1 associated regulatory protein |
| chr23_-_31502149 | 1.00 |
ENSDART00000053545
|
zgc:153284
|
zgc:153284 |
| chr22_-_6772249 | 0.99 |
ENSDART00000108883
|
si:ch1073-188e1.1
|
si:ch1073-188e1.1 |
| chr20_+_22813503 | 0.98 |
|
|
|
| chr23_+_11412329 | 0.97 |
ENSDART00000135406
|
chl1a
|
cell adhesion molecule L1-like a |
| chr12_+_6065116 | 0.95 |
ENSDART00000139054
|
sgms1
|
sphingomyelin synthase 1 |
| chr16_+_40610589 | 0.90 |
ENSDART00000038294
|
tp53inp1
|
tumor protein p53 inducible nuclear protein 1 |
| chr12_+_29121368 | 0.89 |
ENSDART00000006505
|
mxtx2
|
mix-type homeobox gene 2 |
| chr13_+_28574593 | 0.89 |
ENSDART00000126845
|
ldb1a
|
LIM domain binding 1a |
| chr18_-_40462054 | 0.89 |
|
|
|
| chr5_+_27298136 | 0.89 |
ENSDART00000098604
|
adam28
|
ADAM metallopeptidase domain 28 |
| chr5_-_57016269 | 0.79 |
ENSDART00000074264
|
crfb12
|
cytokine receptor family member B12 |
| chr8_-_4638117 | 0.76 |
ENSDART00000019828
|
zgc:63587
|
zgc:63587 |
| chr3_+_39821041 | 0.75 |
|
|
|
| chr10_-_40905363 | 0.74 |
ENSDART00000076304
|
pcna
|
proliferating cell nuclear antigen |
| chr24_-_30924897 | 0.74 |
ENSDART00000168540
|
ptbp2a
|
polypyrimidine tract binding protein 2a |
| chr15_+_35185174 | 0.73 |
ENSDART00000086954
ENSDART00000161594 |
sesn3
|
sestrin 3 |
| chr6_-_55332828 | 0.73 |
|
|
|
| chr4_+_13932849 | 0.72 |
ENSDART00000141742
|
pphln1
|
periphilin 1 |
| chr19_+_48166365 | 0.71 |
|
|
|
| KN150663v1_+_55800 | 0.71 |
|
|
|
| chr8_-_31044429 | 0.71 |
ENSDART00000109885
|
snrnp200
|
small nuclear ribonucleoprotein 200 (U5) |
| chr4_-_23405867 | 0.69 |
|
|
|
| chr23_+_11350727 | 0.68 |
|
|
|
| chr11_+_44809527 | 0.67 |
ENSDART00000037819
ENSDART00000159886 |
tmc6b
|
transmembrane channel-like 6b |
| chr5_-_62592627 | 0.66 |
ENSDART00000131274
|
tbcelb
|
tubulin folding cofactor E-like b |
| chr25_-_28932291 | 0.66 |
ENSDART00000073488
|
CU469568.1
|
ENSDARG00000051805 |
| chr10_-_40904685 | 0.63 |
|
|
|
| chr10_+_29964821 | 0.62 |
ENSDART00000117710
|
SNORD14
|
Small nucleolar RNA SNORD14 |
| chr9_+_8951400 | 0.61 |
ENSDART00000102562
|
ankrd10b
|
ankyrin repeat domain 10b |
| chr8_+_15240122 | 0.60 |
ENSDART00000146965
|
dnttip2
|
deoxynucleotidyltransferase, terminal, interacting protein 2 |
| chr3_+_23567458 | 0.60 |
ENSDART00000078466
|
hoxb3a
|
homeobox B3a |
| chr22_-_6772204 | 0.59 |
ENSDART00000108883
|
si:ch1073-188e1.1
|
si:ch1073-188e1.1 |
| chr23_-_1008307 | 0.58 |
ENSDART00000110588
|
cdh26.1
|
cadherin 26, tandem duplicate 1 |
| chr14_+_36529003 | 0.58 |
ENSDART00000111674
|
F2RL3
|
F2R like thrombin or trypsin receptor 3 |
| chr6_+_30449742 | 0.58 |
|
|
|
| chr19_+_9231110 | 0.56 |
ENSDART00000127803
|
clk2a
|
CDC-like kinase 2a |
| chr16_+_34157866 | 0.56 |
ENSDART00000140552
|
tcea3
|
transcription elongation factor A (SII), 3 |
| chr22_-_13613870 | 0.55 |
|
|
|
| chr7_+_34482202 | 0.55 |
|
|
|
| chr10_+_29964521 | 0.54 |
ENSDART00000117710
|
SNORD14
|
Small nucleolar RNA SNORD14 |
| chr8_+_23617861 | 0.53 |
ENSDART00000083108
|
nt5dc2
|
5'-nucleotidase domain containing 2 |
| chr16_+_34157948 | 0.51 |
ENSDART00000140552
|
tcea3
|
transcription elongation factor A (SII), 3 |
| chr19_-_12274044 | 0.51 |
ENSDART00000041960
|
ywhaz
|
tyrosine 3-monooxygenase/tryptophan 5-monooxygenase activation protein, zeta polypeptide |
| chr7_+_48532096 | 0.50 |
|
|
|
| chr22_-_22234261 | 0.50 |
ENSDART00000113824
ENSDART00000169594 ENSDART00000158261 |
hdgfrp2
|
hepatoma-derived growth factor-related protein 2 |
| chr7_+_48532543 | 0.50 |
ENSDART00000145375
|
cpt1aa
|
carnitine palmitoyltransferase 1Aa (liver) |
| chr25_+_35437993 | 0.49 |
ENSDART00000066985
|
hsd17b2
|
hydroxysteroid (17-beta) dehydrogenase 2 |
| chr9_+_50413366 | 0.49 |
ENSDART00000162990
|
cobll1b
|
cordon-bleu WH2 repeat protein-like 1b |
| chr17_+_34854745 | 0.46 |
|
|
|
| chr12_-_5470187 | 0.45 |
ENSDART00000159784
|
abi3b
|
ABI family, member 3b |
| chr5_-_56885580 | 0.44 |
|
|
|
| chr13_-_25502297 | 0.44 |
ENSDART00000077627
ENSDART00000139237 |
ret
|
ret proto-oncogene receptor tyrosine kinase |
| chr13_-_8968218 | 0.44 |
ENSDART00000144142
ENSDART00000144714 |
HTRA2 (1 of many)
|
HtrA serine peptidase 2 |
| chr16_-_48458505 | 0.44 |
ENSDART00000159372
|
eif3ha
|
eukaryotic translation initiation factor 3, subunit H, a |
| chr7_-_25777968 | 0.44 |
ENSDART00000101124
|
rnaseka
|
ribonuclease, RNase K a |
| chr10_+_29964412 | 0.41 |
ENSDART00000117710
|
SNORD14
|
Small nucleolar RNA SNORD14 |
| chr3_-_45836485 | 0.40 |
|
|
|
| chr5_-_54151518 | 0.39 |
|
|
|
| chr11_+_16018035 | 0.38 |
ENSDART00000081054
|
tada3l
|
transcriptional adaptor 3 (NGG1 homolog, yeast)-like |
| chr16_-_31670211 | 0.38 |
ENSDART00000138216
|
CR855311.1
|
ENSDARG00000090352 |
| chr17_+_40924000 | 0.37 |
ENSDART00000046003
|
slc4a1ap
|
solute carrier family 4 (anion exchanger), member 1, adaptor protein |
| chr13_-_8968136 | 0.36 |
ENSDART00000144714
|
HTRA2 (1 of many)
|
HtrA serine peptidase 2 |
| chr11_+_42352106 | 0.35 |
ENSDART00000169938
|
il17rd
|
interleukin 17 receptor D |
| chr15_+_28370102 | 0.34 |
ENSDART00000175860
|
myo1cb
|
myosin Ic, paralog b |
| chr19_+_44185325 | 0.34 |
ENSDART00000063870
|
rpl11
|
ribosomal protein L11 |
| chr3_+_25933164 | 0.33 |
ENSDART00000143697
|
si:dkeyp-69e1.8
|
si:dkeyp-69e1.8 |
| chr19_-_11096542 | 0.33 |
|
|
|
| chr5_-_69031855 | 0.31 |
ENSDART00000028954
|
rilpl2
|
Rab interacting lysosomal protein-like 2 |
| chr5_-_28970034 | 0.29 |
ENSDART00000043259
|
entpd2a.2
|
ectonucleoside triphosphate diphosphohydrolase 2a, tandem duplicate 2 |
| chr12_-_25931242 | 0.29 |
ENSDART00000166769
|
bmpr1ab
|
bone morphogenetic protein receptor, type IAb |
| chr25_+_34543860 | 0.28 |
ENSDART00000050237
|
hist1h2ba
|
histone cluster 1, H2ba |
| chr23_+_20936419 | 0.28 |
ENSDART00000129992
|
pax7b
|
paired box 7b |
| chr11_+_10991763 | 0.24 |
ENSDART00000160488
|
itgb6
|
integrin, beta 6 |
| chr1_-_17898961 | 0.23 |
ENSDART00000082063
|
fam114a1
|
family with sequence similarity 114, member A1 |
| chr9_-_7419306 | 0.22 |
ENSDART00000125054
|
slc23a3
|
solute carrier family 23, member 3 |
| chr19_-_18671902 | 0.22 |
|
|
|
| chr19_+_44413865 | 0.20 |
ENSDART00000136147
ENSDART00000151004 |
nkd3
|
naked cuticle homolog 3 |
| chr15_+_17407258 | 0.20 |
ENSDART00000111753
|
vmp1
|
vacuole membrane protein 1 |
| chr25_-_35539585 | 0.19 |
ENSDART00000073432
|
rbl2
|
retinoblastoma-like 2 (p130) |
| chr23_-_1008468 | 0.19 |
ENSDART00000110588
|
cdh26.1
|
cadherin 26, tandem duplicate 1 |
| chr6_-_3354362 | 0.19 |
ENSDART00000082151
|
uqcrh
|
ubiquinol-cytochrome c reductase hinge protein |
| chr19_-_18672697 | 0.19 |
|
|
|
| chr23_+_4544178 | 0.18 |
ENSDART00000092389
|
nup210
|
nucleoporin 210 |
| chr25_+_34553195 | 0.18 |
ENSDART00000156838
|
zgc:112234
|
zgc:112234 |
| chr13_+_4096622 | 0.18 |
ENSDART00000058242
ENSDART00000143456 |
mea1
|
male-enhanced antigen 1 |
| chr23_+_23305376 | 0.18 |
ENSDART00000126479
|
plekhn1
|
pleckstrin homology domain containing, family N member 1 |
| chr23_-_31585883 | 0.17 |
ENSDART00000157511
|
eya4
|
EYA transcriptional coactivator and phosphatase 4 |
| chr24_-_16895179 | 0.16 |
ENSDART00000048823
|
c8g
|
complement component 8, gamma polypeptide |
| KN150583v1_-_1389 | 0.16 |
|
|
|
| chr22_-_111624 | 0.16 |
ENSDART00000163198
|
capzb
|
capping protein (actin filament) muscle Z-line, beta |
| chr3_+_13040717 | 0.16 |
|
|
|
| chr25_+_35540123 | 0.14 |
ENSDART00000126326
|
rpgrip1l
|
RPGRIP1-like |
| chr10_+_4987461 | 0.14 |
ENSDART00000121959
|
si:ch73-234b20.5
|
si:ch73-234b20.5 |
| chr8_+_26336302 | 0.14 |
|
|
|
| chr23_+_20936374 | 0.13 |
ENSDART00000129992
|
pax7b
|
paired box 7b |
| chr14_+_49921861 | 0.12 |
ENSDART00000173240
|
zgc:154054
|
zgc:154054 |
| chr10_-_40905193 | 0.12 |
ENSDART00000172089
|
pcna
|
proliferating cell nuclear antigen |
| chr5_+_23585615 | 0.11 |
ENSDART00000135083
|
tp53
|
tumor protein p53 |
| chr16_+_38251717 | 0.11 |
ENSDART00000044971
|
myo1eb
|
myosin IE, b |
| chr21_-_5692160 | 0.11 |
ENSDART00000075137
ENSDART00000151202 |
ccni
|
cyclin I |
| chr2_-_10571195 | 0.11 |
|
|
|
| chr16_-_19154824 | 0.11 |
ENSDART00000088818
|
fhod3b
|
formin homology 2 domain containing 3b |
| chr23_+_20522512 | 0.10 |
ENSDART00000137294
|
slc35c2
|
solute carrier family 35 (GDP-fucose transporter), member C2 |
| chr3_-_45669791 | 0.10 |
ENSDART00000169364
|
gcgra
|
glucagon receptor a |
| chr25_-_34642724 | 0.10 |
ENSDART00000121963
|
hist1h4l
|
histone 1, H4, like |
| chr8_-_47158799 | 0.10 |
|
|
|
| chr20_-_23272102 | 0.08 |
ENSDART00000167197
|
spata18
|
spermatogenesis associated 18 |
| chr10_+_4979788 | 0.08 |
|
|
|
| chr16_+_11295005 | 0.07 |
|
|
|
| chr16_-_19154920 | 0.06 |
ENSDART00000088818
|
fhod3b
|
formin homology 2 domain containing 3b |
| chr2_-_24806569 | 0.06 |
ENSDART00000033922
|
kcnn1a
|
potassium intermediate/small conductance calcium-activated channel, subfamily N, member 1a |
| chr4_-_885413 | 0.06 |
ENSDART00000022668
|
aim1b
|
crystallin beta-gamma domain containing 1b |
| chr2_+_37854726 | 0.04 |
ENSDART00000113337
|
parp2
|
poly (ADP-ribose) polymerase 2 |
| chr19_+_7916050 | 0.04 |
ENSDART00000026276
|
cks1b
|
CDC28 protein kinase regulatory subunit 1B |
| chr3_-_49082769 | 0.04 |
ENSDART00000131913
|
hgs
|
hepatocyte growth factor-regulated tyrosine kinase substrate |
| chr6_-_42051775 | 0.04 |
ENSDART00000022949
|
parp3
|
poly (ADP-ribose) polymerase family, member 3 |
| chr3_+_16080070 | 0.03 |
ENSDART00000137396
|
rpl19
|
ribosomal protein L19 |
| chr21_-_13875945 | 0.03 |
ENSDART00000143874
|
akna
|
AT-hook transcription factor |
| chr20_+_52740555 | 0.03 |
ENSDART00000110777
|
eef1db
|
eukaryotic translation elongation factor 1 delta b (guanine nucleotide exchange protein) |
| chr16_+_38251653 | 0.03 |
ENSDART00000044971
|
myo1eb
|
myosin IE, b |
| chr23_+_20936600 | 0.03 |
ENSDART00000129992
|
pax7b
|
paired box 7b |
| chr15_-_18130992 | 0.02 |
ENSDART00000113142
|
phldb1b
|
pleckstrin homology-like domain, family B, member 1b |
| chr20_-_25732204 | 0.01 |
ENSDART00000048164
|
paics
|
phosphoribosylaminoimidazole carboxylase, phosphoribosylaminoimidazole succinocarboxamide synthetase |
Gene Ontology Analysis
Gene overrepresentation in biological process category:
| Log-likelihood per target | Total log-likelihood | Term | Description |
|---|---|---|---|
| 1.2 | 3.5 | GO:1904019 | epithelial cell apoptotic process(GO:1904019) regulation of epithelial cell apoptotic process(GO:1904035) |
| 1.1 | 4.5 | GO:0061158 | 3'-UTR-mediated mRNA destabilization(GO:0061158) |
| 0.7 | 5.7 | GO:0071233 | response to leucine(GO:0043201) cellular response to leucine(GO:0071233) regulation of response to reactive oxygen species(GO:1901031) |
| 0.5 | 4.1 | GO:1904030 | negative regulation of cyclin-dependent protein serine/threonine kinase activity(GO:0045736) negative regulation of cyclin-dependent protein kinase activity(GO:1904030) |
| 0.5 | 2.5 | GO:0010524 | inhibitory G-protein coupled receptor phosphorylation(GO:0002030) positive regulation of calcium ion transport into cytosol(GO:0010524) positive regulation of release of sequestered calcium ion into cytosol(GO:0051281) regulation of inhibitory G-protein coupled receptor phosphorylation(GO:1904323) positive regulation of inhibitory G-protein coupled receptor phosphorylation(GO:1904325) |
| 0.5 | 1.5 | GO:0070254 | mucus secretion(GO:0070254) |
| 0.4 | 2.2 | GO:0090199 | regulation of release of cytochrome c from mitochondria(GO:0090199) positive regulation of release of cytochrome c from mitochondria(GO:0090200) |
| 0.4 | 1.7 | GO:0050687 | negative regulation of response to biotic stimulus(GO:0002832) negative regulation of defense response to virus(GO:0050687) |
| 0.4 | 1.1 | GO:0090280 | eosinophil chemotaxis(GO:0048245) eosinophil migration(GO:0072677) positive regulation of calcium ion import(GO:0090280) |
| 0.4 | 2.1 | GO:0043525 | regulation of transposition, RNA-mediated(GO:0010525) negative regulation of transposition, RNA-mediated(GO:0010526) transposition, RNA-mediated(GO:0032197) positive regulation of neuron apoptotic process(GO:0043525) positive regulation of neuron death(GO:1901216) |
| 0.3 | 3.0 | GO:0051898 | negative regulation of protein kinase B signaling(GO:0051898) |
| 0.3 | 1.8 | GO:0031998 | regulation of fatty acid beta-oxidation(GO:0031998) |
| 0.3 | 1.0 | GO:0035332 | positive regulation of hippo signaling(GO:0035332) |
| 0.2 | 0.7 | GO:0097355 | protein localization to heterochromatin(GO:0097355) |
| 0.2 | 0.7 | GO:0000388 | spliceosome conformational change to release U4 (or U4atac) and U1 (or U11)(GO:0000388) |
| 0.2 | 1.5 | GO:0044458 | motile cilium assembly(GO:0044458) |
| 0.2 | 4.3 | GO:0030199 | collagen fibril organization(GO:0030199) |
| 0.2 | 1.2 | GO:0072337 | renal absorption(GO:0070293) modified amino acid transport(GO:0072337) |
| 0.2 | 1.0 | GO:1900024 | regulation of substrate adhesion-dependent cell spreading(GO:1900024) |
| 0.2 | 1.8 | GO:0006556 | S-adenosylmethionine biosynthetic process(GO:0006556) |
| 0.1 | 1.0 | GO:0006686 | sphingomyelin biosynthetic process(GO:0006686) |
| 0.1 | 1.3 | GO:0042759 | long-chain fatty acid biosynthetic process(GO:0042759) |
| 0.1 | 0.4 | GO:0050938 | regulation of xanthophore differentiation(GO:0050938) |
| 0.1 | 0.9 | GO:0006272 | leading strand elongation(GO:0006272) |
| 0.1 | 0.3 | GO:0060911 | cardiac cell fate commitment(GO:0060911) |
| 0.1 | 0.7 | GO:0007023 | post-chaperonin tubulin folding pathway(GO:0007023) |
| 0.1 | 1.5 | GO:0046475 | glycerophospholipid catabolic process(GO:0046475) |
| 0.1 | 0.4 | GO:0014707 | branchiomeric skeletal muscle development(GO:0014707) |
| 0.1 | 2.7 | GO:0010951 | negative regulation of endopeptidase activity(GO:0010951) |
| 0.0 | 0.3 | GO:0033986 | response to methanol(GO:0033986) cellular response to methanol(GO:0071405) |
| 0.0 | 1.3 | GO:0043049 | otic placode formation(GO:0043049) |
| 0.0 | 0.2 | GO:2001239 | histone dephosphorylation(GO:0016576) negative regulation of signal transduction in absence of ligand(GO:1901099) regulation of extrinsic apoptotic signaling pathway in absence of ligand(GO:2001239) negative regulation of extrinsic apoptotic signaling pathway in absence of ligand(GO:2001240) |
| 0.0 | 0.5 | GO:0099515 | vesicle transport along actin filament(GO:0030050) actin filament-based transport(GO:0099515) |
| 0.0 | 0.3 | GO:0003382 | epithelial cell morphogenesis(GO:0003382) |
| 0.0 | 0.4 | GO:0000188 | inactivation of MAPK activity(GO:0000188) |
| 0.0 | 0.8 | GO:0007599 | blood coagulation(GO:0007596) hemostasis(GO:0007599) |
| 0.0 | 0.9 | GO:0001706 | endoderm formation(GO:0001706) |
| 0.0 | 0.3 | GO:0042541 | hemoglobin biosynthetic process(GO:0042541) |
| 0.0 | 0.4 | GO:0001732 | formation of cytoplasmic translation initiation complex(GO:0001732) |
| 0.0 | 1.1 | GO:0007229 | integrin-mediated signaling pathway(GO:0007229) |
| 0.0 | 0.2 | GO:0006122 | mitochondrial electron transport, ubiquinol to cytochrome c(GO:0006122) |
| 0.0 | 0.4 | GO:0043967 | histone H4 acetylation(GO:0043967) |
| 0.0 | 0.1 | GO:0070212 | protein poly-ADP-ribosylation(GO:0070212) |
| 0.0 | 0.1 | GO:0046548 | retinal rod cell development(GO:0046548) |
| 0.0 | 0.2 | GO:2000134 | negative regulation of cell cycle G1/S phase transition(GO:1902807) negative regulation of G1/S transition of mitotic cell cycle(GO:2000134) |
| 0.0 | 0.9 | GO:1905037 | autophagosome assembly(GO:0000045) autophagosome organization(GO:1905037) |
Gene overrepresentation in cellular component category:
| Log-likelihood per target | Total log-likelihood | Term | Description |
|---|---|---|---|
| 0.7 | 5.7 | GO:0061700 | GATOR2 complex(GO:0061700) |
| 0.5 | 1.5 | GO:0098594 | mucin granule(GO:0098594) |
| 0.2 | 1.1 | GO:0001772 | immunological synapse(GO:0001772) |
| 0.1 | 1.2 | GO:0097038 | perinuclear endoplasmic reticulum(GO:0097038) |
| 0.1 | 0.8 | GO:0060170 | ciliary membrane(GO:0060170) |
| 0.0 | 0.1 | GO:0032391 | photoreceptor connecting cilium(GO:0032391) |
| 0.0 | 0.4 | GO:0005671 | Ada2/Gcn5/Ada3 transcription activator complex(GO:0005671) |
| 0.0 | 0.4 | GO:0042788 | polysomal ribosome(GO:0042788) |
| 0.0 | 0.8 | GO:0016342 | catenin complex(GO:0016342) |
| 0.0 | 0.5 | GO:0005902 | microvillus(GO:0005902) |
| 0.0 | 3.2 | GO:0030425 | dendrite(GO:0030425) |
| 0.0 | 0.2 | GO:0005750 | mitochondrial respiratory chain complex III(GO:0005750) respiratory chain complex III(GO:0045275) |
| 0.0 | 0.9 | GO:0005776 | autophagosome(GO:0005776) |
| 0.0 | 1.9 | GO:0005741 | mitochondrial outer membrane(GO:0005741) |
| 0.0 | 2.2 | GO:0030176 | integral component of endoplasmic reticulum membrane(GO:0030176) |
| 0.0 | 4.5 | GO:0031966 | mitochondrial membrane(GO:0031966) |
| 0.0 | 1.2 | GO:0005765 | lysosomal membrane(GO:0005765) lytic vacuole membrane(GO:0098852) |
| 0.0 | 6.6 | GO:0005615 | extracellular space(GO:0005615) |
| 0.0 | 0.0 | GO:0005853 | eukaryotic translation elongation factor 1 complex(GO:0005853) |
Gene overrepresentation in molecular function category:
| Log-likelihood per target | Total log-likelihood | Term | Description |
|---|---|---|---|
| 1.0 | 4.1 | GO:0047035 | testosterone dehydrogenase (NAD+) activity(GO:0047035) |
| 1.0 | 3.0 | GO:0005547 | phosphatidylinositol-3,4,5-trisphosphate binding(GO:0005547) |
| 0.7 | 4.5 | GO:1901612 | cardiolipin binding(GO:1901612) |
| 0.7 | 5.7 | GO:0070728 | leucine binding(GO:0070728) |
| 0.5 | 1.5 | GO:0047498 | calcium-dependent phospholipase A2 activity(GO:0047498) |
| 0.4 | 2.5 | GO:0060182 | apelin receptor activity(GO:0060182) |
| 0.4 | 1.2 | GO:0000099 | sulfur amino acid transmembrane transporter activity(GO:0000099) |
| 0.4 | 4.1 | GO:0004861 | cyclin-dependent protein serine/threonine kinase inhibitor activity(GO:0004861) |
| 0.4 | 1.1 | GO:0019865 | IgE binding(GO:0019863) immunoglobulin binding(GO:0019865) |
| 0.3 | 1.8 | GO:0004478 | methionine adenosyltransferase activity(GO:0004478) |
| 0.3 | 0.9 | GO:0030337 | DNA polymerase processivity factor activity(GO:0030337) |
| 0.3 | 1.8 | GO:0004095 | carnitine O-palmitoyltransferase activity(GO:0004095) O-palmitoyltransferase activity(GO:0016416) |
| 0.2 | 0.9 | GO:0030274 | LIM domain binding(GO:0030274) |
| 0.2 | 4.3 | GO:0005518 | collagen binding(GO:0005518) |
| 0.2 | 0.7 | GO:0022833 | mechanically-gated ion channel activity(GO:0008381) mechanically gated channel activity(GO:0022833) |
| 0.2 | 1.0 | GO:0047493 | sphingomyelin synthase activity(GO:0033188) ceramide cholinephosphotransferase activity(GO:0047493) |
| 0.1 | 0.4 | GO:0030368 | interleukin-17 receptor activity(GO:0030368) |
| 0.1 | 2.1 | GO:1990841 | promoter-specific chromatin binding(GO:1990841) |
| 0.1 | 2.7 | GO:0004869 | cysteine-type endopeptidase inhibitor activity(GO:0004869) |
| 0.1 | 0.5 | GO:0008253 | 5'-nucleotidase activity(GO:0008253) |
| 0.1 | 0.2 | GO:0016681 | ubiquinol-cytochrome-c reductase activity(GO:0008121) oxidoreductase activity, acting on diphenols and related substances as donors, cytochrome as acceptor(GO:0016681) |
| 0.1 | 1.2 | GO:0015248 | sterol transporter activity(GO:0015248) |
| 0.1 | 0.7 | GO:0043014 | alpha-tubulin binding(GO:0043014) |
| 0.1 | 0.8 | GO:0019894 | kinesin binding(GO:0019894) |
| 0.0 | 0.2 | GO:0001102 | RNA polymerase II activating transcription factor binding(GO:0001102) |
| 0.0 | 1.3 | GO:0009922 | fatty acid elongase activity(GO:0009922) 3-oxo-arachidoyl-CoA synthase activity(GO:0102336) 3-oxo-cerotoyl-CoA synthase activity(GO:0102337) 3-oxo-lignoceronyl-CoA synthase activity(GO:0102338) |
| 0.0 | 0.5 | GO:0003785 | actin monomer binding(GO:0003785) |
| 0.0 | 1.0 | GO:0015035 | protein disulfide oxidoreductase activity(GO:0015035) |
| 0.0 | 1.5 | GO:0005484 | SNAP receptor activity(GO:0005484) |
| 0.0 | 0.3 | GO:0045134 | guanosine-diphosphatase activity(GO:0004382) uridine-diphosphatase activity(GO:0045134) |
| 0.0 | 3.2 | GO:0001228 | transcriptional activator activity, RNA polymerase II transcription regulatory region sequence-specific binding(GO:0001228) |
| 0.0 | 0.5 | GO:0030898 | actin-dependent ATPase activity(GO:0030898) |
| 0.0 | 0.4 | GO:0070122 | isopeptidase activity(GO:0070122) |
| 0.0 | 0.3 | GO:0005025 | transforming growth factor beta receptor activity, type I(GO:0005025) |
| 0.0 | 0.8 | GO:0004896 | cytokine receptor activity(GO:0004896) |
| 0.0 | 0.1 | GO:0016286 | small conductance calcium-activated potassium channel activity(GO:0016286) |
| 0.0 | 0.1 | GO:1990404 | protein ADP-ribosylase activity(GO:1990404) |
| 0.0 | 0.8 | GO:0045296 | cadherin binding(GO:0045296) |
| 0.0 | 3.3 | GO:0005096 | GTPase activator activity(GO:0005096) |
| 0.0 | 0.1 | GO:0017046 | peptide hormone binding(GO:0017046) |
Gene overrepresentation in curated gene sets: canonical pathways category:
| Log-likelihood per target | Total log-likelihood | Term | Description |
|---|---|---|---|
| 0.3 | 3.5 | PID RANBP2 PATHWAY | Sumoylation by RanBP2 regulates transcriptional repression |
| 0.1 | 2.1 | SA G1 AND S PHASES | Cdk2, 4, and 6 bind cyclin D in G1, while cdk2/cyclin E promotes the G1/S transition. |
| 0.1 | 2.3 | PID TAP63 PATHWAY | Validated transcriptional targets of TAp63 isoforms |
| 0.1 | 0.6 | PID THROMBIN PAR4 PATHWAY | PAR4-mediated thrombin signaling events |
| 0.1 | 1.4 | PID INTEGRIN A4B1 PATHWAY | Alpha4 beta1 integrin signaling events |
| 0.0 | 0.2 | PID INTEGRIN5 PATHWAY | Beta5 beta6 beta7 and beta8 integrin cell surface interactions |
| 0.0 | 1.0 | PID IL2 PI3K PATHWAY | IL2 signaling events mediated by PI3K |
| 0.0 | 0.4 | PID RET PATHWAY | Signaling events regulated by Ret tyrosine kinase |
| 0.0 | 0.9 | PID BARD1 PATHWAY | BARD1 signaling events |
| 0.0 | 0.2 | SA PTEN PATHWAY | PTEN is a tumor suppressor that dephosphorylates the lipid messenger phosphatidylinositol triphosphate. |
| 0.0 | 0.3 | PID FOXM1 PATHWAY | FOXM1 transcription factor network |
Gene overrepresentation in curated gene sets: REACTOME pathways category:
| Log-likelihood per target | Total log-likelihood | Term | Description |
|---|---|---|---|
| 0.5 | 4.3 | REACTOME ACTIVATION OF BH3 ONLY PROTEINS | Genes involved in Activation of BH3-only proteins |
| 0.3 | 3.5 | REACTOME AKT PHOSPHORYLATES TARGETS IN THE CYTOSOL | Genes involved in AKT phosphorylates targets in the cytosol |
| 0.2 | 1.3 | REACTOME SYNTHESIS OF VERY LONG CHAIN FATTY ACYL COAS | Genes involved in Synthesis of very long-chain fatty acyl-CoAs |
| 0.1 | 0.9 | REACTOME REMOVAL OF THE FLAP INTERMEDIATE FROM THE C STRAND | Genes involved in Removal of the Flap Intermediate from the C-strand |
| 0.1 | 0.5 | REACTOME RAP1 SIGNALLING | Genes involved in Rap1 signalling |
| 0.0 | 0.6 | REACTOME PEPTIDE LIGAND BINDING RECEPTORS | Genes involved in Peptide ligand-binding receptors |
| 0.0 | 0.6 | REACTOME SPHINGOLIPID DE NOVO BIOSYNTHESIS | Genes involved in Sphingolipid de novo biosynthesis |
| 0.0 | 0.7 | REACTOME MRNA SPLICING MINOR PATHWAY | Genes involved in mRNA Splicing - Minor Pathway |
| 0.0 | 0.2 | REACTOME COMPLEMENT CASCADE | Genes involved in Complement cascade |