Project
DANIO-CODE
Navigation
Downloads
Results for zbtb49
Z-value: 0.60
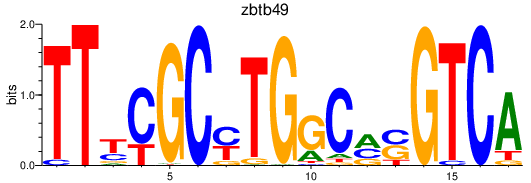
Motif logo
Transcription factors associated with zbtb49
| Gene Symbol | Gene ID | Gene Info |
|---|---|---|
|
zbtb49
|
ENSDARG00000102111 | zinc finger and BTB domain containing 49 |
Activity-expression correlation:
| Gene | Promoter | Pearson corr. coef. | P-value | Plot |
|---|---|---|---|---|
| zbtb49 | dr10_dc_chr14_+_223907_223945 | -0.27 | 3.0e-01 | Click! |
Activity profile of zbtb49 motif
Sorted Z-values of zbtb49 motif
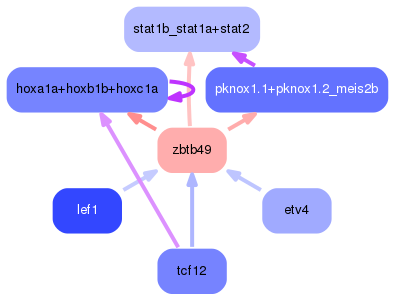
Network of associatons between targets according to the STRING database.

First level regulatory network of zbtb49
| Promoter | Score | Transcript | Gene | Gene Info |
|---|---|---|---|---|
| chr19_+_48582114 | 2.03 |
ENSDART00000157424
|
CU693379.1
|
ENSDARG00000098777 |
| chr11_+_8558222 | 1.95 |
ENSDART00000169141
ENSDART00000126523 |
tbl1xr1a
|
transducin (beta)-like 1 X-linked receptor 1a |
| chr7_+_22552724 | 1.75 |
ENSDART00000101459
ENSDART00000159743 |
pygmb
|
phosphorylase, glycogen, muscle b |
| chr18_-_44135616 | 1.66 |
ENSDART00000087339
|
cdon
|
cell adhesion associated, oncogene regulated |
| chr25_+_22224346 | 1.53 |
ENSDART00000073566
|
cyp11a1
|
cytochrome P450, family 11, subfamily A, polypeptide 1 |
| chr1_-_37990863 | 1.51 |
ENSDART00000132402
|
gpm6ab
|
glycoprotein M6Ab |
| chr9_+_49054601 | 1.36 |
ENSDART00000047401
|
abcb11a
|
ATP-binding cassette, sub-family B (MDR/TAP), member 11a |
| chr12_+_27050043 | 0.96 |
ENSDART00000136415
|
hoxb1b
|
homeobox B1b |
| chr8_-_38444845 | 0.83 |
ENSDART00000075989
|
inpp5l
|
inositol polyphosphate-5-phosphatase L |
| chr18_+_23375187 | 0.78 |
ENSDART00000001102
|
mctp2a
|
multiple C2 domains, transmembrane 2a |
| chr9_+_14180954 | 0.64 |
ENSDART00000148055
|
si:ch211-67e16.11
|
si:ch211-67e16.11 |
| chr14_+_9275853 | 0.63 |
ENSDART00000114563
|
tmem129
|
transmembrane protein 129, E3 ubiquitin protein ligase |
| chr14_+_33542705 | 0.56 |
ENSDART00000019396
|
clic2
|
chloride intracellular channel 2 |
| chr1_-_37990935 | 0.53 |
ENSDART00000132402
|
gpm6ab
|
glycoprotein M6Ab |
| chr17_+_8768744 | 0.51 |
|
|
|
| chr20_-_10133201 | 0.50 |
ENSDART00000144970
|
meis2b
|
Meis homeobox 2b |
| chr8_+_25283025 | 0.33 |
ENSDART00000046182
ENSDART00000145316 |
gstm.3
|
glutathione S-transferase mu tandem duplicate 3 |
| chr24_-_3388052 | 0.23 |
ENSDART00000066839
|
slc35g2b
|
solute carrier family 35, member G2b |
| chr11_+_18897913 | 0.23 |
ENSDART00000164294
|
magi1b
|
membrane associated guanylate kinase, WW and PDZ domain containing 1b |
| chr1_-_37991246 | 0.19 |
ENSDART00000128794
|
gpm6ab
|
glycoprotein M6Ab |
| chr11_+_18897769 | 0.19 |
ENSDART00000163006
|
magi1b
|
membrane associated guanylate kinase, WW and PDZ domain containing 1b |
| chr22_+_12773735 | 0.14 |
ENSDART00000005720
|
stat1a
|
signal transducer and activator of transcription 1a |
| chr18_-_44135817 | 0.10 |
ENSDART00000087339
|
cdon
|
cell adhesion associated, oncogene regulated |
| chr17_+_25571711 | 0.10 |
ENSDART00000064803
|
iars2
|
isoleucyl-tRNA synthetase 2, mitochondrial |
| chr5_-_66982187 | 0.10 |
|
|
|
| chr8_+_36550246 | 0.08 |
ENSDART00000049230
|
pqbp1
|
polyglutamine binding protein 1 |
| chr5_+_60457842 | 0.07 |
|
|
Gene Ontology Analysis
Gene overrepresentation in biological process category:
| Log-likelihood per target | Total log-likelihood | Term | Description |
|---|---|---|---|
| 0.5 | 1.5 | GO:0006700 | C21-steroid hormone biosynthetic process(GO:0006700) |
| 0.2 | 1.4 | GO:0015721 | bile acid and bile salt transport(GO:0015721) |
| 0.1 | 1.8 | GO:0009251 | polysaccharide catabolic process(GO:0000272) glycogen catabolic process(GO:0005980) glucan catabolic process(GO:0009251) cellular polysaccharide catabolic process(GO:0044247) |
| 0.1 | 2.2 | GO:0051489 | regulation of filopodium assembly(GO:0051489) |
| 0.1 | 1.0 | GO:0021661 | rhombomere 4 development(GO:0021570) rhombomere 4 morphogenesis(GO:0021661) |
| 0.1 | 1.2 | GO:0045663 | positive regulation of myoblast differentiation(GO:0045663) |
| 0.1 | 0.8 | GO:0048016 | inositol phosphate-mediated signaling(GO:0048016) |
| 0.0 | 0.5 | GO:0003209 | cardiac atrium morphogenesis(GO:0003209) |
| 0.0 | 2.0 | GO:0016575 | histone deacetylation(GO:0016575) |
| 0.0 | 0.8 | GO:0046928 | regulation of neurotransmitter secretion(GO:0046928) |
| 0.0 | 0.1 | GO:0071357 | response to type I interferon(GO:0034340) type I interferon signaling pathway(GO:0060337) cellular response to type I interferon(GO:0071357) |
| 0.0 | 0.6 | GO:0006986 | response to unfolded protein(GO:0006986) |
| 0.0 | 0.3 | GO:0006749 | glutathione metabolic process(GO:0006749) |
Gene overrepresentation in cellular component category:
| Log-likelihood per target | Total log-likelihood | Term | Description |
|---|---|---|---|
| 0.3 | 2.2 | GO:0044295 | axonal growth cone(GO:0044295) |
| 0.0 | 2.0 | GO:0000118 | histone deacetylase complex(GO:0000118) |
| 0.0 | 0.6 | GO:0034707 | chloride channel complex(GO:0034707) |
| 0.0 | 0.8 | GO:0030672 | synaptic vesicle membrane(GO:0030672) exocytic vesicle membrane(GO:0099501) |
Gene overrepresentation in molecular function category:
| Log-likelihood per target | Total log-likelihood | Term | Description |
|---|---|---|---|
| 0.5 | 1.5 | GO:0016713 | cholesterol monooxygenase (side-chain-cleaving) activity(GO:0008386) oxidoreductase activity, acting on paired donors, with incorporation or reduction of molecular oxygen, reduced iron-sulfur protein as one donor, and incorporation of one atom of oxygen(GO:0016713) |
| 0.4 | 1.8 | GO:0004645 | phosphorylase activity(GO:0004645) glycogen phosphorylase activity(GO:0008184) |
| 0.3 | 1.4 | GO:0015125 | bile acid transmembrane transporter activity(GO:0015125) |
| 0.1 | 0.8 | GO:0052659 | inositol-1,3,4,5-tetrakisphosphate 5-phosphatase activity(GO:0052659) |
| 0.0 | 0.3 | GO:0004364 | glutathione transferase activity(GO:0004364) |
| 0.0 | 2.0 | GO:0003714 | transcription corepressor activity(GO:0003714) |
| 0.0 | 0.6 | GO:0005254 | chloride channel activity(GO:0005254) |
| 0.0 | 0.1 | GO:0002161 | aminoacyl-tRNA editing activity(GO:0002161) |
Gene overrepresentation in curated gene sets: canonical pathways category:
| Log-likelihood per target | Total log-likelihood | Term | Description |
|---|---|---|---|
| 0.1 | 1.2 | PID HEDGEHOG 2PATHWAY | Signaling events mediated by the Hedgehog family |
Gene overrepresentation in curated gene sets: REACTOME pathways category:
| Log-likelihood per target | Total log-likelihood | Term | Description |
|---|---|---|---|
| 0.1 | 1.5 | REACTOME ENDOGENOUS STEROLS | Genes involved in Endogenous sterols |
| 0.0 | 1.2 | REACTOME MYOGENESIS | Genes involved in Myogenesis |