
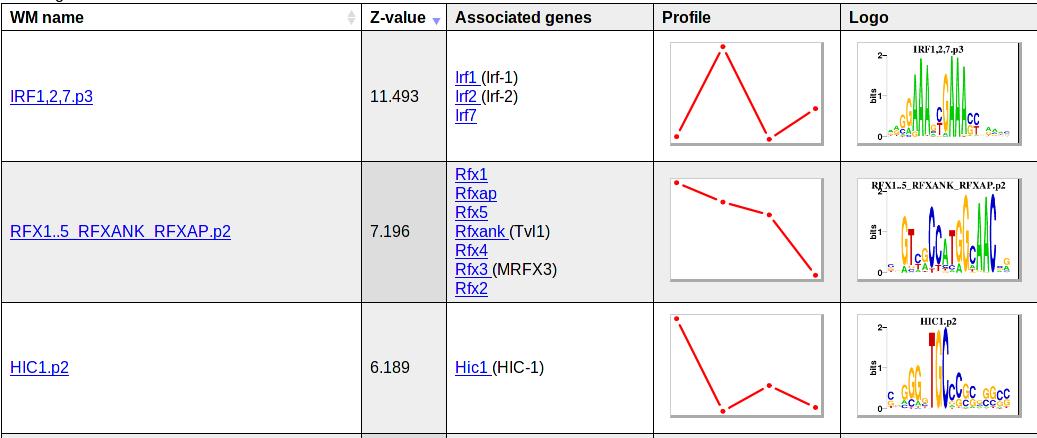
Description of the Epi-MARA results pages
The Epi-MARA web interface presents its predictions in the following way: All regulatory motifs are sorted from top to bottom by a statistic (Z-value) that quantifies how much the motif contributes to explaining the chromatin dynamics across the samples. For each predicted motif Epi-MARA lists its name, its Z-value, the names of genes (i.e. TFs) that may bind to this motif, a rough outline of what the motif's activity profile across the samples looks like, and a sequence logo of the motif. The figure below shows the top 3 motifs from an example results page:
By clicking on the motif name (for example HIC1.p2), the user is taken to a new page with more detailed information about HIC1.p2. The figure below shows what this information looks like:
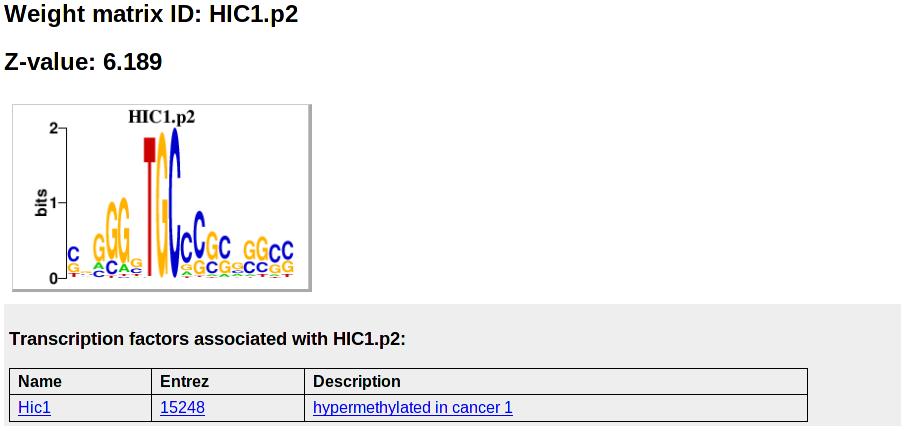
Shown is again the motif name, its Z-value, and its sequence logo. Below that, all associated TF genes are shown in a table containing links to the Entrez gene pages with information about the gene, and a short description of the gene.
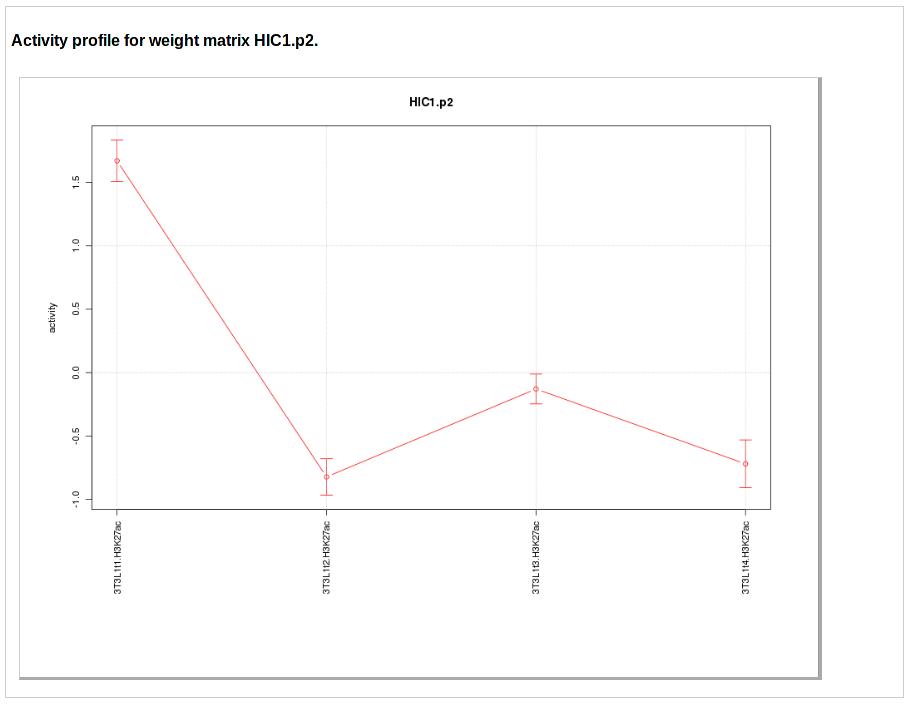
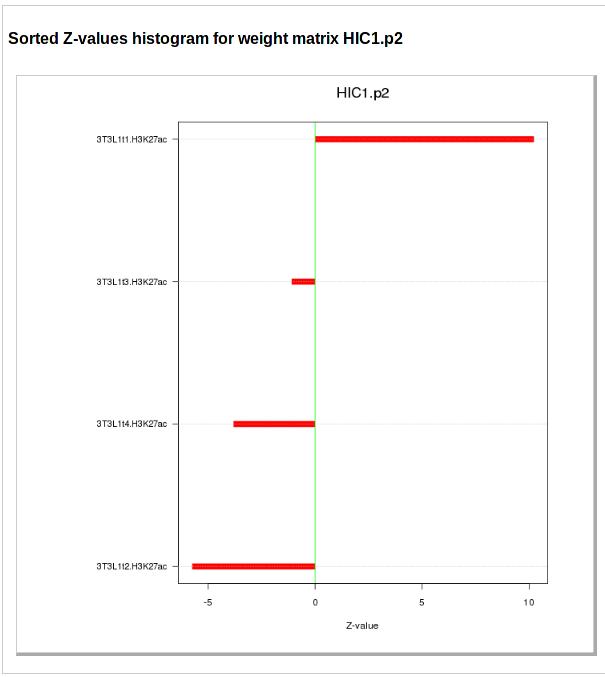
The next two figures show the activity profile of the motif. The first figure shows the motif activities and associated error-bars (y-axis) across the samples (x-axis) sorted by the order in which they were provided by the user. This view is especially appropriate for time course data. The second figure shows the motif activities z-values for the sample sorted from highest (top) to lowest activity (bottom).
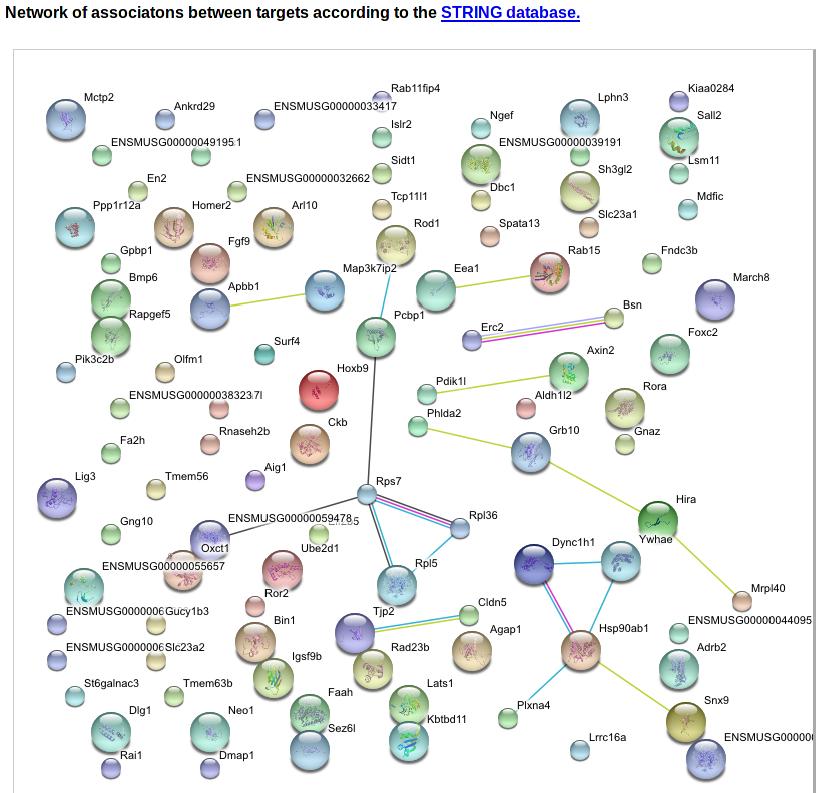
The next figure gives a graphical 'network' overview of the predicted target genes of the motif. We collect up to the first 100 predicted targets of the motif and use the STRING database [1] to obtain the network of known associations between these genes. Clicking on the figure directs the user directly to the String website where this network can be further interactively explored. This interface may help the user form a picture of the pathways targeted by the motif.
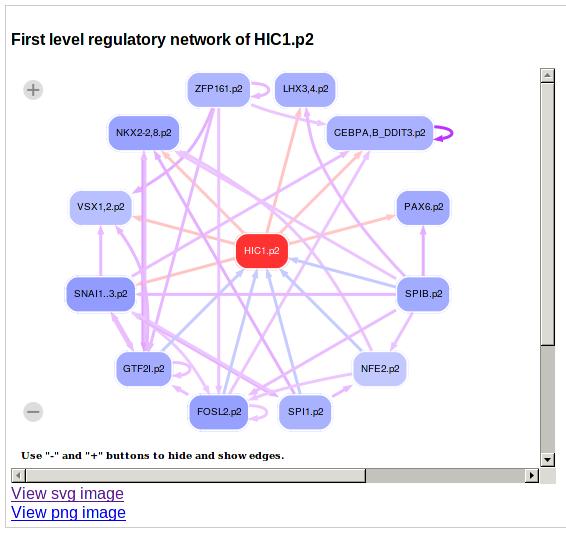
Next, a figure is provided with predicted regulatory interactions between the current motif and other motifs. To build a regulatory network for this motif, i.e. HIC1.p2, we first check for each target promoter of HIC1.p2 (for example the promoter with ID chr18_1246173, see table below) if it is a gene encoding a transcription factor. If it is and if the z-value for being a target gene is bigger than 0.5, we draw an arrow from HIC1.p2 to this target TF. Similarly, for regulatory motifs with predicted sites in the HIC1 promoter and with a z-value larger than 0.5 an arrow is drawn from the motif to HIC1. The user can interactively change the cut-off for drawing edges in this regulatory network graph.
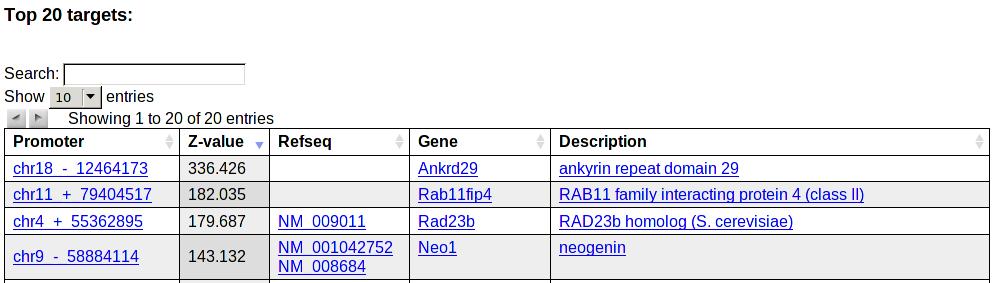
Next a table with the top 20 predicted target promoters, a Z-value for the targeting, associated transcripts and genes is shown. Links are again provided to the Entrez gene pages.
Finally, a gene ontology analysis is performed for the predicted set of target genes giving information on:
- Gene overrepresentation in process category
- Gene overrepresentation in compartment category
- Gene overrepresentation in function category
Important: When running in the Epi-MARA expert mode several of these features will not be provided as it is impossible to provide automated associations between regions, genes, motifs, and TFs given that it is a priori unknown what kind of data will be uploadeded.
References:
1: Szklarczyk, D, Franceschini, A, Kuhn, M, Simonovic, M, Roth, A, Minguez, P, Doerks, T, Stark, M, Muller, J, Bork, P, Jensen, LJ, von Mering, C (2011). The STRING database in 2011: functional interaction networks of proteins, globally integrated and scored