Project
GSE58827: Dynamics of the Mouse Liver
Navigation
Downloads
Results for Irx4
Z-value: 0.54
Motif logo
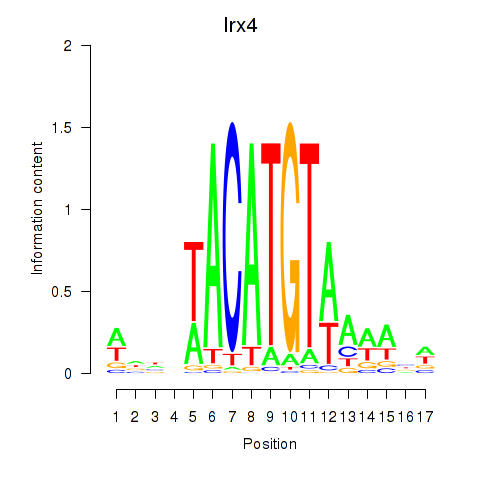
Transcription factors associated with Irx4
| Gene Symbol | Gene ID | Gene Info |
|---|---|---|
|
Irx4
|
ENSMUSG00000021604.16 | Iroquois homeobox 4 |
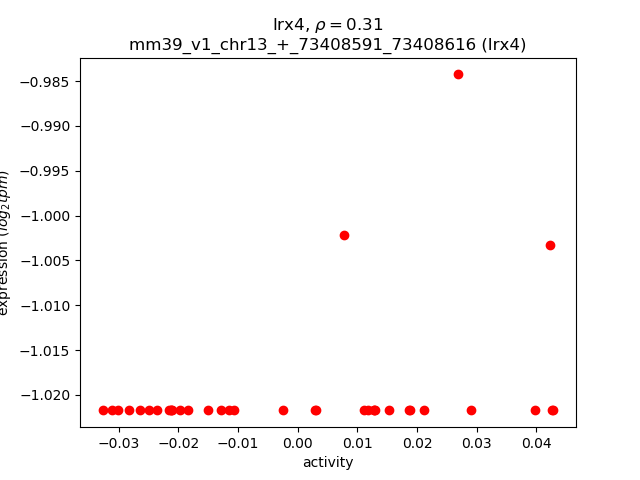
Activity-expression correlation:
| Gene | Promoter | Pearson corr. coef. | P-value | Plot |
|---|---|---|---|---|
| Irx4 | mm39_v1_chr13_+_73408591_73408616 | 0.31 | 6.4e-02 | Click! |
Activity profile of Irx4 motif
Sorted Z-values of Irx4 motif
| Promoter | Log-likelihood | Transcript | Gene | Gene Info |
|---|---|---|---|---|
| chr11_-_11920540 | 7.92 |
ENSMUST00000109653.8
|
Grb10
|
growth factor receptor bound protein 10 |
| chr6_-_83294526 | 4.51 |
ENSMUST00000005810.9
|
Mthfd2
|
methylenetetrahydrofolate dehydrogenase (NAD+ dependent), methenyltetrahydrofolate cyclohydrolase |
| chr16_+_16964801 | 3.26 |
ENSMUST00000232479.2
ENSMUST00000232344.2 ENSMUST00000069064.7 |
Ydjc
|
YdjC homolog (bacterial) |
| chr2_+_24235300 | 2.75 |
ENSMUST00000114485.9
ENSMUST00000114482.3 |
Il1rn
|
interleukin 1 receptor antagonist |
| chr8_+_85598734 | 2.46 |
ENSMUST00000170296.2
ENSMUST00000136026.8 |
Syce2
|
synaptonemal complex central element protein 2 |
| chr19_-_32443978 | 2.28 |
ENSMUST00000078034.5
|
Rpl9-ps6
|
ribosomal protein L9, pseudogene 6 |
| chr16_+_49620883 | 1.65 |
ENSMUST00000229640.2
|
Cd47
|
CD47 antigen (Rh-related antigen, integrin-associated signal transducer) |
| chr12_-_114252202 | 1.31 |
ENSMUST00000195124.6
ENSMUST00000103481.3 |
Ighv3-6
|
immunoglobulin heavy variable 3-6 |
| chr9_+_19716202 | 0.68 |
ENSMUST00000212540.3
ENSMUST00000217280.2 |
Olfr859
|
olfactory receptor 859 |
| chr1_+_45350698 | 0.67 |
ENSMUST00000087883.13
|
Col3a1
|
collagen, type III, alpha 1 |
| chr6_-_130208601 | 0.57 |
ENSMUST00000088011.11
ENSMUST00000112013.8 ENSMUST00000049304.14 |
Klra7
|
killer cell lectin-like receptor, subfamily A, member 7 |
| chr6_-_69584812 | 0.46 |
ENSMUST00000103359.3
|
Igkv4-55
|
immunoglobulin kappa variable 4-55 |
| chr2_-_111253457 | 0.43 |
ENSMUST00000213210.2
ENSMUST00000184954.4 |
Olfr1286
|
olfactory receptor 1286 |
| chr7_+_106413336 | 0.30 |
ENSMUST00000166880.3
ENSMUST00000075414.8 |
Olfr701
|
olfactory receptor 701 |
| chr3_+_59832635 | 0.29 |
ENSMUST00000049476.3
|
Aadacl2fm1
|
AADACL2 family member 1 |
| chr18_+_44467133 | 0.23 |
ENSMUST00000025349.12
ENSMUST00000115498.2 |
Myot
|
myotilin |
| chr4_+_48663504 | 0.19 |
ENSMUST00000030033.5
|
Cavin4
|
caveolae associated 4 |
| chr6_-_3494587 | 0.18 |
ENSMUST00000049985.15
|
Hepacam2
|
HEPACAM family member 2 |
| chr9_+_35819708 | 0.15 |
ENSMUST00000176049.2
ENSMUST00000176153.2 |
Pate13
|
prostate and testis expressed 13 |
| chr3_+_84832783 | 0.14 |
ENSMUST00000107675.8
|
Fbxw7
|
F-box and WD-40 domain protein 7 |
| chr12_-_115825934 | 0.04 |
ENSMUST00000198777.2
|
Ighv1-77
|
immunoglobulin heavy variable 1-77 |
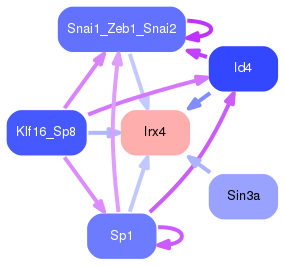
Network of associatons between targets according to the STRING database.

First level regulatory network of Irx4
Gene Ontology Analysis
Gene overrepresentation in biological process category:
| Log-likelihood per target | Total log-likelihood | Term | Description |
|---|---|---|---|
| 0.8 | 7.9 | GO:0045719 | negative regulation of glycogen biosynthetic process(GO:0045719) |
| 0.6 | 2.8 | GO:2000660 | negative regulation of interleukin-1-mediated signaling pathway(GO:2000660) |
| 0.2 | 4.5 | GO:0046653 | tetrahydrofolate metabolic process(GO:0046653) |
| 0.1 | 1.6 | GO:0008228 | opsonization(GO:0008228) |
| 0.1 | 0.7 | GO:0060414 | aorta smooth muscle tissue morphogenesis(GO:0060414) |
| 0.1 | 2.5 | GO:0007130 | synaptonemal complex assembly(GO:0007130) |
| 0.0 | 0.1 | GO:1903378 | positive regulation of oxidative stress-induced neuron intrinsic apoptotic signaling pathway(GO:1903378) |
| 0.0 | 0.7 | GO:0050911 | detection of chemical stimulus involved in sensory perception of smell(GO:0050911) |
Gene overrepresentation in cellular component category:
| Log-likelihood per target | Total log-likelihood | Term | Description |
|---|---|---|---|
| 0.2 | 2.5 | GO:0000801 | central element(GO:0000801) |
| 0.1 | 0.7 | GO:0005583 | fibrillar collagen trimer(GO:0005583) banded collagen fibril(GO:0098643) |
| 0.0 | 0.1 | GO:1990452 | Parkin-FBXW7-Cul1 ubiquitin ligase complex(GO:1990452) |
| 0.0 | 1.3 | GO:0042571 | immunoglobulin complex, circulating(GO:0042571) |
Gene overrepresentation in molecular function category:
| Log-likelihood per target | Total log-likelihood | Term | Description |
|---|---|---|---|
| 0.9 | 2.8 | GO:0005152 | interleukin-1 receptor antagonist activity(GO:0005152) |
| 0.8 | 4.5 | GO:0004487 | methylenetetrahydrofolate dehydrogenase (NAD+) activity(GO:0004487) |
| 0.1 | 1.6 | GO:0070053 | thrombospondin receptor activity(GO:0070053) |
| 0.1 | 7.9 | GO:0005070 | SH3/SH2 adaptor activity(GO:0005070) |
| 0.0 | 0.7 | GO:0048407 | platelet-derived growth factor binding(GO:0048407) |
| 0.0 | 0.1 | GO:0050816 | phosphothreonine binding(GO:0050816) |
| 0.0 | 1.3 | GO:0034987 | immunoglobulin receptor binding(GO:0034987) |
Gene overrepresentation in curated gene sets: canonical pathways category:
| Log-likelihood per target | Total log-likelihood | Term | Description |
|---|---|---|---|
| 0.1 | 7.9 | PID IGF1 PATHWAY | IGF1 pathway |
| 0.1 | 2.8 | PID IL1 PATHWAY | IL1-mediated signaling events |
| 0.0 | 1.6 | PID INTEGRIN3 PATHWAY | Beta3 integrin cell surface interactions |
| 0.0 | 0.7 | NABA COLLAGENS | Genes encoding collagen proteins |
Gene overrepresentation in curated gene sets: REACTOME pathways category:
| Log-likelihood per target | Total log-likelihood | Term | Description |
|---|---|---|---|
| 0.3 | 7.9 | REACTOME SIGNAL ATTENUATION | Genes involved in Signal attenuation |
| 0.1 | 1.6 | REACTOME SIGNAL REGULATORY PROTEIN SIRP FAMILY INTERACTIONS | Genes involved in Signal regulatory protein (SIRP) family interactions |
| 0.0 | 2.8 | REACTOME IL1 SIGNALING | Genes involved in Interleukin-1 signaling |
| 0.0 | 0.7 | REACTOME NCAM1 INTERACTIONS | Genes involved in NCAM1 interactions |