Project
GSE58827: Dynamics of the Mouse Liver
Navigation
Downloads
Results for Zbtb49
Z-value: 0.73
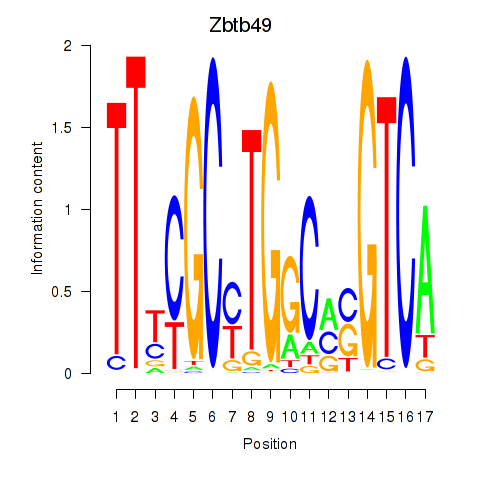
Motif logo
Transcription factors associated with Zbtb49
| Gene Symbol | Gene ID | Gene Info |
|---|---|---|
|
Zbtb49
|
ENSMUSG00000029127.16 | zinc finger and BTB domain containing 49 |
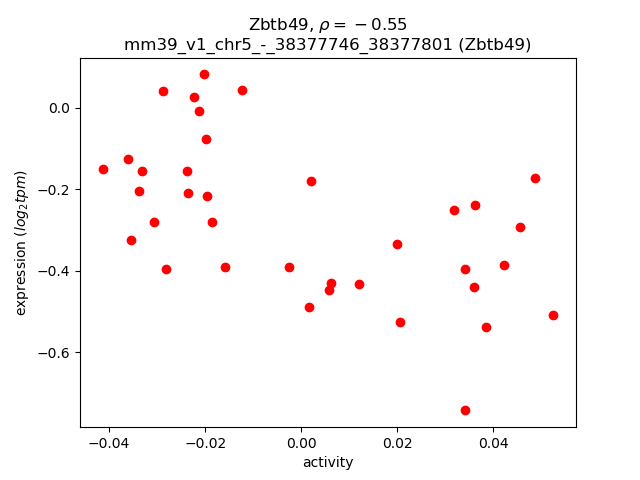
Activity-expression correlation:
| Gene | Promoter | Pearson corr. coef. | P-value | Plot |
|---|---|---|---|---|
| Zbtb49 | mm39_v1_chr5_-_38377746_38377801 | -0.55 | 4.7e-04 | Click! |
Activity profile of Zbtb49 motif
Sorted Z-values of Zbtb49 motif
| Promoter | Log-likelihood | Transcript | Gene | Gene Info |
|---|---|---|---|---|
| chr19_-_39637489 | 7.32 |
ENSMUST00000067328.7
|
Cyp2c67
|
cytochrome P450, family 2, subfamily c, polypeptide 67 |
| chr15_-_34495329 | 6.59 |
ENSMUST00000022946.6
|
Rida
|
reactive intermediate imine deaminase A homolog |
| chr17_+_24955613 | 5.96 |
ENSMUST00000115262.9
|
Msrb1
|
methionine sulfoxide reductase B1 |
| chr17_+_24955647 | 5.82 |
ENSMUST00000101800.7
|
Msrb1
|
methionine sulfoxide reductase B1 |
| chr18_-_62044871 | 5.00 |
ENSMUST00000166783.3
ENSMUST00000049378.15 |
Ablim3
|
actin binding LIM protein family, member 3 |
| chr6_+_71176811 | 4.19 |
ENSMUST00000067492.8
|
Fabp1
|
fatty acid binding protein 1, liver |
| chr7_-_34914675 | 3.18 |
ENSMUST00000118444.3
ENSMUST00000122409.8 |
Lrp3
|
low density lipoprotein receptor-related protein 3 |
| chr7_-_139734637 | 2.21 |
ENSMUST00000059241.8
|
Sprn
|
shadow of prion protein |
| chr15_-_100320872 | 1.50 |
ENSMUST00000138843.8
|
Slc11a2
|
solute carrier family 11 (proton-coupled divalent metal ion transporters), member 2 |
| chr5_+_108777855 | 1.34 |
ENSMUST00000078323.13
ENSMUST00000120327.3 |
Tmem175
|
transmembrane protein 175 |
| chr5_+_108777636 | 1.32 |
ENSMUST00000146207.6
ENSMUST00000063272.13 |
Tmem175
|
transmembrane protein 175 |
| chr15_-_3333003 | 1.19 |
ENSMUST00000165386.2
|
Ccdc152
|
coiled-coil domain containing 152 |
| chr8_+_105727456 | 1.06 |
ENSMUST00000172032.4
|
Ces2h
|
carboxylesterase 2H |
| chr15_+_100321074 | 1.06 |
ENSMUST00000148928.2
|
Gm5475
|
predicted gene 5475 |
| chr2_-_80411578 | 0.89 |
ENSMUST00000028386.12
|
Nckap1
|
NCK-associated protein 1 |
| chr2_-_80411724 | 0.89 |
ENSMUST00000111760.3
|
Nckap1
|
NCK-associated protein 1 |
| chr7_-_97848688 | 0.80 |
ENSMUST00000098278.4
|
B3gnt6
|
UDP-GlcNAc:betaGal beta-1,3-N-acetylglucosaminyltransferase 6 (core 3 synthase) |
| chr3_-_52924616 | 0.76 |
ENSMUST00000193432.6
ENSMUST00000195183.2 ENSMUST00000036665.10 |
Cog6
|
component of oligomeric golgi complex 6 |
| chr8_-_106706035 | 0.70 |
ENSMUST00000034371.9
|
Dpep3
|
dipeptidase 3 |
| chr14_-_68893253 | 0.68 |
ENSMUST00000225767.3
ENSMUST00000111072.8 ENSMUST00000022642.6 ENSMUST00000224039.2 |
Adam28
|
a disintegrin and metallopeptidase domain 28 |
| chr9_+_45341589 | 0.67 |
ENSMUST00000239471.2
ENSMUST00000034592.11 ENSMUST00000239429.2 |
Dscaml1
|
DS cell adhesion molecule like 1 |
| chr9_+_40180726 | 0.56 |
ENSMUST00000171835.9
|
Scn3b
|
sodium channel, voltage-gated, type III, beta |
| chr5_-_108777578 | 0.55 |
ENSMUST00000046603.15
|
Gak
|
cyclin G associated kinase |
| chr1_+_32211792 | 0.53 |
ENSMUST00000027226.12
ENSMUST00000189878.2 ENSMUST00000188257.7 ENSMUST00000185666.2 |
Khdrbs2
|
KH domain containing, RNA binding, signal transduction associated 2 |
| chr12_+_89779178 | 0.47 |
ENSMUST00000238943.2
|
Nrxn3
|
neurexin III |
| chr3_+_154302989 | 0.47 |
ENSMUST00000140644.8
ENSMUST00000144764.8 ENSMUST00000155232.2 |
Cryz
|
crystallin, zeta |
| chr8_-_106723026 | 0.45 |
ENSMUST00000227363.2
ENSMUST00000081998.13 |
Dpep2
|
dipeptidase 2 |
| chr12_+_89779237 | 0.41 |
ENSMUST00000110133.9
ENSMUST00000110130.4 |
Nrxn3
|
neurexin III |
| chr14_-_122703089 | 0.27 |
ENSMUST00000039118.7
|
Zic5
|
zinc finger protein of the cerebellum 5 |
| chr2_+_131048998 | 0.26 |
ENSMUST00000153097.3
|
Ap5s1
|
adaptor-related protein 5 complex, sigma 1 subunit |
| chr5_+_35971697 | 0.25 |
ENSMUST00000130233.8
|
Ablim2
|
actin-binding LIM protein 2 |
| chrX_+_20714782 | 0.22 |
ENSMUST00000001155.11
ENSMUST00000122312.8 ENSMUST00000120356.8 ENSMUST00000122850.2 |
Araf
|
Araf proto-oncogene, serine/threonine kinase |
| chr17_-_89099404 | 0.22 |
ENSMUST00000024916.7
|
Lhcgr
|
luteinizing hormone/choriogonadotropin receptor |
| chr14_+_53279810 | 0.19 |
ENSMUST00000198439.5
ENSMUST00000103605.3 |
Trav8d-2
|
T cell receptor alpha variable 8D-2 |
| chr13_+_19445054 | 0.15 |
ENSMUST00000164407.2
ENSMUST00000198163.2 |
Trgc3
|
T cell receptor gamma, constant 3 |
| chr2_-_167082505 | 0.05 |
ENSMUST00000088041.11
ENSMUST00000018113.8 |
Ptgis
|
prostaglandin I2 (prostacyclin) synthase |
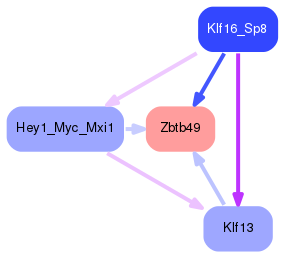
Network of associatons between targets according to the STRING database.

First level regulatory network of Zbtb49
Gene Ontology Analysis
Gene overrepresentation in biological process category:
| Log-likelihood per target | Total log-likelihood | Term | Description |
|---|---|---|---|
| 2.9 | 11.8 | GO:0030091 | protein repair(GO:0030091) |
| 0.3 | 4.2 | GO:0032000 | positive regulation of fatty acid beta-oxidation(GO:0032000) |
| 0.3 | 1.8 | GO:0030950 | establishment or maintenance of actin cytoskeleton polarity(GO:0030950) |
| 0.2 | 2.7 | GO:0090385 | phagosome-lysosome fusion(GO:0090385) |
| 0.2 | 7.3 | GO:0019373 | epoxygenase P450 pathway(GO:0019373) |
| 0.2 | 0.6 | GO:0035622 | intrahepatic bile duct development(GO:0035622) |
| 0.1 | 0.7 | GO:0016338 | calcium-independent cell-cell adhesion via plasma membrane cell-adhesion molecules(GO:0016338) |
| 0.0 | 5.0 | GO:1903955 | positive regulation of protein targeting to mitochondrion(GO:1903955) |
| 0.0 | 0.2 | GO:0032962 | positive regulation of inositol trisphosphate biosynthetic process(GO:0032962) |
| 0.0 | 0.9 | GO:0090129 | positive regulation of synapse maturation(GO:0090129) |
| 0.0 | 6.6 | GO:0050680 | negative regulation of epithelial cell proliferation(GO:0050680) |
| 0.0 | 1.1 | GO:0006693 | prostanoid metabolic process(GO:0006692) prostaglandin metabolic process(GO:0006693) |
| 0.0 | 0.2 | GO:0060373 | regulation of ventricular cardiac muscle cell membrane depolarization(GO:0060373) |
| 0.0 | 0.5 | GO:0042178 | xenobiotic catabolic process(GO:0042178) |
| 0.0 | 0.8 | GO:0006891 | intra-Golgi vesicle-mediated transport(GO:0006891) |
| 0.0 | 0.7 | GO:0007140 | male meiosis(GO:0007140) |
Gene overrepresentation in cellular component category:
| Log-likelihood per target | Total log-likelihood | Term | Description |
|---|---|---|---|
| 0.4 | 4.2 | GO:0045179 | apical cortex(GO:0045179) |
| 0.1 | 1.8 | GO:0031209 | SCAR complex(GO:0031209) |
| 0.1 | 0.8 | GO:0017119 | Golgi transport complex(GO:0017119) |
| 0.0 | 5.0 | GO:0097517 | stress fiber(GO:0001725) contractile actin filament bundle(GO:0097517) |
| 0.0 | 6.6 | GO:0042579 | peroxisome(GO:0005777) microbody(GO:0042579) |
| 0.0 | 12.0 | GO:0015629 | actin cytoskeleton(GO:0015629) |
Gene overrepresentation in molecular function category:
| Log-likelihood per target | Total log-likelihood | Term | Description |
|---|---|---|---|
| 2.0 | 11.8 | GO:0033743 | peptide-methionine (R)-S-oxide reductase activity(GO:0033743) |
| 0.7 | 6.6 | GO:0016892 | endoribonuclease activity, producing 3'-phosphomonoesters(GO:0016892) |
| 0.5 | 4.2 | GO:0005324 | long-chain fatty acid transporter activity(GO:0005324) |
| 0.2 | 7.3 | GO:0008392 | arachidonic acid epoxygenase activity(GO:0008392) |
| 0.1 | 2.7 | GO:0022841 | potassium ion leak channel activity(GO:0022841) |
| 0.1 | 0.5 | GO:0003960 | NADPH:quinone reductase activity(GO:0003960) |
| 0.1 | 1.1 | GO:0008239 | dipeptidyl-peptidase activity(GO:0008239) |
| 0.0 | 0.2 | GO:0086006 | voltage-gated sodium channel activity involved in cardiac muscle cell action potential(GO:0086006) |
| 0.0 | 1.8 | GO:0048365 | Rac GTPase binding(GO:0048365) |
| 0.0 | 0.8 | GO:0008378 | galactosyltransferase activity(GO:0008378) |
| 0.0 | 0.5 | GO:0008143 | poly(A) binding(GO:0008143) |
| 0.0 | 0.9 | GO:0005246 | calcium channel regulator activity(GO:0005246) |
| 0.0 | 0.2 | GO:0016500 | protein-hormone receptor activity(GO:0016500) |
| 0.0 | 0.6 | GO:0030332 | cyclin binding(GO:0030332) |
Gene overrepresentation in curated gene sets: canonical pathways category:
| Log-likelihood per target | Total log-likelihood | Term | Description |
|---|---|---|---|
| 0.0 | 1.8 | PID ECADHERIN NASCENT AJ PATHWAY | E-cadherin signaling in the nascent adherens junction |
| 0.0 | 0.7 | PID INTEGRIN A4B1 PATHWAY | Alpha4 beta1 integrin signaling events |
Gene overrepresentation in curated gene sets: REACTOME pathways category:
| Log-likelihood per target | Total log-likelihood | Term | Description |
|---|---|---|---|
| 0.2 | 5.0 | REACTOME DCC MEDIATED ATTRACTIVE SIGNALING | Genes involved in DCC mediated attractive signaling |
| 0.0 | 0.7 | REACTOME DSCAM INTERACTIONS | Genes involved in DSCAM interactions |
| 0.0 | 4.2 | REACTOME PPARA ACTIVATES GENE EXPRESSION | Genes involved in PPARA Activates Gene Expression |
| 0.0 | 0.2 | REACTOME HORMONE LIGAND BINDING RECEPTORS | Genes involved in Hormone ligand-binding receptors |
| 0.0 | 0.8 | REACTOME O LINKED GLYCOSYLATION OF MUCINS | Genes involved in O-linked glycosylation of mucins |