Project
PRJDB7713: Age associated transcriptome analysis in 5 tissues of zebrafish
Navigation
Downloads
Results for gata1a+gata2b
Z-value: 0.25
Motif logo
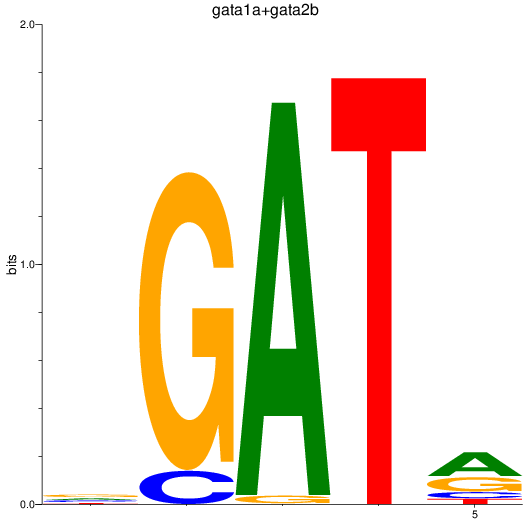
Transcription factors associated with gata1a+gata2b
| Gene Symbol | Gene ID | Gene Info |
|---|---|---|
|
gata2b
|
ENSDARG00000009094 | GATA binding protein 2b |
|
gata1a
|
ENSDARG00000013477 | GATA binding protein 1a |
|
gata1a
|
ENSDARG00000117116 | GATA binding protein 1a |
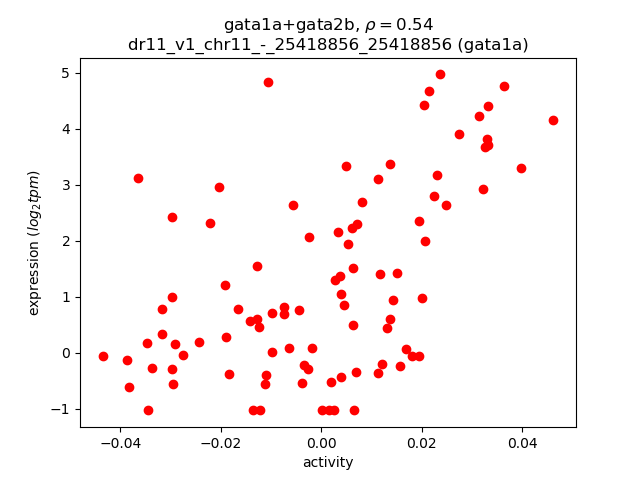
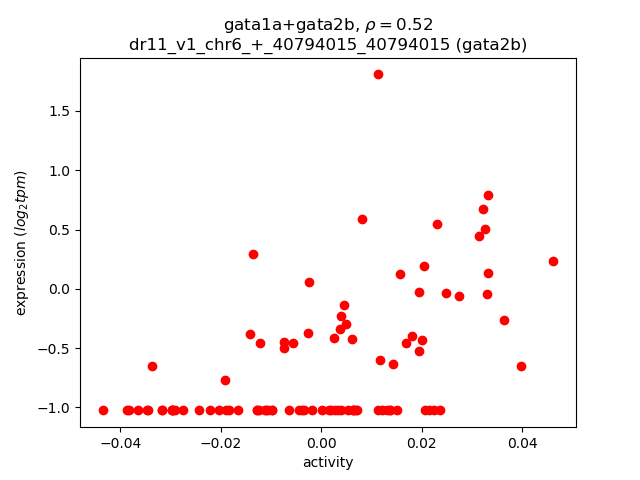
Activity-expression correlation:
| Gene | Promoter | Pearson corr. coef. | P-value | Plot |
|---|---|---|---|---|
| gata1a | dr11_v1_chr11_-_25418856_25418856 | 0.54 | 1.5e-08 | Click! |
| gata2b | dr11_v1_chr6_+_40794015_40794015 | 0.52 | 6.4e-08 | Click! |
Activity profile of gata1a+gata2b motif
Sorted Z-values of gata1a+gata2b motif
| Promoter | Log-likelihood | Transcript | Gene | Gene Info |
|---|---|---|---|---|
| chr22_+_15507218 | 2.13 |
ENSDART00000125450
|
gpc1a
|
glypican 1a |
| chr6_-_49159207 | 2.03 |
ENSDART00000041942
|
tspan2a
|
tetraspanin 2a |
| chr21_+_24287403 | 1.80 |
ENSDART00000111169
|
cadm1a
|
cell adhesion molecule 1a |
| chr19_-_32710922 | 1.75 |
ENSDART00000004034
|
hpca
|
hippocalcin |
| chr12_-_5505205 | 1.68 |
ENSDART00000092319
|
abi3b
|
ABI family, member 3b |
| chr22_+_21398508 | 1.48 |
ENSDART00000089408
ENSDART00000186091 |
shdb
|
Src homology 2 domain containing transforming protein D, b |
| chr19_+_12444943 | 1.29 |
ENSDART00000135706
|
ldlrad4a
|
low density lipoprotein receptor class A domain containing 4a |
| chr4_-_1360495 | 1.28 |
ENSDART00000164623
|
ptn
|
pleiotrophin |
| chr16_-_35532937 | 0.84 |
ENSDART00000193209
|
ctps1b
|
CTP synthase 1b |
| chr10_-_31175744 | 0.73 |
ENSDART00000191728
|
pknox2
|
pbx/knotted 1 homeobox 2 |
| chr22_-_16270462 | 0.43 |
ENSDART00000105681
|
cdc14ab
|
cell division cycle 14Ab |
| chr10_+_42589391 | 0.43 |
ENSDART00000067689
ENSDART00000075259 |
fgfr1b
|
fibroblast growth factor receptor 1b |
| chr7_-_72067475 | 0.34 |
ENSDART00000017763
|
LO018380.1
|
|
| chr15_-_16704417 | 0.27 |
ENSDART00000155163
|
caln1
|
calneuron 1 |
| chr5_+_18047111 | 0.22 |
ENSDART00000132164
|
hira
|
histone cell cycle regulator a |
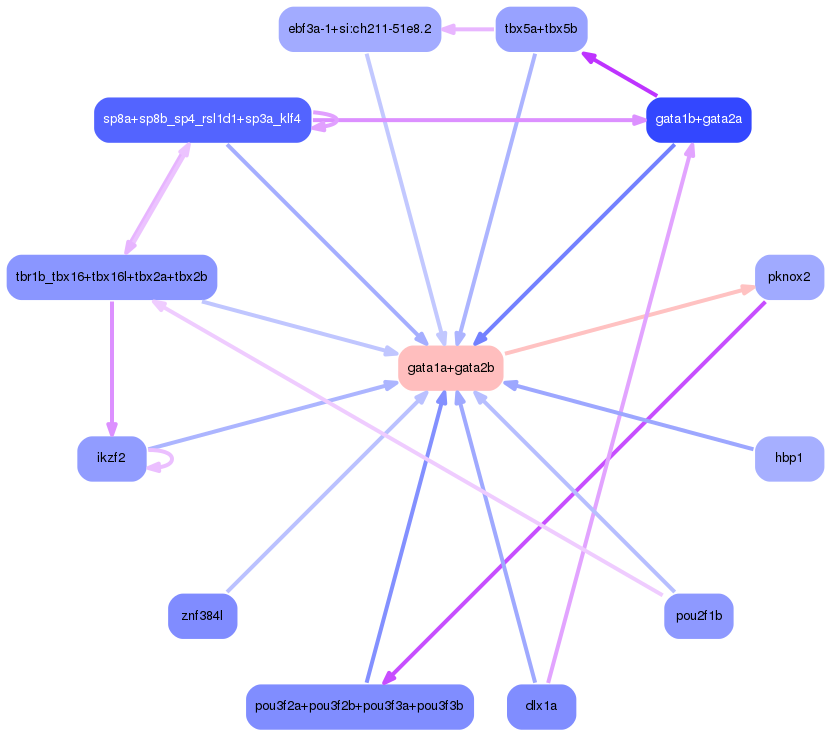
Network of associatons between targets according to the STRING database.

First level regulatory network of gata1a+gata2b
Gene Ontology Analysis
Gene overrepresentation in biological process category:
| Log-likelihood per target | Total log-likelihood | Term | Description |
|---|---|---|---|
| 0.2 | 0.8 | GO:0044210 | 'de novo' CTP biosynthetic process(GO:0044210) |
| 0.2 | 1.3 | GO:0060394 | negative regulation of pathway-restricted SMAD protein phosphorylation(GO:0060394) |
| 0.1 | 2.1 | GO:0035622 | intrahepatic bile duct development(GO:0035622) |
| 0.0 | 0.4 | GO:0071850 | mitotic cell cycle arrest(GO:0071850) |
| 0.0 | 1.3 | GO:0051781 | positive regulation of cell division(GO:0051781) |
| 0.0 | 0.2 | GO:0006336 | DNA replication-independent nucleosome assembly(GO:0006336) |
| 0.0 | 0.4 | GO:0036342 | post-anal tail morphogenesis(GO:0036342) |
| 0.0 | 1.8 | GO:0021782 | glial cell development(GO:0021782) |
Gene overrepresentation in cellular component category:
| Log-likelihood per target | Total log-likelihood | Term | Description |
|---|---|---|---|
| 0.2 | 0.8 | GO:0097268 | cytoophidium(GO:0097268) |
| 0.1 | 2.1 | GO:0046658 | anchored component of plasma membrane(GO:0046658) |
| 0.1 | 0.4 | GO:1902636 | kinociliary basal body(GO:1902636) |
| 0.0 | 1.3 | GO:0031901 | early endosome membrane(GO:0031901) |
| 0.0 | 1.7 | GO:0030027 | lamellipodium(GO:0030027) |
Gene overrepresentation in molecular function category:
| Log-likelihood per target | Total log-likelihood | Term | Description |
|---|---|---|---|
| 0.3 | 1.3 | GO:0070412 | R-SMAD binding(GO:0070412) |
| 0.2 | 1.5 | GO:0001784 | phosphotyrosine binding(GO:0001784) |
| 0.2 | 0.8 | GO:0003883 | CTP synthase activity(GO:0003883) |
| 0.1 | 2.6 | GO:0017134 | fibroblast growth factor binding(GO:0017134) |
| 0.0 | 1.7 | GO:0017124 | SH3 domain binding(GO:0017124) |
| 0.0 | 1.3 | GO:0008201 | heparin binding(GO:0008201) |
Gene overrepresentation in curated gene sets: canonical pathways category:
| Log-likelihood per target | Total log-likelihood | Term | Description |
|---|---|---|---|
| 0.1 | 1.3 | PID SYNDECAN 3 PATHWAY | Syndecan-3-mediated signaling events |