Project
PRJDB7713: Age associated transcriptome analysis in 5 tissues of zebrafish
Navigation
Downloads
Results for glis3
Z-value: 0.44
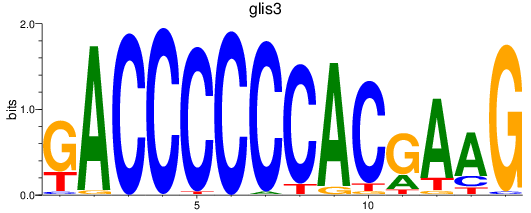
Motif logo
Transcription factors associated with glis3
| Gene Symbol | Gene ID | Gene Info |
|---|---|---|
|
glis3
|
ENSDARG00000069726 | GLIS family zinc finger 3 |
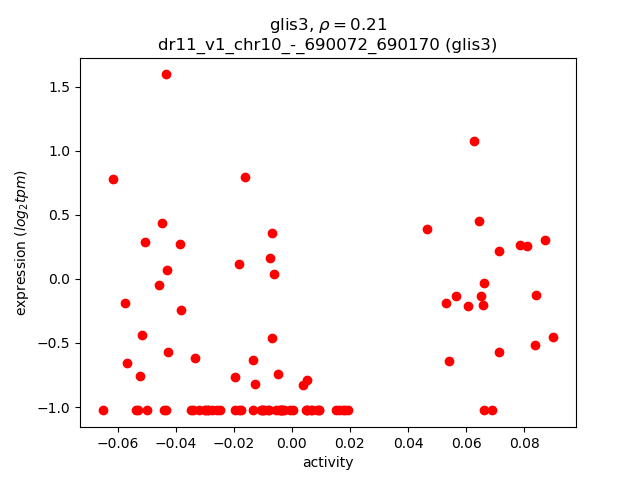
Activity-expression correlation:
| Gene | Promoter | Pearson corr. coef. | P-value | Plot |
|---|---|---|---|---|
| glis3 | dr11_v1_chr10_-_690072_690170 | 0.21 | 4.4e-02 | Click! |
Activity profile of glis3 motif
Sorted Z-values of glis3 motif
| Promoter | Log-likelihood | Transcript | Gene | Gene Info |
|---|---|---|---|---|
| chr25_+_7461624 | 13.10 |
ENSDART00000170569
|
syt12
|
synaptotagmin XII |
| chr8_-_33114202 | 6.54 |
ENSDART00000098840
|
ralgps1
|
Ral GEF with PH domain and SH3 binding motif 1 |
| chr14_-_34044369 | 5.28 |
ENSDART00000149396
ENSDART00000123607 ENSDART00000190746 |
cyfip2
|
cytoplasmic FMR1 interacting protein 2 |
| chr20_-_9963713 | 3.97 |
ENSDART00000104234
|
gjd2b
|
gap junction protein delta 2b |
| chr13_-_638485 | 3.58 |
ENSDART00000066080
ENSDART00000128969 |
slit1a
|
slit homolog 1a (Drosophila) |
| chr24_+_26134029 | 3.16 |
ENSDART00000185134
|
tmtopsb
|
teleost multiple tissue opsin b |
| chr5_+_67662430 | 2.82 |
ENSDART00000137700
ENSDART00000142586 |
si:dkey-70b23.2
|
si:dkey-70b23.2 |
| chr20_-_18915376 | 2.74 |
ENSDART00000063725
|
xkr6b
|
XK, Kell blood group complex subunit-related family, member 6b |
| chr14_-_30704075 | 2.49 |
ENSDART00000134098
|
efemp2a
|
EGF containing fibulin extracellular matrix protein 2a |
| chr3_+_30190419 | 2.38 |
ENSDART00000157320
|
akt1s1
|
AKT1 substrate 1 (proline-rich) |
| chr2_+_49246099 | 2.31 |
ENSDART00000179089
|
sema6ba
|
sema domain, transmembrane domain (TM), and cytoplasmic domain, (semaphorin) 6Ba |
| chr20_-_26588736 | 1.92 |
ENSDART00000134337
|
exoc2
|
exocyst complex component 2 |
| chr3_-_25106878 | 1.88 |
ENSDART00000142503
|
rbx1
|
ring-box 1, E3 ubiquitin protein ligase |
| chr18_-_41375120 | 1.82 |
ENSDART00000098673
|
ptx3a
|
pentraxin 3, long a |
| chr21_+_20949976 | 1.72 |
ENSDART00000135342
|
htr1ab
|
5-hydroxytryptamine (serotonin) receptor 1A b |
| chr21_+_20950161 | 1.21 |
ENSDART00000079698
|
htr1ab
|
5-hydroxytryptamine (serotonin) receptor 1A b |
| chr22_-_3261879 | 1.19 |
ENSDART00000159643
|
gpr35.1
|
G protein-coupled receptor 35, tandem duplicate 1 |
| chr17_+_8925232 | 0.96 |
ENSDART00000036668
|
psmc1a
|
proteasome 26S subunit, ATPase 1a |
| chr24_-_38574631 | 0.69 |
ENSDART00000154539
|
slc17a7b
|
solute carrier family 17 (vesicular glutamate transporter), member 7b |
| chr13_+_22421151 | 0.24 |
ENSDART00000122687
|
opn4a
|
opsin 4a (melanopsin) |
| chr18_+_7309150 | 0.18 |
ENSDART00000052792
|
cers3b
|
ceramide synthase 3b |
| chr17_+_49500820 | 0.13 |
ENSDART00000170306
|
AREL1
|
apoptosis resistant E3 ubiquitin protein ligase 1 |
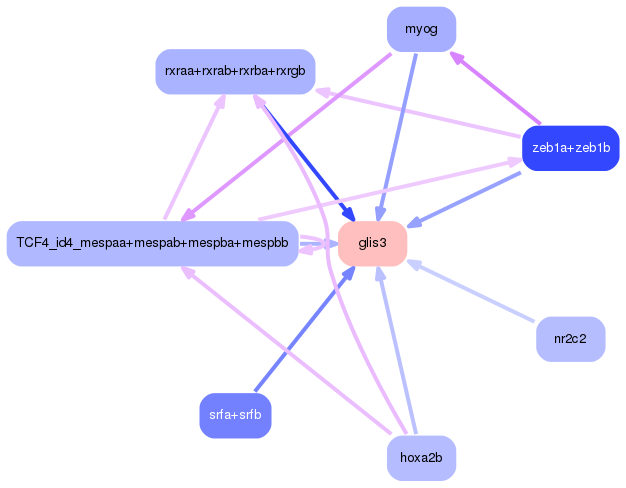
Network of associatons between targets according to the STRING database.

First level regulatory network of glis3
Gene Ontology Analysis
Gene overrepresentation in biological process category:
| Log-likelihood per target | Total log-likelihood | Term | Description |
|---|---|---|---|
| 0.5 | 13.1 | GO:0060291 | long-term synaptic potentiation(GO:0060291) |
| 0.4 | 2.4 | GO:0048011 | neurotrophin TRK receptor signaling pathway(GO:0048011) |
| 0.4 | 5.3 | GO:0001964 | startle response(GO:0001964) |
| 0.2 | 2.7 | GO:0070782 | phosphatidylserine exposure on apoptotic cell surface(GO:0070782) |
| 0.2 | 3.6 | GO:0045773 | positive regulation of axon extension(GO:0045773) |
| 0.1 | 2.9 | GO:0007198 | adenylate cyclase-inhibiting serotonin receptor signaling pathway(GO:0007198) |
| 0.1 | 2.5 | GO:0048251 | elastic fiber assembly(GO:0048251) |
| 0.1 | 0.7 | GO:0098700 | neurotransmitter loading into synaptic vesicle(GO:0098700) |
| 0.1 | 1.9 | GO:0006893 | Golgi to plasma membrane transport(GO:0006893) |
| 0.1 | 2.8 | GO:0018298 | protein-chromophore linkage(GO:0018298) |
| 0.0 | 2.3 | GO:1902668 | negative regulation of axon extension involved in axon guidance(GO:0048843) negative regulation of axon guidance(GO:1902668) |
| 0.0 | 1.2 | GO:0035025 | positive regulation of Rho protein signal transduction(GO:0035025) |
| 0.0 | 5.2 | GO:0007264 | small GTPase mediated signal transduction(GO:0007264) |
Gene overrepresentation in cellular component category:
| Log-likelihood per target | Total log-likelihood | Term | Description |
|---|---|---|---|
| 0.3 | 5.3 | GO:0031209 | SCAR complex(GO:0031209) |
| 0.3 | 4.0 | GO:0005922 | connexon complex(GO:0005922) |
| 0.1 | 1.0 | GO:0008540 | proteasome regulatory particle, base subcomplex(GO:0008540) |
| 0.1 | 1.9 | GO:0000145 | exocyst(GO:0000145) |
| 0.1 | 2.5 | GO:0001750 | photoreceptor outer segment(GO:0001750) |
| 0.1 | 12.3 | GO:0070382 | exocytic vesicle(GO:0070382) |
| 0.0 | 1.9 | GO:0031461 | cullin-RING ubiquitin ligase complex(GO:0031461) |
Gene overrepresentation in molecular function category:
| Log-likelihood per target | Total log-likelihood | Term | Description |
|---|---|---|---|
| 0.8 | 4.0 | GO:0055077 | gap junction hemi-channel activity(GO:0055077) |
| 0.3 | 5.3 | GO:0000340 | RNA 7-methylguanosine cap binding(GO:0000340) |
| 0.2 | 11.6 | GO:0001786 | phosphatidylserine binding(GO:0001786) |
| 0.2 | 3.6 | GO:0048495 | Roundabout binding(GO:0048495) |
| 0.2 | 1.0 | GO:0036402 | proteasome-activating ATPase activity(GO:0036402) |
| 0.1 | 2.9 | GO:0051378 | amine binding(GO:0043176) serotonin binding(GO:0051378) |
| 0.1 | 1.9 | GO:0097602 | cullin family protein binding(GO:0097602) |
| 0.1 | 0.7 | GO:0005326 | neurotransmitter transporter activity(GO:0005326) |
| 0.1 | 2.8 | GO:0008020 | G-protein coupled photoreceptor activity(GO:0008020) |
| 0.0 | 2.3 | GO:0030215 | semaphorin receptor binding(GO:0030215) |
| 0.0 | 5.2 | GO:0005085 | guanyl-nucleotide exchange factor activity(GO:0005085) |
| 0.0 | 0.2 | GO:0050291 | sphingosine N-acyltransferase activity(GO:0050291) |
Gene overrepresentation in curated gene sets: canonical pathways category:
| Log-likelihood per target | Total log-likelihood | Term | Description |
|---|---|---|---|
| 0.1 | 5.3 | PID ECADHERIN STABILIZATION PATHWAY | Stabilization and expansion of the E-cadherin adherens junction |
| 0.1 | 1.9 | PID HIF1A PATHWAY | Hypoxic and oxygen homeostasis regulation of HIF-1-alpha |
| 0.1 | 1.9 | PID ARF6 TRAFFICKING PATHWAY | Arf6 trafficking events |
| 0.1 | 2.4 | PID LKB1 PATHWAY | LKB1 signaling events |
Gene overrepresentation in curated gene sets: REACTOME pathways category:
| Log-likelihood per target | Total log-likelihood | Term | Description |
|---|---|---|---|
| 0.2 | 1.9 | REACTOME PROLACTIN RECEPTOR SIGNALING | Genes involved in Prolactin receptor signaling |
| 0.1 | 2.4 | REACTOME AKT PHOSPHORYLATES TARGETS IN THE CYTOSOL | Genes involved in AKT phosphorylates targets in the cytosol |
| 0.1 | 1.9 | REACTOME INSULIN SYNTHESIS AND PROCESSING | Genes involved in Insulin Synthesis and Processing |