Project
PRJDB7713: Age associated transcriptome analysis in 5 tissues of zebrafish
Navigation
Downloads
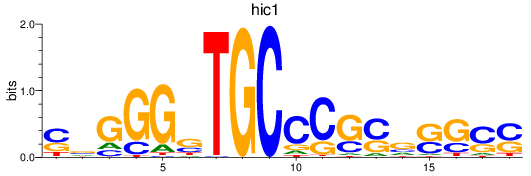
Results for hic1
Z-value: 0.91
Motif logo
Transcription factors associated with hic1
| Gene Symbol | Gene ID | Gene Info |
|---|---|---|
|
hic1
|
ENSDARG00000055493 | hypermethylated in cancer 1 |
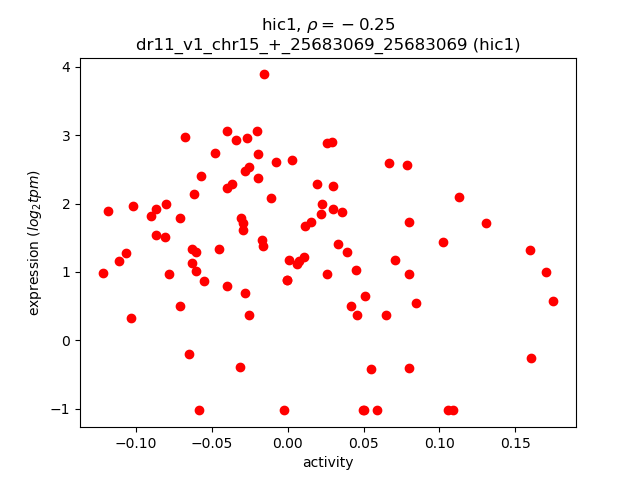
Activity-expression correlation:
| Gene | Promoter | Pearson corr. coef. | P-value | Plot |
|---|---|---|---|---|
| hic1 | dr11_v1_chr15_+_25683069_25683069 | -0.25 | 1.6e-02 | Click! |
Activity profile of hic1 motif
Sorted Z-values of hic1 motif
| Promoter | Log-likelihood | Transcript | Gene | Gene Info |
|---|---|---|---|---|
| chr4_-_55728559 | 13.15 |
ENSDART00000186201
|
CT583728.14
|
|
| chr4_+_55778679 | 12.42 |
ENSDART00000183009
|
CT583728.19
|
|
| chr4_+_55794876 | 12.42 |
ENSDART00000189043
|
CT583728.17
|
|
| chr4_+_55810436 | 12.42 |
ENSDART00000182875
|
CT583728.16
|
|
| chr4_-_68568233 | 12.42 |
ENSDART00000184284
|
BX548011.1
|
|
| chr4_-_77561679 | 11.62 |
ENSDART00000180809
|
AL935186.9
|
|
| chr14_-_21064199 | 10.64 |
ENSDART00000172099
|
si:dkey-74k8.3
|
si:dkey-74k8.3 |
| chr14_-_21063977 | 9.83 |
ENSDART00000164373
|
si:dkey-74k8.3
|
si:dkey-74k8.3 |
| chr6_+_28203 | 9.76 |
ENSDART00000191561
|
CZQB01141835.1
|
|
| chr4_-_77557279 | 8.63 |
ENSDART00000180113
|
AL935186.10
|
|
| chr14_+_52369262 | 7.04 |
ENSDART00000169352
ENSDART00000157833 |
igfbp7
|
insulin-like growth factor binding protein 7 |
| chr21_-_45878872 | 6.48 |
ENSDART00000029763
|
sap30l
|
sap30-like |
| chr17_+_132555 | 6.34 |
ENSDART00000158159
|
zgc:77287
|
zgc:77287 |
| chr1_+_135903 | 5.73 |
ENSDART00000124837
|
f10
|
coagulation factor X |
| chr8_+_54137350 | 4.56 |
ENSDART00000164153
|
brpf1
|
bromodomain and PHD finger containing, 1 |
| chr10_+_23088 | 4.27 |
ENSDART00000022840
|
riox2
|
ribosomal oxygenase 2 |
| chr4_+_90048 | 3.75 |
ENSDART00000166440
|
lrp6
|
low density lipoprotein receptor-related protein 6 |
| chr23_+_14590767 | 3.61 |
ENSDART00000143675
|
si:rp71-79p20.2
|
si:rp71-79p20.2 |
| chr12_-_54375 | 3.47 |
ENSDART00000152304
|
si:ch1073-357b18.4
|
si:ch1073-357b18.4 |
| chr10_-_2682198 | 3.21 |
ENSDART00000183727
|
pdxp
|
pyridoxal (pyridoxine, vitamin B6) phosphatase |
| chr9_-_1990323 | 2.66 |
ENSDART00000082332
|
hoxd13a
|
homeobox D13a |
| chr10_-_9192450 | 2.36 |
ENSDART00000139783
|
si:dkeyp-41f9.4
|
si:dkeyp-41f9.4 |
| chr7_-_61845282 | 2.17 |
ENSDART00000182586
|
HTRA3
|
HtrA serine peptidase 3 |
| chr23_-_31060350 | 2.17 |
ENSDART00000145598
ENSDART00000191491 |
si:ch211-197l9.5
|
si:ch211-197l9.5 |
| chr17_-_8976307 | 2.16 |
ENSDART00000092113
|
zranb1b
|
zinc finger, RAN-binding domain containing 1b |
| chr23_+_45611980 | 2.15 |
ENSDART00000181582
|
dclk2b
|
doublecortin-like kinase 2b |
| chr5_-_52784152 | 2.12 |
ENSDART00000169307
|
fam189a2
|
family with sequence similarity 189, member A2 |
| chr15_-_20916251 | 2.00 |
ENSDART00000134053
|
usp2a
|
ubiquitin specific peptidase 2a |
| chr14_-_48588422 | 1.97 |
ENSDART00000161147
|
si:ch211-154c21.1
|
si:ch211-154c21.1 |
| chr4_-_797831 | 1.92 |
ENSDART00000158970
ENSDART00000170012 |
mapre3b
|
microtubule-associated protein, RP/EB family, member 3b |
| chr9_-_849069 | 1.71 |
ENSDART00000136091
|
c1ql2
|
complement component 1, q subcomponent-like 2 |
| chr12_-_979789 | 1.35 |
ENSDART00000128188
|
daglb
|
diacylglycerol lipase, beta |
| chr19_-_38830582 | 1.35 |
ENSDART00000189966
ENSDART00000183055 |
adgrb2
|
adhesion G protein-coupled receptor B2 |
| chr5_+_62723233 | 1.33 |
ENSDART00000183718
|
nanos2
|
nanos homolog 2 |
| chr11_-_6420917 | 1.33 |
ENSDART00000193717
|
FO681393.2
|
|
| chr3_-_61592417 | 1.15 |
ENSDART00000155082
|
nptx2a
|
neuronal pentraxin 2a |
| chr19_+_17642356 | 1.01 |
ENSDART00000176431
|
CR382334.1
|
|
| chr9_-_14992730 | 0.97 |
ENSDART00000137117
|
pard3bb
|
par-3 family cell polarity regulator beta b |
| chr17_-_49412313 | 0.92 |
ENSDART00000152100
|
mthfd1b
|
methylenetetrahydrofolate dehydrogenase (NADP+ dependent) 1b |
| chr9_+_7358749 | 0.89 |
ENSDART00000081660
|
ihha
|
Indian hedgehog homolog a |
| chr14_+_49602 | 0.83 |
ENSDART00000035581
|
OTOP1
|
otopetrin 1 |
| chr2_-_49370042 | 0.83 |
ENSDART00000180515
|
CT583662.1
|
|
| chr7_-_24995631 | 0.82 |
ENSDART00000173955
ENSDART00000173791 |
rcor2
|
REST corepressor 2 |
| chr19_-_22488952 | 0.78 |
ENSDART00000179856
ENSDART00000141503 |
pleca
|
plectin a |
| chr23_+_45611649 | 0.77 |
ENSDART00000169521
|
dclk2b
|
doublecortin-like kinase 2b |
| chr8_-_13678415 | 0.67 |
ENSDART00000134153
ENSDART00000143331 |
si:dkey-258f14.3
|
si:dkey-258f14.3 |
| chr16_+_41067586 | 0.61 |
ENSDART00000181876
|
scap
|
SREBF chaperone |
| chr3_-_56896702 | 0.58 |
ENSDART00000023265
|
ush1ga
|
Usher syndrome 1Ga (autosomal recessive) |
| chr15_-_18138607 | 0.40 |
ENSDART00000176690
|
CR385077.1
|
|
| chr8_+_35172594 | 0.36 |
ENSDART00000177146
|
BX897670.1
|
|
| chr1_-_59571758 | 0.35 |
ENSDART00000193546
ENSDART00000167087 |
wfikkn1
|
WAP, follistatin/kazal, immunoglobulin, kunitz and netrin domain containing 1 |
| chr22_-_18116635 | 0.16 |
ENSDART00000005724
|
ncanb
|
neurocan b |
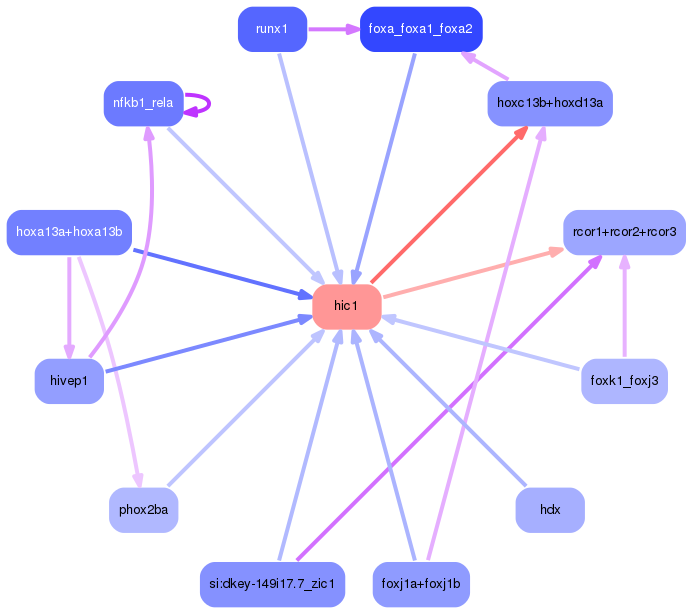
Network of associatons between targets according to the STRING database.

First level regulatory network of hic1
Gene Ontology Analysis
Gene overrepresentation in biological process category:
| Log-likelihood per target | Total log-likelihood | Term | Description |
|---|---|---|---|
| 4.1 | 20.5 | GO:0010332 | response to gamma radiation(GO:0010332) cellular response to gamma radiation(GO:0071480) |
| 0.9 | 4.3 | GO:0070544 | histone H3-K36 demethylation(GO:0070544) |
| 0.8 | 3.2 | GO:0006114 | glycerol biosynthetic process(GO:0006114) alditol biosynthetic process(GO:0019401) |
| 0.4 | 2.2 | GO:0071947 | protein deubiquitination involved in ubiquitin-dependent protein catabolic process(GO:0071947) |
| 0.3 | 1.3 | GO:0098921 | endocannabinoid signaling pathway(GO:0071926) retrograde trans-synaptic signaling by lipid(GO:0098920) retrograde trans-synaptic signaling by endocannabinoid(GO:0098921) |
| 0.3 | 4.6 | GO:0044154 | histone H3-K14 acetylation(GO:0044154) |
| 0.2 | 1.0 | GO:0051660 | establishment of centrosome localization(GO:0051660) |
| 0.2 | 7.0 | GO:0001569 | patterning of blood vessels(GO:0001569) |
| 0.2 | 1.9 | GO:1904825 | protein localization to microtubule(GO:0035372) protein localization to microtubule plus-end(GO:1904825) |
| 0.1 | 0.9 | GO:0048795 | swim bladder morphogenesis(GO:0048795) |
| 0.1 | 3.8 | GO:0044332 | Wnt signaling pathway involved in dorsal/ventral axis specification(GO:0044332) |
| 0.1 | 5.7 | GO:0007596 | blood coagulation(GO:0007596) |
| 0.1 | 0.6 | GO:0050957 | equilibrioception(GO:0050957) |
| 0.1 | 2.4 | GO:0014003 | oligodendrocyte development(GO:0014003) |
| 0.1 | 0.9 | GO:0035999 | tetrahydrofolate interconversion(GO:0035999) |
| 0.0 | 0.6 | GO:0032933 | response to sterol depletion(GO:0006991) SREBP signaling pathway(GO:0032933) cellular response to sterol depletion(GO:0071501) |
| 0.0 | 0.8 | GO:0031581 | hemidesmosome assembly(GO:0031581) |
| 0.0 | 6.5 | GO:0001947 | heart looping(GO:0001947) |
| 0.0 | 1.3 | GO:0016525 | negative regulation of angiogenesis(GO:0016525) |
| 0.0 | 1.2 | GO:0051966 | regulation of synaptic transmission, glutamatergic(GO:0051966) |
| 0.0 | 1.3 | GO:0048477 | oogenesis(GO:0048477) |
| 0.0 | 2.0 | GO:0016579 | protein deubiquitination(GO:0016579) |
| 0.0 | 0.8 | GO:0016575 | histone deacetylation(GO:0016575) |
Gene overrepresentation in cellular component category:
| Log-likelihood per target | Total log-likelihood | Term | Description |
|---|---|---|---|
| 0.3 | 4.6 | GO:0070776 | H3 histone acetyltransferase complex(GO:0070775) MOZ/MORF histone acetyltransferase complex(GO:0070776) |
| 0.1 | 7.3 | GO:0000118 | histone deacetylase complex(GO:0000118) |
| 0.1 | 1.9 | GO:0035371 | microtubule plus-end(GO:0035371) |
| 0.1 | 0.8 | GO:0030056 | hemidesmosome(GO:0030056) |
| 0.0 | 0.6 | GO:0012507 | ER to Golgi transport vesicle membrane(GO:0012507) |
| 0.0 | 4.3 | GO:0005730 | nucleolus(GO:0005730) |
Gene overrepresentation in molecular function category:
| Log-likelihood per target | Total log-likelihood | Term | Description |
|---|---|---|---|
| 0.8 | 6.5 | GO:0010314 | phosphatidylinositol-5-phosphate binding(GO:0010314) |
| 0.3 | 4.6 | GO:0043994 | H3 histone acetyltransferase activity(GO:0010484) histone acetyltransferase activity (H3-K23 specific)(GO:0043994) |
| 0.3 | 4.3 | GO:0051864 | histone demethylase activity (H3-K36 specific)(GO:0051864) |
| 0.2 | 7.0 | GO:0005520 | insulin-like growth factor binding(GO:0005520) |
| 0.2 | 3.8 | GO:0042813 | Wnt-activated receptor activity(GO:0042813) |
| 0.1 | 2.2 | GO:0070530 | K63-linked polyubiquitin binding(GO:0070530) |
| 0.1 | 0.9 | GO:0004329 | formate-tetrahydrofolate ligase activity(GO:0004329) |
| 0.1 | 0.9 | GO:0005113 | patched binding(GO:0005113) |
| 0.1 | 0.8 | GO:0030506 | ankyrin binding(GO:0030506) |
| 0.1 | 1.9 | GO:0051010 | microtubule plus-end binding(GO:0051010) |
| 0.0 | 0.4 | GO:0008191 | metalloendopeptidase inhibitor activity(GO:0008191) |
| 0.0 | 5.7 | GO:0004252 | serine-type endopeptidase activity(GO:0004252) |
| 0.0 | 2.0 | GO:0101005 | thiol-dependent ubiquitin-specific protease activity(GO:0004843) thiol-dependent ubiquitinyl hydrolase activity(GO:0036459) ubiquitinyl hydrolase activity(GO:0101005) |
Gene overrepresentation in curated gene sets: canonical pathways category:
| Log-likelihood per target | Total log-likelihood | Term | Description |
|---|---|---|---|
| 0.3 | 5.7 | PID INTEGRIN2 PATHWAY | Beta2 integrin cell surface interactions |
| 0.2 | 3.8 | PID WNT CANONICAL PATHWAY | Canonical Wnt signaling pathway |
| 0.0 | 7.0 | NABA ECM GLYCOPROTEINS | Genes encoding structural ECM glycoproteins |
| 0.0 | 1.3 | PID NCADHERIN PATHWAY | N-cadherin signaling events |
| 0.0 | 0.6 | SA CASPASE CASCADE | Apoptosis is mediated by caspases, cysteine proteases arranged in a proteolytic cascade. |
| 0.0 | 1.7 | NABA ECM AFFILIATED | Genes encoding proteins affiliated structurally or functionally to extracellular matrix proteins |
| 0.0 | 2.2 | NABA ECM REGULATORS | Genes encoding enzymes and their regulators involved in the remodeling of the extracellular matrix |
Gene overrepresentation in curated gene sets: REACTOME pathways category:
| Log-likelihood per target | Total log-likelihood | Term | Description |
|---|---|---|---|
| 0.6 | 5.7 | REACTOME GAMMA CARBOXYLATION TRANSPORT AND AMINO TERMINAL CLEAVAGE OF PROTEINS | Genes involved in Gamma-carboxylation, transport, and amino-terminal cleavage of proteins |
| 0.0 | 1.3 | REACTOME EFFECTS OF PIP2 HYDROLYSIS | Genes involved in Effects of PIP2 hydrolysis |