Project
PRJDB7713: Age associated transcriptome analysis in 5 tissues of zebrafish
Navigation
Downloads
Results for thrb
Z-value: 0.42
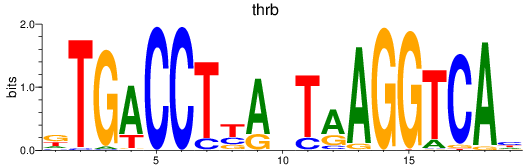
Motif logo
Transcription factors associated with thrb
| Gene Symbol | Gene ID | Gene Info |
|---|---|---|
|
thrb
|
ENSDARG00000021163 | thyroid hormone receptor beta |
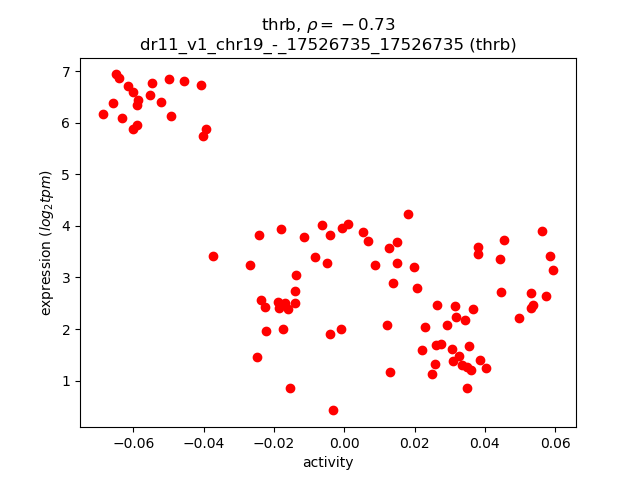
Activity-expression correlation:
| Gene | Promoter | Pearson corr. coef. | P-value | Plot |
|---|---|---|---|---|
| thrb | dr11_v1_chr19_-_17526735_17526735 | -0.73 | 7.0e-17 | Click! |
Activity profile of thrb motif
Sorted Z-values of thrb motif
| Promoter | Log-likelihood | Transcript | Gene | Gene Info |
|---|---|---|---|---|
| chr22_-_2886937 | 7.49 |
ENSDART00000063533
|
aqp12
|
aquaporin 12 |
| chr5_+_28857969 | 6.52 |
ENSDART00000149850
|
si:ch211-186e20.2
|
si:ch211-186e20.2 |
| chr13_-_22862133 | 6.34 |
ENSDART00000138563
|
pbld2
|
phenazine biosynthesis-like protein domain containing 2 |
| chr5_+_28797771 | 4.75 |
ENSDART00000188845
ENSDART00000149066 |
si:ch211-186e20.7
|
si:ch211-186e20.7 |
| chr15_-_23645810 | 4.59 |
ENSDART00000168845
|
ckmb
|
creatine kinase, muscle b |
| chr15_+_5088210 | 3.70 |
ENSDART00000183423
|
mxf
|
myxovirus (influenza virus) resistance F |
| chr20_-_35750810 | 3.01 |
ENSDART00000153072
|
adgrf8
|
adhesion G protein-coupled receptor F8 |
| chr15_-_34878388 | 2.70 |
ENSDART00000154094
|
mgat1a
|
mannosyl (alpha-1,3-)-glycoprotein beta-1,2-N-acetylglucosaminyltransferase a |
| chr6_+_60112200 | 2.68 |
ENSDART00000008243
|
prelid3b
|
PRELI domain containing 3 |
| chr3_+_34846201 | 1.90 |
ENSDART00000055263
|
itga3a
|
integrin, alpha 3a |
| chr5_+_38673168 | 1.28 |
ENSDART00000135267
|
si:dkey-58f10.12
|
si:dkey-58f10.12 |
| chr13_+_33462232 | 1.18 |
ENSDART00000177841
|
zgc:136302
|
zgc:136302 |
| chr2_+_19163965 | 0.94 |
ENSDART00000166073
|
elovl1a
|
ELOVL fatty acid elongase 1a |
| chr15_-_34408777 | 0.81 |
ENSDART00000139934
|
agmo
|
alkylglycerol monooxygenase |
| chr7_-_8156169 | 0.80 |
ENSDART00000182960
ENSDART00000190184 ENSDART00000190885 ENSDART00000189867 ENSDART00000160836 |
si:cabz01030277.1
si:ch211-163c2.3
|
si:cabz01030277.1 si:ch211-163c2.3 |
| chr2_+_10766744 | 0.74 |
ENSDART00000015379
|
gfi1aa
|
growth factor independent 1A transcription repressor a |
| chr4_-_64142389 | 0.67 |
ENSDART00000172126
|
BX914205.3
|
|
| chr4_-_64141714 | 0.61 |
ENSDART00000128628
|
BX914205.3
|
|
| chr22_-_6219092 | 0.61 |
ENSDART00000150040
|
si:ch211-274k16.2
|
si:ch211-274k16.2 |
| chr6_-_29537219 | 0.44 |
ENSDART00000180262
|
pex5la
|
peroxisomal biogenesis factor 5-like a |
| chr7_-_8014186 | 0.16 |
ENSDART00000190012
|
si:cabz01030277.1
|
si:cabz01030277.1 |
| chr6_-_51556308 | 0.10 |
ENSDART00000149033
|
rbl1
|
retinoblastoma-like 1 (p107) |
| chr19_-_32804535 | 0.09 |
ENSDART00000175613
ENSDART00000052098 |
nt5c1aa
|
5'-nucleotidase, cytosolic IAa |
| chr2_-_5199431 | 0.05 |
ENSDART00000063384
|
phb2a
|
prohibitin 2a |
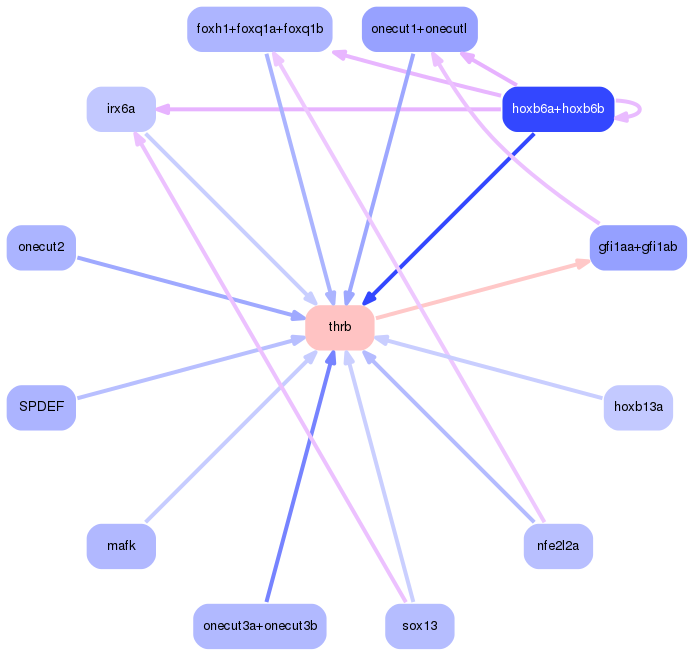
Network of associatons between targets according to the STRING database.

First level regulatory network of thrb
Gene Ontology Analysis
Gene overrepresentation in biological process category:
| Log-likelihood per target | Total log-likelihood | Term | Description |
|---|---|---|---|
| 0.4 | 4.6 | GO:0046314 | phosphagen metabolic process(GO:0006599) phosphocreatine metabolic process(GO:0006603) phosphagen biosynthetic process(GO:0042396) phosphocreatine biosynthetic process(GO:0046314) |
| 0.2 | 3.7 | GO:0098884 | postsynaptic neurotransmitter receptor internalization(GO:0098884) |
| 0.2 | 0.8 | GO:0046485 | ether lipid metabolic process(GO:0046485) |
| 0.1 | 7.5 | GO:0071391 | cellular response to estrogen stimulus(GO:0071391) |
| 0.1 | 11.3 | GO:0010951 | negative regulation of endopeptidase activity(GO:0010951) |
| 0.1 | 1.0 | GO:0070212 | protein poly-ADP-ribosylation(GO:0070212) |
| 0.0 | 0.9 | GO:0019368 | fatty acid elongation, saturated fatty acid(GO:0019367) fatty acid elongation, unsaturated fatty acid(GO:0019368) fatty acid elongation, monounsaturated fatty acid(GO:0034625) fatty acid elongation, polyunsaturated fatty acid(GO:0034626) |
| 0.0 | 0.4 | GO:0016560 | protein import into peroxisome matrix, docking(GO:0016560) protein to membrane docking(GO:0022615) |
| 0.0 | 2.7 | GO:0015914 | phospholipid transport(GO:0015914) |
| 0.0 | 2.7 | GO:0006487 | protein N-linked glycosylation(GO:0006487) |
| 0.0 | 0.7 | GO:0060319 | primitive erythrocyte differentiation(GO:0060319) |
| 0.0 | 1.9 | GO:0007229 | integrin-mediated signaling pathway(GO:0007229) |
Gene overrepresentation in cellular component category:
| Log-likelihood per target | Total log-likelihood | Term | Description |
|---|---|---|---|
| 0.2 | 3.7 | GO:0098844 | postsynaptic endocytic zone membrane(GO:0098844) |
| 0.1 | 2.7 | GO:0005758 | mitochondrial intermembrane space(GO:0005758) organelle envelope lumen(GO:0031970) |
| 0.0 | 1.9 | GO:0008305 | integrin complex(GO:0008305) |
| 0.0 | 15.9 | GO:0005615 | extracellular space(GO:0005615) |
| 0.0 | 0.4 | GO:0031903 | peroxisomal membrane(GO:0005778) microbody membrane(GO:0031903) |
Gene overrepresentation in molecular function category:
| Log-likelihood per target | Total log-likelihood | Term | Description |
|---|---|---|---|
| 0.7 | 2.7 | GO:0003827 | alpha-1,3-mannosylglycoprotein 2-beta-N-acetylglucosaminyltransferase activity(GO:0003827) |
| 0.4 | 2.7 | GO:1990050 | phosphatidic acid transporter activity(GO:1990050) |
| 0.4 | 4.6 | GO:0004111 | creatine kinase activity(GO:0004111) phosphotransferase activity, nitrogenous group as acceptor(GO:0016775) |
| 0.1 | 11.3 | GO:0004867 | serine-type endopeptidase inhibitor activity(GO:0004867) |
| 0.1 | 0.8 | GO:0016714 | oxidoreductase activity, acting on paired donors, with incorporation or reduction of molecular oxygen, reduced pteridine as one donor, and incorporation of one atom of oxygen(GO:0016714) |
| 0.1 | 1.0 | GO:1990404 | protein ADP-ribosylase activity(GO:1990404) |
| 0.1 | 0.4 | GO:0005052 | peroxisome matrix targeting signal-1 binding(GO:0005052) |
| 0.0 | 0.9 | GO:0102338 | fatty acid elongase activity(GO:0009922) 3-oxo-arachidoyl-CoA synthase activity(GO:0102336) 3-oxo-cerotoyl-CoA synthase activity(GO:0102337) 3-oxo-lignoceronyl-CoA synthase activity(GO:0102338) |
| 0.0 | 6.3 | GO:0016853 | isomerase activity(GO:0016853) |
| 0.0 | 7.5 | GO:0015267 | channel activity(GO:0015267) passive transmembrane transporter activity(GO:0022803) |