Project
GSE49485: Hypoxia transcriptome sequencing of rat brain.
Navigation
Downloads
Results for Cbfb
Z-value: 0.18
Motif logo
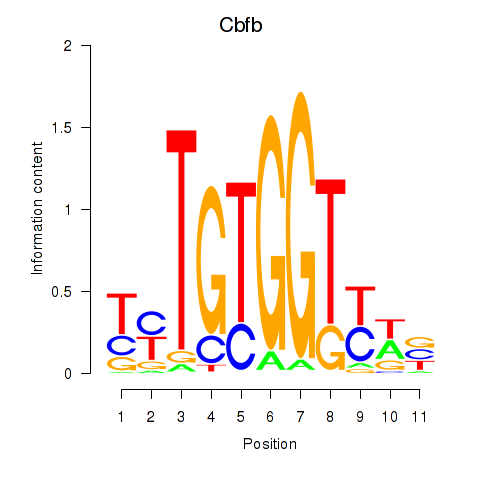
Transcription factors associated with Cbfb
| Gene Symbol | Gene ID | Gene Info |
|---|---|---|
|
Cbfb
|
ENSRNOG00000014647 | core-binding factor, beta subunit |
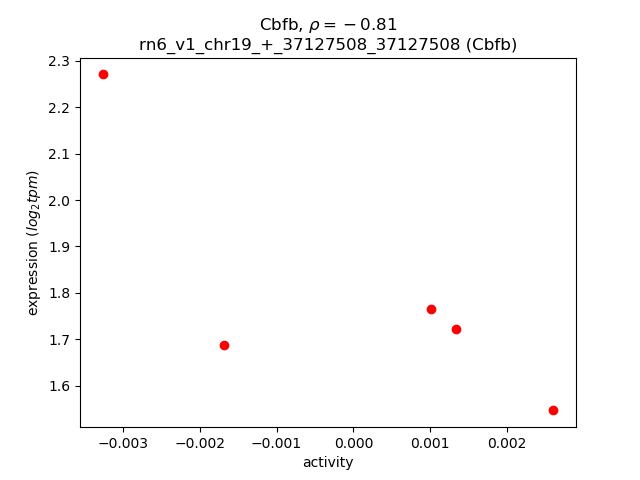
Activity-expression correlation:
| Gene | Promoter | Pearson corr. coef. | P-value | Plot |
|---|---|---|---|---|
| Cbfb | rn6_v1_chr19_+_37127508_37127508 | -0.81 | 9.8e-02 | Click! |
Activity profile of Cbfb motif
Sorted Z-values of Cbfb motif
| Promoter | Log-likelihood | Transcript | Gene | Gene Info |
|---|---|---|---|---|
| chr10_-_70871066 | 0.11 |
ENSRNOT00000015139
|
Ccl3
|
C-C motif chemokine ligand 3 |
| chr2_+_206342066 | 0.06 |
ENSRNOT00000026556
|
Ptpn22
|
protein tyrosine phosphatase, non-receptor type 22 |
| chr14_-_6679878 | 0.06 |
ENSRNOT00000075989
ENSRNOT00000067875 |
Spp1
|
secreted phosphoprotein 1 |
| chr20_-_29738506 | 0.05 |
ENSRNOT00000000697
|
Chst3
|
carbohydrate sulfotransferase 3 |
| chr4_-_7342410 | 0.04 |
ENSRNOT00000013058
|
Nos3
|
nitric oxide synthase 3 |
| chr3_+_11756384 | 0.03 |
ENSRNOT00000087762
|
Sh2d3c
|
SH2 domain containing 3C |
| chr18_+_29191731 | 0.02 |
ENSRNOT00000068085
ENSRNOT00000025495 |
Cystm1
|
cysteine-rich transmembrane module containing 1 |
| chr1_+_221424383 | 0.02 |
ENSRNOT00000028482
|
Znhit2
|
zinc finger, HIT-type containing 2 |
| chr2_-_88553086 | 0.02 |
ENSRNOT00000042494
|
LOC361914
|
similar to solute carrier family 7 (cationic amino acid transporter, y+ system), member 12 |
| chr1_+_185863043 | 0.02 |
ENSRNOT00000079072
|
Sox6
|
SRY box 6 |
| chr18_+_17550350 | 0.01 |
ENSRNOT00000078870
|
RGD1562608
|
similar to KIAA1328 protein |
| chr12_+_9360672 | 0.01 |
ENSRNOT00000088957
|
Flt3
|
fms-related tyrosine kinase 3 |
| chr2_-_88763733 | 0.01 |
ENSRNOT00000059424
|
LOC688389
|
similar to solute carrier family 7 (cationic amino acid transporter, y+ system), member 12 |
| chr19_+_25239674 | 0.01 |
ENSRNOT00000037453
|
Podnl1
|
podocan-like 1 |
| chr3_+_170399302 | 0.00 |
ENSRNOT00000035245
|
Cass4
|
Cas scaffolding protein family member 4 |
| chr13_-_92988137 | 0.00 |
ENSRNOT00000004803
|
Grem2
|
gremlin 2, DAN family BMP antagonist |
| chr4_-_176922424 | 0.00 |
ENSRNOT00000055540
|
Abcc9
|
ATP binding cassette subfamily C member 9 |
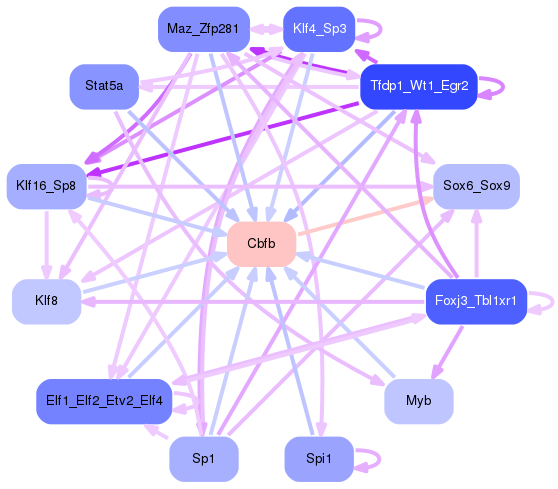
Network of associatons between targets according to the STRING database.

First level regulatory network of Cbfb
Gene Ontology Analysis
Gene overrepresentation in biological process category:
| Log-likelihood per target | Total log-likelihood | Term | Description |
|---|---|---|---|
| 0.0 | 0.1 | GO:2000503 | positive regulation of natural killer cell chemotaxis(GO:2000503) |
| 0.0 | 0.1 | GO:0070433 | positive regulation of toll-like receptor 9 signaling pathway(GO:0034165) negative regulation of nucleotide-binding oligomerization domain containing signaling pathway(GO:0070425) negative regulation of nucleotide-binding oligomerization domain containing 2 signaling pathway(GO:0070433) granzyme B production(GO:0071613) regulation of granzyme B production(GO:0071661) positive regulation of granzyme B production(GO:0071663) |
| 0.0 | 0.1 | GO:0006710 | androgen catabolic process(GO:0006710) |
Gene overrepresentation in molecular function category:
| Log-likelihood per target | Total log-likelihood | Term | Description |
|---|---|---|---|
| 0.0 | 0.1 | GO:0004698 | calcium-dependent protein kinase C activity(GO:0004698) |