Project
GSE53960: rat RNA-Seq transcriptomic Bodymap
Navigation
Downloads
Results for Cebpd
Z-value: 0.58
Motif logo
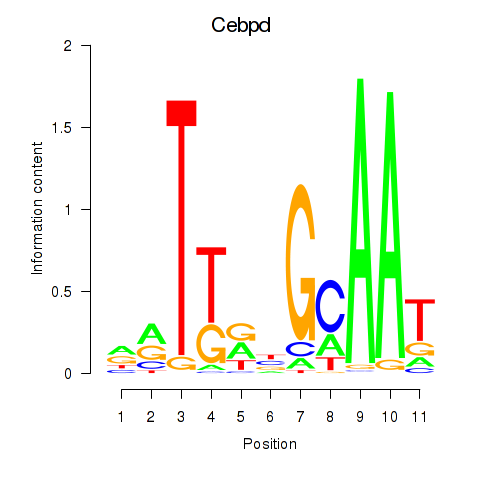
Transcription factors associated with Cebpd
| Gene Symbol | Gene ID | Gene Info |
|---|---|---|
|
Cebpd
|
ENSRNOG00000050869 | CCAAT/enhancer binding protein delta |
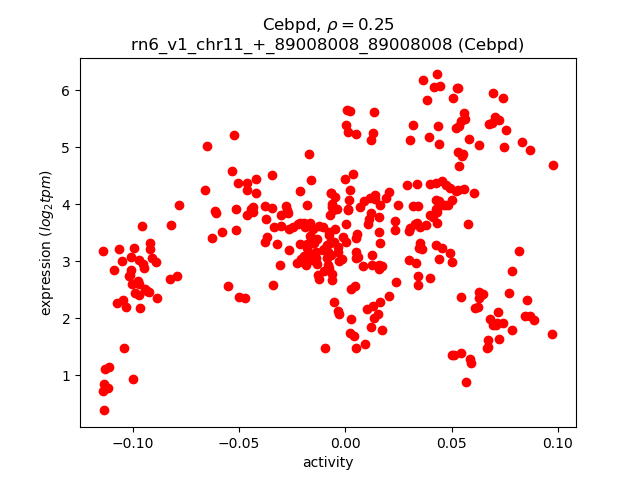
Activity-expression correlation:
| Gene | Promoter | Pearson corr. coef. | P-value | Plot |
|---|---|---|---|---|
| Cebpd | rn6_v1_chr11_+_89008008_89008008 | 0.25 | 6.3e-06 | Click! |
Activity profile of Cebpd motif
Sorted Z-values of Cebpd motif
| Promoter | Log-likelihood | Transcript | Gene | Gene Info |
|---|---|---|---|---|
| chrX_+_33443186 | 29.79 |
ENSRNOT00000005622
|
S100g
|
S100 calcium binding protein G |
| chr9_-_78969013 | 27.77 |
ENSRNOT00000019772
ENSRNOT00000057585 |
Fn1
|
fibronectin 1 |
| chrX_+_143097525 | 22.82 |
ENSRNOT00000004559
|
F9
|
coagulation factor IX |
| chr3_-_121882726 | 21.58 |
ENSRNOT00000006308
|
Il1b
|
interleukin 1 beta |
| chr11_-_81717521 | 20.60 |
ENSRNOT00000058422
|
Ahsg
|
alpha-2-HS-glycoprotein |
| chr10_-_104628676 | 16.78 |
ENSRNOT00000010466
|
Unc13d
|
unc-13 homolog D |
| chr1_+_168964202 | 15.68 |
ENSRNOT00000089102
|
LOC103694855
|
hemoglobin subunit beta-2-like |
| chr1_+_276240703 | 14.96 |
ENSRNOT00000022126
|
Acsl5
|
acyl-CoA synthetase long-chain family member 5 |
| chr9_+_8052210 | 14.11 |
ENSRNOT00000073659
|
Adgre4
|
adhesion G protein-coupled receptor E4 |
| chr4_-_157155609 | 13.87 |
ENSRNOT00000016330
|
C1s
|
complement C1s |
| chr8_-_111721303 | 13.36 |
ENSRNOT00000045628
ENSRNOT00000012725 |
Tf
|
transferrin |
| chr13_-_80775230 | 13.05 |
ENSRNOT00000091389
ENSRNOT00000004762 |
Fmo2
|
flavin containing monooxygenase 2 |
| chr6_-_125723732 | 12.98 |
ENSRNOT00000084815
|
Fbln5
|
fibulin 5 |
| chr10_-_70871066 | 12.97 |
ENSRNOT00000015139
|
Ccl3
|
C-C motif chemokine ligand 3 |
| chr2_-_53313884 | 11.43 |
ENSRNOT00000046951
|
Ghr
|
growth hormone receptor |
| chr9_+_10952374 | 11.36 |
ENSRNOT00000074993
|
Lrg1
|
leucine-rich alpha-2-glycoprotein 1 |
| chr10_-_62254287 | 10.29 |
ENSRNOT00000004313
|
Serpinf1
|
serpin family F member 1 |
| chr1_-_16687817 | 9.19 |
ENSRNOT00000091376
ENSRNOT00000081620 |
Myb
|
MYB proto-oncogene, transcription factor |
| chrX_-_110232179 | 6.20 |
ENSRNOT00000014739
|
Serpina7
|
serpin family A member 7 |
| chr12_-_48238887 | 4.22 |
ENSRNOT00000078868
|
Acacb
|
acetyl-CoA carboxylase beta |
| chr6_-_107678156 | 4.13 |
ENSRNOT00000014158
|
Elmsan1
|
ELM2 and Myb/SANT domain containing 1 |
| chr1_+_85386470 | 3.85 |
ENSRNOT00000093332
ENSRNOT00000044326 |
Plekhg2
|
pleckstrin homology and RhoGEF domain containing G2 |
| chr20_-_32133431 | 3.75 |
ENSRNOT00000000443
|
Srgn
|
serglycin |
| chr12_+_38160464 | 3.72 |
ENSRNOT00000032249
|
Hcar2
|
hydroxycarboxylic acid receptor 2 |
| chr10_-_84920886 | 3.33 |
ENSRNOT00000068083
|
Sp2
|
Sp2 transcription factor |
| chr10_-_59112788 | 2.32 |
ENSRNOT00000041886
|
Spns3
|
SPNS sphingolipid transporter 3 |
| chr2_-_178297172 | 2.28 |
ENSRNOT00000038543
|
Fnip2
|
folliculin interacting protein 2 |
| chr3_-_160573978 | 2.28 |
ENSRNOT00000018386
|
Wfdc5
|
WAP four-disulfide core domain 5 |
| chr1_-_254735548 | 2.09 |
ENSRNOT00000025258
|
Ankrd1
|
ankyrin repeat domain 1 |
| chr7_+_23854846 | 1.53 |
ENSRNOT00000037290
|
Bpifc
|
BPI fold containing family C |
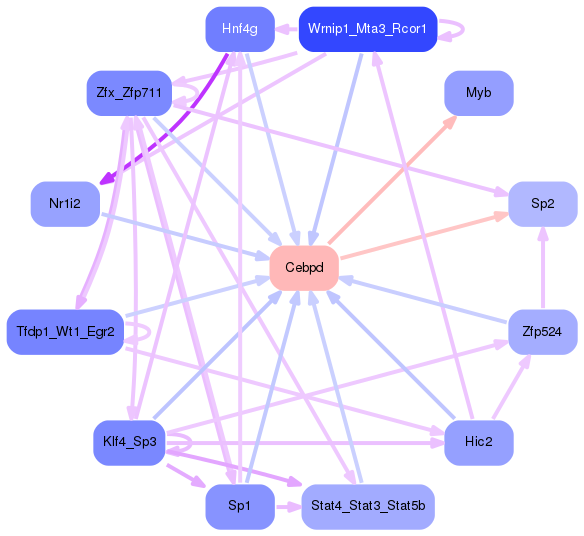
Network of associatons between targets according to the STRING database.

First level regulatory network of Cebpd
Gene Ontology Analysis
Gene overrepresentation in biological process category:
| Log-likelihood per target | Total log-likelihood | Term | Description |
|---|---|---|---|
| 9.3 | 27.8 | GO:2001201 | calcium-independent cell-matrix adhesion(GO:0007161) interaction with other organism via secreted substance involved in symbiotic interaction(GO:0052047) regulation of transforming growth factor-beta secretion(GO:2001201) |
| 7.2 | 21.6 | GO:0060559 | positive regulation of vitamin metabolic process(GO:0046136) positive regulation of vitamin D biosynthetic process(GO:0060557) positive regulation of calcidiol 1-monooxygenase activity(GO:0060559) |
| 5.6 | 16.8 | GO:0002432 | granuloma formation(GO:0002432) |
| 5.0 | 15.0 | GO:0010747 | positive regulation of plasma membrane long-chain fatty acid transport(GO:0010747) |
| 3.3 | 13.4 | GO:0097460 | positive regulation of oligodendrocyte progenitor proliferation(GO:0070447) ferrous iron import into cell(GO:0097460) ferrous iron import across plasma membrane(GO:0098707) |
| 3.3 | 13.1 | GO:0072592 | oxygen metabolic process(GO:0072592) |
| 3.1 | 9.2 | GO:2000845 | positive regulation of testosterone secretion(GO:2000845) |
| 2.2 | 13.0 | GO:2000503 | positive regulation of natural killer cell chemotaxis(GO:2000503) |
| 1.7 | 10.3 | GO:0071279 | cellular response to cobalt ion(GO:0071279) |
| 1.3 | 13.0 | GO:0048251 | elastic fiber assembly(GO:0048251) |
| 1.3 | 11.4 | GO:0006549 | allantoin metabolic process(GO:0000255) isoleucine metabolic process(GO:0006549) creatine metabolic process(GO:0006600) creatinine metabolic process(GO:0046449) |
| 1.3 | 3.8 | GO:0033364 | mast cell secretory granule organization(GO:0033364) |
| 1.1 | 20.6 | GO:0030502 | negative regulation of bone mineralization(GO:0030502) |
| 1.1 | 4.2 | GO:2001295 | malonyl-CoA biosynthetic process(GO:2001295) |
| 1.0 | 15.7 | GO:0015671 | oxygen transport(GO:0015671) |
| 1.0 | 13.9 | GO:0001867 | complement activation, lectin pathway(GO:0001867) |
| 0.6 | 6.2 | GO:0070327 | thyroid hormone transport(GO:0070327) |
| 0.5 | 3.7 | GO:0070163 | adiponectin secretion(GO:0070162) regulation of adiponectin secretion(GO:0070163) |
| 0.4 | 11.4 | GO:1903846 | positive regulation of transforming growth factor beta receptor signaling pathway(GO:0030511) positive regulation of cellular response to transforming growth factor beta stimulus(GO:1903846) |
| 0.2 | 22.8 | GO:0031638 | zymogen activation(GO:0031638) |
| 0.2 | 2.3 | GO:0003376 | sphingosine-1-phosphate signaling pathway(GO:0003376) |
| 0.1 | 2.1 | GO:0043517 | positive regulation of DNA damage response, signal transduction by p53 class mediator(GO:0043517) |
| 0.0 | 3.3 | GO:0048144 | fibroblast proliferation(GO:0048144) |
| 0.0 | 3.9 | GO:0035023 | regulation of Rho protein signal transduction(GO:0035023) |
| 0.0 | 2.3 | GO:0008630 | intrinsic apoptotic signaling pathway in response to DNA damage(GO:0008630) |
Gene overrepresentation in cellular component category:
| Log-likelihood per target | Total log-likelihood | Term | Description |
|---|---|---|---|
| 3.5 | 27.8 | GO:0005577 | fibrinogen complex(GO:0005577) |
| 3.2 | 13.0 | GO:0071953 | elastic fiber(GO:0071953) |
| 2.8 | 16.8 | GO:0033093 | Weibel-Palade body(GO:0033093) |
| 2.3 | 11.4 | GO:0070195 | growth hormone receptor complex(GO:0070195) |
| 2.2 | 13.4 | GO:1990712 | HFE-transferrin receptor complex(GO:1990712) |
| 1.4 | 15.7 | GO:0005833 | hemoglobin complex(GO:0005833) |
| 1.3 | 10.3 | GO:0043203 | axon hillock(GO:0043203) |
| 0.3 | 34.5 | GO:0072562 | blood microparticle(GO:0072562) |
| 0.2 | 21.6 | GO:0005776 | autophagosome(GO:0005776) |
| 0.1 | 3.8 | GO:0042629 | mast cell granule(GO:0042629) |
| 0.1 | 15.0 | GO:0005741 | mitochondrial outer membrane(GO:0005741) |
| 0.1 | 4.1 | GO:0000118 | histone deacetylase complex(GO:0000118) |
| 0.0 | 53.7 | GO:0005615 | extracellular space(GO:0005615) |
| 0.0 | 8.2 | GO:0016323 | basolateral plasma membrane(GO:0016323) |
| 0.0 | 14.1 | GO:0009986 | cell surface(GO:0009986) |
| 0.0 | 2.1 | GO:0031674 | I band(GO:0031674) |
| 0.0 | 2.3 | GO:0005765 | lysosomal membrane(GO:0005765) lytic vacuole membrane(GO:0098852) |
Gene overrepresentation in molecular function category:
| Log-likelihood per target | Total log-likelihood | Term | Description |
|---|---|---|---|
| 5.2 | 20.6 | GO:0030294 | receptor signaling protein tyrosine kinase inhibitor activity(GO:0030294) |
| 5.0 | 29.8 | GO:0005499 | vitamin D binding(GO:0005499) |
| 4.3 | 13.0 | GO:0004698 | calcium-dependent protein kinase C activity(GO:0004698) |
| 4.0 | 27.8 | GO:0045340 | mercury ion binding(GO:0045340) |
| 2.9 | 11.4 | GO:0004903 | growth hormone receptor activity(GO:0004903) |
| 1.8 | 9.2 | GO:0071987 | WD40-repeat domain binding(GO:0071987) |
| 1.7 | 13.4 | GO:1990459 | transferrin receptor binding(GO:1990459) |
| 1.2 | 15.0 | GO:0102391 | decanoate--CoA ligase activity(GO:0102391) |
| 1.1 | 21.6 | GO:0005149 | interleukin-1 receptor binding(GO:0005149) |
| 1.1 | 13.1 | GO:0004499 | N,N-dimethylaniline monooxygenase activity(GO:0004499) |
| 1.1 | 4.2 | GO:0003989 | acetyl-CoA carboxylase activity(GO:0003989) |
| 1.0 | 15.7 | GO:0005344 | oxygen transporter activity(GO:0005344) |
| 0.8 | 6.2 | GO:0015349 | thyroid hormone transmembrane transporter activity(GO:0015349) |
| 0.4 | 2.3 | GO:0046624 | sphingolipid transporter activity(GO:0046624) |
| 0.3 | 2.3 | GO:0042030 | ATPase inhibitor activity(GO:0042030) |
| 0.2 | 11.4 | GO:0005160 | transforming growth factor beta receptor binding(GO:0005160) |
| 0.2 | 3.7 | GO:0001614 | purinergic nucleotide receptor activity(GO:0001614) nucleotide receptor activity(GO:0016502) |
| 0.2 | 36.7 | GO:0004252 | serine-type endopeptidase activity(GO:0004252) |
| 0.1 | 2.1 | GO:0031432 | titin binding(GO:0031432) |
| 0.1 | 13.0 | GO:0005178 | integrin binding(GO:0005178) |
| 0.1 | 16.8 | GO:0017137 | Rab GTPase binding(GO:0017137) |
| 0.1 | 8.9 | GO:0004867 | serine-type endopeptidase inhibitor activity(GO:0004867) |
| 0.1 | 3.8 | GO:0005518 | collagen binding(GO:0005518) |
| 0.0 | 3.9 | GO:0005089 | Rho guanyl-nucleotide exchange factor activity(GO:0005089) |
| 0.0 | 3.3 | GO:0042826 | histone deacetylase binding(GO:0042826) |
| 0.0 | 2.3 | GO:0030414 | peptidase inhibitor activity(GO:0030414) |
| 0.0 | 10.9 | GO:0005509 | calcium ion binding(GO:0005509) |
Gene overrepresentation in curated gene sets: canonical pathways category:
| Log-likelihood per target | Total log-likelihood | Term | Description |
|---|---|---|---|
| 1.4 | 21.6 | PID ANTHRAX PATHWAY | Cellular roles of Anthrax toxin |
| 1.3 | 27.8 | PID INTEGRIN5 PATHWAY | Beta5 beta6 beta7 and beta8 integrin cell surface interactions |
| 0.5 | 13.4 | ST WNT CA2 CYCLIC GMP PATHWAY | Wnt/Ca2+/cyclic GMP signaling. |
| 0.4 | 20.6 | PID BMP PATHWAY | BMP receptor signaling |
| 0.3 | 20.6 | PID HES HEY PATHWAY | Notch-mediated HES/HEY network |
| 0.2 | 13.0 | PID IL12 2PATHWAY | IL12-mediated signaling events |
| 0.2 | 36.1 | NABA ECM REGULATORS | Genes encoding enzymes and their regulators involved in the remodeling of the extracellular matrix |
| 0.1 | 24.3 | NABA ECM GLYCOPROTEINS | Genes encoding structural ECM glycoproteins |
| 0.1 | 29.8 | NABA SECRETED FACTORS | Genes encoding secreted soluble factors |
Gene overrepresentation in curated gene sets: REACTOME pathways category:
| Log-likelihood per target | Total log-likelihood | Term | Description |
|---|---|---|---|
| 2.3 | 22.8 | REACTOME GAMMA CARBOXYLATION TRANSPORT AND AMINO TERMINAL CLEAVAGE OF PROTEINS | Genes involved in Gamma-carboxylation, transport, and amino-terminal cleavage of proteins |
| 1.5 | 27.8 | REACTOME P130CAS LINKAGE TO MAPK SIGNALING FOR INTEGRINS | Genes involved in p130Cas linkage to MAPK signaling for integrins |
| 1.3 | 13.9 | REACTOME CREATION OF C4 AND C2 ACTIVATORS | Genes involved in Creation of C4 and C2 activators |
| 0.8 | 15.0 | REACTOME SYNTHESIS OF VERY LONG CHAIN FATTY ACYL COAS | Genes involved in Synthesis of very long-chain fatty acyl-CoAs |
| 0.5 | 11.4 | REACTOME PROLACTIN RECEPTOR SIGNALING | Genes involved in Prolactin receptor signaling |
| 0.5 | 21.6 | REACTOME IL1 SIGNALING | Genes involved in Interleukin-1 signaling |
| 0.5 | 13.4 | REACTOME TRANSFERRIN ENDOCYTOSIS AND RECYCLING | Genes involved in Transferrin endocytosis and recycling |
| 0.3 | 13.0 | REACTOME CHEMOKINE RECEPTORS BIND CHEMOKINES | Genes involved in Chemokine receptors bind chemokines |
| 0.2 | 4.2 | REACTOME ACTIVATED AMPK STIMULATES FATTY ACID OXIDATION IN MUSCLE | Genes involved in Activated AMPK stimulates fatty-acid oxidation in muscle |
| 0.1 | 9.2 | REACTOME FACTORS INVOLVED IN MEGAKARYOCYTE DEVELOPMENT AND PLATELET PRODUCTION | Genes involved in Factors involved in megakaryocyte development and platelet production |
| 0.1 | 3.9 | REACTOME NRAGE SIGNALS DEATH THROUGH JNK | Genes involved in NRAGE signals death through JNK |
| 0.0 | 3.8 | REACTOME RESPONSE TO ELEVATED PLATELET CYTOSOLIC CA2 | Genes involved in Response to elevated platelet cytosolic Ca2+ |
| 0.0 | 3.7 | REACTOME G ALPHA I SIGNALLING EVENTS | Genes involved in G alpha (i) signalling events |
| 0.0 | 2.1 | REACTOME PPARA ACTIVATES GENE EXPRESSION | Genes involved in PPARA Activates Gene Expression |