|
chr17_-_26697224
|
18.557
|
|
VTN
|
vitronectin
|
|
chr17_-_26697310
|
16.880
|
|
VTN
|
vitronectin
|
|
chr1_-_57431620
|
15.620
|
NM_000066
|
C8B
|
complement component 8, beta polypeptide
|
|
chr17_-_26697358
|
13.182
|
NM_000638
|
VTN
|
vitronectin
|
|
chr17_-_26697293
|
12.495
|
|
VTN
|
vitronectin
|
|
chr17_-_64225496
|
11.786
|
NM_000042
|
APOH
|
apolipoprotein H (beta-2-glycoprotein I)
|
|
chr11_-_6462129
|
11.559
|
NM_000613
|
HPX
|
hemopexin
|
|
chr2_-_21225640
|
11.366
|
|
APOB
|
apolipoprotein B (including Ag(x) antigen)
|
|
chr4_-_72671236
|
10.426
|
NM_001204306
|
GC
|
group-specific component (vitamin D binding protein)
|
|
chr1_+_207277577
|
10.354
|
NM_000715
|
C4BPA
|
complement component 4 binding protein, alpha
|
|
chr11_-_116663106
|
10.112
|
NM_001166598
NM_052968
|
APOA5
|
apolipoprotein A-V
|
|
chr4_-_70361578
|
10.050
|
NM_021139
|
UGT2B4
|
UDP glucuronosyltransferase 2 family, polypeptide B4
|
|
chr22_+_21128378
|
9.950
|
NM_000185
|
SERPIND1
|
serpin peptidase inhibitor, clade D (heparin cofactor), member 1
|
|
chr3_+_52811601
|
9.881
|
NM_002215
|
ITIH1
|
inter-alpha-trypsin inhibitor heavy chain 1
|
|
chr2_-_21230572
|
9.608
|
|
APOB
|
apolipoprotein B (including Ag(x) antigen)
|
|
chr10_+_51549552
|
9.580
|
NM_002443
NM_138634
|
MSMB
|
microseminoprotein, beta-
|
|
chr4_+_187148624
|
9.507
|
NM_000892
|
KLKB1
|
kallikrein B, plasma (Fletcher factor) 1
|
|
chr6_+_131148544
|
9.291
|
NM_001195597
|
LOC100507203
|
uncharacterized LOC100507203
|
|
chr10_-_54531394
|
9.241
|
NM_000242
|
MBL2
|
mannose-binding lectin (protein C) 2, soluble
|
|
chr3_-_148939784
|
9.192
|
NM_000096
|
CP
|
ceruloplasmin (ferroxidase)
|
|
chr14_-_94789641
|
9.181
|
NM_001756
|
SERPINA6
|
serpin peptidase inhibitor, clade A (alpha-1 antiproteinase, antitrypsin), member 6
|
|
chr4_-_70080448
|
9.146
|
NM_001073
|
UGT2B11
UGT2B10
|
UDP glucuronosyltransferase 2 family, polypeptide B11
UDP glucuronosyltransferase 2 family, polypeptide B10
|
|
chr2_-_21231406
|
8.934
|
|
APOB
|
apolipoprotein B (including Ag(x) antigen)
|
|
chr4_+_69681709
|
8.894
|
NM_001075
NM_001144767
|
UGT2B10
|
UDP glucuronosyltransferase 2 family, polypeptide B10
|
|
chr12_-_53343607
|
8.814
|
|
KRT8
|
keratin 8
|
|
chr4_+_187187342
|
8.685
|
|
F11
|
coagulation factor XI
|
|
chr2_-_21228189
|
8.503
|
|
APOB
|
apolipoprotein B (including Ag(x) antigen)
|
|
chr12_-_9268440
|
8.502
|
|
A2M
|
alpha-2-macroglobulin
|
|
chr20_-_7921068
|
8.254
|
NM_017545
|
HAO1
|
hydroxyacid oxidase (glycolate oxidase) 1
|
|
chr3_+_186330859
|
8.193
|
|
AHSG
|
alpha-2-HS-glycoprotein
|
|
chr12_-_9268475
|
8.126
|
|
A2M
|
alpha-2-macroglobulin
|
|
chr19_-_41356193
|
8.015
|
NM_000762
|
CYP2A6
|
cytochrome P450, family 2, subfamily A, polypeptide 6
|
|
chr4_+_155484131
|
7.856
|
NM_001184741
NM_005141
|
FGB
|
fibrinogen beta chain
|
|
chr12_-_9268513
|
7.842
|
|
A2M
|
alpha-2-macroglobulin
|
|
chr1_-_20306908
|
7.795
|
NM_000300
NM_001161727
NM_001161728
|
PLA2G2A
|
phospholipase A2, group IIA (platelets, synovial fluid)
|
|
chr2_+_234526290
|
7.794
|
NM_019076
|
UGT1A8
|
UDP glucuronosyltransferase 1 family, polypeptide A8
|
|
chr2_-_21266809
|
7.763
|
|
APOB
|
apolipoprotein B (including Ag(x) antigen)
|
|
chr10_+_7745325
|
7.516
|
|
ITIH2
|
inter-alpha-trypsin inhibitor heavy chain 2
|
|
chr1_-_177939049
|
7.398
|
NM_033127
|
SEC16B
|
SEC16 homolog B (S. cerevisiae)
|
|
chr11_-_10590078
|
7.371
|
NM_006691
|
LYVE1
|
lymphatic vessel endothelial hyaluronan receptor 1
|
|
chr4_+_156824846
|
7.327
|
NM_005651
|
TDO2
|
tryptophan 2,3-dioxygenase
|
|
chr10_+_7745229
|
7.222
|
NM_002216
|
ITIH2
|
inter-alpha-trypsin inhibitor heavy chain 2
|
|
chr3_+_186330844
|
7.210
|
NM_001622
|
AHSG
|
alpha-2-HS-glycoprotein
|
|
chr5_+_132209354
|
7.177
|
NM_052971
|
LEAP2
|
liver expressed antimicrobial peptide 2
|
|
chr19_+_41430123
|
6.934
|
|
CYP2B7P1
|
cytochrome P450, family 2, subfamily B, polypeptide 7 pseudogene 1
|
|
chr4_+_169013687
|
6.887
|
NM_007193
|
ANXA10
|
annexin A10
|
|
chr14_-_70263871
|
6.883
|
NM_003049
|
SLC10A1
|
solute carrier family 10 (sodium/bile acid cotransporter family), member 1
|
|
chr10_+_7745284
|
6.874
|
|
ITIH2
|
inter-alpha-trypsin inhibitor heavy chain 2
|
|
chr10_+_7745341
|
6.812
|
|
ITIH2
|
inter-alpha-trypsin inhibitor heavy chain 2
|
|
chr4_+_74286846
|
6.784
|
|
ALB
|
albumin
|
|
chr4_-_72669757
|
6.646
|
NM_001204307
|
GC
|
group-specific component (vitamin D binding protein)
|
|
chr9_-_112191105
|
6.544
|
NM_001145371
NM_001145372
|
PTPN3
|
protein tyrosine phosphatase, non-receptor type 3
|
|
chr4_+_111397181
|
6.498
|
NM_001977
|
ENPEP
|
glutamyl aminopeptidase (aminopeptidase A)
|
|
chr6_-_25930838
|
6.470
|
NM_005835
|
SLC17A2
|
solute carrier family 17 (sodium phosphate), member 2
|
|
chr19_-_59023323
|
6.451
|
NM_012254
|
SLC27A5
|
solute carrier family 27 (fatty acid transporter), member 5
|
|
chr7_-_50628744
|
6.265
|
NM_000790
NM_001242886
NM_001242887
NM_001242888
NM_001242889
NM_001242890
|
DDC
|
dopa decarboxylase (aromatic L-amino acid decarboxylase)
|
|
chr4_-_152149042
|
6.225
|
NM_001243349
|
SH3D19
|
SH3 domain containing 19
|
|
chr17_+_72427535
|
6.205
|
NM_022036
|
GPRC5C
|
G protein-coupled receptor, family C, group 5, member C
|
|
chr10_+_7745354
|
6.141
|
|
ITIH2
|
inter-alpha-trypsin inhibitor heavy chain 2
|
|
chr17_-_46035109
|
6.099
|
NM_024320
|
PRR15L
|
proline rich 15-like
|
|
chr2_-_21266915
|
6.090
|
NM_000384
|
APOB
|
apolipoprotein B (including Ag(x) antigen)
|
|
chr6_+_31895201
|
6.046
|
NM_000063
NM_001145903
|
C2
|
complement component 2
|
|
chr8_+_120079423
|
5.976
|
NM_006438
|
COLEC10
|
collectin sub-family member 10 (C-type lectin)
|
|
chr12_-_9268522
|
5.911
|
NM_000014
|
A2M
|
alpha-2-macroglobulin
|
|
chr4_+_187187117
|
5.909
|
NM_000128
|
F11
|
coagulation factor XI
|
|
chr10_-_48416692
|
5.899
|
NM_016204
|
GDF2
|
growth differentiation factor 2
|
|
chr1_-_157811491
|
5.882
|
NM_005894
|
CD5L
|
CD5 molecule-like
|
|
chr4_+_39408472
|
5.792
|
NM_175737
|
KLB
|
klotho beta
|
|
chr3_+_108855560
|
5.778
|
|
FLJ22763
|
uncharacterized LOC401081
|
|
chr2_+_234545099
|
5.767
|
NM_019075
|
UGT1A10
|
UDP glucuronosyltransferase 1 family, polypeptide A10
|
|
chr5_+_42756919
|
5.658
|
NM_001134848
|
CCDC152
|
coiled-coil domain containing 152
|
|
chr1_-_161193375
|
5.628
|
NM_001643
|
APOA2
|
apolipoprotein A-II
|
|
chr3_-_120400957
|
5.608
|
|
HGD
|
homogentisate 1,2-dioxygenase
|
|
chr21_-_31588242
|
5.502
|
NM_199328
|
CLDN8
|
claudin 8
|
|
chr10_-_129691202
|
5.480
|
NM_152311
|
CLRN3
|
clarin 3
|
|
chr2_-_216259197
|
5.441
|
|
FN1
|
fibronectin 1
|
|
chr12_-_91572328
|
5.440
|
NM_133504
NM_133505
NM_133506
NM_133507
|
DCN
|
decorin
|
|
chr2_-_169887832
|
5.397
|
NM_003742
|
ABCB11
|
ATP-binding cassette, sub-family B (MDR/TAP), member 11
|
|
chr5_+_42565963
|
5.365
|
NM_001242460
NM_001242461
NM_001242462
|
GHR
|
growth hormone receptor
|
|
chr14_-_38064299
|
5.315
|
|
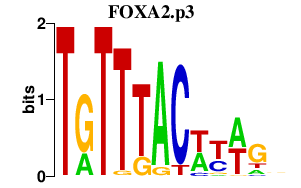
FOXA1
|
forkhead box A1
|
|
chr18_+_29171729
|
5.266
|
NM_000371
|
TTR
|
transthyretin
|
|
chr7_+_134576187
|
5.234
|
|
CALD1
|
caldesmon 1
|
|
chr4_+_39408541
|
5.232
|
|
KLB
|
klotho beta
|
|
chr16_-_86542463
|
5.186
|
|
LOC400550
|
uncharacterized LOC400550
|
|
chr12_-_71551778
|
5.180
|
NM_004616
|
TSPAN8
|
tetraspanin 8
|
|
chr3_-_120401401
|
5.165
|
NM_000187
|
HGD
|
homogentisate 1,2-dioxygenase
|
|
chr8_+_143761873
|
5.139
|
NM_005672
|
PSCA
|
prostate stem cell antigen
|
|
chr3_+_186330711
|
5.063
|
|
AHSG
|
alpha-2-HS-glycoprotein
|
|
chr6_-_46922533
|
5.039
|
NM_015234
|
GPR116
|
G protein-coupled receptor 116
|
|
chr14_-_38064176
|
4.962
|
|
FOXA1
|
forkhead box A1
|
|
chr12_-_71551564
|
4.920
|
|
TSPAN8
|
tetraspanin 8
|
|
chr4_+_22694547
|
4.892
|
NM_001128432
NM_020973
|
GBA3
|
glucosidase, beta, acid 3 (cytosolic)
|
|
chr2_-_165424993
|
4.838
|
|
GRB14
|
growth factor receptor-bound protein 14
|
|
chr2_+_201473942
|
4.822
|
|
AOX1
|
aldehyde oxidase 1
|
|
chr10_-_69597768
|
4.821
|
NM_021800
NM_201262
|
DNAJC12
|
DnaJ (Hsp40) homolog, subfamily C, member 12
|
|
chr11_-_108464344
|
4.759
|
NM_015065
|
EXPH5
|
exophilin 5
|
|
chr12_-_15038724
|
4.711
|
NM_000900
NM_001190839
|
MGP
|
matrix Gla protein
|
|
chr19_+_18496966
|
4.684
|
NM_004864
|
GDF15
|
growth differentiation factor 15
|
|
chr11_+_118398147
|
4.680
|
NM_001080441
|
TTC36
|
tetratricopeptide repeat domain 36
|
|
chr3_+_151488214
|
4.673
|
|
LOC201651
|
arylacetamide deacetylase (esterase) pseudogene
|
|
chr2_+_113885145
|
4.628
|
|
IL1RN
|
interleukin 1 receptor antagonist
|
|
chr2_+_113875469
|
4.517
|
NM_000577
NM_173841
NM_173843
|
IL1RN
|
interleukin 1 receptor antagonist
|
|
chr9_-_116840673
|
4.513
|
NM_001633
|
AMBP
|
alpha-1-microglobulin/bikunin precursor
|
|
chr2_-_188419185
|
4.509
|
NM_001032281
NM_006287
|
TFPI
|
tissue factor pathway inhibitor (lipoprotein-associated coagulation inhibitor)
|
|
chrX_-_15288172
|
4.503
|
NM_001031739
NM_001168530
NM_024087
|
ASB9
|
ankyrin repeat and SOCS box containing 9
|
|
chr12_+_100867550
|
4.441
|
NM_001206977
NM_001206978
NM_001206979
NM_005123
|
NR1H4
|
nuclear receptor subfamily 1, group H, member 4
|
|
chr3_+_174577069
|
4.414
|
NM_207015
|
NAALADL2
|
N-acetylated alpha-linked acidic dipeptidase-like 2
|
|
chr9_-_95244634
|
4.385
|
|
ASPN
|
asporin
|
|
chr4_+_74281884
|
4.381
|
|
ALB
|
albumin
|
|
chr4_-_69886112
|
4.371
|
NM_001075
NM_001144767
|
UGT2B10
|
UDP glucuronosyltransferase 2 family, polypeptide B10
|
|
chr10_+_102732285
|
4.365
|
NM_001203244
NM_017893
|
SEMA4G
|
sema domain, immunoglobulin domain (Ig), transmembrane domain (TM) and short cytoplasmic domain, (semaphorin) 4G
|
|
chr10_+_115310589
|
4.347
|
NM_001177660
|
HABP2
|
hyaluronan binding protein 2
|
|
chr16_+_29789560
|
4.335
|
NM_152338
|
ZG16
|
zymogen granule protein 16 homolog (rat)
|
|
chr2_+_211421322
|
4.326
|
NM_001875
|
CPS1
|
carbamoyl-phosphate synthase 1, mitochondrial
|
|
chr7_+_136553398
|
4.315
|
NM_001006627
NM_001006630
|
CHRM2
|
cholinergic receptor, muscarinic 2
|
|
chrX_-_55020510
|
4.303
|
NM_002625
|
PFKFB1
|
6-phosphofructo-2-kinase/fructose-2,6-biphosphatase 1
|
|
chr2_-_188419049
|
4.289
|
|
TFPI
|
tissue factor pathway inhibitor (lipoprotein-associated coagulation inhibitor)
|
|
chrX_+_135614310
|
4.241
|
NM_016267
|
VGLL1
|
vestigial like 1 (Drosophila)
|
|
chr10_-_129691047
|
4.231
|
|
|
|
|
chr21_-_43735462
|
4.228
|
|
TFF3
|
trefoil factor 3 (intestinal)
|
|
chr1_+_199996729
|
4.177
|
NM_003822
NM_205860
|
NR5A2
|
nuclear receptor subfamily 5, group A, member 2
|
|
chr1_+_81771844
|
4.092
|
|
LPHN2
|
latrophilin 2
|
|
chr10_+_135340865
|
4.086
|
NM_000773
|
CYP2E1
|
cytochrome P450, family 2, subfamily E, polypeptide 1
|
|
chr4_-_69817478
|
4.024
|
NM_024743
|
UGT2A3
|
UDP glucuronosyltransferase 2 family, polypeptide A3
|
|
chr6_-_49712055
|
4.013
|
NM_001190986
NM_006061
|
CRISP3
|
cysteine-rich secretory protein 3
|
|
chr12_+_5603297
|
3.983
|
NM_002527
|
NTF3
|
neurotrophin 3
|
|
chr7_+_134576150
|
3.948
|
NM_033139
NM_033140
|
CALD1
|
caldesmon 1
|
|
chrX_-_106146546
|
3.941
|
NM_001171706
NM_138382
|
RIPPLY1
|
ripply1 homolog (zebrafish)
|
|
chr4_-_185726865
|
3.931
|
|
ACSL1
|
acyl-CoA synthetase long-chain family member 1
|
|
chr1_+_54359859
|
3.929
|
NM_000792
NM_001039715
NM_001039716
NM_213593
|
DIO1
|
deiodinase, iodothyronine, type I
|
|
chr5_-_42811959
|
3.791
|
NM_001085486
NM_001093726
NM_005410
|
SEPP1
|
selenoprotein P, plasma, 1
|
|
chr9_-_34710062
|
3.787
|
NM_002989
|
CCL21
|
chemokine (C-C motif) ligand 21
|
|
chr5_-_13944588
|
3.770
|
NM_001369
|
DNAH5
|
dynein, axonemal, heavy chain 5
|
|
chr11_+_63057371
|
3.747
|
NM_001039752
|
SLC22A10
|
solute carrier family 22, member 10
|
|
chr5_+_42565562
|
3.705
|
NM_001242406
|
GHR
|
growth hormone receptor
|
|
chr2_+_201450579
|
3.705
|
|
AOX1
|
aldehyde oxidase 1
|
|
chr17_-_34308455
|
3.691
|
NM_004590
|
CCL16
|
chemokine (C-C motif) ligand 16
|
|
chr2_+_113885137
|
3.683
|
NM_173842
|
IL1RN
|
interleukin 1 receptor antagonist
|
|
chr6_-_41715078
|
3.661
|
NM_001166424
NM_002630
|
PGC
|
progastricsin (pepsinogen C)
|
|
chr6_+_25754926
|
3.651
|
NM_005495
|
SLC17A4
|
solute carrier family 17 (sodium phosphate), member 4
|
|
chr15_+_96869156
|
3.638
|
NM_001145155
|
NR2F2
|
nuclear receptor subfamily 2, group F, member 2
|
|
chr12_+_121416548
|
3.609
|
NM_000545
|
HNF1A
|
HNF1 homeobox A
|
|
chr10_-_81320141
|
3.600
|
NM_001098668
|
SFTPA1
SFTPA2
|
surfactant protein A1
surfactant protein A2
|
|
chr10_+_101542554
|
3.584
|
|
ABCC2
|
ATP-binding cassette, sub-family C (CFTR/MRP), member 2
|
|
chr10_-_45474210
|
3.543
|
NM_007021
|
C10orf10
|
chromosome 10 open reading frame 10
|
|
chr2_-_88427535
|
3.505
|
NM_001443
|
FABP1
|
fatty acid binding protein 1, liver
|
|
chr4_-_186456580
|
3.493
|
NM_001114107
NM_014476
|
PDLIM3
|
PDZ and LIM domain 3
|
|
chr8_-_86253863
|
3.464
|
NM_001164830
|
CA1
|
carbonic anhydrase I
|
|
chr21_-_43771069
|
3.421
|
NM_005423
|
TFF2
|
trefoil factor 2
|
|
chr12_+_27849427
|
3.403
|
NM_001029874
|
REP15
|
RAB15 effector protein
|
|
chr9_+_74729510
|
3.402
|
NM_001242507
|
GDA
|
guanine deaminase
|
|
chr1_-_169555624
|
3.391
|
|
F5
|
coagulation factor V (proaccelerin, labile factor)
|
|
chr4_+_70146216
|
3.359
|
NM_001207004
NM_053039
|
UGT2B28
|
UDP glucuronosyltransferase 2 family, polypeptide B28
|
|
chr1_-_203320185
|
3.285
|
|
FMOD
|
fibromodulin
|
|
chr4_-_100273831
|
3.272
|
NM_000669
|
ADH1C
|
alcohol dehydrogenase 1C (class I), gamma polypeptide
|
|
chr16_-_87970107
|
3.260
|
NM_001739
|
CA5A
|
carbonic anhydrase VA, mitochondrial
|
|
chr11_-_118134868
|
3.256
|
|
|
|
|
chr3_+_119501556
|
3.247
|
NM_022002
|
NR1I2
|
nuclear receptor subfamily 1, group I, member 2
|
|
chr10_+_81370694
|
3.226
|
NM_001093770
NM_001164644
NM_001164645
NM_001164646
NM_001164647
NM_005411
|
SFTPA1
|
surfactant protein A1
|
|
chr1_-_151345156
|
3.219
|
NM_003944
|
SELENBP1
|
selenium binding protein 1
|
|
chr17_+_9745847
|
3.174
|
|
GLP2R
|
glucagon-like peptide 2 receptor
|
|
chr12_-_103310896
|
3.154
|
|
PAH
|
phenylalanine hydroxylase
|
|
chr4_+_55095433
|
3.133
|
|
PDGFRA
|
platelet-derived growth factor receptor, alpha polypeptide
|
|
chr1_+_200011716
|
3.102
|
|
NR5A2
|
nuclear receptor subfamily 5, group A, member 2
|
|
chr7_-_107443631
|
3.101
|
NM_000111
|
SLC26A3
|
solute carrier family 26, member 3
|
|
chr4_-_186732208
|
3.091
|
NM_001145671
|
SORBS2
|
sorbin and SH3 domain containing 2
|
|
chr17_+_53344966
|
3.060
|
|
HLF
|
hepatic leukemia factor
|
|
chr2_+_234826042
|
3.049
|
NM_024080
|
TRPM8
|
transient receptor potential cation channel, subfamily M, member 8
|
|
chr5_+_68788118
|
3.027
|
NM_002538
|
OCLN
|
occludin
|
|
chr4_-_69536314
|
3.002
|
NM_001076
|
UGT2B15
|
UDP glucuronosyltransferase 2 family, polypeptide B15
|
|
chr3_-_48471401
|
2.994
|
NM_001130082
|
PLXNB1
|
plexin B1
|
|
chr10_+_101542460
|
2.979
|
NM_000392
|
ABCC2
|
ATP-binding cassette, sub-family C (CFTR/MRP), member 2
|
|
chr7_-_81399286
|
2.964
|
NM_000601
NM_001010931
NM_001010932
NM_001010933
NM_001010934
|
HGF
|
hepatocyte growth factor (hepapoietin A; scatter factor)
|
|
chr17_-_7017971
|
2.961
|
|
ASGR2
|
asialoglycoprotein receptor 2
|
|
chr5_-_41213513
|
2.937
|
NM_000065
|
C6
|
complement component 6
|
|
chr4_-_100242487
|
2.876
|
NM_000668
|
ADH1A
ADH1B
|
alcohol dehydrogenase 1A (class I), alpha polypeptide
alcohol dehydrogenase 1B (class I), beta polypeptide
|
|
chr1_-_178840079
|
2.863
|
NM_004673
|
ANGPTL1
|
angiopoietin-like 1
|
|
chr9_-_116840604
|
2.858
|
|
AMBP
|
alpha-1-microglobulin/bikunin precursor
|
|
chr13_-_78493902
|
2.846
|
NM_001201397
|
EDNRB
|
endothelin receptor type B
|
|
chr22_+_41074994
|
2.841
|
NM_005297
|
MCHR1
|
melanin-concentrating hormone receptor 1
|
|
chr18_-_52626636
|
2.777
|
NM_025214
|
CCDC68
|
coiled-coil domain containing 68
|
|
chr8_-_80993009
|
2.777
|
NM_001025252
|
TPD52
|
tumor protein D52
|
|
chr11_+_62186506
|
2.745
|
NM_003357
|
SCGB1A1
|
secretoglobin, family 1A, member 1 (uteroglobin)
|
|
chr11_-_102401430
|
2.721
|
NM_002423
|
MMP7
|
matrix metallopeptidase 7 (matrilysin, uterine)
|
|
chr5_+_145316120
|
2.708
|
NM_152550
|
SH3RF2
|
SH3 domain containing ring finger 2
|
|
chr5_+_147258273
|
2.702
|
NM_054023
|
SCGB3A2
|
secretoglobin, family 3A, member 2
|
|
chr10_+_123923104
|
2.693
|
NM_006997
NM_206860
|
TACC2
|
transforming, acidic coiled-coil containing protein 2
|
|
chr11_+_22696318
|
2.683
|
NM_005256
|
GAS2
|
growth arrest-specific 2
|
|
chr12_-_120765555
|
2.674
|
NM_000928
|
PLA2G1B
|
phospholipase A2, group IB (pancreas)
|
|
chr9_+_136287119
|
2.666
|
NM_139025
NM_139026
NM_139027
|
ADAMTS13
|
ADAM metallopeptidase with thrombospondin type 1 motif, 13
|
|
chr14_-_21567069
|
2.635
|
NM_001101672
|
ZNF219
|
zinc finger protein 219
|
|
chr6_+_161123224
|
2.624
|
NM_000301
NM_001168338
|
PLG
|
plasminogen
|
|
chr2_+_88047603
|
2.618
|
NM_002665
NM_001032392
|
PLGLB2
PLGLB1
|
plasminogen-like B2
plasminogen-like B1
|
|
chr2_-_21266893
|
2.617
|
|
APOB
|
apolipoprotein B (including Ag(x) antigen)
|
|
chr22_-_37505602
|
2.613
|
|
TMPRSS6
|
transmembrane protease, serine 6
|
|
chr4_+_71062241
|
2.600
|
NM_017855
|
ODAM
|
odontogenic, ameloblast asssociated
|
|
chr1_-_57285368
|
2.583
|
NM_001004303
|
C1orf168
|
chromosome 1 open reading frame 168
|
|
chrX_+_138612894
|
2.581
|
NM_000133
|
F9
|
coagulation factor IX
|
|
chr4_+_37585854
|
2.577
|
NM_018302
|
C4orf19
|
chromosome 4 open reading frame 19
|
|
chr12_-_71031174
|
2.574
|
NM_001109754
|
PTPRB
|
protein tyrosine phosphatase, receptor type, B
|