|
chr11_-_116708334
|
8.393
|
NM_000039
|
APOA1
|
apolipoprotein A-I
|
|
chr10_-_99531712
|
7.782
|
NM_003015
|
SFRP5
|
secreted frizzled-related protein 5
|
|
chr4_+_155484131
|
7.218
|
NM_001184741
NM_005141
|
FGB
|
fibrinogen beta chain
|
|
chr2_+_102927961
|
7.003
|
NM_016232
|
IL18R1
IL1RL1
|
interleukin 18 receptor 1
interleukin 1 receptor-like 1
|
|
chr3_+_148583042
|
6.807
|
NM_001870
|
CPA3
|
carboxypeptidase A3 (mast cell)
|
|
chr7_-_100239136
|
6.703
|
NM_003227
|
TFR2
|
transferrin receptor 2
|
|
chr8_-_86290333
|
6.530
|
NM_001128829
NM_001128830
NM_001128831
NM_001738
|
CA1
|
carbonic anhydrase I
|
|
chr12_-_54689536
|
6.398
|
NM_006163
|
NFE2
|
nuclear factor (erythroid-derived 2), 45kDa
|
|
chr1_-_27240430
|
6.106
|
NM_021969
|
NR0B2
|
nuclear receptor subfamily 0, group B, member 2
|
|
chr10_-_48416692
|
5.854
|
NM_016204
|
GDF2
|
growth differentiation factor 2
|
|
chr17_+_4675175
|
5.547
|
NM_003963
|
TM4SF5
|
transmembrane 4 L six family member 5
|
|
chr17_-_64225496
|
5.181
|
NM_000042
|
APOH
|
apolipoprotein H (beta-2-glycoprotein I)
|
|
chr19_+_7741934
|
5.129
|
NM_174918
|
C19orf59
|
chromosome 19 open reading frame 59
|
|
chr11_-_47374221
|
4.892
|
NM_000256
|
MYBPC3
|
myosin binding protein C, cardiac
|
|
chr2_-_44065888
|
4.735
|
NM_022436
|
ABCG5
|
ATP-binding cassette, sub-family G (WHITE), member 5
|
|
chr2_-_88427535
|
4.626
|
NM_001443
|
FABP1
|
fatty acid binding protein 1, liver
|
|
chr11_+_75428864
|
4.578
|
NM_025098
|
MOGAT2
|
monoacylglycerol O-acyltransferase 2
|
|
chr9_-_100700422
|
4.523
|
NM_197978
|
HEMGN
|
hemogen
|
|
chr12_-_70004941
|
4.466
|
NM_201550
|
LRRC10
|
leucine rich repeat containing 10
|
|
chr2_-_69098502
|
4.372
|
NM_014482
|
BMP10
|
bone morphogenetic protein 10
|
|
chr6_-_30128688
|
4.325
|
NM_006778
NM_052828
|
TRIM10
|
tripartite motif containing 10
|
|
chr2_-_40739570
|
4.273
|
NM_001112802
|
SLC8A1
|
solute carrier family 8 (sodium/calcium exchanger), member 1
|
|
chr1_+_199996729
|
4.197
|
NM_003822
NM_205860
|
NR5A2
|
nuclear receptor subfamily 5, group A, member 2
|
|
chr2_+_241808161
|
4.155
|
NM_000030
|
AGXT
|
alanine-glyoxylate aminotransferase
|
|
chr16_+_31539202
|
4.061
|
NM_016633
|
AHSP
|
alpha hemoglobin stabilizing protein
|
|
chr14_-_65409445
|
4.033
|
NM_002083
|
GPX2
|
glutathione peroxidase 2 (gastrointestinal)
|
|
chr14_-_94849552
|
3.990
|
|
SERPINA1
|
serpin peptidase inhibitor, clade A (alpha-1 antiproteinase, antitrypsin), member 1
|
|
chr4_+_100495972
|
3.905
|
|
MTTP
|
microsomal triglyceride transfer protein
|
|
chr12_+_69742130
|
3.824
|
NM_000239
|
LYZ
|
lysozyme
|
|
chr3_-_187009469
|
3.779
|
NM_001031849
NM_001879
NM_139125
|
MASP1
|
mannan-binding lectin serine peptidase 1 (C4/C2 activating component of Ra-reactive factor)
|
|
chrX_-_55057408
|
3.717
|
NM_000032
NM_001037967
NM_001037968
|
ALAS2
|
aminolevulinate, delta-, synthase 2
|
|
chr3_+_137717657
|
3.632
|
NM_001002026
|
CLDN18
|
claudin 18
|
|
chr2_+_44066102
|
3.541
|
NM_022437
|
ABCG8
|
ATP-binding cassette, sub-family G (WHITE), member 8
|
|
chr6_-_49604524
|
3.485
|
NM_000324
|
RHAG
|
Rh-associated glycoprotein
|
|
chr19_-_48389514
|
3.411
|
|
SULT2A1
|
sulfotransferase family, cytosolic, 2A, dehydroepiandrosterone (DHEA)-preferring, member 1
|
|
chr9_+_97521930
|
3.247
|
NM_001193329
|
C9orf3
|
chromosome 9 open reading frame 3
|
|
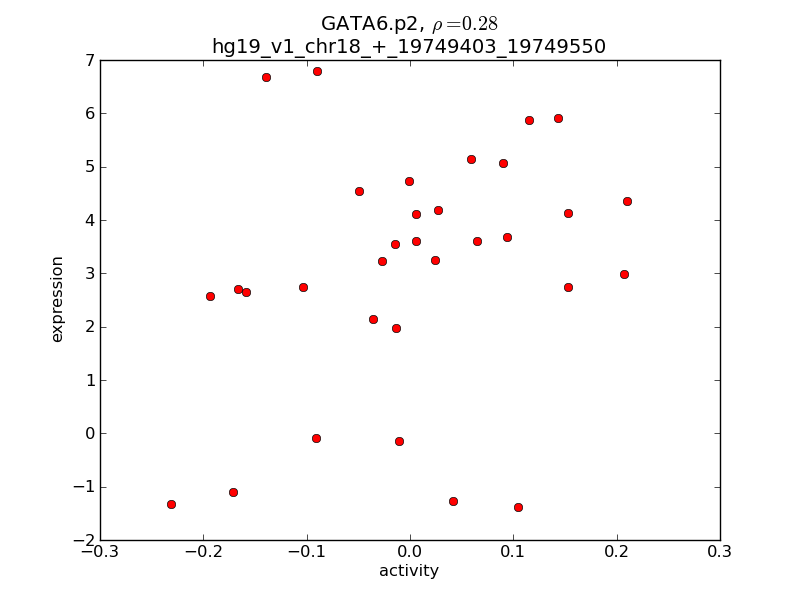
chr18_+_19749403
|
3.219
|
NM_005257
|
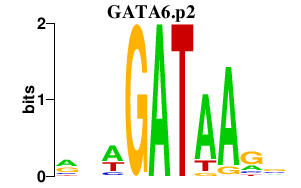
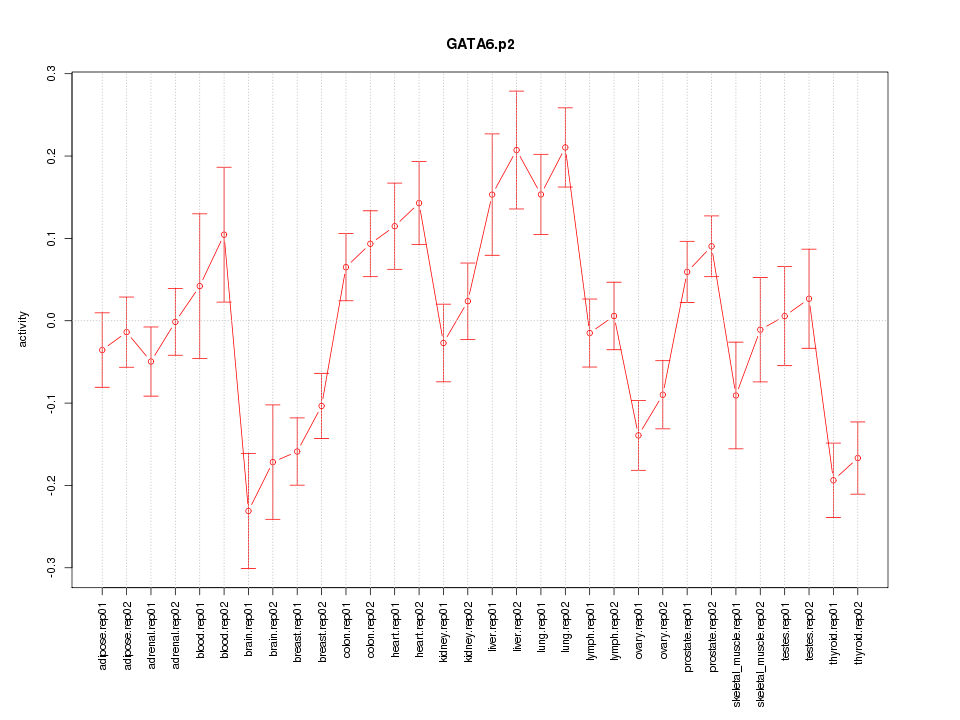
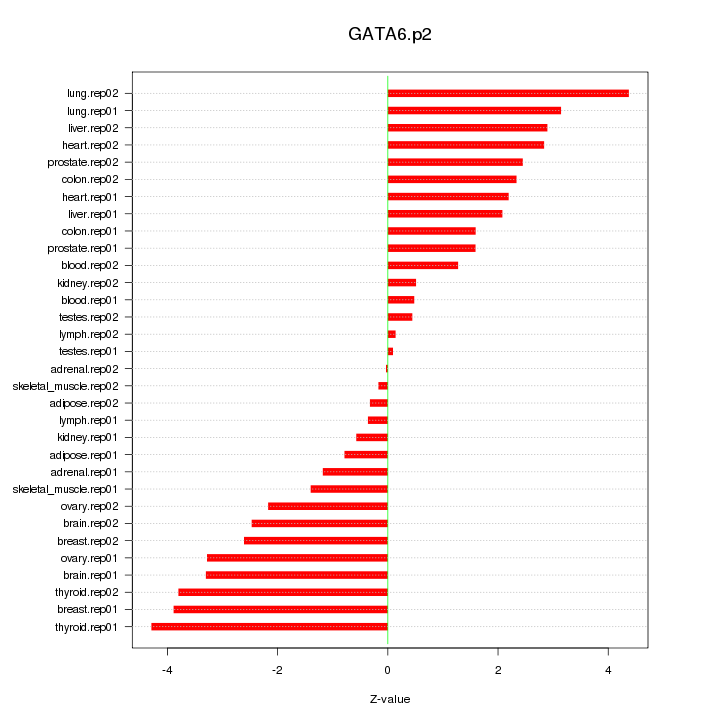
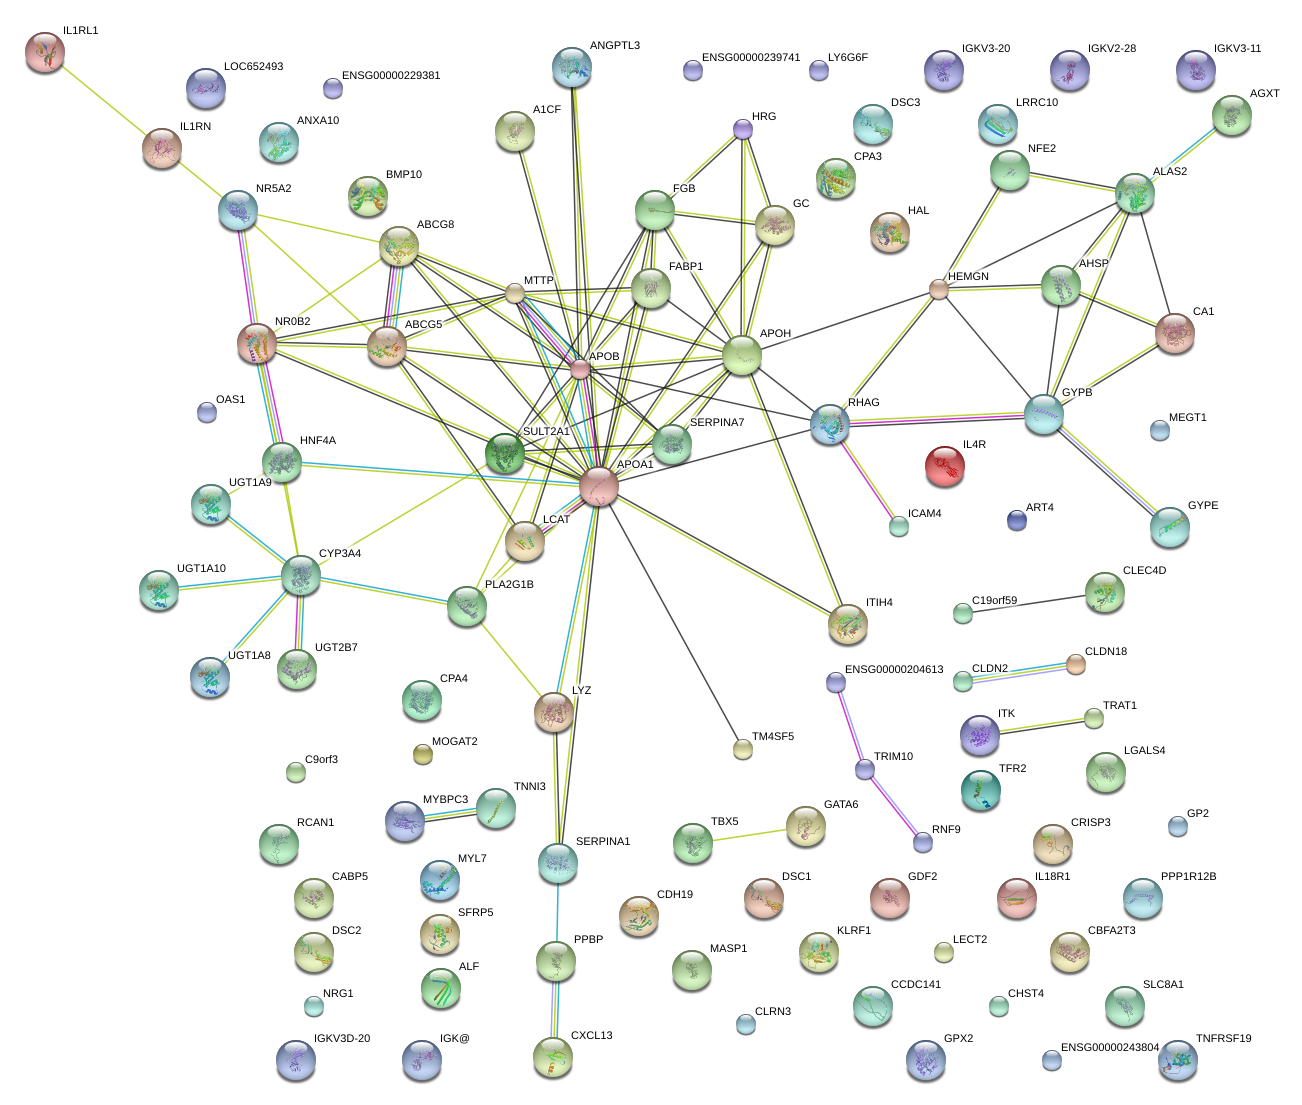
GATA6
|
GATA binding protein 6
|
|
chr3_+_186383770
|
3.200
|
NM_000412
|
HRG
|
histidine-rich glycoprotein
|
|
chr12_-_120765555
|
3.126
|
NM_000928
|
PLA2G1B
|
phospholipase A2, group IB (pancreas)
|
|
chr3_-_52864687
|
3.052
|
NM_001166449
NM_002218
|
ITIH4
|
inter-alpha-trypsin inhibitor heavy chain family, member 4
|
|
chr19_-_48389571
|
3.011
|
NM_003167
|
SULT2A1
|
sulfotransferase family, cytosolic, 2A, dehydroepiandrosterone (DHEA)-preferring, member 1
|
|
chrX_+_65235279
|
2.987
|
|
|
|
|
chr4_-_74853819
|
2.976
|
NM_002704
|
PPBP
|
pro-platelet basic protein (chemokine (C-X-C motif) ligand 7)
|
|
chr7_-_99381703
|
2.965
|
NM_001202855
NM_017460
|
CYP3A4
|
cytochrome P450, family 3, subfamily A, polypeptide 4
|
|
chr12_-_14996381
|
2.918
|
NM_021071
|
ART4
|
ADP-ribosyltransferase 4 (Dombrock blood group)
|
|
chr20_+_43029865
|
2.870
|
NM_000457
NM_178849
NM_178850
|
HNF4A
|
hepatocyte nuclear factor 4, alpha
|
|
chr10_-_129691047
|
2.863
|
|
|
|
|
chrX_+_106161589
|
2.812
|
NM_001171095
|
CLDN2
|
claudin 2
|
|
chr6_-_49712055
|
2.778
|
NM_001190986
NM_006061
|
CRISP3
|
cysteine-rich secretory protein 3
|
|
chrX_-_105282714
|
2.776
|
NM_000354
|
SERPINA7
|
serpin peptidase inhibitor, clade A (alpha-1 antiproteinase, antitrypsin), member 7
|
|
chr6_+_31674639
|
2.764
|
NM_001003693
|
LY6G6F
|
lymphocyte antigen 6 complex, locus G6F
|
|
chr19_-_55668956
|
2.762
|
NM_000363
|
TNNI3
|
troponin I type 3 (cardiac)
|
|
chr4_+_69962191
|
2.756
|
NM_001074
|
UGT2B7
|
UDP glucuronosyltransferase 2 family, polypeptide B7
|
|
chr13_+_24144402
|
2.742
|
NM_001204459
NM_148957
|
TNFRSF19
|
tumor necrosis factor receptor superfamily, member 19
|
|
chr12_-_96390002
|
2.698
|
NM_002108
|
HAL
|
histidine ammonia-lyase
|
|
chr16_-_67977956
|
2.692
|
NM_000229
|
LCAT
|
lecithin-cholesterol acyltransferase
|
|
chr10_-_52645430
|
2.669
|
NM_001198818
NM_001198819
NM_001198820
NM_014576
NM_138932
NM_138933
|
A1CF
|
APOBEC1 complementation factor
|
|
chr19_+_10397642
|
2.641
|
NM_001039132
NM_001544
NM_022377
|
ICAM4
|
intercellular adhesion molecule 4 (Landsteiner-Wiener blood group)
|
|
chr16_-_53405040
|
2.641
|
NM_001207030
|
LOC643802
|
u3 small nucleolar ribonucleoprotein protein MPP10-like
|
|
chr7_-_44180911
|
2.624
|
NM_021223
|
MYL7
|
myosin, light chain 7, regulatory
|
|
chr2_+_90077732
|
2.616
|
|
|
|
|
chr9_-_71590754
|
2.597
|
|
|
|
|
chr10_-_129691202
|
2.574
|
NM_152311
|
CLRN3
|
clarin 3
|
|
chr12_-_114841702
|
2.526
|
NM_080718
|
TBX5
|
T-box 5
|
|
chr1_+_202431870
|
2.518
|
NM_032103
NM_032104
|
PPP1R12B
|
protein phosphatase 1, regulatory subunit 12B
|
|
chr19_-_48547180
|
2.454
|
NM_019855
|
CABP5
|
calcium binding protein 5
|
|
chr16_-_20338808
|
2.429
|
NM_001007240
NM_001007241
NM_001007242
NM_001502
|
GP2
|
glycoprotein 2 (zymogen granule membrane)
|
|
chr4_+_78432905
|
2.421
|
NM_006419
|
CXCL13
|
chemokine (C-X-C motif) ligand 13
|
|
chr18_-_64271215
|
2.415
|
NM_021153
|
CDH19
|
cadherin 19, type 2
|
|
chr2_-_89442551
|
2.405
|
|
IGKC
IGK@
|
immunoglobulin kappa constant
immunoglobulin kappa locus
|
|
chr2_-_21225640
|
2.359
|
|
APOB
|
apolipoprotein B (including Ag(x) antigen)
|
|
chr16_+_71560022
|
2.348
|
NM_005769
NM_001166395
|
CHST4
|
carbohydrate (N-acetylglucosamine 6-O) sulfotransferase 4
|
|
chr4_-_72649734
|
2.316
|
NM_000583
|
GC
|
group-specific component (vitamin D binding protein)
|
|
chr2_+_234526290
|
2.281
|
NM_019076
|
UGT1A8
|
UDP glucuronosyltransferase 1 family, polypeptide A8
|
|
chr5_-_135290521
|
2.271
|
NM_002302
|
LECT2
|
leukocyte cell-derived chemotaxin 2
|
|
chr16_+_27341305
|
2.268
|
|
IL4R
|
interleukin 4 receptor
|
|
chr4_+_169013687
|
2.244
|
NM_007193
|
ANXA10
|
annexin A10
|
|
chr2_+_113885145
|
2.224
|
|
IL1RN
|
interleukin 1 receptor antagonist
|
|
chr12_-_10562744
|
2.208
|
NM_001199805
|
KLRC4-KLRK1
|
KLRC4-KLRK1 readthrough
|
|
chr20_+_43029973
|
2.204
|
|
HNF4A
|
hepatocyte nuclear factor 4, alpha
|
|
chr4_-_144940439
|
2.199
|
NM_002100
|
GYPB
|
glycophorin B (MNS blood group)
|
|
chr2_-_179914785
|
2.149
|
NM_173648
|
CCDC141
|
coiled-coil domain containing 141
|
|
chr19_-_39303520
|
2.121
|
|
LGALS4
|
lectin, galactoside-binding, soluble, 4
|
|
chr12_+_113344738
|
2.114
|
NM_001032409
NM_002534
NM_016816
|
OAS1
|
2'-5'-oligoadenylate synthetase 1, 40/46kDa
|
|
chr12_+_113344811
|
2.106
|
|
OAS1
|
2'-5'-oligoadenylate synthetase 1, 40/46kDa
|
|
chr5_+_156607847
|
2.101
|
NM_005546
|
ITK
|
IL2-inducible T-cell kinase
|
|
chr12_+_8666135
|
2.073
|
NM_080387
|
CLEC4D
|
C-type lectin domain family 4, member D
|
|
chr1_+_63063186
|
2.072
|
NM_014495
|
ANGPTL3
|
angiopoietin-like 3
|
|
chr3_+_108541544
|
2.067
|
NM_016388
|
TRAT1
|
T cell receptor associated transmembrane adaptor 1
|
|
chr16_-_89043215
|
2.063
|
NM_005187
|
CBFA2T3
|
core-binding factor, runt domain, alpha subunit 2; translocated to, 3
|
|
chr12_+_9980076
|
2.028
|
NM_016523
|
KLRF1
|
killer cell lectin-like receptor subfamily F, member 1
|
|
chr18_-_28742744
|
2.023
|
NM_004948
NM_024421
|
DSC1
|
desmocollin 1
|
|
chr1_-_120354058
|
1.977
|
NM_001159352
NM_001159353
NM_032044
|
REG4
|
regenerating islet-derived family, member 4
|
|
chr16_-_67978422
|
1.964
|
|
SLC12A4
|
solute carrier family 12 (potassium/chloride transporters), member 4
|
|
chr4_+_68424444
|
1.959
|
NM_012108
|
STAP1
|
signal transducing adaptor family member 1
|
|
chr12_-_10542616
|
1.956
|
NM_007360
|
KLRK1
|
killer cell lectin-like receptor subfamily K, member 1
|
|
chr3_+_46395574
|
1.954
|
|
CCR2
|
chemokine (C-C motif) receptor 2
|
|
chr2_-_216248184
|
1.951
|
|
FN1
|
fibronectin 1
|
|
chr7_-_99332715
|
1.951
|
NM_000765
|
CYP3A7
CYP3A5
|
cytochrome P450, family 3, subfamily A, polypeptide 7
cytochrome P450, family 3, subfamily A, polypeptide 5
|
|
chr5_+_145316120
|
1.874
|
NM_152550
|
SH3RF2
|
SH3 domain containing ring finger 2
|
|
chr22_+_23229959
|
1.866
|
NM_001178126
|
IGLL5
IGLC1
|
immunoglobulin lambda-like polypeptide 5
immunoglobulin lambda constant 1 (Mcg marker)
|
|
chr19_+_35940616
|
1.850
|
NM_005306
|
FFAR2
|
free fatty acid receptor 2
|
|
chr19_+_15751706
|
1.841
|
NM_000896
NM_001199208
NM_001199209
|
CYP4F3
|
cytochrome P450, family 4, subfamily F, polypeptide 3
|
|
chr9_-_95244634
|
1.812
|
|
ASPN
|
asporin
|
|
chr2_+_138721807
|
1.801
|
NM_001024074
NM_001024075
NM_006895
|
HNMT
|
histamine N-methyltransferase
|
|
chr4_-_100140330
|
1.789
|
NM_000672
NM_001102470
|
ADH6
|
alcohol dehydrogenase 6 (class V)
|
|
chr11_-_57158103
|
1.781
|
NM_001243245
NM_002728
|
PRG2
|
proteoglycan 2, bone marrow (natural killer cell activator, eosinophil granule major basic protein)
|
|
chr5_-_176935877
|
1.718
|
|
DOK3
|
docking protein 3
|
|
chr13_+_31309644
|
1.717
|
NM_001629
|
ALOX5AP
|
arachidonate 5-lipoxygenase-activating protein
|
|
chr2_+_90211704
|
1.712
|
|
|
|
|
chr11_+_10326618
|
1.706
|
NM_001124
|
ADM
|
adrenomedullin
|
|
chr19_-_13213973
|
1.704
|
NM_005583
|
LYL1
|
lymphoblastic leukemia derived sequence 1
|
|
chr19_-_12997956
|
1.687
|
NM_006563
|
KLF1
|
Kruppel-like factor 1 (erythroid)
|
|
chr15_+_49715374
|
1.678
|
NM_002009
|
FGF7
|
fibroblast growth factor 7
|
|
chr3_-_137851123
|
1.667
|
NM_016161
|
A4GNT
|
alpha-1,4-N-acetylglucosaminyltransferase
|
|
chr17_-_3819692
|
1.656
|
|
P2RX1
|
purinergic receptor P2X, ligand-gated ion channel, 1
|
|
chr2_+_211458078
|
1.645
|
NM_001122634
|
CPS1
|
carbamoyl-phosphate synthase 1, mitochondrial
|
|
chr9_+_33240165
|
1.641
|
NM_014471
|
SPINK4
|
serine peptidase inhibitor, Kazal type 4
|
|
chr22_-_37545944
|
1.638
|
NM_000878
|
IL2RB
|
interleukin 2 receptor, beta
|
|
chr21_-_35899046
|
1.635
|
NM_203418
|
RCAN1
|
regulator of calcineurin 1
|
|
chr8_+_120079423
|
1.601
|
NM_006438
|
COLEC10
|
collectin sub-family member 10 (C-type lectin)
|
|
chr9_+_118916069
|
1.592
|
NM_002581
|
PAPPA
|
pregnancy-associated plasma protein A, pappalysin 1
|
|
chr9_+_35673852
|
1.587
|
NM_001216
|
CA9
|
carbonic anhydrase IX
|
|
chr19_-_39303739
|
1.556
|
NM_006149
|
LGALS4
|
lectin, galactoside-binding, soluble, 4
|
|
chr8_+_76452202
|
1.515
|
NM_004133
|
HNF4G
|
hepatocyte nuclear factor 4, gamma
|
|
chr2_+_234637772
|
1.514
|
NM_019093
|
UGT1A3
|
UDP glucuronosyltransferase 1 family, polypeptide A3
|
|
chr1_+_26644458
|
1.508
|
|
CD52
|
CD52 molecule
|
|
chr1_-_120311466
|
1.502
|
NM_001166107
NM_005518
|
HMGCS2
|
3-hydroxy-3-methylglutaryl-CoA synthase 2 (mitochondrial)
|
|
chr10_-_52645384
|
1.477
|
|
A1CF
|
APOBEC1 complementation factor
|
|
chrX_-_15402469
|
1.470
|
NM_004469
|
FIGF
|
c-fos induced growth factor (vascular endothelial growth factor D)
|
|
chr8_+_22019167
|
1.465
|
NM_001172357
NM_001172410
NM_003018
|
SFTPC
|
surfactant protein C
|
|
chr17_-_3819959
|
1.422
|
NM_002558
|
P2RX1
|
purinergic receptor P2X, ligand-gated ion channel, 1
|
|
chr4_-_70626429
|
1.412
|
NM_014465
|
SULT1B1
|
sulfotransferase family, cytosolic, 1B, member 1
|
|
chr13_-_28543423
|
1.410
|
|
CDX2
|
caudal type homeobox 2
|
|
chr18_+_3447607
|
1.396
|
NM_173207
|
TGIF1
|
TGFB-induced factor homeobox 1
|
|
chr8_-_20040612
|
1.395
|
NM_001135691
NM_001142324
NM_001142325
NM_003053
|
SLC18A1
|
solute carrier family 18 (vesicular monoamine), member 1
|
|
chr1_+_154293568
|
1.373
|
NM_080429
|
AQP10
|
aquaporin 10
|
|
chr13_-_28543143
|
1.367
|
|
CDX2
|
caudal type homeobox 2
|
|
chr22_+_22550159
|
1.355
|
|
IGLV6-57
|
immunoglobulin lambda variable 6-57
|
|
chr1_+_26644380
|
1.350
|
NM_001803
|
CD52
|
CD52 molecule
|
|
chr20_+_43835637
|
1.349
|
NM_003007
|
SEMG1
|
semenogelin I
|
|
chr15_-_50558161
|
1.324
|
NM_002112
|
HDC
|
histidine decarboxylase
|
|
chr17_-_39092714
|
1.315
|
|
KRT23
|
keratin 23 (histone deacetylase inducible)
|
|
chr11_+_71927818
|
1.315
|
NM_000803
NM_001113534
NM_001113535
NM_001113536
|
FOLR2
|
folate receptor 2 (fetal)
|
|
chr6_-_52668599
|
1.309
|
NM_145740
|
GSTA1
|
glutathione S-transferase alpha 1
|
|
chr19_-_13213513
|
1.303
|
|
LYL1
|
lymphoblastic leukemia derived sequence 1
|
|
chrX_+_106163605
|
1.296
|
NM_020384
|
CLDN2
|
claudin 2
|
|
chr14_+_76071804
|
1.295
|
NM_001195283
|
FLVCR2
|
feline leukemia virus subgroup C cellular receptor family, member 2
|
|
chr20_+_31870940
|
1.290
|
NM_033197
|
BPIFB1
|
BPI fold containing family B, member 1
|
|
chr12_-_121476770
|
1.280
|
NM_003733
NM_198213
|
OASL
|
2'-5'-oligoadenylate synthetase-like
|
|
chr8_+_124194751
|
1.279
|
NM_032899
NM_207006
|
FAM83A
|
family with sequence similarity 83, member A
|
|
chr5_-_35048239
|
1.274
|
NM_031900
|
AGXT2
|
alanine--glyoxylate aminotransferase 2
|
|
chr11_-_5255712
|
1.274
|
NM_000519
|
HBD
|
hemoglobin, delta
|
|
chr1_+_192127591
|
1.260
|
NM_130782
|
RGS18
|
regulator of G-protein signaling 18
|
|
chr11_+_118754474
|
1.253
|
NM_001716
|
CXCR5
|
chemokine (C-X-C motif) receptor 5
|
|
chr17_-_73840495
|
1.250
|
|
UNC13D
|
unc-13 homolog D (C. elegans)
|
|
chr11_+_59856136
|
1.250
|
NM_000139
|
MS4A2
|
membrane-spanning 4-domains, subfamily A, member 2 (Fc fragment of IgE, high affinity I, receptor for; beta polypeptide)
|
|
chr1_-_157811491
|
1.248
|
NM_005894
|
CD5L
|
CD5 molecule-like
|
|
chr7_-_76829109
|
1.243
|
NM_006682
|
FGL2
|
fibrinogen-like 2
|
|
chr19_-_11494882
|
1.238
|
NM_000121
|
EPOR
|
erythropoietin receptor
|
|
chr1_-_11907741
|
1.231
|
NM_006172
|
NPPA
|
natriuretic peptide A
|
|
chr4_+_151503076
|
1.229
|
NM_006439
|
MAB21L2
|
mab-21-like 2 (C. elegans)
|
|
chr1_+_206317458
|
1.226
|
NM_001910
NM_148964
|
CTSE
|
cathepsin E
|
|
chr6_-_2840683
|
1.219
|
|
SERPINB1
|
serpin peptidase inhibitor, clade B (ovalbumin), member 1
|
|
chr12_-_53600999
|
1.218
|
NM_000889
|
ITGB7
|
integrin, beta 7
|
|
chr9_-_97402556
|
1.212
|
|
FBP1
|
fructose-1,6-bisphosphatase 1
|
|
chr3_+_100328432
|
1.211
|
NM_032787
|
GPR128
|
G protein-coupled receptor 128
|
|
chr5_+_179220985
|
1.209
|
NM_145867
|
LTC4S
|
leukotriene C4 synthase
|
|
chr17_-_73840587
|
1.207
|
NM_199242
|
UNC13D
|
unc-13 homolog D (C. elegans)
|
|
chr11_+_63974190
|
1.205
|
|
FERMT3
|
fermitin family member 3
|
|
chr8_-_143833924
|
1.205
|
NM_205545
|
LYPD2
|
LY6/PLAUR domain containing 2
|
|
chr9_+_125137600
|
1.203
|
|
PTGS1
|
prostaglandin-endoperoxide synthase 1 (prostaglandin G/H synthase and cyclooxygenase)
|
|
chr1_-_168513201
|
1.193
|
NM_003175
|
XCL1
XCL2
|
chemokine (C motif) ligand 1
chemokine (C motif) ligand 2
|
|
chr4_-_76928601
|
1.192
|
NM_002416
|
CXCL9
|
chemokine (C-X-C motif) ligand 9
|
|
chr10_+_7745354
|
1.192
|
|
ITIH2
|
inter-alpha-trypsin inhibitor heavy chain 2
|
|
chr3_+_128779609
|
1.183
|
NM_000174
|
GP9
|
glycoprotein IX (platelet)
|
|
chr14_-_107013122
|
1.180
|
|
IGHV4-31
IGHG1
|
immunoglobulin heavy variable 4-31
immunoglobulin heavy constant gamma 1 (G1m marker)
|
|
chr3_-_119379269
|
1.179
|
NM_022135
|
POPDC2
|
popeye domain containing 2
|
|
chr21_+_43823970
|
1.178
|
NM_001001895
NM_001243467
NM_018961
|
UBASH3A
|
ubiquitin associated and SH3 domain containing A
|
|
chr11_-_115088628
|
1.160
|
|
CADM1
|
cell adhesion molecule 1
|
|
chr3_-_42917632
|
1.142
|
NM_004391
|
CYP8B1
|
cytochrome P450, family 8, subfamily B, polypeptide 1
|
|
chr19_-_40228611
|
1.128
|
NM_001828
|
CLC
|
Charcot-Leyden crystal protein
|
|
chr10_+_7745284
|
1.127
|
|
ITIH2
|
inter-alpha-trypsin inhibitor heavy chain 2
|
|
chr13_-_28543290
|
1.126
|
NM_001265
|
CDX2
|
caudal type homeobox 2
|
|
chrX_+_135730335
|
1.124
|
NM_000074
|
CD40LG
|
CD40 ligand
|
|
chr1_+_168545710
|
1.122
|
NM_002995
|
XCL1
|
chemokine (C motif) ligand 1
|
|
chr21_-_35828038
|
1.119
|
NM_001127670
|
KCNE1
|
potassium voltage-gated channel, Isk-related family, member 1
|
|
chr20_-_7921068
|
1.117
|
NM_017545
|
HAO1
|
hydroxyacid oxidase (glycolate oxidase) 1
|
|
chr4_+_74606222
|
1.113
|
NM_000584
|
IL8
|
interleukin 8
|
|
chr10_+_70847857
|
1.111
|
|
SRGN
|
serglycin
|
|
chrX_+_44703248
|
1.100
|
NM_022076
|
DUSP21
|
dual specificity phosphatase 21
|
|
chr1_-_173886464
|
1.080
|
NM_000488
|
SERPINC1
|
serpin peptidase inhibitor, clade C (antithrombin), member 1
|
|
chrX_+_38211735
|
1.077
|
NM_000531
|
OTC
|
ornithine carbamoyltransferase
|
|
chr2_-_188419049
|
1.075
|
|
TFPI
|
tissue factor pathway inhibitor (lipoprotein-associated coagulation inhibitor)
|
|
chr6_+_118869441
|
1.066
|
NM_002667
|
PLN
|
phospholamban
|
|
chr6_-_133078894
|
1.063
|
NM_001242350
NM_004665
|
VNN2
|
vanin 2
|
|
chr16_+_202853
|
1.057
|
NM_005332
|
HBZ
|
hemoglobin, zeta
|
|
chr14_-_94854910
|
1.045
|
|
SERPINA1
|
serpin peptidase inhibitor, clade A (alpha-1 antiproteinase, antitrypsin), member 1
|
|
chr22_+_23213671
|
1.037
|
|
IGLV4-3
|
immunoglobulin lambda variable 4-3
|
|
chr4_+_39408541
|
1.028
|
|
KLB
|
klotho beta
|