|
chr1_-_38471170
|
4.829
|
NM_001243878
NM_004468
|
FHL3
|
four and a half LIM domains 3
|
|
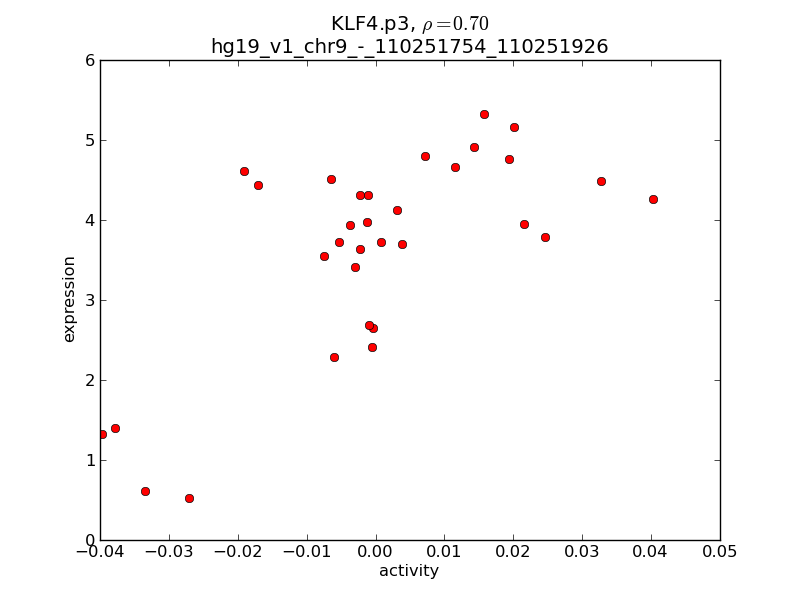
chr9_-_110251754
|
4.552
|
|
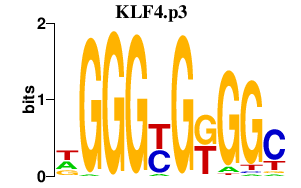
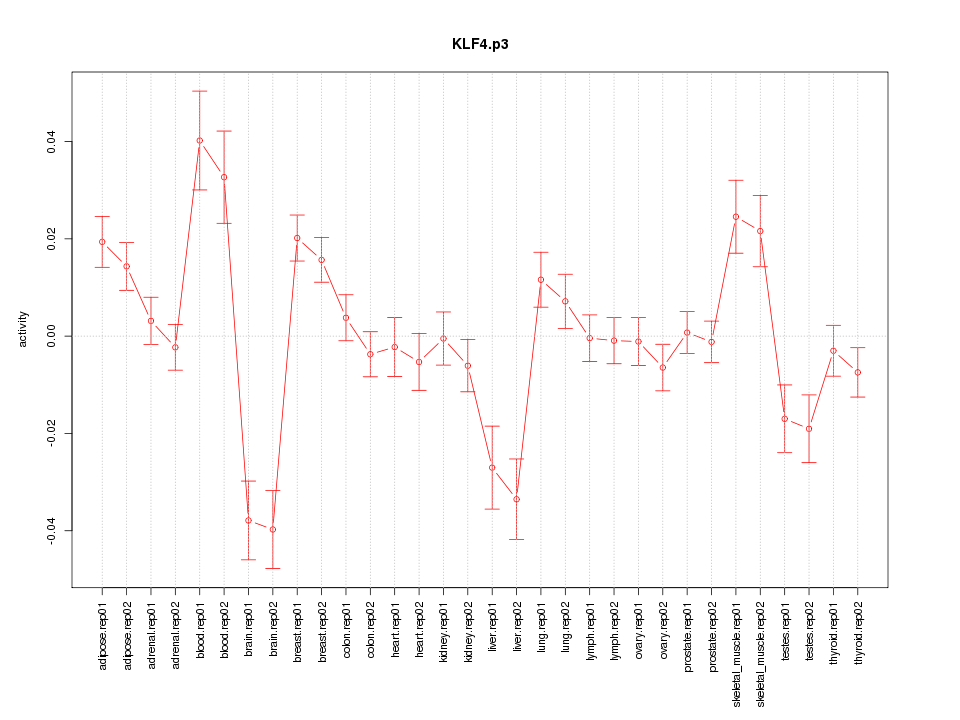
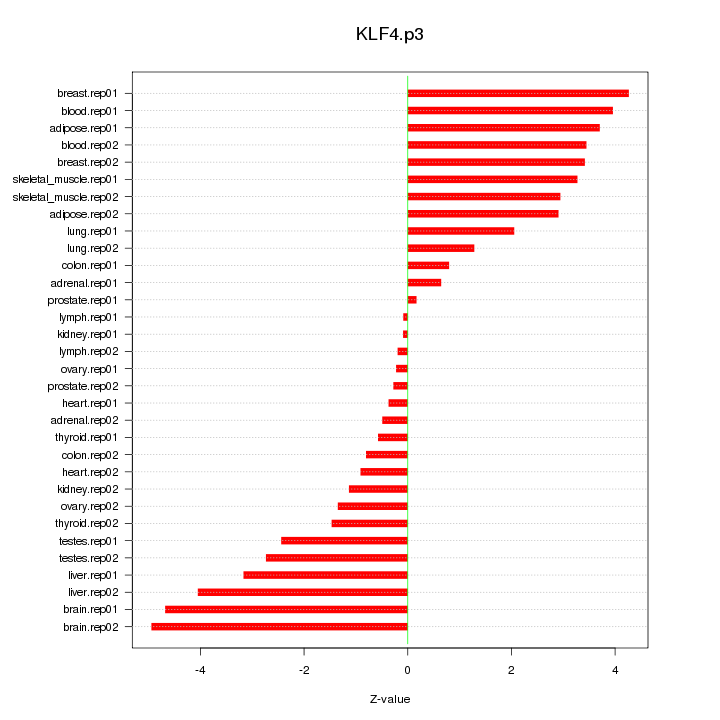
KLF4
|
Kruppel-like factor 4 (gut)
|
|
chr4_+_154387450
|
4.474
|
NM_001131007
NM_015196
|
KIAA0922
|
KIAA0922
|
|
chrX_-_153599581
|
4.465
|
|
FLNA
|
filamin A, alpha
|
|
chr18_+_11981457
|
4.450
|
|
IMPA2
|
inositol(myo)-1(or 4)-monophosphatase 2
|
|
chr22_-_36784001
|
4.412
|
|
MYH9
|
myosin, heavy chain 9, non-muscle
|
|
chr18_+_11981552
|
4.407
|
|
IMPA2
|
inositol(myo)-1(or 4)-monophosphatase 2
|
|
chr22_-_36783851
|
4.238
|
|
MYH9
|
myosin, heavy chain 9, non-muscle
|
|
chr8_+_37553269
|
4.098
|
NM_025069
|
ZNF703
|
zinc finger protein 703
|
|
chr22_-_36783930
|
4.077
|
|
MYH9
|
myosin, heavy chain 9, non-muscle
|
|
chr17_+_81037504
|
3.941
|
NM_001004431
|
METRNL
|
meteorin, glial cell differentiation regulator-like
|
|
chr1_+_154975041
|
3.835
|
NM_001252405
NM_015872
|
ZBTB7B
|
zinc finger and BTB domain containing 7B
|
|
chr15_+_90931505
|
3.729
|
|
IQGAP1
|
IQ motif containing GTPase activating protein 1
|
|
chr19_+_54371170
|
3.699
|
|
MYADM
|
myeloid-associated differentiation marker
|
|
chr18_+_11981421
|
3.677
|
NM_014214
|
IMPA2
|
inositol(myo)-1(or 4)-monophosphatase 2
|
|
chr2_+_85132999
|
3.666
|
|
TMSB10
|
thymosin beta 10
|
|
chr1_-_9189087
|
3.659
|
NM_024980
|
GPR157
|
G protein-coupled receptor 157
|
|
chrX_+_152990322
|
3.642
|
NM_000033
|
ABCD1
|
ATP-binding cassette, sub-family D (ALD), member 1
|
|
chr7_-_102257135
|
3.642
|
|
RASA4
|
RAS p21 protein activator 4
|
|
chr15_+_90931489
|
3.624
|
|
IQGAP1
|
IQ motif containing GTPase activating protein 1
|
|
chr19_-_6767417
|
3.588
|
NM_005490
|
SH2D3A
|
SH2 domain containing 3A
|
|
chr12_+_57916607
|
3.580
|
NM_052897
|
MBD6
|
methyl-CpG binding domain protein 6
|
|
chr22_-_36783977
|
3.570
|
|
MYH9
|
myosin, heavy chain 9, non-muscle
|
|
chr11_+_819696
|
3.542
|
|
PNPLA2
|
patatin-like phospholipase domain containing 2
|
|
chr7_-_102257199
|
3.539
|
NM_001079877
NM_006989
|
RASA4
|
RAS p21 protein activator 4
|
|
chr11_-_73694297
|
3.448
|
|
UCP2
|
uncoupling protein 2 (mitochondrial, proton carrier)
|
|
chr15_+_90931509
|
3.413
|
|
IQGAP1
|
IQ motif containing GTPase activating protein 1
|
|
chr9_-_130533509
|
3.297
|
NM_001252334
NM_005489
|
SH2D3C
|
SH2 domain containing 3C
|
|
chr19_+_54371150
|
3.270
|
|
MYADM
|
myeloid-associated differentiation marker
|
|
chr5_+_40680042
|
3.225
|
|
PTGER4
|
prostaglandin E receptor 4 (subtype EP4)
|
|
chr19_+_45504686
|
3.224
|
NM_006509
|
RELB
|
v-rel reticuloendotheliosis viral oncogene homolog B
|
|
chr19_+_54371125
|
3.213
|
NM_001020819
NM_138373
|
MYADM
|
myeloid-associated differentiation marker
|
|
chr2_+_11295569
|
3.209
|
|
PQLC3
|
PQ loop repeat containing 3
|
|
chr20_+_62371218
|
3.185
|
|
SLC2A4RG
|
SLC2A4 regulator
|
|
chr16_+_30676098
|
3.175
|
|
FBRS
|
fibrosin
|
|
chr2_-_37898768
|
3.110
|
|
CDC42EP3
|
CDC42 effector protein (Rho GTPase binding) 3
|
|
chr5_+_40680021
|
3.039
|
NM_000958
|
PTGER4
|
prostaglandin E receptor 4 (subtype EP4)
|
|
chr9_-_110252045
|
3.007
|
NM_004235
|
KLF4
|
Kruppel-like factor 4 (gut)
|
|
chr2_-_16847070
|
3.002
|
NM_030797
|
FAM49A
|
family with sequence similarity 49, member A
|
|
chr15_+_90931470
|
2.992
|
NM_003870
|
IQGAP1
|
IQ motif containing GTPase activating protein 1
|
|
chr19_+_3178735
|
2.970
|
NM_003775
|
S1PR4
|
sphingosine-1-phosphate receptor 4
|
|
chr16_+_89238160
|
2.918
|
NM_004933
|
CDH15
|
cadherin 15, type 1, M-cadherin (myotubule)
|
|
chr8_-_37756971
|
2.870
|
NM_001002814
NM_025151
|
RAB11FIP1
|
RAB11 family interacting protein 1 (class I)
|
|
chr19_-_47734215
|
2.859
|
NM_014417
|
BBC3
|
BCL2 binding component 3
|
|
chr14_-_21566497
|
2.855
|
|
ZNF219
|
zinc finger protein 219
|
|
chr2_+_11295602
|
2.830
|
|
PQLC3
|
PQ loop repeat containing 3
|
|
chrX_-_153599719
|
2.826
|
|
FLNA
|
filamin A, alpha
|
|
chr10_-_126849556
|
2.722
|
NM_001083914
|
CTBP2
|
C-terminal binding protein 2
|
|
chr18_+_77155966
|
2.716
|
|
NFATC1
|
nuclear factor of activated T-cells, cytoplasmic, calcineurin-dependent 1
|
|
chr9_+_140500097
|
2.709
|
|
ARRDC1
|
arrestin domain containing 1
|
|
chr17_+_76164624
|
2.706
|
NM_004710
|
SYNGR2
|
synaptogyrin 2
|
|
chr3_+_127391768
|
2.688
|
NM_032548
NM_172027
|
ABTB1
|
ankyrin repeat and BTB (POZ) domain containing 1
|
|
chr15_+_90931449
|
2.676
|
|
IQGAP1
|
IQ motif containing GTPase activating protein 1
|
|
chr17_-_73840422
|
2.672
|
|
UNC13D
|
unc-13 homolog D (C. elegans)
|
|
chr6_+_35420149
|
2.657
|
|
FANCE
|
Fanconi anemia, complementation group E
|
|
chr11_-_73693820
|
2.652
|
|
UCP2
|
uncoupling protein 2 (mitochondrial, proton carrier)
|
|
chr7_+_97911023
|
2.651
|
|
BRI3
|
brain protein I3
|
|
chr22_-_36784055
|
2.592
|
NM_002473
|
MYH9
|
myosin, heavy chain 9, non-muscle
|
|
chr10_+_75757847
|
2.586
|
NM_003373
NM_014000
|
VCL
|
vinculin
|
|
chr11_-_73693883
|
2.567
|
NM_003355
|
UCP2
|
uncoupling protein 2 (mitochondrial, proton carrier)
|
|
chrX_+_117629871
|
2.564
|
NM_144658
|
DOCK11
|
dedicator of cytokinesis 11
|
|
chr5_+_133861344
|
2.562
|
|
PHF15
|
PHD finger protein 15
|
|
chr12_-_58240746
|
2.560
|
NM_005730
|
CTDSP2
|
CTD (carboxy-terminal domain, RNA polymerase II, polypeptide A) small phosphatase 2
|
|
chr20_-_52210780
|
2.530
|
|
ZNF217
|
zinc finger protein 217
|
|
chr17_-_66453561
|
2.513
|
NM_017983
|
WIPI1
|
WD repeat domain, phosphoinositide interacting 1
|
|
chr4_+_3076236
|
2.499
|
NM_002111
|
HTT
|
huntingtin
|
|
chr15_-_72612247
|
2.491
|
NM_001172684
|
CELF6
|
CUGBP, Elav-like family member 6
|
|
chr21_+_17102370
|
2.482
|
NM_013396
|
USP25
|
ubiquitin specific peptidase 25
|
|
chr1_-_36851484
|
2.478
|
NM_032017
|
STK40
|
serine/threonine kinase 40
|
|
chr6_+_35420115
|
2.465
|
NM_021922
|
FANCE
|
Fanconi anemia, complementation group E
|
|
chr17_+_78234626
|
2.457
|
NM_020914
NM_020954
|
RNF213
|
ring finger protein 213
|
|
chr2_-_37899227
|
2.456
|
NM_006449
|
CDC42EP3
|
CDC42 effector protein (Rho GTPase binding) 3
|
|
chr19_+_14544216
|
2.446
|
|
PKN1
|
protein kinase N1
|
|
chrX_+_49028183
|
2.435
|
NM_002668
|
PLP2
|
proteolipid protein 2 (colonic epithelium-enriched)
|
|
chr22_+_43547526
|
2.435
|
NM_000714
NM_007311
|
TSPO
|
translocator protein (18kDa)
|
|
chr7_+_21467572
|
2.433
|
NM_003112
|
SP4
|
Sp4 transcription factor
|
|
chr20_+_62371109
|
2.430
|
NM_020062
|
SLC2A4RG
|
SLC2A4 regulator
|
|
chr19_-_10679328
|
2.429
|
|
CDKN2D
|
cyclin-dependent kinase inhibitor 2D (p19, inhibits CDK4)
|
|
chr12_-_58240472
|
2.426
|
|
CTDSP2
|
CTD (carboxy-terminal domain, RNA polymerase II, polypeptide A) small phosphatase 2
|
|
chr17_-_7382804
|
2.396
|
|
ZBTB4
|
zinc finger and BTB domain containing 4
|
|
chr11_-_2292181
|
2.385
|
NM_005170
|
ASCL2
|
achaete-scute complex homolog 2 (Drosophila)
|
|
chr20_+_35089817
|
2.384
|
NM_001042486
|
DLGAP4
|
discs, large (Drosophila) homolog-associated protein 4
|
|
chr4_+_38665587
|
2.365
|
NM_016531
|
KLF3
|
Kruppel-like factor 3 (basic)
|
|
chr9_+_140500136
|
2.361
|
|
ARRDC1
|
arrestin domain containing 1
|
|
chr16_-_88752788
|
2.352
|
|
SNAI3
|
snail homolog 3 (Drosophila)
|
|
chr3_+_50273645
|
2.333
|
NM_002070
|
GNAI2
|
guanine nucleotide binding protein (G protein), alpha inhibiting activity polypeptide 2
|
|
chr11_-_64014140
|
2.328
|
|
PPP1R14B
|
protein phosphatase 1, regulatory (inhibitor) subunit 14B
|
|
chr1_-_154155594
|
2.319
|
|
TPM3
|
tropomyosin 3
|
|
chrX_+_48398048
|
2.298
|
NM_002536
|
TBC1D25
|
TBC1 domain family, member 25
|
|
chr5_+_95998170
|
2.293
|
|
CAST
|
calpastatin
|
|
chr15_+_65134081
|
2.291
|
NM_001195059
NM_025201
|
PLEKHO2
|
pleckstrin homology domain containing, family O member 2
|
|
chr1_-_115632047
|
2.285
|
NM_005725
|
TSPAN2
|
tetraspanin 2
|
|
chr19_-_10679620
|
2.274
|
NM_001800
NM_079421
|
CDKN2D
|
cyclin-dependent kinase inhibitor 2D (p19, inhibits CDK4)
|
|
chr17_-_28257017
|
2.265
|
NM_033389
|
SSH2
|
slingshot homolog 2 (Drosophila)
|
|
chr8_+_22457098
|
2.233
|
NM_001013842
NM_001198827
NM_173686
|
C8orf58
|
chromosome 8 open reading frame 58
|
|
chr9_-_139890984
|
2.225
|
NM_004669
|
CLIC3
|
chloride intracellular channel 3
|
|
chr1_-_36851517
|
2.219
|
|
STK40
|
serine/threonine kinase 40
|
|
chr1_-_153508463
|
2.213
|
|
S100A6
|
S100 calcium binding protein A6
|
|
chr9_+_140500156
|
2.212
|
|
|
|
|
chr11_-_64645925
|
2.210
|
|
EHD1
|
EH-domain containing 1
|
|
chr2_+_238600878
|
2.207
|
|
LRRFIP1
|
leucine rich repeat (in FLII) interacting protein 1
|
|
chr9_+_95858561
|
2.195
|
|
C9orf89
|
chromosome 9 open reading frame 89
|
|
chr1_+_154975201
|
2.192
|
NM_001252406
|
ZBTB7B
|
zinc finger and BTB domain containing 7B
|
|
chr6_-_31550065
|
2.187
|
NM_002341
NM_009588
|
LTB
|
lymphotoxin beta (TNF superfamily, member 3)
|
|
chr19_+_48828820
|
2.178
|
|
EMP3
|
epithelial membrane protein 3
|
|
chr3_+_50273648
|
2.175
|
|
GNAI2
|
guanine nucleotide binding protein (G protein), alpha inhibiting activity polypeptide 2
|
|
chr1_+_26856252
|
2.170
|
|
RPS6KA1
|
ribosomal protein S6 kinase, 90kDa, polypeptide 1
|
|
chr2_+_11295539
|
2.165
|
NM_152391
|
PQLC3
|
PQ loop repeat containing 3
|
|
chr12_+_68042493
|
2.161
|
NM_003583
NM_006482
|
DYRK2
|
dual-specificity tyrosine-(Y)-phosphorylation regulated kinase 2
|
|
chr19_-_14116875
|
2.138
|
|
RFX1
|
regulatory factor X, 1 (influences HLA class II expression)
|
|
chr3_+_50273575
|
2.136
|
|
GNAI2
|
guanine nucleotide binding protein (G protein), alpha inhibiting activity polypeptide 2
|
|
chr20_+_34894190
|
2.133
|
|
DLGAP4
|
discs, large (Drosophila) homolog-associated protein 4
|
|
chr1_+_26856259
|
2.115
|
|
RPS6KA1
|
ribosomal protein S6 kinase, 90kDa, polypeptide 1
|
|
chr1_+_26856240
|
2.112
|
NM_002953
|
RPS6KA1
|
ribosomal protein S6 kinase, 90kDa, polypeptide 1
|
|
chr17_+_75277491
|
2.101
|
NM_001113491
|
SEPT9
|
septin 9
|
|
chr1_-_154155698
|
2.092
|
NM_001043351
NM_001043352
NM_001043353
NM_153649
|
TPM3
|
tropomyosin 3
|
|
chr19_+_10713055
|
2.083
|
NM_001145056
|
SLC44A2
|
solute carrier family 44, member 2
|
|
chr5_+_176853673
|
2.080
|
NM_001004105
NM_001004106
NM_002082
|
GRK6
|
G protein-coupled receptor kinase 6
|
|
chr16_+_66638652
|
2.079
|
|
CMTM3
|
CKLF-like MARVEL transmembrane domain containing 3
|
|
chr7_+_65338349
|
2.074
|
|
VKORC1L1
|
vitamin K epoxide reductase complex, subunit 1-like 1
|
|
chr20_+_43803539
|
2.071
|
NM_002638
|
PI3
|
peptidase inhibitor 3, skin-derived
|
|
chr9_+_140500148
|
2.070
|
|
ARRDC1
|
arrestin domain containing 1
|
|
chr12_+_69004708
|
2.069
|
|
RAP1B
|
RAP1B, member of RAS oncogene family
|
|
chr3_+_50273745
|
2.068
|
|
GNAI2
|
guanine nucleotide binding protein (G protein), alpha inhibiting activity polypeptide 2
|
|
chr1_-_156470538
|
2.067
|
|
MEF2D
|
myocyte enhancer factor 2D
|
|
chrX_-_135056132
|
2.066
|
NM_173470
|
MMGT1
|
membrane magnesium transporter 1
|
|
chr20_-_62711160
|
2.065
|
NM_001039467
|
RGS19
|
regulator of G-protein signaling 19
|
|
chr14_+_64319607
|
2.064
|
NM_015180
NM_182914
|
SYNE2
|
spectrin repeat containing, nuclear envelope 2
|
|
chr10_-_104001229
|
2.060
|
NM_005029
|
PITX3
|
paired-like homeodomain 3
|
|
chr16_+_30675777
|
2.057
|
NM_001105079
|
FBRS
|
fibrosin
|
|
chr3_+_50273674
|
2.032
|
|
GNAI2
|
guanine nucleotide binding protein (G protein), alpha inhibiting activity polypeptide 2
|
|
chr1_-_154155680
|
2.027
|
|
TPM3
|
tropomyosin 3
|
|
chr12_-_58240493
|
2.024
|
|
CTDSP2
|
CTD (carboxy-terminal domain, RNA polymerase II, polypeptide A) small phosphatase 2
|
|
chr3_+_50649292
|
2.003
|
NM_001243926
|
MAPKAPK3
|
mitogen-activated protein kinase-activated protein kinase 3
|
|
chr1_-_154155646
|
2.002
|
|
TPM3
|
tropomyosin 3
|
|
chr16_-_67281312
|
2.001
|
|
FHOD1
|
formin homology 2 domain containing 1
|
|
chrY_-_1521733
|
1.996
|
NM_001173474
NM_004192
|
ASMTL
|
acetylserotonin O-methyltransferase-like
|
|
chr19_+_17581276
|
1.989
|
NM_198580
|
SLC27A1
|
solute carrier family 27 (fatty acid transporter), member 1
|
|
chr3_+_50273635
|
1.983
|
|
GNAI2
|
guanine nucleotide binding protein (G protein), alpha inhibiting activity polypeptide 2
|
|
chr12_-_58240446
|
1.980
|
|
CTDSP2
|
CTD (carboxy-terminal domain, RNA polymerase II, polypeptide A) small phosphatase 2
|
|
chr3_+_133495925
|
1.978
|
|
TF
|
transferrin
|
|
chr19_+_4679293
|
1.975
|
NM_001242901
|
LOC100131094
|
uncharacterized LOC100131094
|
|
chr1_+_150521786
|
1.968
|
NM_019032
NM_025008
|
ADAMTSL4
|
ADAMTS-like 4
|
|
chr11_-_75236418
|
1.966
|
NM_030792
|
GDPD5
|
glycerophosphodiester phosphodiesterase domain containing 5
|
|
chr7_+_65338343
|
1.960
|
|
VKORC1L1
|
vitamin K epoxide reductase complex, subunit 1-like 1
|
|
chr3_+_38206968
|
1.955
|
NM_005109
|
OXSR1
|
oxidative-stress responsive 1
|
|
chr16_-_67281398
|
1.951
|
NM_013241
|
FHOD1
|
formin homology 2 domain containing 1
|
|
chrX_+_64887510
|
1.931
|
NM_002444
|
MSN
|
moesin
|
|
chr9_-_139581795
|
1.930
|
|
AGPAT2
|
1-acylglycerol-3-phosphate O-acyltransferase 2 (lysophosphatidic acid acyltransferase, beta)
|
|
chr19_+_54695103
|
1.928
|
NM_001077446
|
TSEN34
|
tRNA splicing endonuclease 34 homolog (S. cerevisiae)
|
|
chr5_+_133450353
|
1.921
|
NM_003202
|
TCF7
|
transcription factor 7 (T-cell specific, HMG-box)
|
|
chr19_-_40971623
|
1.920
|
NM_000713
|
BLVRB
|
biliverdin reductase B (flavin reductase (NADPH))
|
|
chr11_+_65082288
|
1.919
|
NM_006779
|
CDC42EP2
|
CDC42 effector protein (Rho GTPase binding) 2
|
|
chr2_+_219264719
|
1.915
|
|
CTDSP1
|
CTD (carboxy-terminal domain, RNA polymerase II, polypeptide A) small phosphatase 1
|
|
chr19_+_42788605
|
1.915
|
NM_015125
|
CIC
|
capicua homolog (Drosophila)
|
|
chr2_-_220252513
|
1.911
|
|
DNPEP
|
aspartyl aminopeptidase
|
|
chr12_-_109125289
|
1.908
|
NM_014325
|
CORO1C
|
coronin, actin binding protein, 1C
|
|
chr1_+_226250413
|
1.908
|
|
H3F3A
|
H3 histone, family 3A
|
|
chr4_-_2935851
|
1.905
|
NM_001120
|
MFSD10
|
major facilitator superfamily domain containing 10
|
|
chr14_-_92302612
|
1.897
|
NM_001128595
NM_152332
|
TC2N
|
tandem C2 domains, nuclear
|
|
chr1_-_154155685
|
1.890
|
|
TPM3
|
tropomyosin 3
|
|
chr1_-_33815411
|
1.889
|
|
PHC2
|
polyhomeotic homolog 2 (Drosophila)
|
|
chr19_-_2038937
|
1.887
|
|
MKNK2
|
MAP kinase interacting serine/threonine kinase 2
|
|
chr9_+_95858449
|
1.886
|
NM_032310
|
C9orf89
|
chromosome 9 open reading frame 89
|
|
chr1_-_33168356
|
1.884
|
NM_001161708
NM_030786
|
SYNC
|
syncoilin, intermediate filament protein
|
|
chr7_-_128049959
|
1.883
|
|
IMPDH1
|
IMP (inosine 5'-monophosphate) dehydrogenase 1
|
|
chr7_+_97910978
|
1.868
|
NM_001159491
NM_015379
|
BRI3
|
brain protein I3
|
|
chr3_+_38207247
|
1.867
|
|
OXSR1
|
oxidative-stress responsive 1
|
|
chr8_+_26149080
|
1.865
|
|
PPP2R2A
|
protein phosphatase 2, regulatory subunit B, alpha
|
|
chr8_-_12990502
|
1.865
|
|
DLC1
|
deleted in liver cancer 1
|
|
chr19_+_6739697
|
1.864
|
NM_004240
|
TRIP10
|
thyroid hormone receptor interactor 10
|
|
chr17_+_7239847
|
1.864
|
NM_014716
|
ACAP1
|
ArfGAP with coiled-coil, ankyrin repeat and PH domains 1
|
|
chr1_+_29213569
|
1.858
|
NM_001166005
NM_001166007
NM_004437
NM_203342
NM_203343
|
EPB41
|
erythrocyte membrane protein band 4.1 (elliptocytosis 1, RH-linked)
|
|
chr12_+_69004710
|
1.857
|
|
RAP1B
|
RAP1B, member of RAS oncogene family
|
|
chr19_+_7985884
|
1.856
|
|
SNAPC2
|
small nuclear RNA activating complex, polypeptide 2, 45kDa
|
|
chr9_+_127539382
|
1.855
|
NM_182487
|
OLFML2A
|
olfactomedin-like 2A
|
|
chr5_+_95998678
|
1.853
|
|
CAST
|
calpastatin
|
|
chr1_-_154155636
|
1.852
|
|
TPM3
|
tropomyosin 3
|
|
chr1_-_154155637
|
1.848
|
|
TPM3
|
tropomyosin 3
|
|
chr7_+_36192844
|
1.844
|
|
EEPD1
|
endonuclease/exonuclease/phosphatase family domain containing 1
|
|
chr12_+_69004684
|
1.838
|
|
RAP1B
|
RAP1B, member of RAS oncogene family
|
|
chr19_-_18632886
|
1.823
|
NM_006532
|
ELL
|
elongation factor RNA polymerase II
|
|
chr7_-_128045995
|
1.822
|
NM_001142573
NM_001142574
NM_001142575
|
IMPDH1
|
IMP (inosine 5'-monophosphate) dehydrogenase 1
|
|
chrX_-_1572648
|
1.819
|
NM_001173473
|
ASMTL
|
acetylserotonin O-methyltransferase-like
|
|
chr16_-_67281393
|
1.810
|
|
FHOD1
|
formin homology 2 domain containing 1
|
|
chr12_-_122231554
|
1.808
|
NM_019034
|
RHOF
|
ras homolog gene family, member F (in filopodia)
|
|
chr12_-_48298765
|
1.808
|
NM_000376
NM_001017535
NM_001017536
|
VDR
|
vitamin D (1,25- dihydroxyvitamin D3) receptor
|
|
chr1_+_2487803
|
1.805
|
NM_003820
|
TNFRSF14
|
tumor necrosis factor receptor superfamily, member 14
|
|
chr11_-_64014264
|
1.798
|
|
PPP1R14B
|
protein phosphatase 1, regulatory (inhibitor) subunit 14B
|
|
chr20_-_56884488
|
1.796
|
|
PPP4R1L
|
protein phosphatase 4, regulatory subunit 1-like
|
|
chr16_+_29817810
|
1.787
|
NM_001042539
NM_002383
|
MAZ
|
MYC-associated zinc finger protein (purine-binding transcription factor)
|
|
chr1_+_12227050
|
1.784
|
NM_001066
|
TNFRSF1B
|
tumor necrosis factor receptor superfamily, member 1B
|
|
chr22_+_50354428
|
1.783
|
|
PIM3
|
pim-3 oncogene
|
|
chr16_-_88752879
|
1.782
|
NM_178310
|
SNAI3
|
snail homolog 3 (Drosophila)
|
|
chr6_-_41702734
|
1.782
|
NM_007162
|
TFEB
|
transcription factor EB
|
|
chr11_+_2466171
|
1.781
|
NM_000218
|
KCNQ1
|
potassium voltage-gated channel, KQT-like subfamily, member 1
|
|
chr4_-_2935650
|
1.770
|
|
MFSD10
|
major facilitator superfamily domain containing 10
|
|
chrY_-_1522648
|
1.769
|
NM_001173473
|
ASMTL
|
acetylserotonin O-methyltransferase-like
|
|
chr6_-_30654978
|
1.767
|
|
PPP1R18
|
protein phosphatase 1, regulatory subunit 18
|
|
chr12_-_58240217
|
1.767
|
|
CTDSP2
|
CTD (carboxy-terminal domain, RNA polymerase II, polypeptide A) small phosphatase 2
|