|
chr1_+_196743929
|
12.183
|
NM_001166624
NM_021023
|
CFHR3
|
complement factor H-related 3
|
|
chr1_+_196857143
|
12.074
|
NM_001201550
NM_001201551
NM_006684
|
CFHR4
|
complement factor H-related 4
|
|
chr4_+_74270832
|
10.823
|
|
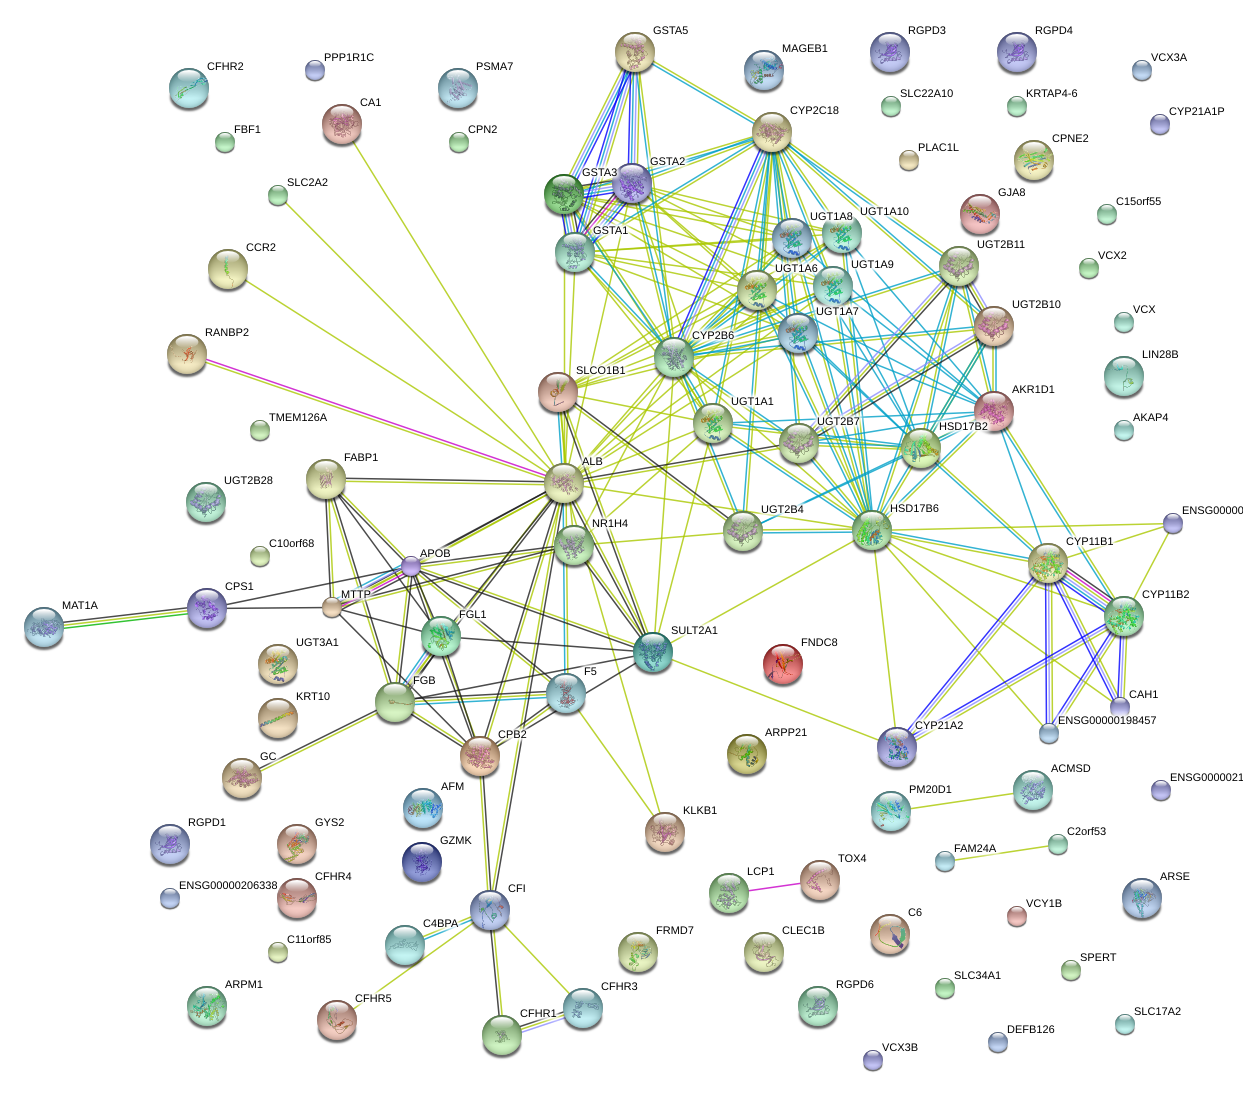
ALB
|
albumin
|
|
chr1_+_196946666
|
10.448
|
NM_030787
|
CFHR5
|
complement factor H-related 5
|
|
chr4_+_155484131
|
10.233
|
NM_001184741
NM_005141
|
FGB
|
fibrinogen beta chain
|
|
chr4_+_69681709
|
9.700
|
NM_001075
NM_001144767
|
UGT2B10
|
UDP glucuronosyltransferase 2 family, polypeptide B10
|
|
chr4_+_74269971
|
8.077
|
NM_000477
|
ALB
|
albumin
|
|
chr1_+_196912910
|
7.808
|
NM_005666
|
CFHR2
|
complement factor H-related 2
|
|
chr3_-_170744458
|
7.526
|
|
SLC2A2
|
solute carrier family 2 (facilitated glucose transporter), member 2
|
|
chr8_-_17752847
|
7.400
|
NM_147203
NM_201553
NM_004467
NM_201552
|
FGL1
|
fibrinogen-like 1
|
|
chr7_+_137761177
|
7.012
|
NM_001190906
NM_001190907
NM_005989
|
AKR1D1
|
aldo-keto reductase family 1, member D1 (delta 4-3-ketosteroid-5-beta-reductase)
|
|
chr5_-_41213513
|
6.983
|
NM_000065
|
C6
|
complement component 6
|
|
chr2_-_88427535
|
6.814
|
NM_001443
|
FABP1
|
fatty acid binding protein 1, liver
|
|
chr19_-_48389514
|
6.670
|
|
SULT2A1
|
sulfotransferase family, cytosolic, 2A, dehydroepiandrosterone (DHEA)-preferring, member 1
|
|
chr4_+_74281884
|
6.394
|
|
ALB
|
albumin
|
|
chr2_+_234668914
|
5.932
|
NM_000463
|
UGT1A1
|
UDP glucuronosyltransferase 1 family, polypeptide A1
|
|
chr2_-_88285308
|
5.681
|
NM_001024457
|
RGPD1
|
RANBP2-like and GRIP domain containing 1
|
|
chr11_+_59807747
|
5.639
|
NM_173801
|
PLAC1L
|
placenta-specific 1-like
|
|
chr2_+_211458078
|
5.367
|
NM_001122634
|
CPS1
|
carbamoyl-phosphate synthase 1, mitochondrial
|
|
chr3_-_170744529
|
4.980
|
|
SLC2A2
|
solute carrier family 2 (facilitated glucose transporter), member 2
|
|
chr1_+_207277577
|
4.897
|
NM_000715
|
C4BPA
|
complement component 4 binding protein, alpha
|
|
chr12_-_10151689
|
4.563
|
NM_001099431
NM_016509
|
CLEC1B
|
C-type lectin domain family 1, member B
|
|
chr2_+_87144737
|
4.121
|
NM_001024457
|
RGPD1
|
RANBP2-like and GRIP domain containing 1
|
|
chr16_+_82068910
|
4.074
|
|
HSD17B2
|
hydroxysteroid (17-beta) dehydrogenase 2
|
|
chr12_+_57157091
|
4.072
|
NM_003725
|
HSD17B6
|
hydroxysteroid (17-beta) dehydrogenase 6 homolog (mouse)
|
|
chr6_-_52628272
|
4.066
|
NM_000846
|
GSTA2
|
glutathione S-transferase alpha 2
|
|
chr2_-_27362277
|
4.016
|
NM_178553
|
C2orf53
|
chromosome 2 open reading frame 53
|
|
chr16_+_82068830
|
4.002
|
NM_002153
|
HSD17B2
|
hydroxysteroid (17-beta) dehydrogenase 2
|
|
chr1_+_196788860
|
3.962
|
NM_002113
|
CFHR1
|
complement factor H-related 1
|
|
chr11_+_63057371
|
3.957
|
NM_001039752
|
SLC22A10
|
solute carrier family 22, member 10
|
|
chr2_+_135596185
|
3.915
|
NM_138326
|
ACMSD
|
aminocarboxymuconate semialdehyde decarboxylase
|
|
chr4_+_74347461
|
3.895
|
NM_001133
|
AFM
|
afamin
|
|
chr2_-_21225640
|
3.830
|
|
APOB
|
apolipoprotein B (including Ag(x) antigen)
|
|
chrX_-_2882288
|
3.520
|
NM_000047
|
ARSE
|
arylsulfatase E (chondrodysplasia punctata 1)
|
|
chr20_+_123230
|
3.500
|
NM_030931
|
DEFB126
|
defensin, beta 126
|
|
chr12_+_100867739
|
3.439
|
|
NR1H4
|
nuclear receptor subfamily 1, group H, member 4
|
|
chr12_+_21284127
|
3.433
|
NM_006446
|
SLCO1B1
|
solute carrier organic anion transporter family, member 1B1
|
|
chr10_+_96443250
|
3.400
|
NM_000772
NM_001128925
|
CYP2C18
|
cytochrome P450, family 2, subfamily C, polypeptide 18
|
|
chr5_-_35991343
|
3.249
|
NM_152404
|
UGT3A1
|
UDP glycosyltransferase 3 family, polypeptide A1
|
|
chr4_+_74286846
|
3.247
|
|
ALB
|
albumin
|
|
chr4_-_72669757
|
3.159
|
NM_001204307
|
GC
|
group-specific component (vitamin D binding protein)
|
|
chr13_-_46679143
|
3.072
|
NM_001872
NM_016413
|
CPB2
|
carboxypeptidase B2 (plasma)
|
|
chr13_+_46276445
|
2.997
|
NM_152719
|
SPERT
|
spermatid associated
|
|
chrX_-_49965657
|
2.977
|
NM_003886
|
AKAP4
|
A kinase (PRKA) anchor protein 4
|
|
chr5_+_54320083
|
2.950
|
NM_002104
|
GZMK
|
granzyme K (granzyme 3; tryptase II)
|
|
chrX_-_131261871
|
2.908
|
NM_194277
|
FRMD7
|
FERM domain containing 7
|
|
chr17_+_33448597
|
2.788
|
NM_017559
|
FNDC8
|
fibronectin type III domain containing 8
|
|
chr6_-_52668599
|
2.728
|
NM_145740
|
GSTA1
|
glutathione S-transferase alpha 1
|
|
chrX_+_7810302
|
2.669
|
NM_013452
|
VCX
|
variable charge, X-linked
|
|
chr4_+_100495972
|
2.652
|
|
MTTP
|
microsomal triglyceride transfer protein
|
|
chr10_+_32856650
|
2.648
|
NM_024688
|
C10orf68
|
chromosome 10 open reading frame 68
|
|
chr4_-_110723334
|
2.595
|
NM_000204
|
CFI
|
complement factor I
|
|
chrX_-_49965003
|
2.575
|
NM_139289
|
AKAP4
|
A kinase (PRKA) anchor protein 4
|
|
chrX_+_30261847
|
2.574
|
NM_002363
NM_177415
|
MAGEB1
|
melanoma antigen family B, 1
|
|
chr2_+_182850550
|
2.566
|
NM_001080545
|
PPP1R1C
|
protein phosphatase 1, regulatory (inhibitor) subunit 1C
|
|
chr3_+_108855560
|
2.557
|
|
FLJ22763
|
uncharacterized LOC401081
|
|
chr4_-_70080448
|
2.532
|
NM_001073
|
UGT2B11
UGT2B10
|
UDP glucuronosyltransferase 2 family, polypeptide B11
UDP glucuronosyltransferase 2 family, polypeptide B10
|
|
chr2_+_234545099
|
2.513
|
NM_019075
|
UGT1A10
|
UDP glucuronosyltransferase 1 family, polypeptide A10
|
|
chr8_-_86253863
|
2.421
|
NM_001164830
|
CA1
|
carbonic anhydrase I
|
|
chr6_+_105404922
|
2.400
|
NM_001004317
|
LIN28B
|
lin-28 homolog B (C. elegans)
|
|
chr3_-_169487602
|
2.395
|
NM_032487
|
ARPM1
|
actin related protein M1
|
|
chr3_-_194072004
|
2.315
|
NM_001080513
|
CPN2
|
carboxypeptidase N, polypeptide 2
|
|
chr6_-_25930838
|
2.229
|
NM_005835
|
SLC17A2
|
solute carrier family 17 (sodium phosphate), member 2
|
|
chr11_-_64727608
|
2.228
|
NM_001037225
|
C11orf85
|
chromosome 11 open reading frame 85
|
|
chr3_+_46395224
|
2.215
|
NM_001123041
NM_001123396
|
CCR2
|
chemokine (C-C motif) receptor 2
|
|
chr12_-_21757752
|
2.172
|
NM_021957
|
GYS2
|
glycogen synthase 2 (liver)
|
|
chr17_-_38978824
|
2.163
|
NM_000421
|
KRT10
|
keratin 10
|
|
chr4_+_187148624
|
2.150
|
NM_000892
|
KLKB1
|
kallikrein B, plasma (Fletcher factor) 1
|
|
chr1_-_169555624
|
2.130
|
|
F5
|
coagulation factor V (proaccelerin, labile factor)
|
|
chr19_+_45116921
|
2.126
|
NM_001205280
|
IGSF23
|
immunoglobulin superfamily, member 23
|
|
chr15_+_34638065
|
2.124
|
NM_175741
|
C15orf55
|
chromosome 15 open reading frame 55
|
|
chr1_+_147374945
|
2.049
|
NM_005267
|
GJA8
|
gap junction protein, alpha 8, 50kDa
|
|
chr19_+_41515495
|
2.022
|
|
CYP2B6
|
cytochrome P450, family 2, subfamily B, polypeptide 6
|
|
chr10_+_124670216
|
2.015
|
NM_001029888
|
FAM24A
|
family with sequence similarity 24, member A
|
|
chr10_-_82049178
|
2.015
|
NM_000429
|
MAT1A
|
methionine adenosyltransferase I, alpha
|
|
chr13_-_46756291
|
2.004
|
|
LCP1
|
lymphocyte cytosolic protein 1 (L-plastin)
|
|
chr9_-_123812535
|
1.999
|
NM_001735
|
C5
|
complement component 5
|
|
chrX_-_141293056
|
1.985
|
NM_016249
|
MAGEC2
|
melanoma antigen family C, 2
|
|
chr4_-_70518964
|
1.981
|
NM_001252274
NM_001252275
NM_006798
|
UGT2A1
|
UDP glucuronosyltransferase 2 family, polypeptide A1, complex locus
|
|
chr15_-_55562483
|
1.977
|
NM_183234
NM_004580
|
RAB27A
|
RAB27A, member RAS oncogene family
|
|
chr12_+_111471827
|
1.972
|
NM_015267
|
CUX2
|
cut-like homeobox 2
|
|
chr3_+_107096187
|
1.952
|
NM_032600
|
CCDC54
|
coiled-coil domain containing 54
|
|
chr6_+_47749774
|
1.948
|
NM_181744
|
OPN5
|
opsin 5
|
|
chr6_+_131894343
|
1.899
|
NM_000045
NM_001244438
|
ARG1
|
arginase, liver
|
|
chr4_-_100273831
|
1.858
|
NM_000669
|
ADH1C
|
alcohol dehydrogenase 1C (class I), gamma polypeptide
|
|
chr5_-_93077196
|
1.826
|
NM_153216
|
POU5F2
|
POU domain class 5, transcription factor 2
|
|
chr13_+_49684388
|
1.812
|
NM_014923
|
FNDC3A
|
fibronectin type III domain containing 3A
|
|
chr4_-_70505359
|
1.810
|
NM_001105677
|
UGT2A2
|
UDP glucuronosyltransferase 2 family, polypeptide A2
|
|
chr3_+_142342265
|
1.807
|
NM_002670
|
PLS1
|
plastin 1
|
|
chr9_-_36276930
|
1.785
|
NM_001128227
NM_001190388
|
GNE
|
glucosamine (UDP-N-acetyl)-2-epimerase/N-acetylmannosamine kinase
|
|
chr20_-_170263
|
1.765
|
NM_001037732
|
DEFB128
|
defensin, beta 128
|
|
chr20_+_5987897
|
1.763
|
NM_001127458
|
CRLS1
|
cardiolipin synthase 1
|
|
chr1_+_186265404
|
1.742
|
NM_001127708
NM_001127709
NM_001127710
NM_005807
|
PRG4
|
proteoglycan 4
|
|
chrY_-_20935503
|
1.737
|
NM_001001877
NM_153716
NM_152584
NM_033108
|
HSFY2
HSFY1
|
heat shock transcription factor, Y linked 2
heat shock transcription factor, Y-linked 1
|
|
chr19_-_53794874
|
1.733
|
NM_033341
|
BIRC8
|
baculoviral IAP repeat containing 8
|
|
chr6_-_49844808
|
1.727
|
NM_001205220
|
CRISP1
|
cysteine-rich secretory protein 1
|
|
chr3_+_51895644
|
1.695
|
NM_203424
|
IQCF2
|
IQ motif containing F2
|
|
chr4_-_103998169
|
1.673
|
NM_178833
|
SLC9B2
|
solute carrier family 9, subfamily B (cation proton antiporter 2), member 2
|
|
chr10_-_101841593
|
1.669
|
NM_001308
|
CPN1
|
carboxypeptidase N, polypeptide 1
|
|
chrX_-_8139307
|
1.658
|
NM_016378
|
VCX2
|
variable charge, X-linked 2
|
|
chr10_+_5238756
|
1.627
|
NM_001818
|
AKR1C4
|
aldo-keto reductase family 1, member C4 (chlordecone reductase; 3-alpha hydroxysteroid dehydrogenase, type I; dihydrodiol dehydrogenase 4)
|
|
chr10_+_15085894
|
1.624
|
NM_001039702
NM_018324
|
OLAH
|
oleoyl-ACP hydrolase
|
|
chr6_-_41168923
|
1.588
|
NM_024807
|
TREML2
|
triggering receptor expressed on myeloid cells-like 2
|
|
chrY_+_20708556
|
1.583
|
NM_153716
NM_001001877
NM_033108
NM_152584
|
HSFY2
HSFY1
|
heat shock transcription factor, Y linked 2
heat shock transcription factor, Y-linked 1
|
|
chr7_-_141957846
|
1.573
|
NM_001001317
|
PRSS58
|
protease, serine, 58
|
|
chr8_+_67039130
|
1.557
|
NM_033058
NM_184085
NM_184086
NM_184087
|
TRIM55
|
tripartite motif containing 55
|
|
chr9_-_74675498
|
1.515
|
NM_001128618
|
C9orf57
|
chromosome 9 open reading frame 57
|
|
chr3_+_148447966
|
1.514
|
NM_032049
|
AGTR1
|
angiotensin II receptor, type 1
|
|
chr16_-_48266181
|
1.498
|
NM_033151
|
ABCC11
|
ATP-binding cassette, sub-family C (CFTR/MRP), member 11
|
|
chrX_-_127186339
|
1.478
|
NM_138289
|
ACTRT1
|
actin-related protein T1
|
|
chr12_+_113344811
|
1.474
|
|
OAS1
|
2'-5'-oligoadenylate synthetase 1, 40/46kDa
|
|
chr15_+_38227456
|
1.450
|
NM_152453
|
TMCO5A
|
transmembrane and coiled-coil domains 5A
|
|
chr3_-_197300193
|
1.443
|
NM_203315
|
BDH1
|
3-hydroxybutyrate dehydrogenase, type 1
|
|
chr13_-_46756295
|
1.443
|
|
LCP1
|
lymphocyte cytosolic protein 1 (L-plastin)
|
|
chr1_+_171060017
|
1.437
|
NM_001002294
NM_006894
|
FMO3
|
flavin containing monooxygenase 3
|
|
chr7_-_99277518
|
1.420
|
NM_000777
NM_001190484
|
CYP3A5
|
cytochrome P450, family 3, subfamily A, polypeptide 5
|
|
chr9_-_100707102
|
1.418
|
NM_018437
|
HEMGN
|
hemogen
|
|
chr4_-_100212085
|
1.401
|
NM_000667
|
ADH1A
|
alcohol dehydrogenase 1A (class I), alpha polypeptide
|
|
chr4_+_71108304
|
1.384
|
NM_005212
|
CSN3
|
casein kappa
|
|
chrX_-_49460568
|
1.380
|
NM_003785
|
PAGE1
|
P antigen family, member 1 (prostate associated)
|
|
chr15_-_45670624
|
1.369
|
|
GATM
|
glycine amidinotransferase (L-arginine:glycine amidinotransferase)
|
|
chrX_-_139047676
|
1.361
|
NM_001013403
|
CXorf66
|
chromosome X open reading frame 66
|
|
chr17_+_18647325
|
1.350
|
NM_031456
|
FBXW10
|
F-box and WD repeat domain containing 10
|
|
chr4_+_187187117
|
1.349
|
NM_000128
|
F11
|
coagulation factor XI
|
|
chr4_-_100242487
|
1.347
|
NM_000668
|
ADH1A
ADH1B
|
alcohol dehydrogenase 1A (class I), alpha polypeptide
alcohol dehydrogenase 1B (class I), beta polypeptide
|
|
chr3_+_142375738
|
1.318
|
NM_001172312
|
PLS1
|
plastin 1
|
|
chr21_-_33957746
|
1.315
|
NM_144659
|
TCP10L
|
t-complex 10 (mouse)-like
|
|
chr2_-_21233930
|
1.312
|
|
APOB
|
apolipoprotein B (including Ag(x) antigen)
|
|
chr4_-_83347222
|
1.310
|
|
HNRPDL
|
heterogeneous nuclear ribonucleoprotein D-like
|
|
chr3_+_113616317
|
1.306
|
NM_001172105
|
GRAMD1C
|
GRAM domain containing 1C
|
|
chr12_-_23737507
|
1.300
|
NM_178010
|
SOX5
|
SRY (sex determining region Y)-box 5
|
|
chr1_+_172389827
|
1.297
|
NM_139240
|
C1orf105
|
chromosome 1 open reading frame 105
|
|
chr11_+_17332454
|
1.295
|
|
|
|
|
chr6_-_75965845
|
1.295
|
|
TMEM30A
|
transmembrane protein 30A
|
|
chr22_-_40289793
|
1.293
|
NM_152512
|
ENTHD1
|
ENTH domain containing 1
|
|
chr17_+_53828339
|
1.283
|
NM_021213
|
PCTP
|
phosphatidylcholine transfer protein
|
|
chr17_+_27369917
|
1.277
|
NM_016518
|
PIPOX
|
pipecolic acid oxidase
|
|
chr18_-_3011944
|
1.271
|
NM_014646
|
LPIN2
|
lipin 2
|
|
chr13_-_99910548
|
1.269
|
NM_001098200
NM_005292
|
GPR18
|
G protein-coupled receptor 18
|
|
chr1_-_162346579
|
1.260
|
NM_182581
|
C1orf111
|
chromosome 1 open reading frame 111
|
|
chr15_+_45248902
|
1.255
|
NM_152448
|
C15orf43
|
chromosome 15 open reading frame 43
|
|
chr12_+_113344738
|
1.254
|
NM_001032409
NM_002534
NM_016816
|
OAS1
|
2'-5'-oligoadenylate synthetase 1, 40/46kDa
|
|
chr7_-_88425030
|
1.252
|
NM_152706
|
C7orf62
|
chromosome 7 open reading frame 62
|
|
chr3_+_122296432
|
1.250
|
NM_001113523
|
PARP15
|
poly (ADP-ribose) polymerase family, member 15
|
|
chr4_-_48136245
|
1.244
|
NM_003328
|
TXK
|
TXK tyrosine kinase
|
|
chr12_-_48963802
|
1.244
|
NM_002289
|
LALBA
|
lactalbumin, alpha-
|
|
chr20_+_138121
|
1.241
|
NM_139074
|
DEFB127
|
defensin, beta 127
|
|
chr9_-_104147261
|
1.241
|
NM_001701
|
BAAT
|
bile acid CoA: amino acid N-acyltransferase (glycine N-choloyltransferase)
|
|
chr12_-_50790391
|
1.239
|
NM_001145475
|
FAM186A
|
family with sequence similarity 186, member A
|
|
chr11_-_16430425
|
1.218
|
NM_001145811
|
SOX6
|
SRY (sex determining region Y)-box 6
|
|
chr2_-_21252786
|
1.204
|
|
APOB
|
apolipoprotein B (including Ag(x) antigen)
|
|
chrX_+_55101503
|
1.201
|
NM_001015038
|
PAGE2B
|
P antigen family, member 2B
|
|
chr9_+_111624545
|
1.188
|
NM_006687
|
ACTL7A
|
actin-like 7A
|
|
chr1_+_182419255
|
1.182
|
NM_001137669
|
RGSL1
|
regulator of G-protein signaling like 1
|
|
chr4_+_100432160
|
1.179
|
NM_032149
|
C4orf17
|
chromosome 4 open reading frame 17
|
|
chr12_+_10124007
|
1.174
|
NM_138337
NM_201623
|
CLEC12A
CLEC12B
|
C-type lectin domain family 12, member A
C-type lectin domain family 12, member B
|
|
chr3_+_38347426
|
1.171
|
NM_004803
|
SLC22A14
|
solute carrier family 22, member 14
|
|
chr10_+_101542554
|
1.166
|
|
ABCC2
|
ATP-binding cassette, sub-family C (CFTR/MRP), member 2
|
|
chrY_+_16635625
|
1.163
|
NM_014893
|
NLGN4Y
|
neuroligin 4, Y-linked
|
|
chrX_+_2984839
|
1.154
|
NM_004042
|
ARSF
|
arylsulfatase F
|
|
chr17_-_34313685
|
1.138
|
NM_032962
NM_032963
|
CCL14
|
chemokine (C-C motif) ligand 14
|
|
chr6_-_49834188
|
1.137
|
NM_001131
NM_170609
|
CRISP1
|
cysteine-rich secretory protein 1
|
|
chr16_+_82068958
|
1.136
|
|
HSD17B2
|
hydroxysteroid (17-beta) dehydrogenase 2
|
|
chr6_+_131958441
|
1.135
|
NM_005021
|
ENPP3
|
ectonucleotide pyrophosphatase/phosphodiesterase 3
|
|
chr13_-_46756326
|
1.133
|
NM_002298
|
LCP1
|
lymphocyte cytosolic protein 1 (L-plastin)
|
|
chr4_-_77328457
|
1.117
|
NM_001042784
|
CCDC158
|
coiled-coil domain containing 158
|
|
chr2_+_79347610
|
1.116
|
|
REG1A
|
regenerating islet-derived 1 alpha
|
|
chr2_-_165478357
|
1.113
|
NM_004490
|
GRB14
|
growth factor receptor-bound protein 14
|
|
chr10_-_50342052
|
1.108
|
NM_001164484
|
FAM170B
|
family with sequence similarity 170, member B
|
|
chrX_-_131547536
|
1.108
|
NM_001170701
NM_001170702
NM_001170703
|
MBNL3
|
muscleblind-like 3 (Drosophila)
|
|
chr3_+_186714335
|
1.105
|
|
|
|
|
chr19_+_43892762
|
1.091
|
NM_031451
|
TEX101
|
testis expressed 101
|
|
chrX_+_55115496
|
1.087
|
NM_207339
|
PAGE2
|
P antigen family, member 2 (prostate associated)
|
|
chr7_+_37779995
|
1.066
|
NM_181791
|
GPR141
|
G protein-coupled receptor 141
|
|
chr14_-_95599794
|
1.046
|
NM_001195573
|
DICER1
|
dicer 1, ribonuclease type III
|
|
chr2_-_21228189
|
1.031
|
|
APOB
|
apolipoprotein B (including Ag(x) antigen)
|
|
chr5_-_121814781
|
1.029
|
|
|
|
|
chr11_+_69061599
|
1.027
|
NM_138768
|
MYEOV
|
myeloma overexpressed (in a subset of t(11;14) positive multiple myelomas)
|
|
chr3_+_57094468
|
1.023
|
NM_181727
|
SPATA12
|
spermatogenesis associated 12
|
|
chr13_+_32313678
|
1.014
|
NM_001166058
NM_130806
|
RXFP2
|
relaxin/insulin-like family peptide receptor 2
|
|
chr4_+_41983712
|
1.005
|
NM_001029955
|
DCAF4L1
|
DDB1 and CUL4 associated factor 4-like 1
|
|
chr16_+_67381252
|
0.983
|
NM_001161575
|
LRRC36
|
leucine rich repeat containing 36
|
|
chr1_-_144364203
|
0.975
|
NM_178230
NM_001143883
NM_001135789
|
PPIAL4A
PPIAL4G
PPIAL4B
PPIAL4C
|
peptidylprolyl isomerase A (cyclophilin A)-like 4A
peptidylprolyl isomerase A (cyclophilin A)-like 4G
peptidylprolyl isomerase A (cyclophilin A)-like 4B
peptidylprolyl isomerase A (cyclophilin A)-like 4C
|
|
chr2_+_79347487
|
0.975
|
NM_002909
|
REG1A
|
regenerating islet-derived 1 alpha
|
|
chr20_+_30102261
|
0.973
|
|
HM13
|
histocompatibility (minor) 13
|
|
chr12_-_371994
|
0.967
|
NM_001190997
NM_001243392
NM_016615
|
SLC6A13
|
solute carrier family 6 (neurotransmitter transporter, GABA), member 13
|
|
chr16_-_28620648
|
0.955
|
NM_177530
NM_177534
|
SULT1A1
|
sulfotransferase family, cytosolic, 1A, phenol-preferring, member 1
|
|
chr1_+_149553002
|
0.946
|
NM_178230
NM_001143883
NM_001135789
|
PPIAL4A
PPIAL4G
PPIAL4B
PPIAL4C
|
peptidylprolyl isomerase A (cyclophilin A)-like 4A
peptidylprolyl isomerase A (cyclophilin A)-like 4G
peptidylprolyl isomerase A (cyclophilin A)-like 4B
peptidylprolyl isomerase A (cyclophilin A)-like 4C
|
|
chr14_+_89060729
|
0.944
|
NM_207662
|
ZC3H14
|
zinc finger CCCH-type containing 14
|
|
chr6_+_144185572
|
0.937
|
NM_001013623
|
C6orf94
|
chromosome 6 open reading frame 94
|
|
chr3_-_121379701
|
0.929
|
|
HCLS1
|
hematopoietic cell-specific Lyn substrate 1
|
|
chr4_+_166131170
|
0.926
|
NM_001161521
NM_001161522
|
KLHL2
|
kelch-like 2, Mayven (Drosophila)
|
|
chr3_+_128779609
|
0.922
|
NM_000174
|
GP9
|
glycoprotein IX (platelet)
|
|
chrX_+_66788682
|
0.922
|
NM_001011645
|
AR
|
androgen receptor
|
|
chr2_-_216245573
|
0.918
|
|
FN1
|
fibronectin 1
|
|
chr9_+_125033126
|
0.917
|
NM_199177
|
MRRF
|
mitochondrial ribosome recycling factor
|
|
chr6_-_22297729
|
0.916
|
NM_000948
|
PRL
|
prolactin
|
|
chr4_+_175839508
|
0.910
|
NM_001130703
NM_001130704
NM_001130705
NM_014269
|
ADAM29
|
ADAM metallopeptidase domain 29
|
|
chr22_+_32753853
|
0.902
|
NM_001098535
|
RFPL3
|
ret finger protein-like 3
|
|
chr6_+_50681256
|
0.886
|
NM_172238
|
TFAP2D
|
transcription factor AP-2 delta (activating enhancer binding protein 2 delta)
|