|
chr21_-_43916298
|
37.556
|
NM_080860
|
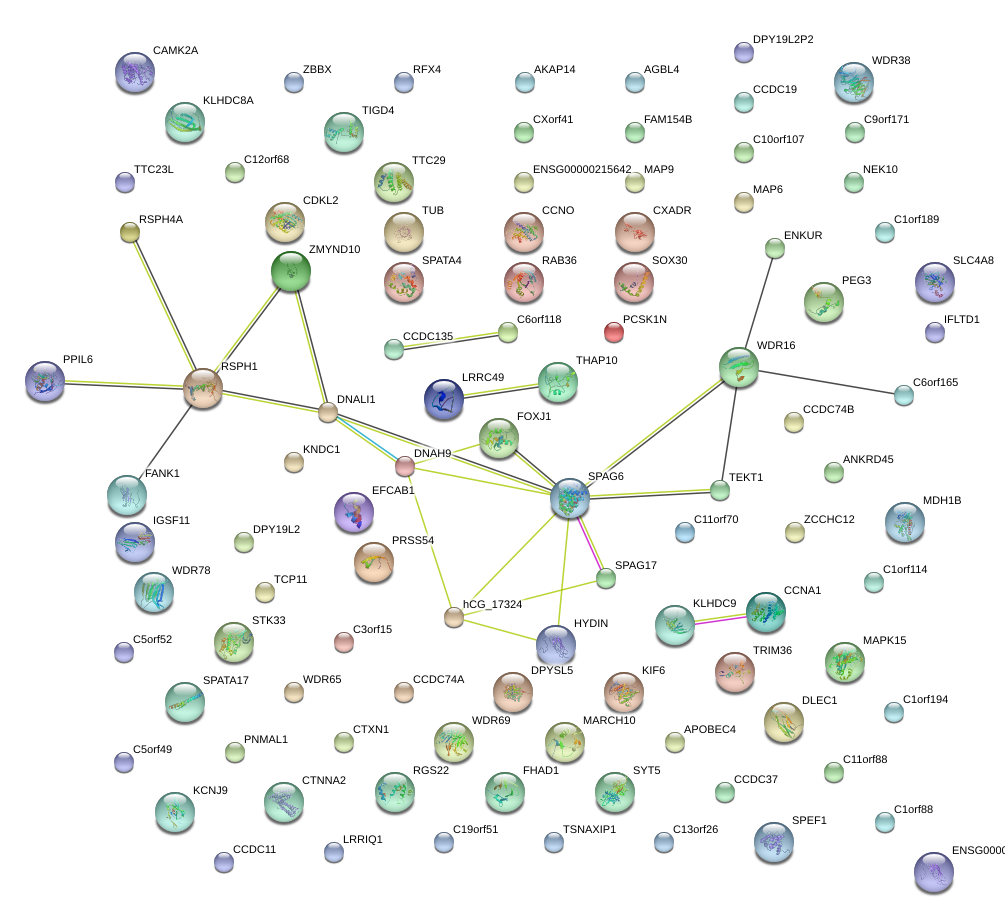
RSPH1
|
radial spoke head 1 homolog (Chlamydomonas)
|
|
chr17_-_74137370
|
37.025
|
NM_001454
|
FOXJ1
|
forkhead box J1
|
|
chr1_-_169396654
|
34.443
|
NM_021179
|
C1orf114
|
chromosome 1 open reading frame 114
|
|
chr5_+_34839268
|
34.219
|
NM_144725
|
TTC23L
|
tetratricopeptide repeat domain 23-like
|
|
chr1_-_109656478
|
33.594
|
NM_001122961
|
C1orf194
|
chromosome 1 open reading frame 194
|
|
chr15_+_71184781
|
29.935
|
NM_001199017
NM_017691
NM_001199018
|
LRRC49
|
leucine rich repeat containing 49
|
|
chr17_-_60885650
|
24.381
|
NM_152598
|
MARCH10
|
membrane-associated ring finger (C3HC4) 10
|
|
chr1_-_159869897
|
23.677
|
NM_012337
|
CCDC19
|
coiled-coil domain containing 19
|
|
chr1_+_161068150
|
23.133
|
NM_001007255
NM_152366
|
KLHDC9
|
kelch domain containing 9
|
|
chr11_-_75379113
|
22.828
|
|
MAP6
|
microtubule-associated protein 6
|
|
chr5_-_157098444
|
22.700
|
|
SOX30
|
SRY (sex determining region Y)-box 30
|
|
chrX_-_48693934
|
22.067
|
NM_013271
|
PCSK1N
|
proprotein convertase subtilisin/kexin type 1 inhibitor
|
|
chr11_+_8060179
|
20.918
|
NM_003320
|
TUB
|
tubby homolog (mouse)
|
|
chr2_+_120302024
|
20.538
|
NM_001029996
|
PCDP1
|
primary ciliary dyskinesia protein 1
|
|
chr1_-_118727780
|
20.311
|
NM_206996
|
SPAG17
|
sperm associated antigen 17
|
|
chr11_-_75379414
|
19.977
|
NM_033063
NM_207577
|
MAP6
|
microtubule-associated protein 6
|
|
chr8_-_49647717
|
19.784
|
NM_001142857
NM_024593
|
EFCAB1
|
EF-hand calcium binding domain 1
|
|
chr4_-_177116713
|
19.564
|
NM_144644
|
SPATA4
|
spermatogenesis associated 4
|
|
chr4_-_153700892
|
19.283
|
NM_145720
|
TIGD4
|
tigger transposable element derived 4
|
|
chr10_+_22634373
|
19.262
|
NM_001253854
NM_001253855
NM_012443
NM_172242
|
SPAG6
|
sperm associated antigen 6
|
|
chr12_+_48577365
|
18.933
|
NM_001013635
|
C12orf68
|
chromosome 12 open reading frame 68
|
|
chr6_+_88117689
|
18.899
|
NM_001031743
|
C6orf165
|
chromosome 6 open reading frame 165
|
|
chr8_-_101118170
|
18.818
|
|
RGS22
|
regulator of G-protein signaling 22
|
|
chr16_+_84178864
|
18.519
|
NM_178452
|
DNAAF1
|
dynein, axonemal, assembly factor 1
|
|
chr15_-_71184611
|
18.504
|
NM_020147
|
THAP10
|
THAP domain containing 10
|
|
chr11_+_111385509
|
17.917
|
NM_001100388
NM_207430
|
C11orf88
|
chromosome 11 open reading frame 88
|
|
chr17_+_9479943
|
17.712
|
NM_001080556
NM_145054
|
WDR16
|
WD repeat domain 16
|
|
chr19_-_55690717
|
17.246
|
|
SYT5
|
synaptotagmin V
|
|
chr1_+_217804665
|
17.154
|
NM_138796
|
SPATA17
|
spermatogenesis associated 17
|
|
chr10_+_127585107
|
17.101
|
NM_145235
|
FANK1
|
fibronectin type III and ankyrin repeat domains 1
|
|
chr11_+_94245694
|
17.057
|
NM_001190462
|
LOC643037
|
uncharacterized LOC643037
|
|
chr2_+_228736326
|
16.992
|
NM_178821
|
WDR69
|
WD repeat domain 69
|
|
chr17_-_6735007
|
16.869
|
NM_053285
|
TEKT1
|
tektin 1
|
|
chr1_+_111889194
|
16.855
|
NM_181643
|
C1orf88
|
chromosome 1 open reading frame 88
|
|
chr1_-_173638970
|
16.750
|
NM_198493
|
ANKRD45
|
ankyrin repeat domain 45
|
|
chr4_-_76555570
|
16.590
|
NM_003948
|
CDKL2
|
cyclin-dependent kinase-like 2 (CDC2-related kinase)
|
|
chr13_+_37006408
|
16.588
|
NM_001111045
NM_003914
|
CCNA1
|
cyclin A1
|
|
chr12_+_85430098
|
16.560
|
NM_001079910
|
LRRIQ1
|
leucine-rich repeats and IQ motif containing 1
|
|
chr4_-_147866963
|
16.477
|
NM_031956
|
TTC29
|
tetratricopeptide repeat domain 29
|
|
chr10_+_63422718
|
16.441
|
NM_173554
|
C10orf107
|
chromosome 10 open reading frame 107
|
|
chrX_+_117957733
|
16.391
|
NM_173798
|
ZCCHC12
|
zinc finger, CCHC domain containing 12
|
|
chr11_-_8615412
|
16.353
|
NM_030906
|
STK33
|
serine/threonine kinase 33
|
|
chr16_+_67840976
|
16.194
|
NM_018430
|
TSNAXIP1
|
translin-associated factor X interacting protein 1
|
|
chr3_-_50383009
|
15.917
|
NM_015896
|
ZMYND10
|
zinc finger, MYND-type containing 10
|
|
chr9_-_135754163
|
15.906
|
NM_152572
|
AK8
|
adenylate kinase 8
|
|
chr16_-_71264557
|
15.873
|
NM_032821
NM_017558
|
HYDIN
|
hydrocephalus inducing homolog (mouse)
|
|
chr18_-_47792773
|
15.778
|
NM_145020
|
CCDC11
|
coiled-coil domain containing 11
|
|
chr19_-_46974663
|
15.505
|
|
PNMAL1
|
PNMA-like 1
|
|
chr5_-_149669400
|
15.482
|
NM_015981
NM_171825
|
CAMK2A
|
calcium/calmodulin-dependent protein kinase II alpha
|
|
chr13_+_31506809
|
15.417
|
NM_152325
|
C13orf26
|
chromosome 13 open reading frame 26
|
|
chr19_-_46974789
|
15.277
|
NM_001103149
NM_018215
|
PNMAL1
|
PNMA-like 1
|
|
chr6_-_43477980
|
15.220
|
|
LRRC73
|
leucine rich repeat containing 73
|
|
chr4_-_156297973
|
15.166
|
|
MAP9
|
microtubule-associated protein 9
|
|
chr5_-_7851255
|
15.040
|
NM_001089584
|
C5orf49
|
chromosome 5 open reading frame 49
|
|
chr1_-_154178783
|
14.913
|
NM_001010979
|
C1orf189
|
chromosome 1 open reading frame 189
|
|
chr3_-_167098070
|
14.858
|
NM_001199202
NM_001199201
NM_024687
|
ZBBX
|
zinc finger, B-box domain containing
|
|
chr20_-_3762060
|
14.814
|
NM_015417
|
SPEF1
|
sperm flagellar 1
|
|
chr19_-_57352055
|
14.472
|
NM_001146326
NM_001146327
NM_015363
NM_001146184
NM_001146185
NM_001146187
NM_006210
|
ZIM2
PEG3
|
zinc finger, imprinted 2
paternally expressed 3
|
|
chr5_-_114505549
|
14.280
|
|
TRIM36
|
tripartite motif containing 36
|
|
chr1_+_43638000
|
14.268
|
NM_001167965
NM_001195831
NM_152498
|
WDR65
|
WD repeat domain 65
|
|
chr9_+_127615695
|
14.090
|
NM_001045476
|
WDR38
|
WD repeat domain 38
|
|
chr6_-_35109003
|
13.994
|
NM_001093728
NM_018679
|
TCP11
|
t-complex 11 homolog (mouse)
|
|
chr4_-_156298094
|
13.942
|
NM_001039580
|
MAP9
|
microtubule-associated protein 9
|
|
chr16_+_57728711
|
13.913
|
NM_032269
|
CCDC135
|
coiled-coil domain containing 135
|
|
chr5_-_54529424
|
13.882
|
NM_021147
|
CCNO
|
cyclin O
|
|
chr5_-_149669187
|
13.843
|
|
CAMK2A
|
calcium/calmodulin-dependent protein kinase II alpha
|
|
chr19_-_7990974
|
13.792
|
NM_206833
|
CTXN1
|
cortexin 1
|
|
chr10_+_119806334
|
13.712
|
|
CASC2
|
cancer susceptibility candidate 2 (non-protein coding)
|
|
chr6_-_109761707
|
13.654
|
|
PPIL6
|
peptidylprolyl isomerase (cyclophilin)-like 6
|
|
chr6_-_165723074
|
13.596
|
NM_144980
|
C6orf118
|
chromosome 6 open reading frame 118
|
|
chr11_+_101918168
|
13.538
|
NM_001195005
NM_032930
|
C11orf70
|
chromosome 11 open reading frame 70
|
|
chr17_+_11501747
|
13.412
|
NM_001372
|
DNAH9
|
dynein, axonemal, heavy chain 9
|
|
chr22_+_23487512
|
13.256
|
NM_004914
|
RAB36
|
RAB36, member RAS oncogene family
|
|
chr2_-_130902568
|
12.989
|
NM_207310
|
CCDC74B
|
coiled-coil domain containing 74B
|
|
chr16_-_71264596
|
12.979
|
NM_001198542
NM_001198543
|
HYDIN
|
hydrocephalus inducing homolog (mouse)
|
|
chrX_+_106449861
|
12.882
|
NM_001169154
NM_173494
|
CXorf41
|
chromosome X open reading frame 41
|
|
chr2_+_79740059
|
12.783
|
NM_001164883
NM_004389
|
CTNNA2
|
catenin (cadherin-associated protein), alpha 2
|
|
chr2_+_27070962
|
12.640
|
NM_020134
NM_001253723
NM_001253724
|
DPYSL5
|
dihydropyrimidinase-like 5
|
|
chr12_+_51818592
|
12.508
|
NM_001039960
NM_004858
|
SLC4A8
|
solute carrier family 4, sodium bicarbonate cotransporter, member 8
|
|
chr22_+_31063914
|
12.447
|
|
|
|
|
chr12_+_106994914
|
12.420
|
NM_001206691
|
RFX4
|
regulatory factor X, 4 (influences HLA class II expression)
|
|
chr1_+_38022514
|
12.403
|
NM_003462
|
DNALI1
|
dynein, axonemal, light intermediate chain 1
|
|
chr8_-_101118343
|
12.398
|
NM_015668
|
RGS22
|
regulator of G-protein signaling 22
|
|
chr1_-_183622447
|
12.258
|
NM_203454
|
APOBEC4
|
apolipoprotein B mRNA editing enzyme, catalytic polypeptide-like 4 (putative)
|
|
chr10_-_25304865
|
12.153
|
NM_145010
|
ENKUR
|
enkurin, TRPC channel interacting protein
|
|
chr3_+_126113781
|
11.984
|
NM_182628
|
CCDC37
|
coiled-coil domain containing 37
|
|
chrX_+_119029799
|
11.971
|
NM_001008534
NM_001008535
NM_178813
|
AKAP14
|
A kinase (PRKA) anchor protein 14
|
|
chr3_-_118753665
|
11.966
|
NM_001015887
|
IGSF11
|
immunoglobulin superfamily, member 11
|
|
chr19_-_55677919
|
11.965
|
NM_178837
|
C19orf51
|
chromosome 19 open reading frame 51
|
|
chr11_-_75379651
|
11.944
|
|
MAP6
|
microtubule-associated protein 6
|
|
chr12_-_25706177
|
11.938
|
NM_152590
NM_001145728
NM_001145729
|
IFLTD1
|
intermediate filament tail domain containing 1
|
|
chr8_+_144798494
|
11.906
|
NM_139021
|
MAPK15
|
mitogen-activated protein kinase 15
|
|
chr3_-_27410852
|
11.904
|
NM_199347
|
NEK10
|
NIMA (never in mitosis gene a)- related kinase 10
|
|
chr6_+_116937641
|
11.870
|
NM_001010892
NM_001161664
|
RSPH4A
|
radial spoke head 4 homolog A (Chlamydomonas)
|
|
chr6_-_39693110
|
11.867
|
NM_145027
|
KIF6
|
kinesin family member 6
|
|
chr12_-_64062239
|
11.732
|
NM_173812
|
DPY19L2
|
dpy-19-like 2 (C. elegans)
|
|
chr1_-_205325915
|
11.704
|
NM_018203
|
KLHDC8A
|
kelch domain containing 8A
|
|
chr21_+_18885296
|
11.699
|
|
CXADR
|
coxsackie virus and adenovirus receptor
|
|
chr3_-_118753428
|
11.597
|
|
IGSF11
|
immunoglobulin superfamily, member 11
|
|
chr3_+_38080695
|
11.545
|
NM_007335
NM_007337
|
DLEC1
|
deleted in lung and esophageal cancer 1
|
|
chr7_-_102920665
|
11.370
|
|
DPY19L2P2
|
dpy-19-like 2 pseudogene 2 (C. elegans)
|
|
chr1_+_160051343
|
11.282
|
NM_004983
|
KCNJ9
|
potassium inwardly-rectifying channel, subfamily J, member 9
|
|
chr15_+_82555101
|
11.253
|
NM_001008226
|
FAM154B
|
family with sequence similarity 154, member B
|
|
chr9_+_135285610
|
11.249
|
NM_207417
|
C9orf171
|
chromosome 9 open reading frame 171
|
|
chr10_+_134973935
|
11.197
|
NM_152643
|
KNDC1
|
kinase non-catalytic C-lobe domain (KIND) containing 1
|
|
chr1_+_15573767
|
11.192
|
NM_052929
|
FHAD1
|
forkhead-associated (FHA) phosphopeptide binding domain 1
|
|
chr16_-_58328879
|
11.159
|
NM_001080492
|
PRSS54
|
protease, serine, 54
|
|
chr5_+_157098560
|
11.114
|
NM_001145132
|
C5orf52
|
chromosome 5 open reading frame 52
|
|
chr1_-_67390413
|
11.094
|
NM_024763
NM_207014
|
WDR78
|
WD repeat domain 78
|
|
chr17_-_5404304
|
11.062
|
NM_001162371
|
LOC728392
|
uncharacterized LOC728392
|
|
chr3_+_119421865
|
10.984
|
NM_033364
|
C3orf15
|
chromosome 3 open reading frame 15
|
|
chr1_-_50489489
|
10.982
|
|
AGBL4
|
ATP/GTP binding protein-like 4
|
|
chr2_+_132285469
|
10.978
|
NM_138770
|
CCDC74A
|
coiled-coil domain containing 74A
|
|
chr2_-_207630009
|
10.861
|
NM_001039845
|
MDH1B
|
malate dehydrogenase 1B, NAD (soluble)
|
|
chr1_-_169336999
|
10.806
|
NM_013330
NM_197972
|
NME7
|
non-metastatic cells 7, protein expressed in (nucleoside-diphosphate kinase)
|
|
chr11_+_86085777
|
10.793
|
NM_001156474
NM_021827
|
CCDC81
|
coiled-coil domain containing 81
|
|
chr9_+_124922189
|
10.647
|
NM_198469
|
MORN5
|
MORN repeat containing 5
|
|
chr16_+_29823557
|
10.605
|
|
PRRT2
|
proline-rich transmembrane protein 2
|
|
chr8_-_133687761
|
10.595
|
NM_012472
|
LRRC6
|
leucine rich repeat containing 6
|
|
chr1_-_36915969
|
10.526
|
NM_145047
NM_206837
|
OSCP1
|
organic solute carrier partner 1
|
|
chr11_+_93063782
|
10.475
|
NM_181645
|
CCDC67
|
coiled-coil domain containing 67
|
|
chr6_+_112408673
|
10.396
|
NM_001033564
|
C6orf225
|
chromosome 6 open reading frame 225
|
|
chr11_-_66360485
|
10.295
|
NM_018219
|
CCDC87
|
coiled-coil domain containing 87
|
|
chr15_+_90234027
|
10.240
|
NM_020212
|
WDR93
|
WD repeat domain 93
|
|
chr15_+_67547115
|
10.233
|
NM_001031715
NM_022784
|
IQCH
|
IQ motif containing H
|
|
chr11_-_8615745
|
10.209
|
|
STK33
|
serine/threonine kinase 33
|
|
chr21_+_18885104
|
10.091
|
NM_001207063
NM_001207064
NM_001207065
NM_001207066
NM_001338
|
CXADR
|
coxsackie virus and adenovirus receptor
|
|
chr17_-_15244898
|
10.075
|
NM_031898
|
TEKT3
|
tektin 3
|
|
chr21_-_40817658
|
10.017
|
|
LCA5L
|
Leber congenital amaurosis 5-like
|
|
chr3_-_197676755
|
9.905
|
NM_001134435
|
IQCG
|
IQ motif containing G
|
|
chr7_-_102715171
|
9.883
|
NM_001111038
|
FBXL13
|
F-box and leucine-rich repeat protein 13
|
|
chr3_+_50306578
|
9.879
|
|
SEMA3B
|
sema domain, immunoglobulin domain (Ig), short basic domain, secreted, (semaphorin) 3B
|
|
chr3_+_130745693
|
9.840
|
NM_001146003
NM_024800
NM_145910
|
NEK11
|
NIMA (never in mitosis gene a)- related kinase 11
|
|
chr1_+_151694012
|
9.766
|
NM_001144956
|
RIIAD1
|
regulatory subunit of type II PKA R-subunit (RIIa) domain containing 1
|
|
chr1_+_42928873
|
9.763
|
|
CCDC30
|
coiled-coil domain containing 30
|
|
chr1_-_6240082
|
9.761
|
NM_015557
|
CHD5
|
chromodomain helicase DNA binding protein 5
|
|
chr7_-_35225652
|
9.709
|
|
DPY19L2P1
|
dpy-19-like 2 pseudogene 1 (C. elegans)
|
|
chr3_-_57530067
|
9.705
|
NM_178504
NM_198564
|
DNAH12
|
dynein, axonemal, heavy chain 12
|
|
chr6_-_24645955
|
9.636
|
NM_001168375
NM_001168376
NM_001168374
NM_001168377
NM_014809
|
KIAA0319
|
KIAA0319
|
|
chr16_+_58283819
|
9.634
|
NM_001142302
NM_014157
|
CCDC113
|
coiled-coil domain containing 113
|
|
chrX_+_18709044
|
9.614
|
NM_006240
NM_152224
NM_152226
|
PPEF1
|
protein phosphatase, EF-hand calcium binding domain 1
|
|
chr1_-_50489616
|
9.519
|
NM_032785
|
AGBL4
|
ATP/GTP binding protein-like 4
|
|
chr1_-_211848820
|
9.450
|
NM_001204182
NM_001204183
NM_002497
|
NEK2
|
NIMA (never in mitosis gene a)-related kinase 2
|
|
chr6_+_52284948
|
9.434
|
NM_018100
|
EFHC1
|
EF-hand domain (C-terminal) containing 1
|
|
chr16_+_89724175
|
9.343
|
NM_153025
|
C16orf55
|
chromosome 16 open reading frame 55
|
|
chr2_+_11273178
|
9.320
|
NM_182500
|
C2orf50
|
chromosome 2 open reading frame 50
|
|
chr12_+_122356446
|
9.309
|
NM_001178003
NM_144668
|
WDR66
|
WD repeat domain 66
|
|
chr13_-_96294282
|
9.303
|
|
DZIP1
|
DAZ interacting protein 1
|
|
chr19_+_54385429
|
9.284
|
NM_002739
|
PRKCG
|
protein kinase C, gamma
|
|
chr10_-_75118502
|
9.261
|
NM_145170
|
TTC18
|
tetratricopeptide repeat domain 18
|
|
chr20_+_30467596
|
9.233
|
|
TTLL9
|
tubulin tyrosine ligase-like family, member 9
|
|
chr9_+_100069909
|
9.202
|
NM_020893
|
C9orf174
|
chromosome 9 open reading frame 174
|
|
chr16_+_27078218
|
9.168
|
NM_001145545
|
C16orf82
|
chromosome 16 open reading frame 82
|
|
chr17_+_68100994
|
9.101
|
NM_170742
|
KCNJ16
|
potassium inwardly-rectifying channel, subfamily J, member 16
|
|
chr1_+_33546700
|
9.101
|
NM_052998
|
ADC
|
arginine decarboxylase
|
|
chr4_+_128554079
|
9.053
|
NM_015693
|
INTU
|
inturned planar cell polarity effector homolog (Drosophila)
|
|
chr13_-_52703213
|
9.031
|
NM_199289
|
NEK5
|
NIMA (never in mitosis gene a)-related kinase 5
|
|
chr10_-_123353330
|
9.017
|
NM_001144913
NM_001144914
|
FGFR2
|
fibroblast growth factor receptor 2
|
|
chr7_+_76751933
|
8.987
|
NM_020879
|
CCDC146
|
coiled-coil domain containing 146
|
|
chr6_+_97372495
|
8.976
|
NM_052904
|
KLHL32
|
kelch-like 32 (Drosophila)
|
|
chr1_-_40157067
|
8.909
|
NM_016257
|
HPCAL4
|
hippocalcin like 4
|
|
chr7_+_48075107
|
8.893
|
NM_001100159
|
C7orf57
|
chromosome 7 open reading frame 57
|
|
chr17_+_41177247
|
8.873
|
NM_005440
|
RND2
|
Rho family GTPase 2
|
|
chrX_-_106449543
|
8.871
|
NM_017681
|
NUP62CL
|
nucleoporin 62kDa C-terminal like
|
|
chr5_-_133702764
|
8.789
|
NM_001113575
NM_016508
|
CDKL3
|
cyclin-dependent kinase-like 3
|
|
chr21_-_34185943
|
8.720
|
NM_001162495
NM_001162496
NM_019596
|
C21orf62
|
chromosome 21 open reading frame 62
|
|
chr15_+_56657615
|
8.656
|
NM_198524
|
TEX9
|
testis expressed 9
|
|
chr17_+_78010430
|
8.612
|
NM_001243342
NM_017950
|
CCDC40
|
coiled-coil domain containing 40
|
|
chr11_-_119252267
|
8.610
|
|
USP2
|
ubiquitin specific peptidase 2
|
|
chr6_+_13925097
|
8.572
|
NM_001165032
NM_152737
|
RNF182
|
ring finger protein 182
|
|
chr11_-_119252364
|
8.563
|
NM_001243759
NM_004205
|
USP2
|
ubiquitin specific peptidase 2
|
|
chrX_-_152160604
|
8.533
|
NM_001103150
NM_001103151
NM_052926
|
PNMA5
|
paraneoplastic antigen like 5
|
|
chr12_+_51818669
|
8.503
|
|
SLC4A8
|
solute carrier family 4, sodium bicarbonate cotransporter, member 8
|
|
chr19_+_58545399
|
8.487
|
NM_182572
|
ZSCAN1
|
zinc finger and SCAN domain containing 1
|
|
chr1_-_1935275
|
8.441
|
NM_001080484
|
KIAA1751
|
KIAA1751
|
|
chr19_+_2096792
|
8.430
|
NM_001031735
NM_001039846
|
IZUMO4
|
IZUMO family member 4
|
|
chr20_+_20033157
|
8.365
|
NM_015585
|
C20orf26
|
chromosome 20 open reading frame 26
|
|
chr17_+_54230835
|
8.361
|
NM_153228
|
ANKFN1
|
ankyrin-repeat and fibronectin type III domain containing 1
|
|
chr1_+_179334854
|
8.341
|
NM_144696
|
AXDND1
|
axonemal dynein light chain domain containing 1
|
|
chr6_+_13925423
|
8.340
|
NM_001165033
|
RNF182
|
ring finger protein 182
|
|
chr22_-_39052579
|
8.290
|
NM_001013647
|
LOC646851
|
putative uncharacterized protein LOC388900
|
|
chr2_+_232063340
|
8.257
|
NM_025139
|
ARMC9
|
armadillo repeat containing 9
|
|
chr6_+_135818938
|
8.236
|
|
LINC00271
|
long intergenic non-protein coding RNA 271
|
|
chr7_+_129142319
|
8.181
|
NM_001195243
|
LOC100287482
|
uncharacterized LOC100287482
|
|
chr16_-_67427335
|
8.165
|
NM_015964
NM_016140
|
TPPP3
|
tubulin polymerization-promoting protein family member 3
|
|
chr2_+_79740171
|
7.990
|
|
CTNNA2
|
catenin (cadherin-associated protein), alpha 2
|
|
chr17_+_56833231
|
7.944
|
NM_014906
|
PPM1E
|
protein phosphatase, Mg2+/Mn2+ dependent, 1E
|
|
chr2_-_175869910
|
7.932
|
NM_001822
NM_001025201
|
CHN1
|
chimerin (chimaerin) 1
|
|
chr17_+_32907767
|
7.852
|
NM_207313
|
TMEM132E
|
transmembrane protein 132E
|
|
chr12_-_85430054
|
7.841
|
NM_001100917
|
TSPAN19
|
tetraspanin 19
|
|
chr2_+_219221578
|
7.820
|
NM_198559
|
C2orf62
|
chromosome 2 open reading frame 62
|
|
chr15_+_48483866
|
7.808
|
NM_001145668
|
CTXN2
SLC12A1
|
cortexin 2
solute carrier family 12 (sodium/potassium/chloride transporters), member 1
|
|
chr3_+_46742822
|
7.787
|
NM_147196
|
TMIE
|
transmembrane inner ear
|
|
chr10_+_103348040
|
7.682
|
NM_015448
|
DPCD
|
deleted in primary ciliary dyskinesia homolog (mouse)
|
|
chr9_+_135754284
|
7.663
|
NM_018956
|
C9orf9
|
chromosome 9 open reading frame 9
|
|
chr17_+_48585912
|
7.588
|
|
MYCBPAP
|
MYCBP associated protein
|
|
chr4_-_87281177
|
7.585
|
|
MAPK10
|
mitogen-activated protein kinase 10
|
|
chr13_-_25745778
|
7.579
|
NM_152704
NM_199138
|
FAM123A
|
family with sequence similarity 123A
|
|
chr5_-_132073143
|
7.528
|
NM_007054
|
KIF3A
|
kinesin family member 3A
|
|
chr4_-_156297944
|
7.527
|
|
MAP9
|
microtubule-associated protein 9
|