|
chr3_+_39509069
|
26.915
|
NM_182935
|
MOBP
|
myelin-associated oligodendrocyte basic protein
|
|
chr3_+_181417387
|
14.838
|
|
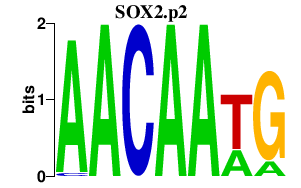
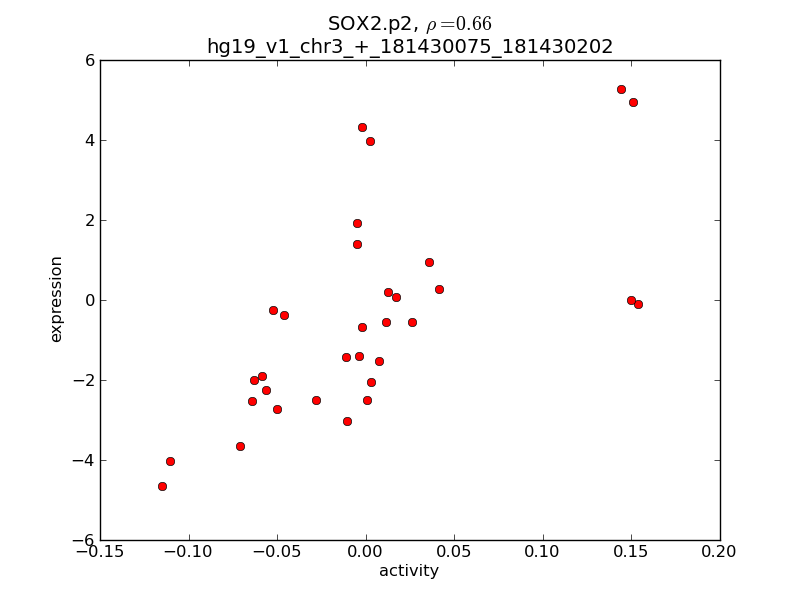
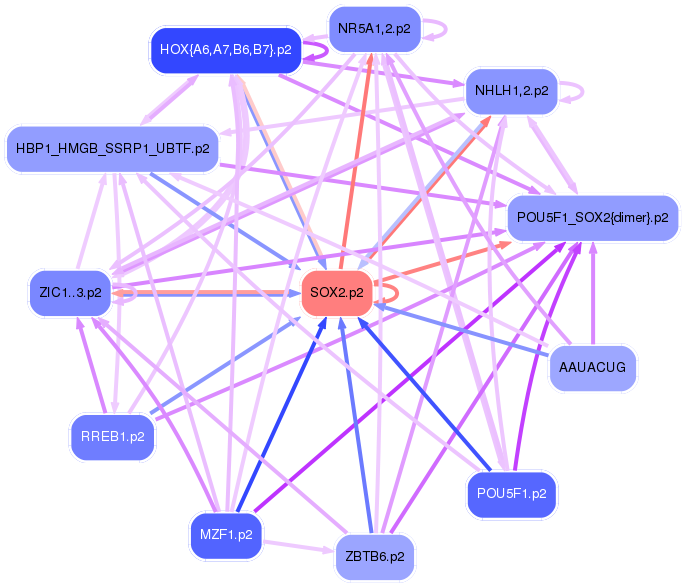
SOX2-OT
|
SOX2 overlapping transcript (non-protein coding)
|
|
chr2_-_2334887
|
9.646
|
NM_015025
|
MYT1L
|
myelin transcription factor 1-like
|
|
chr16_-_11375094
|
9.545
|
NM_002761
|
PRM1
|
protamine 1
|
|
chr5_-_114515733
|
7.506
|
NM_001017397
NM_001017398
NM_018700
|
TRIM36
|
tripartite motif containing 36
|
|
chr5_+_140201221
|
7.323
|
NM_018908
NM_031501
|
PCDHA5
|
protocadherin alpha 5
|
|
chr2_+_149633173
|
6.556
|
|
|
|
|
chr5_-_160279045
|
6.447
|
NM_025153
|
ATP10B
|
ATPase, class V, type 10B
|
|
chr19_+_18062110
|
6.390
|
NM_002248
|
KCNN1
|
potassium intermediate/small conductance calcium-activated channel, subfamily N, member 1
|
|
chr8_+_104831415
|
6.230
|
NM_014677
|
RIMS2
|
regulating synaptic membrane exocytosis 2
|
|
chrX_+_84499037
|
6.170
|
|
ZNF711
|
zinc finger protein 711
|
|
chr7_+_20370724
|
6.099
|
NM_002214
|
ITGB8
|
integrin, beta 8
|
|
chr18_-_3874688
|
6.079
|
NM_001242762
NM_001242763
|
DLGAP1
|
discs, large (Drosophila) homolog-associated protein 1
|
|
chr5_+_140474198
|
5.820
|
NM_018936
|
PCDHB2
|
protocadherin beta 2
|
|
chrX_+_100333835
|
5.779
|
NM_021637
|
TMEM35
|
transmembrane protein 35
|
|
chr5_-_87969135
|
5.574
|
|
LINC00461
|
long intergenic non-protein coding RNA 461
|
|
chr1_+_166958497
|
5.533
|
NM_032858
|
MAEL
|
maelstrom homolog (Drosophila)
|
|
chr1_-_26233367
|
5.472
|
NM_203399
|
STMN1
|
stathmin 1
|
|
chrX_+_111119278
|
5.333
|
NM_001195576
NM_001195578
|
LOC100329135
|
uncharacterized LOC100329135
|
|
chr2_+_27070962
|
5.260
|
NM_020134
NM_001253723
NM_001253724
|
DPYSL5
|
dihydropyrimidinase-like 5
|
|
chrX_+_86772714
|
5.227
|
NM_019117
NM_057162
|
KLHL4
|
kelch-like 4 (Drosophila)
|
|
chrX_-_139866582
|
5.175
|
NM_004065
|
CDR1
|
cerebellar degeneration-related protein 1, 34kDa
|
|
chr15_+_84116172
|
5.171
|
|
SH3GL3
|
SH3-domain GRB2-like 3
|
|
chr5_-_110062365
|
5.097
|
NM_001039763
|
TMEM232
|
transmembrane protein 232
|
|
chr8_+_103563847
|
5.078
|
NM_024410
|
ODF1
|
outer dense fiber of sperm tails 1
|
|
chrX_-_24690740
|
4.919
|
NM_001163264
|
PCYT1B
|
phosphate cytidylyltransferase 1, choline, beta
|
|
chr20_+_17207596
|
4.888
|
NM_001201529
NM_002594
|
PCSK2
|
proprotein convertase subtilisin/kexin type 2
|
|
chr4_+_115543522
|
4.870
|
NM_003360
|
UGT8
|
UDP glycosyltransferase 8
|
|
chr11_-_85397215
|
4.865
|
NM_152723
|
CCDC89
|
coiled-coil domain containing 89
|
|
chr9_-_23826062
|
4.817
|
NM_004432
|
ELAVL2
|
ELAV (embryonic lethal, abnormal vision, Drosophila)-like 2 (Hu antigen B)
|
|
chr7_+_154002194
|
4.708
|
NM_001936
|
DPP6
|
dipeptidyl-peptidase 6
|
|
chr7_+_94297448
|
4.695
|
|
PEG10
|
paternally expressed 10
|
|
chr9_-_19786886
|
4.690
|
NM_001193288
NM_020344
|
SLC24A2
|
solute carrier family 24 (sodium/potassium/calcium exchanger), member 2
|
|
chr5_+_140235594
|
4.689
|
NM_018901
NM_031859
NM_031860
|
PCDHA10
|
protocadherin alpha 10
|
|
chr13_-_53422773
|
4.682
|
NM_002590
NM_032949
|
PCDH8
|
protocadherin 8
|
|
chr15_+_84115979
|
4.584
|
NM_003027
|
SH3GL3
|
SH3-domain GRB2-like 3
|
|
chr4_-_87028805
|
4.420
|
NM_138981
|
MAPK10
|
mitogen-activated protein kinase 10
|
|
chr1_+_50571963
|
4.351
|
NM_001144775
|
ELAVL4
|
ELAV (embryonic lethal, abnormal vision, Drosophila)-like 4 (Hu antigen D)
|
|
chr2_+_162272619
|
4.328
|
NM_006593
|
TBR1
|
T-box, brain, 1
|
|
chr12_+_57943843
|
4.308
|
NM_004984
|
KIF5A
|
kinesin family member 5A
|
|
chr5_-_146435589
|
4.269
|
NM_181674
NM_181676
|
PPP2R2B
|
protein phosphatase 2, regulatory subunit B, beta
|
|
chr9_-_73483933
|
4.109
|
NM_001007470
NM_020952
NM_024971
NM_206944
NM_206945
NM_206946
NM_206947
NM_206948
|
TRPM3
|
transient receptor potential cation channel, subfamily M, member 3
|
|
chr3_+_107096187
|
4.076
|
NM_032600
|
CCDC54
|
coiled-coil domain containing 54
|
|
chr13_-_39564857
|
4.017
|
NM_001144033
NM_145286
|
STOML3
|
stomatin (EPB72)-like 3
|
|
chr4_-_176733413
|
3.973
|
|
GPM6A
|
glycoprotein M6A
|
|
chr5_+_55062712
|
3.955
|
NM_001166534
|
DDX4
|
DEAD (Asp-Glu-Ala-Asp) box polypeptide 4
|
|
chr1_+_87012758
|
3.931
|
NM_012128
|
CLCA4
|
chloride channel accessory 4
|
|
chr20_+_17206751
|
3.911
|
NM_001201528
|
PCSK2
|
proprotein convertase subtilisin/kexin type 2
|
|
chr1_+_228337414
|
3.904
|
NM_020435
|
GJC2
|
gap junction protein, gamma 2, 47kDa
|
|
chr1_+_50574601
|
3.811
|
|
ELAVL4
|
ELAV (embryonic lethal, abnormal vision, Drosophila)-like 4 (Hu antigen D)
|
|
chr15_+_51973549
|
3.804
|
NM_001165257
NM_013243
|
SCG3
|
secretogranin III
|
|
chr4_-_87281374
|
3.765
|
NM_138980
NM_138982
|
MAPK10
|
mitogen-activated protein kinase 10
|
|
chr6_-_49989647
|
3.729
|
NM_001037497
NM_001037728
|
DEFB110
|
defensin, beta 110 locus
|
|
chr7_-_84751246
|
3.713
|
NM_152754
|
SEMA3D
|
sema domain, immunoglobulin domain (Ig), short basic domain, secreted, (semaphorin) 3D
|
|
chr7_+_20370324
|
3.713
|
|
ITGB8
|
integrin, beta 8
|
|
chr12_+_48876285
|
3.691
|
NM_152319
|
C12orf54
|
chromosome 12 open reading frame 54
|
|
chr11_-_84634219
|
3.691
|
|
DLG2
|
discs, large homolog 2 (Drosophila)
|
|
chr4_+_110749149
|
3.629
|
NM_006583
|
RRH
|
retinal pigment epithelium-derived rhodopsin homolog
|
|
chr16_+_89989686
|
3.611
|
NM_006086
|
TUBB3
|
tubulin, beta 3 class III
|
|
chr18_-_3874252
|
3.606
|
NM_001242764
|
DLGAP1
|
discs, large (Drosophila) homolog-associated protein 1
|
|
chr13_-_25745620
|
3.590
|
|
FAM123A
|
family with sequence similarity 123A
|
|
chr12_+_122652265
|
3.551
|
NM_152759
|
LRRC43
|
leucine rich repeat containing 43
|
|
chr10_+_99349354
|
3.547
|
NM_001009997
|
C10orf62
|
chromosome 10 open reading frame 62
|
|
chr6_+_105404922
|
3.546
|
NM_001004317
|
LIN28B
|
lin-28 homolog B (C. elegans)
|
|
chr2_+_115219153
|
3.519
|
NM_001178036
|
DPP10
|
dipeptidyl-peptidase 10 (non-functional)
|
|
chr1_+_163038934
|
3.499
|
NM_001113381
|
RGS4
|
regulator of G-protein signaling 4
|
|
chr20_+_20348744
|
3.495
|
NM_002196
|
INSM1
|
insulinoma-associated 1
|
|
chr4_+_41258941
|
3.488
|
|
UCHL1
|
ubiquitin carboxyl-terminal esterase L1 (ubiquitin thiolesterase)
|
|
chr22_-_50523853
|
3.475
|
|
MLC1
|
megalencephalic leukoencephalopathy with subcortical cysts 1
|
|
chr5_-_137475076
|
3.427
|
NM_003551
|
NME5
|
non-metastatic cells 5, protein expressed in (nucleoside-diphosphate kinase)
|
|
chr4_-_20985547
|
3.422
|
|
KCNIP4
|
Kv channel interacting protein 4
|
|
chr5_+_140207562
|
3.401
|
NM_018909
NM_031848
NM_031849
|
PCDHA6
|
protocadherin alpha 6
|
|
chr6_+_123100860
|
3.361
|
|
FABP7
|
fatty acid binding protein 7, brain
|
|
chr13_-_25745778
|
3.360
|
NM_152704
NM_199138
|
FAM123A
|
family with sequence similarity 123A
|
|
chr5_-_11903964
|
3.348
|
NM_001332
|
CTNND2
|
catenin (cadherin-associated protein), delta 2 (neural plakophilin-related arm-repeat protein)
|
|
chr17_+_19990334
|
3.335
|
NM_001033553
NM_152904
|
SPECC1
|
sperm antigen with calponin homology and coiled-coil domains 1
|
|
chr12_-_16759531
|
3.324
|
NM_018640
|
LMO3
|
LIM domain only 3 (rhombotin-like 2)
|
|
chr19_-_6502224
|
3.300
|
NM_006087
|
TUBB4A
|
tubulin, beta 4A class IVa
|
|
chr4_-_176733378
|
3.299
|
|
GPM6A
|
glycoprotein M6A
|
|
chr6_+_12290528
|
3.270
|
NM_001168319
NM_001955
|
EDN1
|
endothelin 1
|
|
chr12_-_48963802
|
3.270
|
NM_002289
|
LALBA
|
lactalbumin, alpha-
|
|
chr6_+_123100645
|
3.247
|
NM_001446
|
FABP7
|
fatty acid binding protein 7, brain
|
|
chr5_+_161494647
|
3.247
|
NM_000816
NM_198903
NM_198904
|
GABRG2
|
gamma-aminobutyric acid (GABA) A receptor, gamma 2
|
|
chr3_-_58563490
|
3.245
|
NM_001076778
NM_007177
|
FAM107A
|
family with sequence similarity 107, member A
|
|
chr12_-_45307710
|
3.222
|
NM_001145110
|
NELL2
|
NEL-like 2 (chicken)
|
|
chr5_-_36301999
|
3.217
|
NM_001161429
NM_145000
|
RANBP3L
|
RAN binding protein 3-like
|
|
chrX_-_128788913
|
3.217
|
NM_017413
|
APLN
|
apelin
|
|
chrX_-_80457440
|
3.198
|
NM_030763
|
HMGN5
|
high mobility group nucleosome binding domain 5
|
|
chr17_+_54230835
|
3.186
|
NM_153228
|
ANKFN1
|
ankyrin-repeat and fibronectin type III domain containing 1
|
|
chr21_+_41239346
|
3.179
|
NM_006198
|
PCP4
|
Purkinje cell protein 4
|
|
chr1_-_23342342
|
3.152
|
NM_001242521
|
LOC729059
|
uncharacterized LOC729059
|
|
chr6_+_21666645
|
3.151
|
|
LINC00340
|
long intergenic non-protein coding RNA 340
|
|
chr9_-_77502635
|
3.145
|
NM_001177310
|
TRPM6
|
transient receptor potential cation channel, subfamily M, member 6
|
|
chr5_-_83680191
|
3.131
|
|
EDIL3
|
EGF-like repeats and discoidin I-like domains 3
|
|
chr18_+_29171729
|
3.127
|
NM_000371
|
TTR
|
transthyretin
|
|
chr1_-_205325915
|
3.116
|
NM_018203
|
KLHDC8A
|
kelch domain containing 8A
|
|
chr1_+_47137496
|
3.113
|
NM_001145474
|
ATPAF1-AS1
|
ATPAF1 antisense RNA 1 (non-protein coding)
|
|
chr12_+_49212253
|
3.095
|
NM_000725
NM_001206915
|
CACNB3
|
calcium channel, voltage-dependent, beta 3 subunit
|
|
chr3_-_123339178
|
3.084
|
|
MYLK
|
myosin light chain kinase
|
|
chr5_+_140480056
|
3.081
|
NM_018937
|
PCDHB3
|
protocadherin beta 3
|
|
chr17_-_37764165
|
3.040
|
NM_006160
|
NEUROD2
|
neurogenic differentiation 2
|
|
chr1_+_156589085
|
3.037
|
NM_021817
|
HAPLN2
|
hyaluronan and proteoglycan link protein 2
|
|
chrX_+_78003205
|
3.024
|
NM_005296
|
LPAR4
|
lysophosphatidic acid receptor 4
|
|
chr17_+_74864427
|
3.013
|
NM_001199172
NM_144677
|
MGAT5B
|
mannosyl (alpha-1,6-)-glycoprotein beta-1,6-N-acetyl-glucosaminyltransferase, isozyme B
|
|
chr12_-_87232635
|
2.997
|
NM_013244
|
MGAT4C
|
mannosyl (alpha-1,3-)-glycoprotein beta-1,4-N-acetylglucosaminyltransferase, isozyme C (putative)
|
|
chr9_+_103235634
|
2.987
|
|
TMEFF1
|
transmembrane protein with EGF-like and two follistatin-like domains 1
|
|
chr1_+_1361507
|
2.968
|
NM_001146685
|
TMEM88B
|
transmembrane protein 88B
|
|
chr20_-_44175995
|
2.967
|
NM_001198986
NM_020398
|
SPINLW1-WFDC6
SPINLW1
|
SPINLW1-WFDC6 readthrough
serine peptidase inhibitor-like, with Kunitz and WAP domains 1 (eppin)
|
|
chr3_-_149510609
|
2.951
|
NM_001144960
|
ANKUB1
|
ankyrin repeat and ubiquitin domain containing 1
|
|
chr7_-_112727799
|
2.945
|
|
GPR85
|
G protein-coupled receptor 85
|
|
chrX_+_51927918
|
2.942
|
NM_001098800
NM_001242362
NM_030801
NM_177535
NM_177537
|
MAGED4
MAGED4B
|
melanoma antigen family D, 4
melanoma antigen family D, 4B
|
|
chr1_+_163038564
|
2.940
|
NM_005613
|
RGS4
|
regulator of G-protein signaling 4
|
|
chr4_-_139163222
|
2.940
|
NM_014331
|
SLC7A11
|
solute carrier family 7 (anionic amino acid transporter light chain, xc- system), member 11
|
|
chr5_-_96478502
|
2.938
|
NM_153234
|
LIX1
|
Lix1 homolog (chicken)
|
|
chr16_+_27078218
|
2.919
|
NM_001145545
|
C16orf82
|
chromosome 16 open reading frame 82
|
|
chr5_+_140186658
|
2.918
|
NM_018907
NM_031500
|
PCDHA4
|
protocadherin alpha 4
|
|
chr2_-_198540583
|
2.914
|
NM_144629
|
RFTN2
|
raftlin family member 2
|
|
chr4_+_175839508
|
2.912
|
NM_001130703
NM_001130704
NM_001130705
NM_014269
|
ADAM29
|
ADAM metallopeptidase domain 29
|
|
chr3_-_123339423
|
2.894
|
NM_053031
NM_053032
|
MYLK
|
myosin light chain kinase
|
|
chr7_+_128349111
|
2.892
|
|
FAM71F1
|
family with sequence similarity 71, member F1
|
|
chr1_-_32801606
|
2.887
|
NM_023009
|
MARCKSL1
|
MARCKS-like 1
|
|
chr2_-_217724781
|
2.874
|
NM_003284
|
TNP1
|
transition protein 1 (during histone to protamine replacement)
|
|
chr9_-_95298251
|
2.873
|
NM_001197295
NM_001197296
NM_001393
|
ECM2
|
extracellular matrix protein 2, female organ and adipocyte specific
|
|
chr12_+_18891040
|
2.872
|
NM_033328
|
CAPZA3
|
capping protein (actin filament) muscle Z-line, alpha 3
|
|
chr20_+_32250089
|
2.871
|
NM_080825
|
C20orf144
|
chromosome 20 open reading frame 144
|
|
chr1_+_240255171
|
2.860
|
NM_020066
|
FMN2
|
formin 2
|
|
chr8_+_80523351
|
2.855
|
|
STMN2
|
stathmin-like 2
|
|
chr5_+_140213968
|
2.849
|
NM_018910
NM_031852
|
PCDHA7
|
protocadherin alpha 7
|
|
chr1_+_209757044
|
2.849
|
NM_020439
|
CAMK1G
|
calcium/calmodulin-dependent protein kinase IG
|
|
chr2_+_162272800
|
2.836
|
|
TBR1
|
T-box, brain, 1
|
|
chr8_+_80523376
|
2.833
|
|
STMN2
|
stathmin-like 2
|
|
chr12_+_85430098
|
2.829
|
NM_001079910
|
LRRIQ1
|
leucine-rich repeats and IQ motif containing 1
|
|
chr18_-_31802433
|
2.826
|
NM_001198547
|
NOL4
|
nucleolar protein 4
|
|
chr1_+_203096835
|
2.817
|
NM_000674
NM_001048230
|
ADORA1
|
adenosine A1 receptor
|
|
chr1_-_116383323
|
2.812
|
NM_001111061
|
NHLH2
|
nescient helix loop helix 2
|
|
chr20_+_17207680
|
2.806
|
|
PCSK2
|
proprotein convertase subtilisin/kexin type 2
|
|
chrX_-_138287180
|
2.798
|
NM_001139498
NM_001139500
NM_001139501
|
FGF13
|
fibroblast growth factor 13
|
|
chr2_+_14772839
|
2.792
|
|
FAM84A
|
family with sequence similarity 84, member A
|
|
chr9_-_127269689
|
2.790
|
NM_004959
|
NR5A1
|
nuclear receptor subfamily 5, group A, member 1
|
|
chrX_-_152160604
|
2.777
|
NM_001103150
NM_001103151
NM_052926
|
PNMA5
|
paraneoplastic antigen like 5
|
|
chr1_-_177133950
|
2.771
|
NM_004319
NM_207108
|
ASTN1
|
astrotactin 1
|
|
chr7_+_73245192
|
2.766
|
NM_001305
|
CLDN4
|
claudin 4
|
|
chr15_-_82338348
|
2.761
|
NM_032246
|
MEX3B
|
mex-3 homolog B (C. elegans)
|
|
chr6_+_121756744
|
2.743
|
NM_000165
|
GJA1
|
gap junction protein, alpha 1, 43kDa
|
|
chr16_+_89988416
|
2.725
|
NM_001197181
|
TUBB3
|
tubulin, beta 3 class III
|
|
chr3_-_116164363
|
2.719
|
NM_002338
|
LSAMP
|
limbic system-associated membrane protein
|
|
chrX_-_138724851
|
2.691
|
NM_001171877
NM_001171878
NM_001171879
NM_005369
|
MCF2
|
MCF.2 cell line derived transforming sequence
|
|
chr5_-_83680590
|
2.666
|
NM_005711
|
EDIL3
|
EGF-like repeats and discoidin I-like domains 3
|
|
chr8_-_87755880
|
2.659
|
NM_019098
|
CNGB3
|
cyclic nucleotide gated channel beta 3
|
|
chr18_+_31158540
|
2.657
|
NM_030632
|
ASXL3
|
additional sex combs like 3 (Drosophila)
|
|
chr2_-_241759627
|
2.650
|
NM_001244008
NM_004321
|
KIF1A
|
kinesin family member 1A
|
|
chr20_-_3762060
|
2.648
|
NM_015417
|
SPEF1
|
sperm flagellar 1
|
|
chr1_-_173638970
|
2.630
|
NM_198493
|
ANKRD45
|
ankyrin repeat domain 45
|
|
chr3_+_19189969
|
2.602
|
NM_144633
|
KCNH8
|
potassium voltage-gated channel, subfamily H (eag-related), member 8
|
|
chrX_+_84498993
|
2.598
|
NM_021998
|
ZNF711
|
zinc finger protein 711
|
|
chr19_+_12949258
|
2.598
|
NM_014975
|
MAST1
|
microtubule associated serine/threonine kinase 1
|
|
chr10_-_128209996
|
2.585
|
NM_001004298
|
C10orf90
|
chromosome 10 open reading frame 90
|
|
chr7_-_96633608
|
2.584
|
|
DLX6-AS1
|
DLX6 antisense RNA 1 (non-protein coding)
|
|
chrX_-_51812249
|
2.576
|
NM_001098800
NM_001242362
NM_030801
NM_177535
NM_177537
|
MAGED4
MAGED4B
|
melanoma antigen family D, 4
melanoma antigen family D, 4B
|
|
chr8_+_80523048
|
2.573
|
NM_001199214
NM_007029
|
STMN2
|
stathmin-like 2
|
|
chr2_+_166428845
|
2.573
|
NM_024969
|
CSRNP3
|
cysteine-serine-rich nuclear protein 3
|
|
chr12_+_64238511
|
2.569
|
NM_020762
|
SRGAP1
|
SLIT-ROBO Rho GTPase activating protein 1
|
|
chr15_-_83876769
|
2.549
|
|
HDGFRP3
|
hepatoma-derived growth factor, related protein 3
|
|
chr4_-_5889992
|
2.547
|
|
CRMP1
|
collapsin response mediator protein 1
|
|
chr7_-_137028533
|
2.537
|
NM_002825
|
PTN
|
pleiotrophin
|
|
chr1_+_218518675
|
2.533
|
NM_001135599
NM_003238
|
TGFB2
|
transforming growth factor, beta 2
|
|
chr1_-_177133818
|
2.529
|
|
ASTN1
|
astrotactin 1
|
|
chr2_-_26205327
|
2.522
|
|
KIF3C
|
kinesin family member 3C
|
|
chr4_-_101439071
|
2.517
|
NM_001159694
NM_016242
|
EMCN
|
endomucin
|
|
chr22_-_50523737
|
2.514
|
|
MLC1
|
megalencephalic leukoencephalopathy with subcortical cysts 1
|
|
chr17_-_39661803
|
2.509
|
NM_002274
NM_153490
|
KRT13
|
keratin 13
|
|
chr9_+_103235489
|
2.488
|
NM_003692
|
TMEFF1
|
transmembrane protein with EGF-like and two follistatin-like domains 1
|
|
chr11_-_83393436
|
2.486
|
NM_001142702
|
DLG2
|
discs, large homolog 2 (Drosophila)
|
|
chr18_+_66465316
|
2.484
|
NM_024781
|
CCDC102B
|
coiled-coil domain containing 102B
|
|
chr19_+_35782988
|
2.479
|
NM_001199216
NM_002361
NM_080600
|
MAG
|
myelin associated glycoprotein
|
|
chr14_+_29241989
|
2.479
|
|
C14orf23
|
chromosome 14 open reading frame 23
|
|
chr3_+_173116243
|
2.476
|
NM_014932
|
NLGN1
|
neuroligin 1
|
|
chr3_+_181429711
|
2.466
|
NM_003106
|
SOX2
|
SRY (sex determining region Y)-box 2
|
|
chrX_+_107288199
|
2.454
|
NM_001170553
NM_182607
|
VSIG1
|
V-set and immunoglobulin domain containing 1
|
|
chrX_-_13835187
|
2.453
|
|
GPM6B
|
glycoprotein M6B
|
|
chr14_-_60097223
|
2.442
|
|
RTN1
|
reticulon 1
|
|
chr8_-_30706532
|
2.435
|
NM_031271
|
TEX15
|
testis expressed 15
|
|
chr12_-_16759430
|
2.431
|
|
LMO3
|
LIM domain only 3 (rhombotin-like 2)
|
|
chr7_-_137028433
|
2.423
|
|
PTN
|
pleiotrophin
|
|
chr3_-_192635627
|
2.411
|
|
MB21D2
|
Mab-21 domain containing 2
|
|
chr18_+_72201669
|
2.403
|
NM_032649
|
CNDP1
|
carnosine dipeptidase 1 (metallopeptidase M20 family)
|
|
chrX_-_142605218
|
2.396
|
NM_001009609
|
SPANXN3
|
SPANX family, member N3
|
|
chr5_+_140254930
|
2.383
|
NM_018903
NM_031864
|
PCDHA12
|
protocadherin alpha 12
|
|
chr12_-_75603510
|
2.379
|
NM_139136
NM_139137
NM_153748
|
KCNC2
|
potassium voltage-gated channel, Shaw-related subfamily, member 2
|
|
chr2_+_210444364
|
2.376
|
NM_002374
NM_031845
NM_031847
|
MAP2
|
microtubule-associated protein 2
|
|
chr12_-_67072752
|
2.369
|
|
GRIP1
|
glutamate receptor interacting protein 1
|
|
chr17_-_29624249
|
2.364
|
NM_002544
|
OMG
|
oligodendrocyte myelin glycoprotein
|
|
chr2_-_1926501
|
2.364
|
|
MYT1L
|
myelin transcription factor 1-like
|
|
chr15_+_23810453
|
2.361
|
NM_005664
|
MKRN3
|
makorin ring finger protein 3
|
|
chr5_+_140739589
|
2.360
|
NM_018923
NM_032096
|
PCDHGB2
|
protocadherin gamma subfamily B, 2
|
|
chr1_+_87797301
|
2.348
|
|
|
|
|
chr4_+_158141735
|
2.347
|
NM_000826
NM_001083619
NM_001083620
|
GRIA2
|
glutamate receptor, ionotropic, AMPA 2
|
|
chr19_+_3880617
|
2.346
|
NM_033064
|
ATCAY
|
ataxia, cerebellar, Cayman type
|
|
chr20_+_36149606
|
2.329
|
NM_005386
NM_181689
|
NNAT
|
neuronatin
|
|
chr19_+_3880675
|
2.324
|
|
ATCAY
|
ataxia, cerebellar, Cayman type
|