|
chr13_-_114018365
|
5.357
|
NM_024719
|
GRTP1
|
growth hormone regulated TBC protein 1
|
|
chr15_+_80445177
|
4.629
|
NM_000137
|
FAH
|
fumarylacetoacetate hydrolase (fumarylacetoacetase)
|
|
chr14_+_104552015
|
4.122
|
NM_001080464
|
ASPG
|
asparaginase homolog (S. cerevisiae)
|
|
chr15_+_80445340
|
4.049
|
|
FAH
|
fumarylacetoacetate hydrolase (fumarylacetoacetase)
|
|
chr13_-_114018201
|
3.767
|
|
GRTP1
|
growth hormone regulated TBC protein 1
|
|
chr15_+_80445129
|
3.665
|
|
FAH
|
fumarylacetoacetate hydrolase (fumarylacetoacetase)
|
|
chr9_+_139685816
|
3.553
|
|
|
|
|
chr1_+_955609
|
3.461
|
|
AGRN
|
agrin
|
|
chr22_-_50746000
|
3.355
|
NM_012401
|
PLXNB2
|
plexin B2
|
|
chr21_+_45875368
|
3.293
|
NM_030891
|
LRRC3
|
leucine rich repeat containing 3
|
|
chr10_-_135171512
|
2.951
|
NM_001098483
NM_198472
|
C10orf125
|
chromosome 10 open reading frame 125
|
|
chr3_-_128840605
|
2.906
|
NM_001204886
NM_001204887
NM_001204888
NM_198490
NM_001204885
|
RAB43
|
RAB43, member RAS oncogene family
|
|
chr1_+_955468
|
2.866
|
NM_198576
|
AGRN
|
agrin
|
|
chr4_+_1005609
|
2.720
|
NM_001004356
NM_001004358
|
FGFRL1
|
fibroblast growth factor receptor-like 1
|
|
chr6_-_18155283
|
2.621
|
NM_000367
|
TPMT
|
thiopurine S-methyltransferase
|
|
chr21_-_44496423
|
2.605
|
NM_001178008
NM_001178009
|
CBS
|
cystathionine-beta-synthase
|
|
chr21_-_44495894
|
2.596
|
NM_000071
|
CBS
|
cystathionine-beta-synthase
|
|
chr19_-_50832633
|
2.503
|
NM_004977
|
KCNC3
|
potassium voltage-gated channel, Shaw-related subfamily, member 3
|
|
chr8_-_144815888
|
2.462
|
NM_198488
|
FAM83H
|
family with sequence similarity 83, member H
|
|
chr21_+_44073650
|
2.452
|
NM_001001567
NM_001001568
NM_001001569
NM_001001570
NM_001001571
NM_001001572
NM_001001573
NM_001001574
NM_001001575
NM_001001576
NM_001001577
NM_001001578
NM_001001579
NM_001001580
NM_001001581
NM_001001582
NM_001001583
NM_001001584
NM_001001585
NM_002606
|
PDE9A
|
phosphodiesterase 9A
|
|
chr1_+_955536
|
2.433
|
|
|
|
|
chr3_-_128840343
|
2.418
|
|
RAB43
|
RAB43, member RAS oncogene family
|
|
chr7_+_5322553
|
2.413
|
NM_001040661
NM_153247
|
SLC29A4
|
solute carrier family 29 (nucleoside transporters), member 4
|
|
chr3_-_128840856
|
2.410
|
NM_001204884
NM_001204883
|
RAB43
|
RAB43, member RAS oncogene family
|
|
chr16_+_1203240
|
2.401
|
NM_001005407
NM_021098
|
CACNA1H
|
calcium channel, voltage-dependent, T type, alpha 1H subunit
|
|
chr14_-_38064440
|
2.375
|
NM_004496
|
FOXA1
|
forkhead box A1
|
|
chr2_+_219264719
|
2.368
|
|
CTDSP1
|
CTD (carboxy-terminal domain, RNA polymerase II, polypeptide A) small phosphatase 1
|
|
chr11_+_2466171
|
2.347
|
NM_000218
|
KCNQ1
|
potassium voltage-gated channel, KQT-like subfamily, member 1
|
|
chr14_-_38064176
|
2.310
|
|
FOXA1
|
forkhead box A1
|
|
chr16_+_19179534
|
2.290
|
NM_016524
|
SYT17
|
synaptotagmin XVII
|
|
chr4_+_1005395
|
2.253
|
|
FGFRL1
|
fibroblast growth factor receptor-like 1
|
|
chr16_-_3285359
|
2.198
|
NM_001145448
NM_198088
NM_001145446
NM_198087
|
ZNF200
|
zinc finger protein 200
|
|
chr14_-_21566497
|
2.187
|
|
ZNF219
|
zinc finger protein 219
|
|
chr3_+_184097860
|
2.176
|
NM_003741
|
CHRD
|
chordin
|
|
chrX_+_30671456
|
2.159
|
NM_000167
NM_001128127
NM_001205019
NM_203391
|
GK
|
glycerol kinase
|
|
chr19_+_8274179
|
2.146
|
NM_024552
|
CERS4
|
ceramide synthase 4
|
|
chr9_-_139581795
|
2.094
|
|
AGPAT2
|
1-acylglycerol-3-phosphate O-acyltransferase 2 (lysophosphatidic acid acyltransferase, beta)
|
|
chr18_+_11981421
|
2.073
|
NM_014214
|
IMPA2
|
inositol(myo)-1(or 4)-monophosphatase 2
|
|
chr10_-_15210610
|
2.061
|
NM_004808
|
NMT2
|
N-myristoyltransferase 2
|
|
chr18_+_55102777
|
2.034
|
NM_004852
|
ONECUT2
|
one cut homeobox 2
|
|
chr18_+_11981552
|
2.032
|
|
IMPA2
|
inositol(myo)-1(or 4)-monophosphatase 2
|
|
chr19_-_33555757
|
2.013
|
NM_033103
|
RHPN2
|
rhophilin, Rho GTPase binding protein 2
|
|
chrX_+_30671602
|
1.993
|
|
GK
|
glycerol kinase
|
|
chr1_+_151483861
|
1.990
|
NM_020770
|
CGN
|
cingulin
|
|
chr7_+_65338161
|
1.985
|
NM_173517
|
VKORC1L1
|
vitamin K epoxide reductase complex, subunit 1-like 1
|
|
chr11_+_57228126
|
1.955
|
NM_178570
|
RTN4RL2
|
reticulon 4 receptor-like 2
|
|
chr5_+_176513819
|
1.954
|
NM_002011
NM_213647
|
FGFR4
|
fibroblast growth factor receptor 4
|
|
chr11_+_76494132
|
1.952
|
NM_015516
|
TSKU
|
tsukushi small leucine rich proteoglycan homolog (Xenopus laevis)
|
|
chr7_+_65338343
|
1.950
|
|
VKORC1L1
|
vitamin K epoxide reductase complex, subunit 1-like 1
|
|
chr6_+_37137882
|
1.947
|
NM_001243186
NM_002648
|
PIM1
|
pim-1 oncogene
|
|
chr7_-_73184535
|
1.937
|
NM_001306
|
CLDN3
|
claudin 3
|
|
chr22_-_43583132
|
1.931
|
NM_015140
|
TTLL12
|
tubulin tyrosine ligase-like family, member 12
|
|
chr18_+_72163582
|
1.882
|
|
CNDP2
|
CNDP dipeptidase 2 (metallopeptidase M20 family)
|
|
chr5_+_167718485
|
1.869
|
NM_001161661
NM_001161662
NM_015238
|
WWC1
|
WW and C2 domain containing 1
|
|
chr2_-_20424627
|
1.862
|
NM_002997
|
SDC1
|
syndecan 1
|
|
chr16_+_29817426
|
1.856
|
|
MAZ
|
MYC-associated zinc finger protein (purine-binding transcription factor)
|
|
chr9_+_139685760
|
1.855
|
NM_032928
|
TMEM141
|
transmembrane protein 141
|
|
chr6_+_3000026
|
1.844
|
NM_000904
|
NQO2
|
NAD(P)H dehydrogenase, quinone 2
|
|
chr21_-_40720938
|
1.843
|
|
HMGN1
|
high mobility group nucleosome binding domain 1
|
|
chr7_-_149470294
|
1.828
|
NM_207336
|
ZNF467
|
zinc finger protein 467
|
|
chr5_-_10761344
|
1.825
|
NM_004394
|
DAP
|
death-associated protein
|
|
chr9_+_136325086
|
1.824
|
NM_001135775
NM_001242369
NM_001242370
NM_017586
|
C9orf7
|
chromosome 9 open reading frame 7
|
|
chr11_+_64073040
|
1.824
|
NM_004451
|
ESRRA
|
estrogen-related receptor alpha
|
|
chr19_-_49339667
|
1.819
|
|
HSD17B14
|
hydroxysteroid (17-beta) dehydrogenase 14
|
|
chrX_+_43514157
|
1.812
|
|
MAOA
|
monoamine oxidase A
|
|
chr9_-_139581868
|
1.807
|
|
AGPAT2
|
1-acylglycerol-3-phosphate O-acyltransferase 2 (lysophosphatidic acid acyltransferase, beta)
|
|
chr1_+_226250413
|
1.800
|
|
H3F3A
|
H3 histone, family 3A
|
|
chr8_-_144923019
|
1.783
|
NM_178564
|
NRBP2
|
nuclear receptor binding protein 2
|
|
chr9_-_139581823
|
1.768
|
|
AGPAT2
|
1-acylglycerol-3-phosphate O-acyltransferase 2 (lysophosphatidic acid acyltransferase, beta)
|
|
chr16_+_29817810
|
1.766
|
NM_001042539
NM_002383
|
MAZ
|
MYC-associated zinc finger protein (purine-binding transcription factor)
|
|
chr12_+_6875686
|
1.764
|
|
PTMS
|
parathymosin
|
|
chr21_+_46825291
|
1.762
|
|
|
|
|
chr22_+_45064323
|
1.730
|
NM_001017528
NM_001017529
|
PRR5
|
proline rich 5 (renal)
|
|
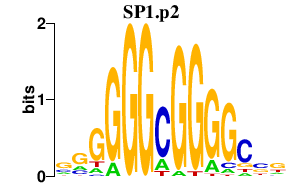
chr12_+_53773924
|
1.726
|
NM_001251825
NM_138473
|
SP1
|
Sp1 transcription factor
|
|
chr6_+_43738757
|
1.703
|
|
VEGFA
|
vascular endothelial growth factor A
|
|
chr2_-_10952803
|
1.702
|
|
PDIA6
|
protein disulfide isomerase family A, member 6
|
|
chr4_-_1166547
|
1.696
|
NM_012445
|
SPON2
|
spondin 2, extracellular matrix protein
|
|
chr11_+_71498497
|
1.682
|
NM_001099653
NM_018172
NM_152563
|
FAM86C1
|
family with sequence similarity 86, member C1
|
|
chr20_-_52210780
|
1.675
|
|
ZNF217
|
zinc finger protein 217
|
|
chr7_-_150497398
|
1.672
|
NM_001101311
NM_001101312
NM_001101314
|
TMEM176B
|
transmembrane protein 176B
|
|
chr1_+_87797301
|
1.661
|
|
|
|
|
chr18_+_72163335
|
1.655
|
NM_018235
|
CNDP2
|
CNDP dipeptidase 2 (metallopeptidase M20 family)
|
|
chr1_+_233463513
|
1.646
|
NM_032435
|
KIAA1804
|
mixed lineage kinase 4
|
|
chr1_-_6321034
|
1.638
|
NM_207370
|
GPR153
|
G protein-coupled receptor 153
|
|
chr11_-_67397383
|
1.638
|
NM_001243750
NM_181843
|
NUDT8
|
nudix (nucleoside diphosphate linked moiety X)-type motif 8
|
|
chr3_+_58223415
|
1.606
|
|
ABHD6
|
abhydrolase domain containing 6
|
|
chr5_-_10761179
|
1.599
|
|
DAP
|
death-associated protein
|
|
chr2_-_9770999
|
1.599
|
|
YWHAQ
|
tyrosine 3-monooxygenase/tryptophan 5-monooxygenase activation protein, theta polypeptide
|
|
chr8_+_95653399
|
1.591
|
|
ESRP1
|
epithelial splicing regulatory protein 1
|
|
chr7_+_65338349
|
1.588
|
|
VKORC1L1
|
vitamin K epoxide reductase complex, subunit 1-like 1
|
|
chr11_+_58939539
|
1.584
|
NM_015177
|
DTX4
|
deltex homolog 4 (Drosophila)
|
|
chr2_-_9771101
|
1.584
|
NM_006826
|
YWHAQ
|
tyrosine 3-monooxygenase/tryptophan 5-monooxygenase activation protein, theta polypeptide
|
|
chr2_+_219187858
|
1.576
|
NM_022572
|
PNKD
|
paroxysmal nonkinesigenic dyskinesia
|
|
chr22_-_43583058
|
1.576
|
|
TTLL12
|
tubulin tyrosine ligase-like family, member 12
|
|
chr3_-_132441302
|
1.574
|
NM_153240
|
NPHP3-ACAD11
NPHP3
|
NPHP3-ACAD11 readthrough
nephronophthisis 3 (adolescent)
|
|
chr21_+_46825001
|
1.557
|
NM_130445
|
COL18A1
|
collagen, type XVIII, alpha 1
|
|
chr19_-_10047014
|
1.541
|
NM_058164
|
OLFM2
|
olfactomedin 2
|
|
chr10_+_102729249
|
1.537
|
|
SEMA4G
|
sema domain, immunoglobulin domain (Ig), transmembrane domain (TM) and short cytoplasmic domain, (semaphorin) 4G
|
|
chr3_+_58223228
|
1.535
|
NM_020676
|
ABHD6
|
abhydrolase domain containing 6
|
|
chr10_+_104474297
|
1.530
|
NM_178858
|
SFXN2
|
sideroflexin 2
|
|
chr2_-_46384
|
1.528
|
NM_001077710
|
FAM110C
|
family with sequence similarity 110, member C
|
|
chr2_-_165477986
|
1.528
|
|
GRB14
|
growth factor receptor-bound protein 14
|
|
chr10_+_82213892
|
1.523
|
NM_001128309
NM_030927
|
TSPAN14
|
tetraspanin 14
|
|
chr17_-_17726855
|
1.521
|
|
SREBF1
|
sterol regulatory element binding transcription factor 1
|
|
chr22_+_41347373
|
1.498
|
|
RBX1
|
ring-box 1, E3 ubiquitin protein ligase
|
|
chr1_+_226250433
|
1.484
|
|
H3F3A
H3F3AP4
|
H3 histone, family 3A
H3 histone, family 3A, pseudogene 4
|
|
chr19_+_45349584
|
1.483
|
|
PVRL2
|
poliovirus receptor-related 2 (herpesvirus entry mediator B)
|
|
chr16_+_1203737
|
1.472
|
|
CACNA1H
|
calcium channel, voltage-dependent, T type, alpha 1H subunit
|
|
chr4_-_1166458
|
1.470
|
|
SPON2
|
spondin 2, extracellular matrix protein
|
|
chr17_+_6939236
|
1.467
|
NM_201566
|
SLC16A13
|
solute carrier family 16, member 13 (monocarboxylic acid transporter 13)
|
|
chr10_+_94449678
|
1.464
|
NM_002729
|
HHEX
|
hematopoietically expressed homeobox
|
|
chr16_+_67465019
|
1.456
|
NM_000196
|
HSD11B2
|
hydroxysteroid (11-beta) dehydrogenase 2
|
|
chr7_+_150497840
|
1.454
|
NM_018487
|
TMEM176A
|
transmembrane protein 176A
|
|
chr9_+_127020242
|
1.454
|
|
NEK6
|
NIMA (never in mitosis gene a)-related kinase 6
|
|
chr12_-_54982271
|
1.452
|
NM_006741
|
PPP1R1A
|
protein phosphatase 1, regulatory (inhibitor) subunit 1A
|
|
chr8_+_95653340
|
1.448
|
NM_001034915
NM_001122825
NM_001122826
NM_001122827
NM_017697
|
ESRP1
|
epithelial splicing regulatory protein 1
|
|
chr9_-_140335790
|
1.436
|
NM_001033113
NM_198585
|
ENTPD8
|
ectonucleoside triphosphate diphosphohydrolase 8
|
|
chr7_+_64498643
|
1.433
|
|
CCT6P3
|
chaperonin containing TCP1, subunit 6 (zeta) pseudogene 3
|
|
chr2_+_219187975
|
1.429
|
|
PNKD
|
paroxysmal nonkinesigenic dyskinesia
|
|
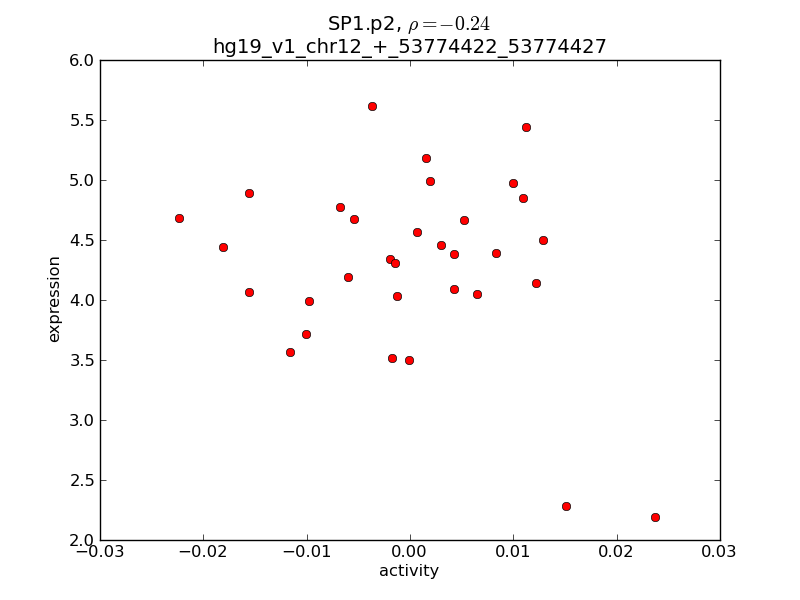
chr12_+_53774422
|
1.428
|
NM_003109
|
SP1
|
Sp1 transcription factor
|
|
chr1_-_54411245
|
1.426
|
NM_016126
|
HSPB11
|
heat shock protein family B (small), member 11
|
|
chr22_+_44319685
|
1.426
|
|
PNPLA3
|
patatin-like phospholipase domain containing 3
|
|
chr4_-_39528921
|
1.419
|
|
UGDH
|
UDP-glucose 6-dehydrogenase
|
|
chr22_-_36013303
|
1.414
|
NM_005368
NM_203378
|
MB
|
myoglobin
|
|
chr16_+_8768403
|
1.414
|
NM_020686
|
ABAT
|
4-aminobutyrate aminotransferase
|
|
chr17_+_73521744
|
1.412
|
NM_001015002
NM_001031803
NM_004524
|
LLGL2
|
lethal giant larvae homolog 2 (Drosophila)
|
|
chr12_+_101988746
|
1.408
|
NM_002465
NM_206819
NM_206820
NM_206821
|
MYBPC1
|
myosin binding protein C, slow type
|
|
chr11_+_58939960
|
1.404
|
|
DTX4
|
deltex homolog 4 (Drosophila)
|
|
chr6_-_74363609
|
1.403
|
|
SLC17A5
|
solute carrier family 17 (anion/sugar transporter), member 5
|
|
chr11_-_134281725
|
1.392
|
NM_018644
NM_054025
|
B3GAT1
|
beta-1,3-glucuronyltransferase 1 (glucuronosyltransferase P)
|
|
chr2_+_120189342
|
1.391
|
NM_183240
|
TMEM37
|
transmembrane protein 37
|
|
chr16_-_89768094
|
1.390
|
NM_152339
|
SPATA2L
|
spermatogenesis associated 2-like
|
|
chr9_-_139581900
|
1.387
|
NM_001012727
NM_006412
|
AGPAT2
|
1-acylglycerol-3-phosphate O-acyltransferase 2 (lysophosphatidic acid acyltransferase, beta)
|
|
chr9_-_97401833
|
1.386
|
NM_000507
|
FBP1
|
fructose-1,6-bisphosphatase 1
|
|
chr1_+_33207343
|
1.385
|
NM_020888
|
KIAA1522
|
KIAA1522
|
|
chr18_+_11981457
|
1.385
|
|
IMPA2
|
inositol(myo)-1(or 4)-monophosphatase 2
|
|
chr1_-_156051788
|
1.380
|
NM_001093725
|
MEX3A
|
mex-3 homolog A (C. elegans)
|
|
chr14_+_24563369
|
1.379
|
NM_001018073
NM_004563
|
PCK2
|
phosphoenolpyruvate carboxykinase 2 (mitochondrial)
|
|
chr20_-_22564893
|
1.376
|
|
FOXA2
|
forkhead box A2
|
|
chr19_+_56652529
|
1.365
|
NM_001253792
NM_018337
|
ZNF444
|
zinc finger protein 444
|
|
chr16_+_81478774
|
1.362
|
NM_198390
|
CMIP
|
c-Maf inducing protein
|
|
chr8_-_11725595
|
1.357
|
|
CTSB
|
cathepsin B
|
|
chr11_+_134201897
|
1.356
|
|
GLB1L2
|
galactosidase, beta 1-like 2
|
|
chr1_-_204120909
|
1.355
|
|
ETNK2
|
ethanolamine kinase 2
|
|
chr22_-_36019363
|
1.349
|
NM_203377
|
MB
|
myoglobin
|
|
chrX_+_198060
|
1.349
|
NM_018390
|
PLCXD1
|
phosphatidylinositol-specific phospholipase C, X domain containing 1
|
|
chrX_+_154299674
|
1.345
|
NM_001018055
NM_001242640
NM_024332
|
BRCC3
|
BRCA1/BRCA2-containing complex, subunit 3
|
|
chr4_-_39529099
|
1.336
|
NM_001184700
NM_001184701
NM_003359
|
UGDH
|
UDP-glucose 6-dehydrogenase
|
|
chr6_-_49754899
|
1.336
|
NM_138733
|
PGK2
|
phosphoglycerate kinase 2
|
|
chr2_-_165477818
|
1.334
|
|
GRB14
|
growth factor receptor-bound protein 14
|
|
chr9_-_97401746
|
1.333
|
|
FBP1
|
fructose-1,6-bisphosphatase 1
|
|
chr1_-_21978287
|
1.326
|
NM_001145658
|
RAP1GAP
|
RAP1 GTPase activating protein
|
|
chr20_+_35974458
|
1.322
|
NM_198291
|
SRC
|
v-src sarcoma (Schmidt-Ruppin A-2) viral oncogene homolog (avian)
|
|
chr3_-_53289957
|
1.321
|
|
TKT
|
transketolase
|
|
chr1_+_33219544
|
1.319
|
|
|
|
|
chr11_+_134201767
|
1.319
|
NM_138342
|
GLB1L2
|
galactosidase, beta 1-like 2
|
|
chr5_+_68710938
|
1.312
|
NM_001038603
NM_001244734
|
MARVELD2
|
MARVEL domain containing 2
|
|
chr7_-_143892649
|
1.307
|
NM_001003702
|
ARHGEF35
|
Rho guanine nucleotide exchange factor (GEF) 35
|
|
chr2_+_47596447
|
1.306
|
|
EPCAM
|
epithelial cell adhesion molecule
|
|
chr4_+_1006251
|
1.305
|
NM_021923
|
FGFRL1
|
fibroblast growth factor receptor-like 1
|
|
chr5_-_10761341
|
1.304
|
|
DAP
|
death-associated protein
|
|
chr2_+_112812900
|
1.301
|
|
TMEM87B
|
transmembrane protein 87B
|
|
chr17_+_26698986
|
1.298
|
NM_015077
|
SARM1
|
sterile alpha and TIR motif containing 1
|
|
chr8_-_11725622
|
1.295
|
|
CTSB
|
cathepsin B
|
|
chr2_+_112656200
|
1.292
|
|
MERTK
|
c-mer proto-oncogene tyrosine kinase
|
|
chr22_-_29977075
|
1.286
|
NM_001202502
|
NIPSNAP1
|
nipsnap homolog 1 (C. elegans)
|
|
chr1_+_226250407
|
1.286
|
NM_002107
|
H3F3A
|
H3 histone, family 3A
|
|
chr2_-_10952855
|
1.282
|
NM_005742
|
PDIA6
|
protein disulfide isomerase family A, member 6
|
|
chr2_-_227664330
|
1.280
|
|
IRS1
|
insulin receptor substrate 1
|
|
chr2_+_238600878
|
1.278
|
|
LRRFIP1
|
leucine rich repeat (in FLII) interacting protein 1
|
|
chr17_+_80709913
|
1.278
|
NM_005993
|
TBCD
|
tubulin folding cofactor D
|
|
chr15_+_41136622
|
1.277
|
NM_001032367
|
SPINT1
|
serine peptidase inhibitor, Kunitz type 1
|
|
chr5_-_176739291
|
1.273
|
NM_001142935
NM_031300
|
MXD3
|
MAX dimerization protein 3
|
|
chr11_+_560868
|
1.271
|
NM_001143993
|
RASSF7
|
Ras association (RalGDS/AF-6) domain family (N-terminal) member 7
|
|
chr9_+_116638544
|
1.270
|
NM_133374
|
ZNF618
|
zinc finger protein 618
|
|
chr8_-_495330
|
1.266
|
NM_175075
|
C8orf42
|
chromosome 8 open reading frame 42
|
|
chr1_+_167064086
|
1.266
|
NM_001080426
|
DUSP27
|
dual specificity phosphatase 27 (putative)
|
|
chr4_-_129208928
|
1.266
|
|
PGRMC2
|
progesterone receptor membrane component 2
|
|
chr2_+_219264477
|
1.263
|
NM_021198
NM_182642
|
CTDSP1
|
CTD (carboxy-terminal domain, RNA polymerase II, polypeptide A) small phosphatase 1
|
|
chr17_+_48712115
|
1.259
|
NM_001144070
NM_003786
|
ABCC3
|
ATP-binding cassette, sub-family C (CFTR/MRP), member 3
|
|
chr1_+_60280462
|
1.257
|
NM_015888
|
HOOK1
|
hook homolog 1 (Drosophila)
|
|
chr3_-_48470715
|
1.255
|
NM_002673
|
PLXNB1
|
plexin B1
|
|
chr3_-_53290099
|
1.255
|
NM_001064
NM_001135055
|
TKT
|
transketolase
|
|
chr19_+_1491000
|
1.253
|
NM_138393
|
REEP6
|
receptor accessory protein 6
|
|
chr4_+_76932336
|
1.251
|
NM_001130017
|
ART3
|
ADP-ribosyltransferase 3
|
|
chr16_-_51185150
|
1.250
|
NM_002968
|
SALL1
|
sal-like 1 (Drosophila)
|
|
chr12_-_6716475
|
1.247
|
|
CHD4
|
chromodomain helicase DNA binding protein 4
|
|
chr5_+_139028025
|
1.245
|
NM_016463
|
CXXC5
|
CXXC finger protein 5
|
|
chr7_-_148725731
|
1.240
|
|
PDIA4
|
protein disulfide isomerase family A, member 4
|
|
chr11_-_67572670
|
1.240
|
|
FAM86C2P
|
family with sequence similarity 86, member A pseudogene
|
|
chr22_-_19165872
|
1.239
|
|
SLC25A1
|
solute carrier family 25 (mitochondrial carrier; citrate transporter), member 1
|
|
chr8_+_27348591
|
1.239
|
NM_001979
|
EPHX2
|
epoxide hydrolase 2, cytoplasmic
|
|
chr19_-_1863425
|
1.235
|
|
KLF16
|
Kruppel-like factor 16
|
|
chr12_+_6875574
|
1.234
|
|
PTMS
|
parathymosin
|
|
chr20_-_17662704
|
1.233
|
|
RRBP1
|
ribosome binding protein 1 homolog 180kDa (dog)
|
|
chr20_+_2673193
|
1.232
|
NM_001110514
|
EBF4
|
early B-cell factor 4
|
|
chrX_-_1572648
|
1.231
|
NM_001173473
|
ASMTL
|
acetylserotonin O-methyltransferase-like
|
|
chr20_+_33814538
|
1.231
|
NM_006690
|
MMP24
|
matrix metallopeptidase 24 (membrane-inserted)
|
|
chr1_+_43996478
|
1.230
|
NM_002840
NM_130440
|
PTPRF
|
protein tyrosine phosphatase, receptor type, F
|
|
chr12_+_13153337
|
1.228
|
|
HTR7P1
|
5-hydroxytryptamine (serotonin) receptor 7 pseudogene 1
|
