|
chr8_-_121824015
|
8.018
|
|
|
|
|
chr8_-_121823696
|
7.945
|
|
SNTB1
|
syntrophin, beta 1 (dystrophin-associated protein A1, 59kDa, basic component 1)
|
|
chr12_+_6647339
|
7.908
|
|
GAPDH
|
glyceraldehyde-3-phosphate dehydrogenase
|
|
chr1_+_148644010
|
7.091
|
NM_001144032
|
PPIAL4E
|
peptidylprolyl isomerase A (cyclophilin A)-like 4E
|
|
chr5_-_149669187
|
6.611
|
|
CAMK2A
|
calcium/calmodulin-dependent protein kinase II alpha
|
|
chr19_-_47615802
|
6.264
|
|
|
|
|
chr17_+_65040651
|
6.057
|
NM_000727
|
CACNG1
|
calcium channel, voltage-dependent, gamma subunit 1
|
|
chr17_+_26369935
|
6.022
|
|
NLK
|
nemo-like kinase
|
|
chr12_+_81101407
|
5.822
|
NM_002469
|
MYF6
|
myogenic factor 6 (herculin)
|
|
chr22_-_36013303
|
5.447
|
NM_005368
NM_203378
|
MB
|
myoglobin
|
|
chr17_-_62050200
|
5.372
|
NM_000334
|
SCN4A
|
sodium channel, voltage-gated, type IV, alpha subunit
|
|
chr19_-_55895602
|
5.365
|
NM_001190764
|
TMEM238
|
transmembrane protein 238
|
|
chr5_-_149669400
|
5.288
|
NM_015981
NM_171825
|
CAMK2A
|
calcium/calmodulin-dependent protein kinase II alpha
|
|
chr1_-_200377488
|
4.704
|
|
ZNF281
|
zinc finger protein 281
|
|
chr1_-_154155594
|
4.615
|
|
TPM3
|
tropomyosin 3
|
|
chr2_+_149402559
|
4.527
|
NM_015630
|
EPC2
|
enhancer of polycomb homolog 2 (Drosophila)
|
|
chr19_-_33793441
|
4.472
|
|
CEBPA
|
CCAAT/enhancer binding protein (C/EBP), alpha
|
|
chr6_+_41020939
|
4.439
|
NM_006789
|
APOBEC2
|
apolipoprotein B mRNA editing enzyme, catalytic polypeptide-like 2
|
|
chr19_-_47615485
|
4.365
|
|
ZC3H4
|
zinc finger CCCH-type containing 4
|
|
chr1_-_154164551
|
4.349
|
NM_152263
|
TPM3
|
tropomyosin 3
|
|
chr18_-_74728677
|
4.336
|
|
MBP
|
myelin basic protein
|
|
chr7_+_148892553
|
4.282
|
NM_003575
|
ZNF282
|
zinc finger protein 282
|
|
chr3_-_69171536
|
4.260
|
NM_198271
|
LMOD3
|
leiomodin 3 (fetal)
|
|
chr1_-_144931967
|
4.255
|
NM_001002811
|
PDE4DIP
|
phosphodiesterase 4D interacting protein
|
|
chr3_+_42190825
|
4.214
|
|
TRAK1
|
trafficking protein, kinesin binding 1
|
|
chr8_-_121824268
|
4.169
|
|
SNTB1
|
syntrophin, beta 1 (dystrophin-associated protein A1, 59kDa, basic component 1)
|
|
chr5_+_148206155
|
4.062
|
NM_000024
|
ADRB2
|
adrenergic, beta-2-, receptor, surface
|
|
chr8_-_121824287
|
3.984
|
NM_021021
|
SNTB1
|
syntrophin, beta 1 (dystrophin-associated protein A1, 59kDa, basic component 1)
|
|
chr1_-_148202535
|
3.956
|
NM_001164261
NM_001164262
|
PPIAL4D
PPIAL4F
|
peptidylprolyl isomerase A (cyclophilin A)-like 4D
peptidylprolyl isomerase A (cyclophilin A)-like 4F
|
|
chr1_-_144364203
|
3.942
|
NM_178230
NM_001143883
NM_001135789
|
PPIAL4A
PPIAL4G
PPIAL4B
PPIAL4C
|
peptidylprolyl isomerase A (cyclophilin A)-like 4A
peptidylprolyl isomerase A (cyclophilin A)-like 4G
peptidylprolyl isomerase A (cyclophilin A)-like 4B
peptidylprolyl isomerase A (cyclophilin A)-like 4C
|
|
chr17_-_49124128
|
3.933
|
NM_001251971
|
SPAG9
|
sperm associated antigen 9
|
|
chr1_-_143767849
|
3.930
|
NM_001123068
|
PPIAL4G
|
peptidylprolyl isomerase A (cyclophilin A)-like 4G
|
|
chr8_-_145025043
|
3.894
|
NM_201380
|
PLEC
|
plectin
|
|
chr1_+_167905796
|
3.879
|
NM_001017977
NM_001198956
NM_001198957
NM_018442
|
DCAF6
|
DDB1 and CUL4 associated factor 6
|
|
chr17_+_26369617
|
3.846
|
NM_016231
|
NLK
|
nemo-like kinase
|
|
chr3_+_42727010
|
3.792
|
NM_152393
|
KBTBD5
|
kelch repeat and BTB (POZ) domain containing 5
|
|
chr12_-_89745753
|
3.790
|
|
DUSP6
|
dual specificity phosphatase 6
|
|
chr18_-_74729049
|
3.783
|
NM_001025081
NM_001025090
NM_001025092
NM_002385
|
MBP
|
myelin basic protein
|
|
chr12_-_49392909
|
3.719
|
NM_015086
|
DDN
|
dendrin
|
|
chr15_-_41408409
|
3.691
|
|
INO80
|
INO80 homolog (S. cerevisiae)
|
|
chr3_+_45636176
|
3.651
|
NM_014240
|
LIMD1
|
LIM domains containing 1
|
|
chr20_-_3765747
|
3.643
|
|
CENPB
|
centromere protein B, 80kDa
|
|
chr2_+_241808161
|
3.643
|
NM_000030
|
AGXT
|
alanine-glyoxylate aminotransferase
|
|
chr15_-_41408329
|
3.633
|
NM_017553
|
INO80
|
INO80 homolog (S. cerevisiae)
|
|
chrX_-_153285262
|
3.623
|
|
IRAK1
|
interleukin-1 receptor-associated kinase 1
|
|
chrY_+_2803409
|
3.600
|
NM_001145275
NM_003411
|
ZFY
|
zinc finger protein, Y-linked
|
|
chr8_+_121823538
|
3.589
|
|
|
|
|
chr20_-_50179167
|
3.587
|
NM_001136021
|
NFATC2
|
nuclear factor of activated T-cells, cytoplasmic, calcineurin-dependent 2
|
|
chrX_+_48456122
|
3.570
|
|
WDR13
|
WD repeat domain 13
|
|
chr18_+_11851388
|
3.568
|
NM_020412
|
CHMP1B
|
charged multivesicular body protein 1B
|
|
chr18_-_74728963
|
3.517
|
|
MBP
|
myelin basic protein
|
|
chr17_-_42466840
|
3.485
|
NM_000419
|
ITGA2B
|
integrin, alpha 2b (platelet glycoprotein IIb of IIb/IIIa complex, antigen CD41)
|
|
chr17_-_1531543
|
3.460
|
|
SLC43A2
|
solute carrier family 43, member 2
|
|
chr5_-_180670732
|
3.432
|
|
GNB2L1
|
guanine nucleotide binding protein (G protein), beta polypeptide 2-like 1
|
|
chr1_+_167905921
|
3.426
|
|
DCAF6
|
DDB1 and CUL4 associated factor 6
|
|
chr6_+_43265994
|
3.374
|
NM_006672
NM_153320
|
SLC22A7
|
solute carrier family 22 (organic anion transporter), member 7
|
|
chr20_+_30697291
|
3.333
|
NM_014742
|
TM9SF4
|
transmembrane 9 superfamily protein member 4
|
|
chr20_-_34243118
|
3.299
|
|
RBM12
|
RNA binding motif protein 12
|
|
chr1_-_154155680
|
3.291
|
|
TPM3
|
tropomyosin 3
|
|
chr22_-_24110054
|
3.283
|
NM_213720
|
CHCHD10
|
coiled-coil-helix-coiled-coil-helix domain containing 10
|
|
chr15_-_60884615
|
3.240
|
NM_134262
|
RORA
|
RAR-related orphan receptor A
|
|
chr5_+_139876504
|
3.233
|
|
ANKHD1
|
ankyrin repeat and KH domain containing 1
|
|
chr1_-_154155646
|
3.219
|
|
TPM3
|
tropomyosin 3
|
|
chr18_-_72920989
|
3.214
|
|
|
|
|
chr1_+_27101217
|
3.211
|
|
ARID1A
|
AT rich interactive domain 1A (SWI-like)
|
|
chr20_+_30697512
|
3.210
|
|
TM9SF4
|
transmembrane 9 superfamily protein member 4
|
|
chrX_-_46618471
|
3.186
|
NM_032591
|
SLC9A7
|
solute carrier family 9 (sodium/hydrogen exchanger), member 7
|
|
chr7_-_139477437
|
3.182
|
NM_001113239
NM_022740
|
HIPK2
|
homeodomain interacting protein kinase 2
|
|
chrX_-_46618596
|
3.167
|
|
SLC9A7
|
solute carrier family 9 (sodium/hydrogen exchanger), member 7
|
|
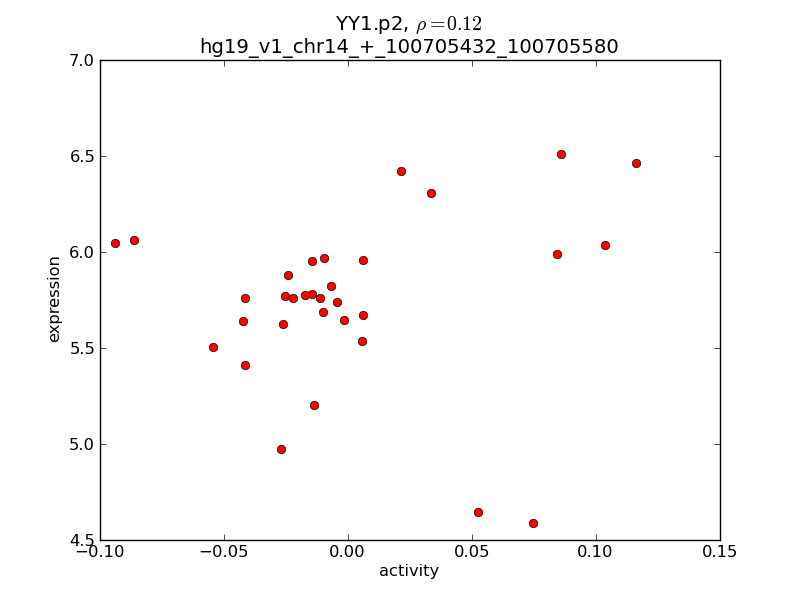
chr14_+_100705432
|
3.166
|
|
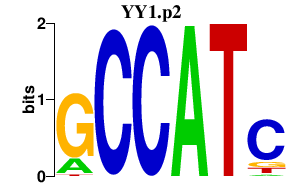
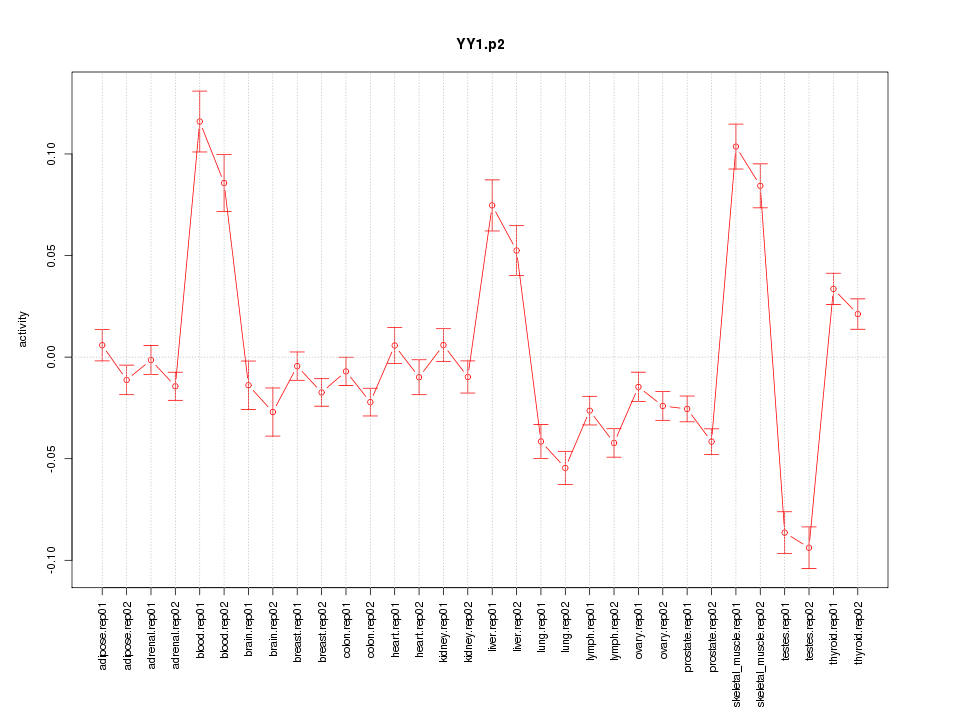
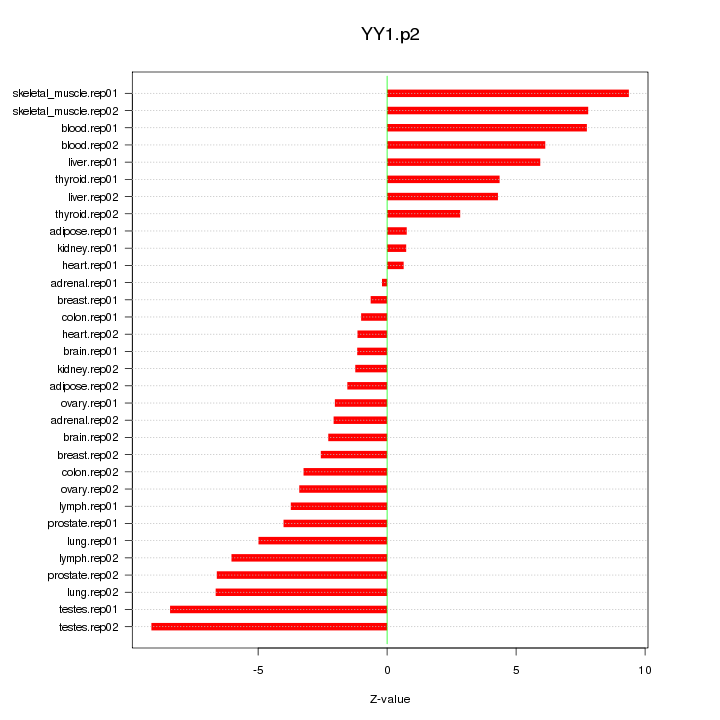
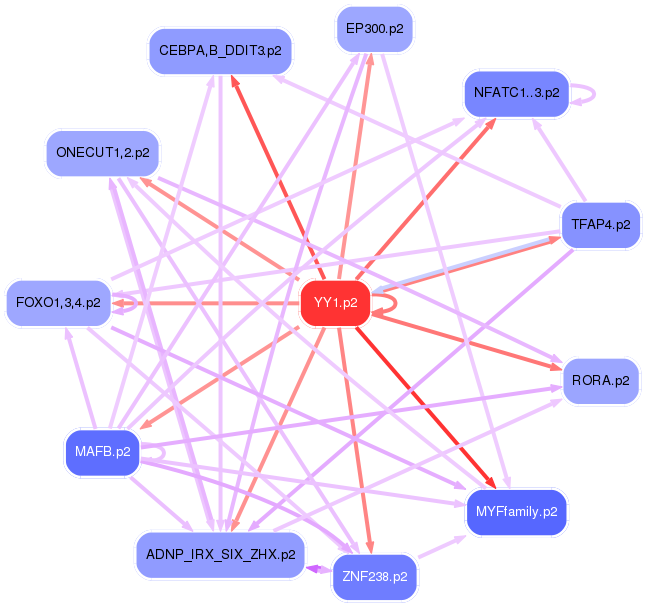
YY1
|
YY1 transcription factor
|
|
chr1_+_167906055
|
3.158
|
|
DCAF6
|
DDB1 and CUL4 associated factor 6
|
|
chr2_+_149402321
|
3.119
|
|
EPC2
|
enhancer of polycomb homolog 2 (Drosophila)
|
|
chr2_+_128175989
|
3.111
|
NM_000312
|
PROC
|
protein C (inactivator of coagulation factors Va and VIIIa)
|
|
chr17_+_72832064
|
3.073
|
|
TMEM104
|
transmembrane protein 104
|
|
chr1_-_200377262
|
3.073
|
|
ZNF281
|
zinc finger protein 281
|
|
chr5_+_70944968
|
3.059
|
|
MCCC2
|
methylcrotonoyl-CoA carboxylase 2 (beta)
|
|
chr19_+_46850344
|
3.039
|
|
PPP5C
|
protein phosphatase 5, catalytic subunit
|
|
chr1_-_211751719
|
3.029
|
|
SLC30A1
|
solute carrier family 30 (zinc transporter), member 1
|
|
chr21_+_43639202
|
3.028
|
NM_004915
NM_016818
|
ABCG1
|
ATP-binding cassette, sub-family G (WHITE), member 1
|
|
chr1_-_154155637
|
3.016
|
|
TPM3
|
tropomyosin 3
|
|
chr3_-_12705329
|
2.997
|
|
RAF1
|
v-raf-1 murine leukemia viral oncogene homolog 1
|
|
chr12_+_122459791
|
2.991
|
NM_001024808
NM_020993
|
BCL7A
|
B-cell CLL/lymphoma 7A
|
|
chr1_-_55681024
|
2.978
|
NM_015306
|
USP24
|
ubiquitin specific peptidase 24
|
|
chr1_-_154155636
|
2.945
|
|
TPM3
|
tropomyosin 3
|
|
chr2_-_97509733
|
2.929
|
NM_144994
|
ANKRD23
|
ankyrin repeat domain 23
|
|
chr19_-_3985343
|
2.901
|
|
EEF2
|
eukaryotic translation elongation factor 2
|
|
chr5_+_176562084
|
2.878
|
|
NSD1
|
nuclear receptor binding SET domain protein 1
|
|
chr1_-_154155698
|
2.874
|
NM_001043351
NM_001043352
NM_001043353
NM_153649
|
TPM3
|
tropomyosin 3
|
|
chr16_-_4322695
|
2.856
|
|
TFAP4
|
transcription factor AP-4 (activating enhancer binding protein 4)
|
|
chr3_+_197677049
|
2.855
|
NM_000996
|
RPL35A
|
ribosomal protein L35a
|
|
chr2_-_44065888
|
2.855
|
NM_022436
|
ABCG5
|
ATP-binding cassette, sub-family G (WHITE), member 5
|
|
chr1_-_154155685
|
2.843
|
|
TPM3
|
tropomyosin 3
|
|
chr11_-_129872719
|
2.840
|
NM_020228
NM_199437
|
PRDM10
|
PR domain containing 10
|
|
chr3_-_126194710
|
2.813
|
|
ZXDC
|
ZXD family zinc finger C
|
|
chr17_-_76719671
|
2.805
|
|
CYTH1
|
cytohesin 1
|
|
chr19_+_4791727
|
2.805
|
NM_018708
|
FEM1A
|
fem-1 homolog a (C. elegans)
|
|
chr3_+_50654600
|
2.791
|
|
MAPKAPK3
|
mitogen-activated protein kinase-activated protein kinase 3
|
|
chr3_+_50654868
|
2.782
|
|
MAPKAPK3
|
mitogen-activated protein kinase-activated protein kinase 3
|
|
chr11_+_4470524
|
2.779
|
NM_001005172
|
OR52K2
|
olfactory receptor, family 52, subfamily K, member 2
|
|
chr19_+_46850245
|
2.762
|
NM_001204284
NM_006247
|
PPP5C
|
protein phosphatase 5, catalytic subunit
|
|
chr19_+_49468587
|
2.756
|
|
FTL
|
ferritin, light polypeptide
|
|
chr2_-_211179765
|
2.744
|
NM_079420
|
MYL1
|
myosin, light chain 1, alkali; skeletal, fast
|
|
chr19_+_49468557
|
2.740
|
NM_000146
|
FTL
|
ferritin, light polypeptide
|
|
chr19_+_4791757
|
2.717
|
|
FEM1A
|
fem-1 homolog a (C. elegans)
|
|
chrX_+_48456220
|
2.715
|
NM_001166426
|
WDR13
|
WD repeat domain 13
|
|
chr16_+_47495166
|
2.703
|
NM_000293
NM_001031835
|
PHKB
|
phosphorylase kinase, beta
|
|
chr1_-_144931707
|
2.700
|
|
PDE4DIP
|
phosphodiesterase 4D interacting protein
|
|
chr4_-_23891608
|
2.695
|
NM_013261
|
PPARGC1A
|
peroxisome proliferator-activated receptor gamma, coactivator 1 alpha
|
|
chr1_+_244214576
|
2.693
|
|
ZNF238
|
zinc finger protein 238
|
|
chr19_-_39322411
|
2.686
|
NM_001398
|
ECH1
|
enoyl CoA hydratase 1, peroxisomal
|
|
chr3_-_12705612
|
2.676
|
|
RAF1
|
v-raf-1 murine leukemia viral oncogene homolog 1
|
|
chr20_-_50179338
|
2.653
|
|
NFATC2
|
nuclear factor of activated T-cells, cytoplasmic, calcineurin-dependent 2
|
|
chr7_+_150065968
|
2.652
|
|
REPIN1
|
replication initiator 1
|
|
chr14_-_95599794
|
2.641
|
NM_001195573
|
DICER1
|
dicer 1, ribonuclease type III
|
|
chr11_-_6462129
|
2.640
|
NM_000613
|
HPX
|
hemopexin
|
|
chr1_+_149553002
|
2.639
|
NM_178230
NM_001143883
NM_001135789
|
PPIAL4A
PPIAL4G
PPIAL4B
PPIAL4C
|
peptidylprolyl isomerase A (cyclophilin A)-like 4A
peptidylprolyl isomerase A (cyclophilin A)-like 4G
peptidylprolyl isomerase A (cyclophilin A)-like 4B
peptidylprolyl isomerase A (cyclophilin A)-like 4C
|
|
chr17_-_4851797
|
2.638
|
NM_005022
|
PFN1
|
profilin 1
|
|
chr17_-_4851827
|
2.632
|
|
PFN1
|
profilin 1
|
|
chr3_+_50654558
|
2.632
|
NM_001243925
NM_004635
|
MAPKAPK3
|
mitogen-activated protein kinase-activated protein kinase 3
|
|
chr3_-_171177851
|
2.632
|
NM_001161560
NM_001161561
NM_001161562
NM_001161563
NM_001161564
NM_001161565
NM_001161566
NM_015028
|
TNIK
|
TRAF2 and NCK interacting kinase
|
|
chr7_-_150884918
|
2.624
|
NM_080871
|
ASB10
|
ankyrin repeat and SOCS box containing 10
|
|
chr6_+_43266008
|
2.619
|
|
SLC22A7
|
solute carrier family 22 (organic anion transporter), member 7
|
|
chr9_-_123342258
|
2.600
|
NM_001011649
NM_018249
|
CDK5RAP2
|
CDK5 regulatory subunit associated protein 2
|
|
chr19_+_4791756
|
2.600
|
|
FEM1A
|
fem-1 homolog a (C. elegans)
|
|
chr2_+_44066102
|
2.587
|
NM_022437
|
ABCG8
|
ATP-binding cassette, sub-family G (WHITE), member 8
|
|
chr10_-_70092648
|
2.585
|
NM_001033083
NM_022129
|
PBLD
|
phenazine biosynthesis-like protein domain containing
|
|
chr1_+_222885895
|
2.569
|
NM_144695
|
BROX
|
BRO1 domain and CAAX motif containing
|
|
chr21_+_17102286
|
2.566
|
|
USP25
|
ubiquitin specific peptidase 25
|
|
chr2_+_128176019
|
2.546
|
|
PROC
|
protein C (inactivator of coagulation factors Va and VIIIa)
|
|
chr7_-_37025696
|
2.544
|
|
ELMO1
|
engulfment and cell motility 1
|
|
chr15_-_90347534
|
2.542
|
|
ANPEP
|
alanyl (membrane) aminopeptidase
|
|
chr2_+_200819928
|
2.536
|
NM_024520
|
C2orf47
|
chromosome 2 open reading frame 47
|
|
chr1_-_211751953
|
2.532
|
|
SLC30A1
|
solute carrier family 30 (zinc transporter), member 1
|
|
chr17_-_9694613
|
2.521
|
NM_001105571
NM_001220493
|
DHRS7C
|
dehydrogenase/reductase (SDR family) member 7C
|
|
chr13_-_76055872
|
2.508
|
NM_014832
|
TBC1D4
|
TBC1 domain family, member 4
|
|
chr6_+_42883726
|
2.501
|
NM_001243168
NM_001243169
NM_001243170
NM_138296
|
PTCRA
|
pre T-cell antigen receptor alpha
|
|
chr19_+_16771912
|
2.485
|
NM_024074
|
TMEM38A
|
transmembrane protein 38A
|
|
chr17_+_36861398
|
2.484
|
|
MLLT6
|
myeloid/lymphoid or mixed-lineage leukemia (trithorax homolog, Drosophila); translocated to, 6
|
|
chr3_+_50654589
|
2.469
|
|
MAPKAPK3
|
mitogen-activated protein kinase-activated protein kinase 3
|
|
chr8_+_9953061
|
2.466
|
NM_001135671
NM_001199729
|
MSRA
|
methionine sulfoxide reductase A
|
|
chr19_+_2269526
|
2.466
|
|
OAZ1
|
ornithine decarboxylase antizyme 1
|
|
chr17_+_45727558
|
2.465
|
|
KPNB1
|
karyopherin (importin) beta 1
|
|
chr21_+_34922923
|
2.456
|
|
SON
|
SON DNA binding protein
|
|
chr1_-_149858114
|
2.452
|
NM_003528
|
HIST2H2BE
|
histone cluster 2, H2be
|
|
chr5_-_180670874
|
2.450
|
NM_006098
|
GNB2L1
|
guanine nucleotide binding protein (G protein), beta polypeptide 2-like 1
|
|
chrX_-_153285334
|
2.443
|
NM_001025242
NM_001025243
NM_001569
|
IRAK1
|
interleukin-1 receptor-associated kinase 1
|
|
chr15_-_25684161
|
2.425
|
NM_000462
NM_130839
|
UBE3A
|
ubiquitin protein ligase E3A
|
|
chr12_-_4554779
|
2.421
|
NM_020996
|
FGF6
|
fibroblast growth factor 6
|
|
chr15_-_67546968
|
2.414
|
NM_024666
|
AAGAB
|
alpha- and gamma-adaptin binding protein
|
|
chr11_-_118900078
|
2.408
|
NM_001164280
|
SLC37A4
|
solute carrier family 37 (glucose-6-phosphate transporter), member 4
|
|
chr21_+_17102370
|
2.403
|
NM_013396
|
USP25
|
ubiquitin specific peptidase 25
|
|
chr1_+_145507556
|
2.403
|
NM_005105
|
RBM8A
|
RNA binding motif protein 8A
|
|
chr12_+_57849086
|
2.393
|
NM_031479
|
INHBE
|
inhibin, beta E
|
|
chr11_-_61124223
|
2.377
|
NM_001161452
|
CYBASC3
|
cytochrome b, ascorbate dependent 3
|
|
chr19_+_2269529
|
2.375
|
|
OAZ1
|
ornithine decarboxylase antizyme 1
|
|
chr1_+_244214552
|
2.372
|
NM_205768
|
ZNF238
|
zinc finger protein 238
|
|
chr10_-_32636084
|
2.367
|
NM_025209
|
EPC1
|
enhancer of polycomb homolog 1 (Drosophila)
|
|
chr6_+_108882104
|
2.366
|
|
FOXO3
|
forkhead box O3
|
|
chr2_+_178257371
|
2.359
|
NM_003659
|
AGPS
|
alkylglycerone phosphate synthase
|
|
chrY_+_22737610
|
2.338
|
NM_004681
|
EIF1AY
|
eukaryotic translation initiation factor 1A, Y-linked
|
|
chr20_-_36152952
|
2.335
|
NM_001167823
|
BLCAP
|
bladder cancer associated protein
|
|
chr10_+_81073763
|
2.330
|
|
ZMIZ1
|
zinc finger, MIZ-type containing 1
|
|
chr16_+_47495225
|
2.317
|
|
PHKB
|
phosphorylase kinase, beta
|
|
chr3_-_128840343
|
2.315
|
|
RAB43
|
RAB43, member RAS oncogene family
|
|
chr11_-_62996998
|
2.314
|
NM_199352
|
SLC22A25
|
solute carrier family 22, member 25
|
|
chr2_-_21228189
|
2.284
|
|
APOB
|
apolipoprotein B (including Ag(x) antigen)
|
|
chr9_-_123476578
|
2.278
|
NM_001080497
|
MEGF9
|
multiple EGF-like-domains 9
|
|
chr11_+_111473099
|
2.273
|
NM_015191
|
SIK2
|
salt-inducible kinase 2
|
|
chr11_+_33350076
|
2.271
|
|
HIPK3
|
homeodomain interacting protein kinase 3
|
|
chr10_-_32635842
|
2.268
|
|
EPC1
|
enhancer of polycomb homolog 1 (Drosophila)
|
|
chr20_-_49547451
|
2.267
|
NM_015339
NM_181442
|
ADNP
|
activity-dependent neuroprotector homeobox
|
|
chr1_+_27023932
|
2.266
|
|
ARID1A
|
AT rich interactive domain 1A (SWI-like)
|
|
chr10_+_104503724
|
2.266
|
NM_001083913
|
C10orf26
|
chromosome 10 open reading frame 26
|
|
chr3_+_42190736
|
2.264
|
|
TRAK1
|
trafficking protein, kinesin binding 1
|
|
chr7_+_123295860
|
2.264
|
NM_207163
|
LMOD2
|
leiomodin 2 (cardiac)
|
|
chr12_+_56862300
|
2.263
|
NM_207344
|
SPRYD4
|
SPRY domain containing 4
|
|
chr14_-_23504353
|
2.261
|
NM_001144932
NM_002797
NM_001130725
|
PSMB5
|
proteasome (prosome, macropain) subunit, beta type, 5
|
|
chr19_+_2269515
|
2.255
|
NM_004152
|
OAZ1
SPPL2B
|
ornithine decarboxylase antizyme 1
signal peptide peptidase-like 2B
|
|
chr17_-_40169670
|
2.247
|
NM_003315
|
DNAJC7
|
DnaJ (Hsp40) homolog, subfamily C, member 7
|
|
chr16_-_68057098
|
2.246
|
|
DDX28
|
DEAD (Asp-Glu-Ala-Asp) box polypeptide 28
|
|
chr5_+_176560882
|
2.244
|
|
NSD1
|
nuclear receptor binding SET domain protein 1
|
|
chr16_-_68057120
|
2.240
|
|
DDX28
|
DEAD (Asp-Glu-Ala-Asp) box polypeptide 28
|
|
chr1_-_162381805
|
2.239
|
NM_053282
|
SH2D1B
|
SH2 domain containing 1B
|
|
chr19_-_13044524
|
2.238
|
|
FARSA
|
phenylalanyl-tRNA synthetase, alpha subunit
|
|
chr6_+_27775898
|
2.235
|
NM_003509
|
HIST1H2AI
HIST1H2AM
HIST1H3F
|
histone cluster 1, H2ai
histone cluster 1, H2am
histone cluster 1, H3f
|
|
chr2_+_178257488
|
2.235
|
|
AGPS
|
alkylglycerone phosphate synthase
|
|
chr3_+_134514044
|
2.222
|
NM_004441
|
EPHB1
|
EPH receptor B1
|
|
chr6_+_111408780
|
2.219
|
NM_018593
|
SLC16A10
|
solute carrier family 16, member 10 (aromatic amino acid transporter)
|
|
chr19_-_14224979
|
2.216
|
NM_207518
|
PRKACA
|
protein kinase, cAMP-dependent, catalytic, alpha
|
|
chr17_+_74732629
|
2.214
|
NM_001242534
|
MFSD11
|
major facilitator superfamily domain containing 11
|
|
chr17_-_2240677
|
2.204
|
NM_018128
|
TSR1
|
TSR1, 20S rRNA accumulation, homolog (S. cerevisiae)
|
|
chr19_-_13044528
|
2.197
|
NM_004461
|
FARSA
|
phenylalanyl-tRNA synthetase, alpha subunit
|
|
chr15_-_25684059
|
2.196
|
|
UBE3A
|
ubiquitin protein ligase E3A
|
|
chr12_-_49960221
|
2.185
|
NM_001012300
|
MCRS1
|
microspherule protein 1
|
|
chr18_+_55102777
|
2.183
|
NM_004852
|
ONECUT2
|
one cut homeobox 2
|
|
chr11_-_62559423
|
2.166
|
NM_001080501
|
TMEM223
|
transmembrane protein 223
|
|
chr17_-_41856180
|
2.158
|
NM_004090
|
DUSP3
|
dual specificity phosphatase 3
|
|
chr12_+_98987389
|
2.153
|
NM_002635
NM_005888
NM_213611
|
SLC25A3
|
solute carrier family 25 (mitochondrial carrier; phosphate carrier), member 3
|
|
chr1_-_154155664
|
2.152
|
|
TPM3
|
tropomyosin 3
|
|
chr15_-_90347173
|
2.151
|
|
ANPEP
|
alanyl (membrane) aminopeptidase
|