|
chr2_-_230579198
|
3.692
|
NM_139072
|
DNER
|
delta/notch-like EGF repeat containing
|
|
chr5_+_139175385
|
3.657
|
NM_032289
|
PSD2
|
pleckstrin and Sec7 domain containing 2
|
|
chr14_+_24540742
|
3.320
|
NM_006032
|
CPNE6
|
copine VI (neuronal)
|
|
chr8_+_104512975
|
3.293
|
NM_001100117
|
RIMS2
|
regulating synaptic membrane exocytosis 2
|
|
chr3_+_181429711
|
3.251
|
NM_003106
|
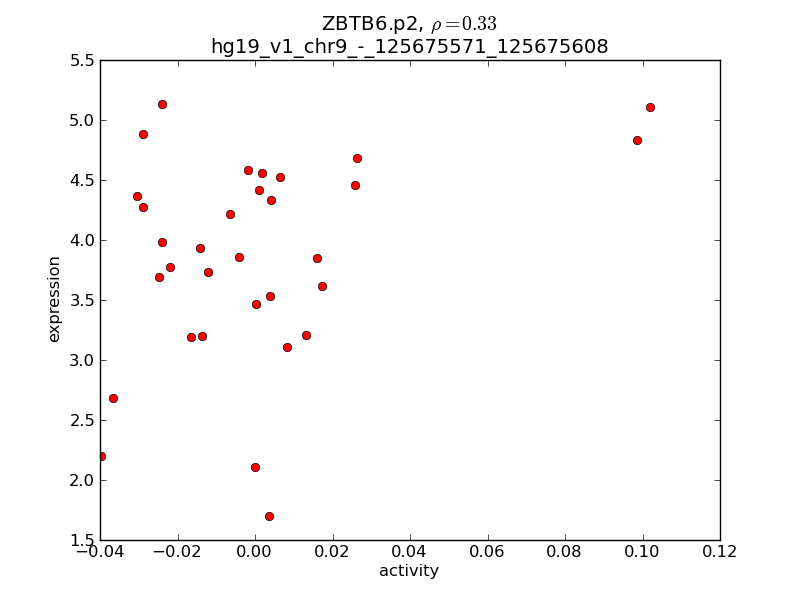
SOX2
|
SRY (sex determining region Y)-box 2
|
|
chr9_+_34958320
|
2.988
|
|
KIAA1045
|
KIAA1045
|
|
chr22_+_26565424
|
2.917
|
NM_001184773
NM_001184774
NM_001184775
NM_001184776
NM_001184777
NM_021115
|
SEZ6L
|
seizure related 6 homolog (mouse)-like
|
|
chr3_+_10857867
|
2.651
|
NM_014229
|
SLC6A11
|
solute carrier family 6 (neurotransmitter transporter, GABA), member 11
|
|
chr5_+_175298604
|
2.615
|
|
CPLX2
|
complexin 2
|
|
chr4_+_159131642
|
2.527
|
|
TMEM144
|
transmembrane protein 144
|
|
chr1_-_160039946
|
2.458
|
NM_002241
|
KCNJ10
|
potassium inwardly-rectifying channel, subfamily J, member 10
|
|
chr11_+_33563772
|
2.421
|
NM_012194
|
C11orf41
|
chromosome 11 open reading frame 41
|
|
chr22_-_39240016
|
2.417
|
NM_014293
|
NPTXR
|
neuronal pentraxin receptor
|
|
chr9_+_87284625
|
2.398
|
NM_001007097
|
NTRK2
|
neurotrophic tyrosine kinase, receptor, type 2
|
|
chr5_+_175298492
|
2.305
|
NM_001008220
|
CPLX2
|
complexin 2
|
|
chr9_+_87284680
|
2.298
|
|
NTRK2
|
neurotrophic tyrosine kinase, receptor, type 2
|
|
chr3_+_181430075
|
2.288
|
|
SOX2
|
SRY (sex determining region Y)-box 2
|
|
chr12_-_6809595
|
2.277
|
NM_001244015
|
C12orf53
|
chromosome 12 open reading frame 53
|
|
chr5_+_175308843
|
2.275
|
|
CPLX2
|
complexin 2
|
|
chr4_-_163085117
|
2.272
|
NM_001128427
NM_001128428
NM_020116
|
FSTL5
|
follistatin-like 5
|
|
chr14_-_60337350
|
2.253
|
NM_021136
|
RTN1
|
reticulon 1
|
|
chr15_-_83378488
|
2.247
|
NM_004644
|
AP3B2
|
adaptor-related protein complex 3, beta 2 subunit
|
|
chr10_-_61469322
|
2.208
|
NM_194298
|
LOC100129721
SLC16A9
|
uncharacterized LOC100129721
solute carrier family 16, member 9 (monocarboxylic acid transporter 9)
|
|
chr9_+_87284733
|
2.197
|
|
NTRK2
|
neurotrophic tyrosine kinase, receptor, type 2
|
|
chr5_+_175298538
|
2.173
|
|
CPLX2
|
complexin 2
|
|
chr20_-_62103815
|
2.103
|
NM_004518
NM_172106
NM_172107
NM_172108
NM_172109
|
KCNQ2
|
potassium voltage-gated channel, KQT-like subfamily, member 2
|
|
chr12_-_6809965
|
2.066
|
NM_001244014
NM_153685
|
C12orf53
|
chromosome 12 open reading frame 53
|
|
chr1_+_110693131
|
2.066
|
NM_001010898
|
SLC6A17
|
solute carrier family 6, member 17
|
|
chr14_+_29236882
|
2.036
|
|
FOXG1
|
forkhead box G1
|
|
chr3_-_62860561
|
2.004
|
|
|
|
|
chr19_+_54385429
|
1.984
|
NM_002739
|
PRKCG
|
protein kinase C, gamma
|
|
chr2_-_220174058
|
1.936
|
|
PTPRN
|
protein tyrosine phosphatase, receptor type, N
|
|
chr9_+_87284637
|
1.917
|
|
NTRK2
|
neurotrophic tyrosine kinase, receptor, type 2
|
|
chr19_+_36359346
|
1.883
|
NM_001024807
NM_005166
|
APLP1
|
amyloid beta (A4) precursor-like protein 1
|
|
chr13_-_25745778
|
1.816
|
NM_152704
NM_199138
|
FAM123A
|
family with sequence similarity 123A
|
|
chr3_+_159943628
|
1.803
|
|
C3orf80
|
chromosome 3 open reading frame 80
|
|
chr4_+_159131400
|
1.788
|
NM_018342
|
TMEM144
|
transmembrane protein 144
|
|
chr7_-_100493481
|
1.778
|
NM_000665
NM_015831
|
ACHE
|
acetylcholinesterase
|
|
chr5_+_167956545
|
1.753
|
|
|
|
|
chr11_-_45687135
|
1.734
|
NM_003654
|
CHST1
|
carbohydrate (keratan sulfate Gal-6) sulfotransferase 1
|
|
chr10_-_99790584
|
1.732
|
NM_001206528
NM_018058
|
CRTAC1
|
cartilage acidic protein 1
|
|
chr16_+_56225301
|
1.723
|
|
GNAO1
|
guanine nucleotide binding protein (G protein), alpha activating activity polypeptide O
|
|
chr17_-_42992852
|
1.722
|
NM_001131019
NM_001242376
NM_002055
|
GFAP
|
glial fibrillary acidic protein
|
|
chr22_+_26565623
|
1.712
|
|
SEZ6L
|
seizure related 6 homolog (mouse)-like
|
|
chr9_+_87284573
|
1.704
|
NM_001018065
NM_001018066
|
NTRK2
|
neurotrophic tyrosine kinase, receptor, type 2
|
|
chr11_-_12030882
|
1.696
|
NM_013253
|
DKK3
|
dickkopf 3 homolog (Xenopus laevis)
|
|
chr3_-_58563490
|
1.644
|
NM_001076778
NM_007177
|
FAM107A
|
family with sequence similarity 107, member A
|
|
chr1_+_116380404
|
1.626
|
|
NHLH2
|
nescient helix loop helix 2
|
|
chr4_+_30721865
|
1.612
|
NM_032456
NM_001173523
NM_002589
NM_032457
|
PCDH7
|
protocadherin 7
|
|
chr8_+_63161499
|
1.586
|
NM_173688
|
NKAIN3
|
Na+/K+ transporting ATPase interacting 3
|
|
chr16_+_87636574
|
1.584
|
|
JPH3
|
junctophilin 3
|
|
chr21_-_43916298
|
1.582
|
NM_080860
|
RSPH1
|
radial spoke head 1 homolog (Chlamydomonas)
|
|
chr13_-_25745620
|
1.561
|
|
FAM123A
|
family with sequence similarity 123A
|
|
chr4_+_1795004
|
1.551
|
NM_000142
NM_001163213
NM_022965
|
FGFR3
|
fibroblast growth factor receptor 3
|
|
chr4_-_139163222
|
1.549
|
NM_014331
|
SLC7A11
|
solute carrier family 7 (anionic amino acid transporter light chain, xc- system), member 11
|
|
chr5_-_176057324
|
1.548
|
NM_001001502
NM_003085
|
SNCB
|
synuclein, beta
|
|
chrX_-_153095996
|
1.542
|
NM_032512
|
PDZD4
|
PDZ domain containing 4
|
|
chr4_+_41258941
|
1.534
|
|
UCHL1
|
ubiquitin carboxyl-terminal esterase L1 (ubiquitin thiolesterase)
|
|
chr17_+_7608413
|
1.530
|
NM_001406
|
EFNB3
|
ephrin-B3
|
|
chr11_-_12030757
|
1.526
|
|
DKK3
|
dickkopf 3 homolog (Xenopus laevis)
|
|
chr22_-_39239733
|
1.520
|
|
|
|
|
chr10_+_116853118
|
1.505
|
NM_207303
|
ATRNL1
|
attractin-like 1
|
|
chrX_-_51239426
|
1.500
|
NM_018159
|
NUDT11
|
nudix (nucleoside diphosphate linked moiety X)-type motif 11
|
|
chr13_+_37248048
|
1.497
|
NM_203451
|
SERTM1
|
serine-rich and transmembrane domain containing 1
|
|
chr20_+_57875481
|
1.489
|
NM_000114
NM_207032
NM_207033
NM_207034
|
EDN3
|
endothelin 3
|
|
chr12_+_79258794
|
1.486
|
|
SYT1
|
synaptotagmin I
|
|
chr9_-_101470836
|
1.467
|
NM_005458
|
GABBR2
|
gamma-aminobutyric acid (GABA) B receptor, 2
|
|
chr21_+_34442446
|
1.449
|
NM_138983
|
OLIG1
|
oligodendrocyte transcription factor 1
|
|
chr11_+_17757494
|
1.443
|
NM_001112741
NM_004976
|
KCNC1
|
potassium voltage-gated channel, Shaw-related subfamily, member 1
|
|
chr5_-_146258143
|
1.438
|
NM_004576
NM_181675
NM_001127381
|
PPP2R2B
|
protein phosphatase 2, regulatory subunit B, beta
|
|
chr10_-_108924287
|
1.438
|
NM_001013031
NM_001206569
NM_001206570
NM_001206571
NM_001206572
NM_052918
|
SORCS1
|
sortilin-related VPS10 domain containing receptor 1
|
|
chr15_+_84115979
|
1.404
|
NM_003027
|
SH3GL3
|
SH3-domain GRB2-like 3
|
|
chr12_+_79258588
|
1.400
|
|
SYT1
|
synaptotagmin I
|
|
chr15_+_84116172
|
1.398
|
|
SH3GL3
|
SH3-domain GRB2-like 3
|
|
chr11_-_75379414
|
1.361
|
NM_033063
NM_207577
|
MAP6
|
microtubule-associated protein 6
|
|
chr5_+_173472692
|
1.355
|
NM_015980
|
HMP19
|
HMP19 protein
|
|
chr5_-_146257633
|
1.351
|
|
PPP2R2B
|
protein phosphatase 2, regulatory subunit B, beta
|
|
chr11_-_12030622
|
1.350
|
NM_015881
|
DKK3
|
dickkopf 3 homolog (Xenopus laevis)
|
|
chr4_+_41258909
|
1.345
|
|
UCHL1
|
ubiquitin carboxyl-terminal esterase L1 (ubiquitin thiolesterase)
|
|
chr10_+_119806334
|
1.345
|
|
CASC2
|
cancer susceptibility candidate 2 (non-protein coding)
|
|
chr19_-_55691468
|
1.342
|
NM_003180
|
SYT5
|
synaptotagmin V
|
|
chrX_-_92928566
|
1.338
|
NM_004538
|
NAP1L3
|
nucleosome assembly protein 1-like 3
|
|
chr15_+_80696569
|
1.330
|
NM_014862
|
ARNT2
|
aryl-hydrocarbon receptor nuclear translocator 2
|
|
chr22_+_26565454
|
1.324
|
|
SEZ6L
|
seizure related 6 homolog (mouse)-like
|
|
chr11_-_12030539
|
1.324
|
|
DKK3
|
dickkopf 3 homolog (Xenopus laevis)
|
|
chr19_-_15090349
|
1.309
|
|
SLC1A6
|
solute carrier family 1 (high affinity aspartate/glutamate transporter), member 6
|
|
chr11_-_12030838
|
1.309
|
|
DKK3
|
dickkopf 3 homolog (Xenopus laevis)
|
|
chr3_+_6902812
|
1.308
|
|
GRM7
|
glutamate receptor, metabotropic 7
|
|
chr3_+_63428752
|
1.302
|
NM_144642
|
SYNPR
|
synaptoporin
|
|
chr12_+_79258517
|
1.293
|
|
SYT1
|
synaptotagmin I
|
|
chr4_-_5889992
|
1.287
|
|
CRMP1
|
collapsin response mediator protein 1
|
|
chr22_+_42372763
|
1.277
|
NM_019106
NM_145733
|
SEPT3
|
septin 3
|
|
chr9_+_137979513
|
1.270
|
|
OLFM1
|
olfactomedin 1
|
|
chr4_+_41258895
|
1.251
|
NM_004181
|
UCHL1
|
ubiquitin carboxyl-terminal esterase L1 (ubiquitin thiolesterase)
|
|
chr3_+_6902797
|
1.248
|
NM_000844
NM_181874
|
GRM7
|
glutamate receptor, metabotropic 7
|
|
chr11_-_75379113
|
1.242
|
|
MAP6
|
microtubule-associated protein 6
|
|
chr13_+_88324777
|
1.235
|
NM_015567
|
SLITRK5
|
SLIT and NTRK-like family, member 5
|
|
chr18_-_35145603
|
1.233
|
|
CELF4
|
CUGBP, Elav-like family member 4
|
|
chr7_-_4998744
|
1.232
|
NM_001100600
NM_198403
|
MMD2
|
monocyte to macrophage differentiation-associated 2
|
|
chr8_-_21646327
|
1.226
|
NM_001165038
NM_001165039
NM_001495
|
GFRA2
|
GDNF family receptor alpha 2
|
|
chr11_+_61520000
|
1.218
|
NM_001127392
|
C11orf9
|
chromosome 11 open reading frame 9
|
|
chr3_-_56502364
|
1.209
|
NM_015576
|
ERC2
|
ELKS/RAB6-interacting/CAST family member 2
|
|
chr15_+_71184781
|
1.202
|
NM_001199017
NM_017691
NM_001199018
|
LRRC49
|
leucine rich repeat containing 49
|
|
chrX_-_51239295
|
1.196
|
|
NUDT11
|
nudix (nucleoside diphosphate linked moiety X)-type motif 11
|
|
chr7_-_143059696
|
1.196
|
NM_001031690
|
FAM131B
|
family with sequence similarity 131, member B
|
|
chr4_+_134073180
|
1.187
|
|
PCDH10
|
protocadherin 10
|
|
chr3_-_62861012
|
1.183
|
NM_003716
NM_183393
NM_183394
|
CADPS
|
Ca++-dependent secretion activator
|
|
chr22_+_31518923
|
1.180
|
NM_001002837
|
INPP5J
|
inositol polyphosphate-5-phosphatase J
|
|
chr5_+_78985645
|
1.167
|
NM_153610
|
CMYA5
|
cardiomyopathy associated 5
|
|
chr19_-_19007395
|
1.166
|
|
CERS1
|
ceramide synthase 1
|
|
chr5_+_169931023
|
1.159
|
NM_001034837
NM_014592
|
KCNIP1
|
Kv channel interacting protein 1
|
|
chr2_-_154335181
|
1.155
|
NM_019845
|
RPRM
|
reprimo, TP53 dependent G2 arrest mediator candidate
|
|
chr8_-_40755328
|
1.154
|
NM_001135731
NM_024645
|
ZMAT4
|
zinc finger, matrin-type 4
|
|
chr2_-_193059599
|
1.153
|
NM_016192
|
TMEFF2
|
transmembrane protein with EGF-like and two follistatin-like domains 2
|
|
chr6_+_150464156
|
1.149
|
NM_030949
|
PPP1R14C
|
protein phosphatase 1, regulatory (inhibitor) subunit 14C
|
|
chr20_+_57875647
|
1.148
|
|
EDN3
|
endothelin 3
|
|
chr15_-_79382839
|
1.146
|
|
RASGRF1
|
Ras protein-specific guanine nucleotide-releasing factor 1
|
|
chr16_+_2039945
|
1.144
|
NM_004209
|
SYNGR3
|
synaptogyrin 3
|
|
chr9_-_139948448
|
1.140
|
NM_001246
NM_203468
|
ENTPD2
|
ectonucleoside triphosphate diphosphohydrolase 2
|
|
chr5_+_173472737
|
1.137
|
|
HMP19
|
HMP19 protein
|
|
chr12_+_121078421
|
1.132
|
NM_001033677
|
CABP1
|
calcium binding protein 1
|
|
chrX_+_110366304
|
1.124
|
NM_001128168
NM_001128172
NM_001128173
|
PAK3
|
p21 protein (Cdc42/Rac)-activated kinase 3
|
|
chr11_-_79151694
|
1.117
|
NM_001098816
|
ODZ4
|
odz, odd Oz/ten-m homolog 4 (Drosophila)
|
|
chr2_-_119916338
|
1.111
|
NM_182528
|
C1QL2
|
complement component 1, q subcomponent-like 2
|
|
chr6_-_88875766
|
1.109
|
NM_001160226
NM_001160258
NM_001160259
NM_016083
|
CNR1
|
cannabinoid receptor 1 (brain)
|
|
chr10_+_101089109
|
1.109
|
|
CNNM1
|
cyclin M1
|
|
chr2_+_39893021
|
1.108
|
NM_152390
|
TMEM178
|
transmembrane protein 178
|
|
chr18_+_48086402
|
1.107
|
NM_002747
|
MAPK4
|
mitogen-activated protein kinase 4
|
|
chr11_+_20691116
|
1.104
|
NM_006157
NM_201551
|
NELL1
|
NEL-like 1 (chicken)
|
|
chr16_-_31021716
|
1.094
|
NM_052874
|
STX1B
|
syntaxin 1B
|
|
chr6_+_30850693
|
1.086
|
|
DDR1
|
discoidin domain receptor tyrosine kinase 1
|
|
chr4_-_66536182
|
1.077
|
|
EPHA5
|
EPH receptor A5
|
|
chr11_+_63753827
|
1.076
|
|
OTUB1
|
OTU domain, ubiquitin aldehyde binding 1
|
|
chr10_+_106400858
|
1.071
|
NM_014978
|
SORCS3
|
sortilin-related VPS10 domain containing receptor 3
|
|
chr17_-_45056588
|
1.070
|
NM_203400
|
RPRML
|
reprimo-like
|
|
chr3_+_112052020
|
1.067
|
|
CD200
|
CD200 molecule
|
|
chr11_-_64377332
|
1.067
|
|
|
|
|
chr2_+_120302024
|
1.067
|
NM_001029996
|
PCDP1
|
primary ciliary dyskinesia protein 1
|
|
chr16_+_56225250
|
1.062
|
NM_020988
NM_138736
|
GNAO1
|
guanine nucleotide binding protein (G protein), alpha activating activity polypeptide O
|
|
chr1_+_202091971
|
1.062
|
NM_004767
|
GPR37L1
|
G protein-coupled receptor 37 like 1
|
|
chr6_-_166721870
|
1.061
|
NM_175922
|
PRR18
|
proline rich 18
|
|
chr10_+_101088794
|
1.055
|
NM_020348
|
CNNM1
|
cyclin M1
|
|
chr4_-_6422844
|
1.049
|
NM_001206996
|
PPP2R2C
|
protein phosphatase 2, regulatory subunit B, gamma
|
|
chr15_-_77924688
|
1.046
|
NM_032808
|
LINGO1
|
leucine rich repeat and Ig domain containing 1
|
|
chr5_-_63257545
|
1.045
|
NM_000524
|
HTR1A
|
5-hydroxytryptamine (serotonin) receptor 1A
|
|
chr3_+_147127151
|
1.044
|
NM_003412
|
ZIC1
|
Zic family member 1
|
|
chr21_-_31312229
|
1.034
|
NM_000830
NM_175611
|
GRIK1
|
glutamate receptor, ionotropic, kainate 1
|
|
chr1_+_205198058
|
1.032
|
NM_001242925
|
TMCC2
|
transmembrane and coiled-coil domain family 2
|
|
chr7_+_139208673
|
1.030
|
NM_001080511
|
CLEC2L
|
C-type lectin domain family 2, member L
|
|
chr1_-_17445865
|
1.029
|
NM_007365
|
PADI2
|
peptidyl arginine deiminase, type II
|
|
chr11_-_119293848
|
1.027
|
|
THY1
|
Thy-1 cell surface antigen
|
|
chr3_-_133614421
|
1.026
|
NM_016577
|
RAB6B
|
RAB6B, member RAS oncogene family
|
|
chr5_+_140220811
|
1.014
|
NM_018911
NM_031856
|
PCDHA8
|
protocadherin alpha 8
|
|
chr17_+_34058678
|
1.013
|
NM_033315
|
RASL10B
|
RAS-like, family 10, member B
|
|
chr12_+_119616594
|
1.010
|
NM_014365
|
HSPB8
|
heat shock 22kDa protein 8
|
|
chr12_+_79258448
|
1.006
|
NM_005639
|
SYT1
|
synaptotagmin I
|
|
chr17_+_40118792
|
1.005
|
|
CNP
|
2',3'-cyclic nucleotide 3' phosphodiesterase
|
|
chr1_-_41131113
|
1.004
|
|
RIMS3
|
regulating synaptic membrane exocytosis 3
|
|
chr3_+_159943252
|
1.003
|
NM_001168214
|
C3orf80
|
chromosome 3 open reading frame 80
|
|
chr3_+_19189969
|
0.999
|
NM_144633
|
KCNH8
|
potassium voltage-gated channel, subfamily H (eag-related), member 8
|
|
chr3_-_170303774
|
0.999
|
NM_020949
|
SLC7A14
|
solute carrier family 7 (orphan transporter), member 14
|
|
chr11_+_107461955
|
0.997
|
|
ELMOD1
|
ELMO/CED-12 domain containing 1
|
|
chr1_-_103574051
|
0.996
|
NM_001190709
NM_001854
NM_080629
NM_080630
|
COL11A1
|
collagen, type XI, alpha 1
|
|
chr1_+_181452685
|
0.991
|
NM_000721
NM_001205293
NM_001205294
|
CACNA1E
|
calcium channel, voltage-dependent, R type, alpha 1E subunit
|
|
chr11_-_35547144
|
0.979
|
NM_001001991
NM_015430
|
PAMR1
|
peptidase domain containing associated with muscle regeneration 1
|
|
chr19_+_18062110
|
0.978
|
NM_002248
|
KCNN1
|
potassium intermediate/small conductance calcium-activated channel, subfamily N, member 1
|
|
chr11_+_107462073
|
0.976
|
|
ELMOD1
|
ELMO/CED-12 domain containing 1
|
|
chr2_+_166095911
|
0.976
|
NM_001040142
|
SCN2A
|
sodium channel, voltage-gated, type II, alpha subunit
|
|
chr14_+_33408458
|
0.975
|
NM_001164749
NM_001165893
NM_022123
NM_173159
|
NPAS3
|
neuronal PAS domain protein 3
|
|
chr22_+_51039178
|
0.972
|
|
MAPK8IP2
|
mitogen-activated protein kinase 8 interacting protein 2
|
|
chr3_-_47620186
|
0.970
|
NM_001206943
NM_001206944
NM_006574
|
CSPG5
|
chondroitin sulfate proteoglycan 5 (neuroglycan C)
|
|
chr1_+_203096835
|
0.967
|
NM_000674
NM_001048230
|
ADORA1
|
adenosine A1 receptor
|
|
chr19_+_4304590
|
0.959
|
NM_024333
|
FSD1
|
fibronectin type III and SPRY domain containing 1
|
|
chr1_+_205197031
|
0.953
|
NM_014858
|
TMCC2
|
transmembrane and coiled-coil domain family 2
|
|
chr18_+_43304091
|
0.951
|
NM_001128588
NM_001146036
NM_015865
|
SLC14A1
|
solute carrier family 14 (urea transporter), member 1 (Kidd blood group)
|
|
chr22_+_51039100
|
0.946
|
NM_012324
|
MAPK8IP2
|
mitogen-activated protein kinase 8 interacting protein 2
|
|
chr8_+_61429390
|
0.945
|
NM_001242644
NM_002865
|
RAB2A
|
RAB2A, member RAS oncogene family
|
|
chr7_+_29846112
|
0.941
|
NM_001080529
|
WIPF3
|
WAS/WASL interacting protein family, member 3
|
|
chr18_+_43304143
|
0.940
|
|
SLC14A1
|
solute carrier family 14 (urea transporter), member 1 (Kidd blood group)
|
|
chr16_+_66460815
|
0.931
|
NM_001136106
NM_001178020
NM_001197224
NM_001197225
|
BEAN1
|
brain expressed, associated with NEDD4, 1
|
|
chr1_-_13840157
|
0.924
|
NM_001010847
|
LRRC38
|
leucine rich repeat containing 38
|
|
chr22_-_38379790
|
0.923
|
|
SOX10
|
SRY (sex determining region Y)-box 10
|
|
chr19_-_7990974
|
0.921
|
NM_206833
|
CTXN1
|
cortexin 1
|
|
chr1_+_151032150
|
0.918
|
NM_006818
|
MLLT11
|
myeloid/lymphoid or mixed-lineage leukemia (trithorax homolog, Drosophila); translocated to, 11
|
|
chr10_-_21462987
|
0.917
|
|
NEBL
|
nebulette
|
|
chrX_+_12156584
|
0.914
|
NM_014728
|
FRMPD4
|
FERM and PDZ domain containing 4
|
|
chr1_+_163038934
|
0.913
|
NM_001113381
|
RGS4
|
regulator of G-protein signaling 4
|
|
chr12_-_45270632
|
0.912
|
NM_001145107
|
NELL2
|
NEL-like 2 (chicken)
|
|
chr4_+_30722191
|
0.907
|
|
PCDH7
|
protocadherin 7
|
|
chr5_+_89854610
|
0.903
|
NM_032119
|
GPR98
|
G protein-coupled receptor 98
|
|
chr22_-_38379868
|
0.902
|
|
SOX10
|
SRY (sex determining region Y)-box 10
|
|
chr18_-_74691951
|
0.901
|
|
MBP
|
myelin basic protein
|
|
chr14_-_25519076
|
0.899
|
NM_014178
|
STXBP6
|
syntaxin binding protein 6 (amisyn)
|
|
chrX_+_144902865
|
0.899
|
NM_001144006
NM_001144008
NM_001144009
NM_001144010
|
SLITRK2
|
SLIT and NTRK-like family, member 2
|
|
chr10_-_88126201
|
0.892
|
NM_017551
|
GRID1
|
glutamate receptor, ionotropic, delta 1
|
|
chr1_-_109825767
|
0.891
|
NM_001005290
NM_001032291
NM_032636
|
PSRC1
|
proline/serine-rich coiled-coil 1
|
|
chr9_+_126773851
|
0.890
|
NM_004789
|
LHX2
|
LIM homeobox 2
|
|
chrX_+_49644469
|
0.890
|
NM_001145073
|
USP27X
|
ubiquitin specific peptidase 27, X-linked
|
|
chr12_+_50451486
|
0.886
|
NM_001095
NM_020039
|
ACCN2
|
amiloride-sensitive cation channel 2, neuronal
|
|
chr22_-_38851012
|
0.882
|
NM_152868
|
KCNJ4
|
potassium inwardly-rectifying channel, subfamily J, member 4
|