Project
Illumina Body Map 2: averaged replicates
Navigation
Downloads
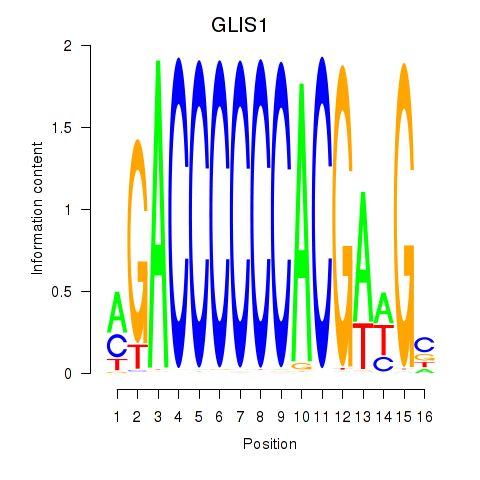
Results for GLIS1
Z-value: 0.28
Motif logo
Transcription factors associated with GLIS1
| Gene Symbol | Gene ID | Gene Info |
|---|---|---|
|
GLIS1
|
ENSG00000174332.3 | GLIS family zinc finger 1 |
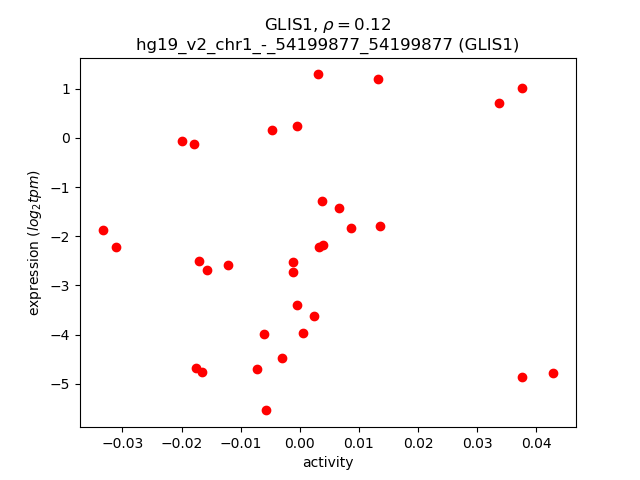
Activity-expression correlation:
| Gene | Promoter | Pearson corr. coef. | P-value | Plot |
|---|---|---|---|---|
| GLIS1 | hg19_v2_chr1_-_54199877_54199877 | 0.12 | 5.2e-01 | Click! |
Activity profile of GLIS1 motif
Sorted Z-values of GLIS1 motif
| Promoter | Log-likelihood | Transcript | Gene | Gene Info |
|---|---|---|---|---|
| chr11_+_68671310 | 0.38 |
ENST00000255078.3
ENST00000539224.1 |
IGHMBP2
|
immunoglobulin mu binding protein 2 |
| chr18_+_11752040 | 0.32 |
ENST00000423027.3
|
GNAL
|
guanine nucleotide binding protein (G protein), alpha activating activity polypeptide, olfactory type |
| chr1_+_59250815 | 0.30 |
ENST00000544621.1
ENST00000419531.2 |
RP4-794H19.2
|
long intergenic non-protein coding RNA 1135 |
| chr19_-_38397228 | 0.30 |
ENST00000447313.2
|
WDR87
|
WD repeat domain 87 |
| chr18_+_11751493 | 0.25 |
ENST00000269162.5
|
GNAL
|
guanine nucleotide binding protein (G protein), alpha activating activity polypeptide, olfactory type |
| chr18_+_11751466 | 0.25 |
ENST00000535121.1
|
GNAL
|
guanine nucleotide binding protein (G protein), alpha activating activity polypeptide, olfactory type |
| chr15_-_43882140 | 0.23 |
ENST00000429176.1
|
PPIP5K1
|
diphosphoinositol pentakisphosphate kinase 1 |
| chr17_-_79917645 | 0.21 |
ENST00000477214.1
|
NOTUM
|
notum pectinacetylesterase homolog (Drosophila) |
| chr17_+_80332153 | 0.17 |
ENST00000313135.2
|
UTS2R
|
urotensin 2 receptor |
| chr19_+_40697514 | 0.13 |
ENST00000253055.3
|
MAP3K10
|
mitogen-activated protein kinase kinase kinase 10 |
| chr11_-_68671264 | 0.11 |
ENST00000362034.2
|
MRPL21
|
mitochondrial ribosomal protein L21 |
| chr16_+_58059470 | 0.10 |
ENST00000219271.3
|
MMP15
|
matrix metallopeptidase 15 (membrane-inserted) |
| chr19_+_1495362 | 0.06 |
ENST00000395479.4
|
REEP6
|
receptor accessory protein 6 |
| chr4_+_190992087 | 0.05 |
ENST00000553598.1
|
DUX4L7
|
double homeobox 4 like 7 |
| chr11_-_299519 | 0.03 |
ENST00000382614.2
|
IFITM5
|
interferon induced transmembrane protein 5 |
| chr19_-_49828438 | 0.02 |
ENST00000454748.3
ENST00000598828.1 ENST00000335875.4 |
SLC6A16
|
solute carrier family 6, member 16 |
| chr4_+_191001979 | 0.00 |
ENST00000538692.1
|
DUX4L4
|
double homeobox 4 like 4 |
Network of associatons between targets according to the STRING database.

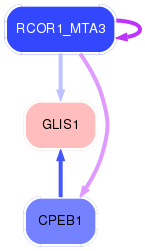
First level regulatory network of GLIS1
Gene Ontology Analysis
Gene overrepresentation in biological_process category:
| Log-likelihood per target | Total log-likelihood | Term | Description |
|---|---|---|---|
| 0.1 | 0.2 | GO:1990697 | protein depalmitoleylation(GO:1990697) |
| 0.1 | 0.2 | GO:0046005 | positive regulation of circadian sleep/wake cycle, REM sleep(GO:0046005) |
| 0.0 | 0.8 | GO:0007191 | adenylate cyclase-activating dopamine receptor signaling pathway(GO:0007191) |
| 0.0 | 0.1 | GO:0007256 | activation of JNKK activity(GO:0007256) |
Gene overrepresentation in cellular_component category:
| Log-likelihood per target | Total log-likelihood | Term | Description |
|---|---|---|---|
| 0.0 | 0.4 | GO:0032797 | SMN complex(GO:0032797) |
| 0.0 | 0.8 | GO:0005834 | heterotrimeric G-protein complex(GO:0005834) |
Gene overrepresentation in molecular_function category:
| Log-likelihood per target | Total log-likelihood | Term | Description |
|---|---|---|---|
| 0.1 | 0.2 | GO:1990699 | palmitoleyl hydrolase activity(GO:1990699) |
| 0.0 | 0.4 | GO:0043141 | ATP-dependent 5'-3' DNA helicase activity(GO:0043141) |
| 0.0 | 0.1 | GO:0004706 | JUN kinase kinase kinase activity(GO:0004706) |
| 0.0 | 0.2 | GO:0033857 | diphosphoinositol-pentakisphosphate kinase activity(GO:0033857) |
| 0.0 | 0.8 | GO:0031683 | G-protein beta/gamma-subunit complex binding(GO:0031683) |
Gene overrepresentation in curated gene sets: canonical pathways category:
| Log-likelihood per target | Total log-likelihood | Term | Description |
|---|---|---|---|
| 0.0 | 0.8 | PID LPA4 PATHWAY | LPA4-mediated signaling events |
Gene overrepresentation in curated gene sets: REACTOME pathways category:
| Log-likelihood per target | Total log-likelihood | Term | Description |
|---|---|---|---|
| 0.0 | 0.8 | REACTOME ADENYLATE CYCLASE ACTIVATING PATHWAY | Genes involved in Adenylate cyclase activating pathway |