Project
Illumina Body Map 2: averaged replicates
Navigation
Downloads
Results for HOXD10
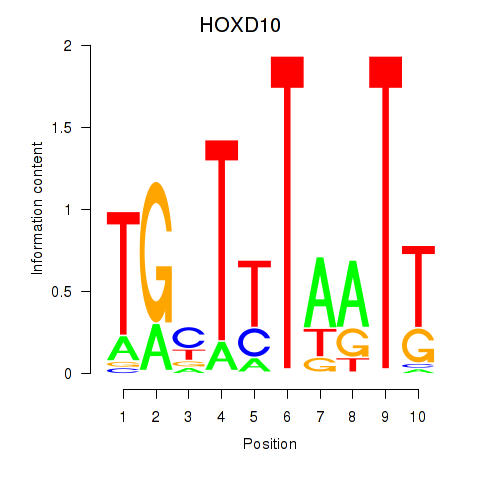
Z-value: 1.92
Motif logo
Transcription factors associated with HOXD10
| Gene Symbol | Gene ID | Gene Info |
|---|---|---|
|
HOXD10
|
ENSG00000128710.5 | homeobox D10 |
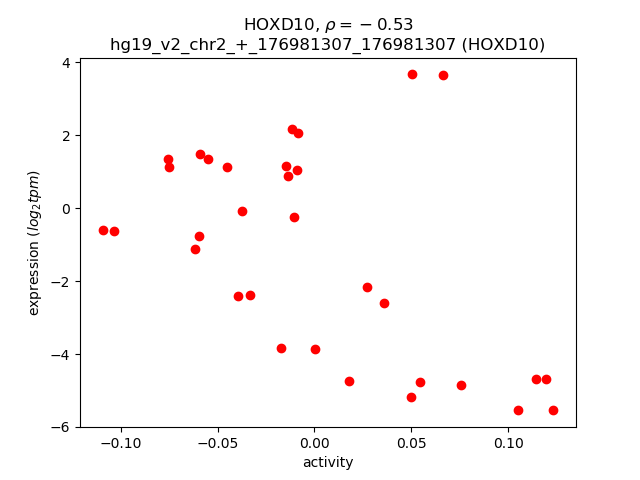
Activity-expression correlation:
| Gene | Promoter | Pearson corr. coef. | P-value | Plot |
|---|---|---|---|---|
| HOXD10 | hg19_v2_chr2_+_176981307_176981307 | -0.53 | 1.7e-03 | Click! |
Activity profile of HOXD10 motif
Sorted Z-values of HOXD10 motif
| Promoter | Log-likelihood | Transcript | Gene | Gene Info |
|---|---|---|---|---|
| chr3_+_186435137 | 8.16 |
ENST00000447445.1
|
KNG1
|
kininogen 1 |
| chr3_+_186435065 | 7.13 |
ENST00000287611.2
ENST00000265023.4 |
KNG1
|
kininogen 1 |
| chr4_+_155484155 | 6.57 |
ENST00000509493.1
|
FGB
|
fibrinogen beta chain |
| chr12_+_20963632 | 5.58 |
ENST00000540853.1
ENST00000261196.2 |
SLCO1B3
|
solute carrier organic anion transporter family, member 1B3 |
| chr12_+_20963647 | 5.34 |
ENST00000381545.3
|
SLCO1B3
|
solute carrier organic anion transporter family, member 1B3 |
| chr16_-_20556492 | 4.55 |
ENST00000568098.1
|
ACSM2B
|
acyl-CoA synthetase medium-chain family member 2B |
| chr4_-_72649763 | 4.14 |
ENST00000513476.1
|
GC
|
group-specific component (vitamin D binding protein) |
| chr18_-_68004529 | 2.92 |
ENST00000578633.1
|
RP11-484N16.1
|
RP11-484N16.1 |
| chr12_-_10151773 | 2.76 |
ENST00000298527.6
ENST00000348658.4 |
CLEC1B
|
C-type lectin domain family 1, member B |
| chr6_+_161123270 | 2.63 |
ENST00000366924.2
ENST00000308192.9 ENST00000418964.1 |
PLG
|
plasminogen |
| chr2_-_105030466 | 2.56 |
ENST00000449772.1
|
AC068535.3
|
AC068535.3 |
| chr13_+_76378305 | 2.47 |
ENST00000526371.1
ENST00000526528.1 |
LMO7
|
LIM domain 7 |
| chr19_-_48389651 | 2.30 |
ENST00000222002.3
|
SULT2A1
|
sulfotransferase family, cytosolic, 2A, dehydroepiandrosterone (DHEA)-preferring, member 1 |
| chr9_-_104145795 | 2.30 |
ENST00000259407.2
|
BAAT
|
bile acid CoA: amino acid N-acyltransferase (glycine N-choloyltransferase) |
| chr2_+_135596106 | 2.24 |
ENST00000356140.5
|
ACMSD
|
aminocarboxymuconate semialdehyde decarboxylase |
| chr17_+_19437132 | 2.24 |
ENST00000436810.2
ENST00000270570.4 ENST00000457293.1 ENST00000542886.1 ENST00000575023.1 ENST00000395585.1 |
SLC47A1
|
solute carrier family 47 (multidrug and toxin extrusion), member 1 |
| chr5_-_95550754 | 2.23 |
ENST00000502437.1
|
RP11-254I22.3
|
RP11-254I22.3 |
| chr10_+_6625605 | 2.17 |
ENST00000414894.1
ENST00000449648.1 |
PRKCQ-AS1
|
PRKCQ antisense RNA 1 |
| chr4_+_120056939 | 2.15 |
ENST00000307128.5
|
MYOZ2
|
myozenin 2 |
| chr18_-_25616519 | 2.13 |
ENST00000399380.3
|
CDH2
|
cadherin 2, type 1, N-cadherin (neuronal) |
| chr18_+_68002675 | 2.09 |
ENST00000584919.1
|
RP11-41O4.1
|
Uncharacterized protein |
| chr5_-_55529115 | 2.05 |
ENST00000513241.2
ENST00000341048.4 |
ANKRD55
|
ankyrin repeat domain 55 |
| chr2_-_165424973 | 1.98 |
ENST00000543549.1
|
GRB14
|
growth factor receptor-bound protein 14 |
| chr6_-_134639180 | 1.93 |
ENST00000367858.5
|
SGK1
|
serum/glucocorticoid regulated kinase 1 |
| chr2_+_88047606 | 1.93 |
ENST00000359481.4
|
PLGLB2
|
plasminogen-like B2 |
| chr6_+_10585979 | 1.93 |
ENST00000265012.4
|
GCNT2
|
glucosaminyl (N-acetyl) transferase 2, I-branching enzyme (I blood group) |
| chr10_+_96522361 | 1.92 |
ENST00000371321.3
|
CYP2C19
|
cytochrome P450, family 2, subfamily C, polypeptide 19 |
| chr17_+_27369918 | 1.92 |
ENST00000323372.4
|
PIPOX
|
pipecolic acid oxidase |
| chr3_-_190580404 | 1.89 |
ENST00000442080.1
|
GMNC
|
geminin coiled-coil domain containing |
| chr1_-_197036364 | 1.85 |
ENST00000367412.1
|
F13B
|
coagulation factor XIII, B polypeptide |
| chr14_+_22771851 | 1.85 |
ENST00000390466.1
|
TRAV39
|
T cell receptor alpha variable 39 |
| chr4_+_100495864 | 1.84 |
ENST00000265517.5
ENST00000422897.2 |
MTTP
|
microsomal triglyceride transfer protein |
| chr11_+_22689648 | 1.81 |
ENST00000278187.3
|
GAS2
|
growth arrest-specific 2 |
| chr6_+_25754927 | 1.81 |
ENST00000377905.4
ENST00000439485.2 |
SLC17A4
|
solute carrier family 17, member 4 |
| chr1_+_207277590 | 1.77 |
ENST00000367070.3
|
C4BPA
|
complement component 4 binding protein, alpha |
| chr3_+_46412345 | 1.76 |
ENST00000292303.4
|
CCR5
|
chemokine (C-C motif) receptor 5 (gene/pseudogene) |
| chr10_-_104913367 | 1.74 |
ENST00000423468.2
|
NT5C2
|
5'-nucleotidase, cytosolic II |
| chr7_+_137761199 | 1.70 |
ENST00000411726.2
|
AKR1D1
|
aldo-keto reductase family 1, member D1 |
| chr6_-_25830785 | 1.69 |
ENST00000468082.1
|
SLC17A1
|
solute carrier family 17 (organic anion transporter), member 1 |
| chrX_+_37639302 | 1.69 |
ENST00000545017.1
ENST00000536160.1 |
CYBB
|
cytochrome b-245, beta polypeptide |
| chr7_+_137761220 | 1.68 |
ENST00000242375.3
ENST00000438242.1 |
AKR1D1
|
aldo-keto reductase family 1, member D1 |
| chr7_-_113559104 | 1.67 |
ENST00000284601.3
|
PPP1R3A
|
protein phosphatase 1, regulatory subunit 3A |
| chr4_+_187148556 | 1.61 |
ENST00000264690.6
ENST00000446598.2 ENST00000414291.1 ENST00000513864.1 |
KLKB1
|
kallikrein B, plasma (Fletcher factor) 1 |
| chr6_-_133055815 | 1.59 |
ENST00000509351.1
ENST00000417437.2 ENST00000414302.2 ENST00000423615.2 ENST00000427187.2 ENST00000275223.3 ENST00000519686.2 |
VNN3
|
vanin 3 |
| chr13_-_46679185 | 1.57 |
ENST00000439329.3
|
CPB2
|
carboxypeptidase B2 (plasma) |
| chr6_-_130543958 | 1.56 |
ENST00000437477.2
ENST00000439090.2 |
SAMD3
|
sterile alpha motif domain containing 3 |
| chr11_+_63057412 | 1.55 |
ENST00000544661.1
|
SLC22A10
|
solute carrier family 22, member 10 |
| chr6_+_140175987 | 1.54 |
ENST00000414038.1
ENST00000431609.1 |
RP5-899B16.1
|
RP5-899B16.1 |
| chr1_+_41204506 | 1.53 |
ENST00000525290.1
ENST00000530965.1 ENST00000416859.2 ENST00000308733.5 |
NFYC
|
nuclear transcription factor Y, gamma |
| chr15_+_42566384 | 1.44 |
ENST00000440615.2
ENST00000318010.8 |
GANC
|
glucosidase, alpha; neutral C |
| chr10_+_96443378 | 1.43 |
ENST00000285979.6
|
CYP2C18
|
cytochrome P450, family 2, subfamily C, polypeptide 18 |
| chr16_+_20499024 | 1.43 |
ENST00000593357.1
|
AC137056.1
|
Uncharacterized protein; cDNA FLJ34659 fis, clone KIDNE2018863 |
| chr7_+_137761167 | 1.42 |
ENST00000432161.1
|
AKR1D1
|
aldo-keto reductase family 1, member D1 |
| chr6_-_133055896 | 1.40 |
ENST00000367927.5
ENST00000425515.2 ENST00000207771.3 ENST00000392393.3 ENST00000450865.2 ENST00000392394.2 |
VNN3
|
vanin 3 |
| chr11_-_93271058 | 1.40 |
ENST00000527149.1
|
SMCO4
|
single-pass membrane protein with coiled-coil domains 4 |
| chr14_-_23292596 | 1.36 |
ENST00000554741.1
|
SLC7A7
|
solute carrier family 7 (amino acid transporter light chain, y+L system), member 7 |
| chr2_+_234590556 | 1.32 |
ENST00000373426.3
|
UGT1A7
|
UDP glucuronosyltransferase 1 family, polypeptide A7 |
| chr15_+_48498480 | 1.32 |
ENST00000380993.3
ENST00000396577.3 |
SLC12A1
|
solute carrier family 12 (sodium/potassium/chloride transporter), member 1 |
| chr14_+_76776957 | 1.31 |
ENST00000512784.1
|
ESRRB
|
estrogen-related receptor beta |
| chrX_-_109590174 | 1.31 |
ENST00000372054.1
|
GNG5P2
|
guanine nucleotide binding protein (G protein), gamma 5 pseudogene 2 |
| chr14_+_22615942 | 1.31 |
ENST00000390457.2
|
TRAV27
|
T cell receptor alpha variable 27 |
| chr10_+_98064085 | 1.30 |
ENST00000419175.1
ENST00000371174.2 |
DNTT
|
DNA nucleotidylexotransferase |
| chr6_-_133084564 | 1.29 |
ENST00000532012.1
|
VNN2
|
vanin 2 |
| chr5_-_135290705 | 1.29 |
ENST00000274507.1
|
LECT2
|
leukocyte cell-derived chemotaxin 2 |
| chr15_+_41549105 | 1.28 |
ENST00000560965.1
|
CHP1
|
calcineurin-like EF-hand protein 1 |
| chr1_+_207277632 | 1.25 |
ENST00000421786.1
|
C4BPA
|
complement component 4 binding protein, alpha |
| chr10_-_75168071 | 1.25 |
ENST00000394847.3
|
ANXA7
|
annexin A7 |
| chr12_-_12674032 | 1.23 |
ENST00000298573.4
|
DUSP16
|
dual specificity phosphatase 16 |
| chr4_-_44653636 | 1.21 |
ENST00000415895.4
ENST00000332990.5 |
YIPF7
|
Yip1 domain family, member 7 |
| chrX_-_15333775 | 1.21 |
ENST00000480796.1
|
ASB11
|
ankyrin repeat and SOCS box containing 11 |
| chr1_+_241695670 | 1.20 |
ENST00000366557.4
|
KMO
|
kynurenine 3-monooxygenase (kynurenine 3-hydroxylase) |
| chrX_+_12924732 | 1.19 |
ENST00000218032.6
ENST00000311912.5 |
TLR8
|
toll-like receptor 8 |
| chr12_+_16109519 | 1.19 |
ENST00000526530.1
|
DERA
|
deoxyribose-phosphate aldolase (putative) |
| chr12_-_56882136 | 1.18 |
ENST00000311966.4
|
GLS2
|
glutaminase 2 (liver, mitochondrial) |
| chr2_+_234875252 | 1.18 |
ENST00000456930.1
|
TRPM8
|
transient receptor potential cation channel, subfamily M, member 8 |
| chr5_+_156607829 | 1.16 |
ENST00000422843.3
|
ITK
|
IL2-inducible T-cell kinase |
| chr4_-_185694872 | 1.16 |
ENST00000505492.1
|
ACSL1
|
acyl-CoA synthetase long-chain family member 1 |
| chr16_-_71610985 | 1.15 |
ENST00000355962.4
|
TAT
|
tyrosine aminotransferase |
| chr4_+_146539415 | 1.14 |
ENST00000281317.5
|
MMAA
|
methylmalonic aciduria (cobalamin deficiency) cblA type |
| chr3_+_35721182 | 1.13 |
ENST00000413378.1
ENST00000417925.1 |
ARPP21
|
cAMP-regulated phosphoprotein, 21kDa |
| chr15_+_58702742 | 1.11 |
ENST00000356113.6
ENST00000414170.3 |
LIPC
|
lipase, hepatic |
| chr13_+_76378407 | 1.11 |
ENST00000447038.1
|
LMO7
|
LIM domain 7 |
| chr11_-_58980342 | 1.10 |
ENST00000361050.3
|
MPEG1
|
macrophage expressed 1 |
| chr13_+_32313658 | 1.10 |
ENST00000380314.1
ENST00000298386.2 |
RXFP2
|
relaxin/insulin-like family peptide receptor 2 |
| chr1_-_238108575 | 1.08 |
ENST00000604646.1
|
MTRNR2L11
|
MT-RNR2-like 11 (pseudogene) |
| chr16_-_46782221 | 1.08 |
ENST00000394809.4
|
MYLK3
|
myosin light chain kinase 3 |
| chrX_-_154493791 | 1.08 |
ENST00000369454.3
|
RAB39B
|
RAB39B, member RAS oncogene family |
| chr2_+_183582774 | 1.08 |
ENST00000537515.1
|
DNAJC10
|
DnaJ (Hsp40) homolog, subfamily C, member 10 |
| chr20_-_35274548 | 1.06 |
ENST00000262866.4
|
SLA2
|
Src-like-adaptor 2 |
| chrX_+_10124977 | 1.05 |
ENST00000380833.4
|
CLCN4
|
chloride channel, voltage-sensitive 4 |
| chr8_-_66701319 | 1.04 |
ENST00000379419.4
|
PDE7A
|
phosphodiesterase 7A |
| chr11_+_63137251 | 1.04 |
ENST00000310969.4
ENST00000279178.3 |
SLC22A9
|
solute carrier family 22 (organic anion transporter), member 9 |
| chr13_+_76378357 | 1.02 |
ENST00000489941.2
ENST00000525373.1 |
LMO7
|
LIM domain 7 |
| chr10_-_62332357 | 1.02 |
ENST00000503366.1
|
ANK3
|
ankyrin 3, node of Ranvier (ankyrin G) |
| chr1_+_62439037 | 1.01 |
ENST00000545929.1
|
INADL
|
InaD-like (Drosophila) |
| chrX_+_149887090 | 1.00 |
ENST00000538506.1
|
MTMR1
|
myotubularin related protein 1 |
| chr1_+_110009150 | 0.99 |
ENST00000401021.3
|
SYPL2
|
synaptophysin-like 2 |
| chr7_+_95115210 | 0.99 |
ENST00000428113.1
ENST00000325885.5 |
ASB4
|
ankyrin repeat and SOCS box containing 4 |
| chr7_-_87342564 | 0.98 |
ENST00000265724.3
ENST00000416177.1 |
ABCB1
|
ATP-binding cassette, sub-family B (MDR/TAP), member 1 |
| chr4_-_70080449 | 0.97 |
ENST00000446444.1
|
UGT2B11
|
UDP glucuronosyltransferase 2 family, polypeptide B11 |
| chr6_-_154567984 | 0.97 |
ENST00000517438.1
|
IPCEF1
|
interaction protein for cytohesin exchange factors 1 |
| chr18_-_2982869 | 0.96 |
ENST00000584915.1
|
LPIN2
|
lipin 2 |
| chr9_+_42671887 | 0.96 |
ENST00000456520.1
ENST00000377391.3 |
CBWD7
|
COBW domain containing 7 |
| chr4_+_40198527 | 0.94 |
ENST00000381799.5
|
RHOH
|
ras homolog family member H |
| chr18_-_67615088 | 0.94 |
ENST00000582621.1
|
CD226
|
CD226 molecule |
| chr1_-_231560790 | 0.94 |
ENST00000366641.3
|
EGLN1
|
egl-9 family hypoxia-inducible factor 1 |
| chr4_+_86748898 | 0.93 |
ENST00000509300.1
|
ARHGAP24
|
Rho GTPase activating protein 24 |
| chr8_-_33370607 | 0.93 |
ENST00000360742.5
ENST00000523305.1 |
TTI2
|
TELO2 interacting protein 2 |
| chr11_+_120973375 | 0.92 |
ENST00000264037.2
|
TECTA
|
tectorin alpha |
| chr8_+_77318769 | 0.92 |
ENST00000518732.1
|
RP11-706J10.1
|
long intergenic non-protein coding RNA 1111 |
| chr11_-_18258342 | 0.91 |
ENST00000278222.4
|
SAA4
|
serum amyloid A4, constitutive |
| chr9_-_125330838 | 0.90 |
ENST00000304865.2
|
OR1L8
|
olfactory receptor, family 1, subfamily L, member 8 |
| chr1_+_110009215 | 0.90 |
ENST00000369872.3
|
SYPL2
|
synaptophysin-like 2 |
| chr4_-_69817481 | 0.89 |
ENST00000251566.4
|
UGT2A3
|
UDP glucuronosyltransferase 2 family, polypeptide A3 |
| chr9_+_82188077 | 0.85 |
ENST00000425506.1
|
TLE4
|
transducin-like enhancer of split 4 (E(sp1) homolog, Drosophila) |
| chr5_+_162930114 | 0.85 |
ENST00000280969.5
|
MAT2B
|
methionine adenosyltransferase II, beta |
| chr15_+_76352178 | 0.85 |
ENST00000388942.3
|
C15orf27
|
chromosome 15 open reading frame 27 |
| chr3_+_35721106 | 0.85 |
ENST00000474696.1
ENST00000412048.1 ENST00000396482.2 ENST00000432682.1 |
ARPP21
|
cAMP-regulated phosphoprotein, 21kDa |
| chr12_+_21525818 | 0.84 |
ENST00000240652.3
ENST00000542023.1 ENST00000537593.1 |
IAPP
|
islet amyloid polypeptide |
| chr17_-_21454898 | 0.84 |
ENST00000391411.5
ENST00000412778.3 |
C17orf51
|
chromosome 17 open reading frame 51 |
| chr12_-_118796971 | 0.84 |
ENST00000542902.1
|
TAOK3
|
TAO kinase 3 |
| chr1_-_229569834 | 0.83 |
ENST00000366684.3
ENST00000366683.2 |
ACTA1
|
actin, alpha 1, skeletal muscle |
| chr2_+_120436760 | 0.83 |
ENST00000445518.1
ENST00000409951.1 |
TMEM177
|
transmembrane protein 177 |
| chr3_+_35721130 | 0.82 |
ENST00000432450.1
|
ARPP21
|
cAMP-regulated phosphoprotein, 21kDa |
| chr6_-_135375921 | 0.82 |
ENST00000367820.2
ENST00000314674.3 ENST00000524715.1 ENST00000415177.2 ENST00000367826.2 |
HBS1L
|
HBS1-like (S. cerevisiae) |
| chr12_-_118796910 | 0.82 |
ENST00000541186.1
ENST00000539872.1 |
TAOK3
|
TAO kinase 3 |
| chr4_-_38784592 | 0.82 |
ENST00000502321.1
|
TLR10
|
toll-like receptor 10 |
| chr13_+_30510003 | 0.82 |
ENST00000400540.1
|
LINC00544
|
long intergenic non-protein coding RNA 544 |
| chr6_+_37897735 | 0.82 |
ENST00000373389.5
|
ZFAND3
|
zinc finger, AN1-type domain 3 |
| chr1_-_89736434 | 0.82 |
ENST00000370459.3
|
GBP5
|
guanylate binding protein 5 |
| chr14_-_20774092 | 0.81 |
ENST00000423949.2
ENST00000553828.1 ENST00000258821.3 |
TTC5
|
tetratricopeptide repeat domain 5 |
| chr10_+_51576285 | 0.81 |
ENST00000443446.1
|
NCOA4
|
nuclear receptor coactivator 4 |
| chr12_-_49333446 | 0.80 |
ENST00000537495.1
|
AC073610.5
|
Uncharacterized protein |
| chr1_+_192127578 | 0.80 |
ENST00000367460.3
|
RGS18
|
regulator of G-protein signaling 18 |
| chr1_+_244214577 | 0.80 |
ENST00000358704.4
|
ZBTB18
|
zinc finger and BTB domain containing 18 |
| chr1_+_40862501 | 0.79 |
ENST00000539317.1
|
SMAP2
|
small ArfGAP2 |
| chr6_-_24936170 | 0.79 |
ENST00000538035.1
|
FAM65B
|
family with sequence similarity 65, member B |
| chr12_-_118797475 | 0.78 |
ENST00000541786.1
ENST00000419821.2 ENST00000541878.1 |
TAOK3
|
TAO kinase 3 |
| chr18_+_3252206 | 0.78 |
ENST00000578562.2
|
MYL12A
|
myosin, light chain 12A, regulatory, non-sarcomeric |
| chr10_-_115614127 | 0.78 |
ENST00000369305.1
|
DCLRE1A
|
DNA cross-link repair 1A |
| chr7_-_108168580 | 0.77 |
ENST00000453085.1
|
PNPLA8
|
patatin-like phospholipase domain containing 8 |
| chr12_-_49581152 | 0.77 |
ENST00000550811.1
|
TUBA1A
|
tubulin, alpha 1a |
| chr18_+_3252265 | 0.76 |
ENST00000580887.1
ENST00000536605.1 |
MYL12A
|
myosin, light chain 12A, regulatory, non-sarcomeric |
| chr12_-_100656134 | 0.76 |
ENST00000548313.1
|
DEPDC4
|
DEP domain containing 4 |
| chr3_+_63953415 | 0.76 |
ENST00000484332.1
|
ATXN7
|
ataxin 7 |
| chr13_+_100258907 | 0.75 |
ENST00000376355.3
ENST00000376360.1 ENST00000444838.2 ENST00000376354.1 ENST00000339105.4 |
CLYBL
|
citrate lyase beta like |
| chr7_+_116451100 | 0.74 |
ENST00000464223.1
ENST00000484325.1 |
CAPZA2
|
capping protein (actin filament) muscle Z-line, alpha 2 |
| chr7_-_115608304 | 0.74 |
ENST00000457268.1
|
TFEC
|
transcription factor EC |
| chr14_-_57960456 | 0.73 |
ENST00000534126.1
ENST00000422976.2 |
C14orf105
|
chromosome 14 open reading frame 105 |
| chr7_+_77469439 | 0.73 |
ENST00000450574.1
ENST00000416283.2 ENST00000248550.7 |
PHTF2
|
putative homeodomain transcription factor 2 |
| chr1_+_248185250 | 0.73 |
ENST00000355281.1
|
OR2L5
|
olfactory receptor, family 2, subfamily L, member 5 |
| chrX_+_37639264 | 0.73 |
ENST00000378588.4
|
CYBB
|
cytochrome b-245, beta polypeptide |
| chr10_+_94594351 | 0.73 |
ENST00000371552.4
|
EXOC6
|
exocyst complex component 6 |
| chr1_+_236558694 | 0.72 |
ENST00000359362.5
|
EDARADD
|
EDAR-associated death domain |
| chr3_-_194119083 | 0.72 |
ENST00000401815.1
|
GP5
|
glycoprotein V (platelet) |
| chr1_+_40810516 | 0.72 |
ENST00000435168.2
|
SMAP2
|
small ArfGAP2 |
| chr17_+_40925454 | 0.72 |
ENST00000253794.2
ENST00000590339.1 ENST00000589520.1 |
VPS25
|
vacuolar protein sorting 25 homolog (S. cerevisiae) |
| chr3_-_37216055 | 0.71 |
ENST00000336686.4
|
LRRFIP2
|
leucine rich repeat (in FLII) interacting protein 2 |
| chr4_+_118955635 | 0.71 |
ENST00000433996.2
|
NDST3
|
N-deacetylase/N-sulfotransferase (heparan glucosaminyl) 3 |
| chrM_+_8366 | 0.70 |
ENST00000361851.1
|
MT-ATP8
|
mitochondrially encoded ATP synthase 8 |
| chr7_+_12250943 | 0.69 |
ENST00000442107.1
|
TMEM106B
|
transmembrane protein 106B |
| chr15_+_36887069 | 0.69 |
ENST00000566807.1
ENST00000567389.1 ENST00000562877.1 |
C15orf41
|
chromosome 15 open reading frame 41 |
| chrX_-_15333736 | 0.69 |
ENST00000380470.3
|
ASB11
|
ankyrin repeat and SOCS box containing 11 |
| chr5_+_39105358 | 0.69 |
ENST00000593965.1
|
AC008964.1
|
AC008964.1 |
| chr18_+_32556892 | 0.68 |
ENST00000591734.1
ENST00000413393.1 ENST00000589180.1 ENST00000587359.1 |
MAPRE2
|
microtubule-associated protein, RP/EB family, member 2 |
| chr8_+_42873548 | 0.68 |
ENST00000533338.1
ENST00000534420.1 |
HOOK3
RP11-598P20.5
|
hook microtubule-tethering protein 3 Uncharacterized protein |
| chr5_+_141346385 | 0.68 |
ENST00000513019.1
ENST00000356143.1 |
RNF14
|
ring finger protein 14 |
| chr12_+_18891045 | 0.68 |
ENST00000317658.3
|
CAPZA3
|
capping protein (actin filament) muscle Z-line, alpha 3 |
| chr4_-_186732241 | 0.68 |
ENST00000421639.1
|
SORBS2
|
sorbin and SH3 domain containing 2 |
| chr12_+_14561422 | 0.68 |
ENST00000541056.1
|
ATF7IP
|
activating transcription factor 7 interacting protein |
| chr11_+_60223225 | 0.68 |
ENST00000524807.1
ENST00000345732.4 |
MS4A1
|
membrane-spanning 4-domains, subfamily A, member 1 |
| chr11_+_34999328 | 0.67 |
ENST00000526309.1
|
PDHX
|
pyruvate dehydrogenase complex, component X |
| chr1_+_15986364 | 0.67 |
ENST00000345034.1
|
RSC1A1
|
regulatory solute carrier protein, family 1, member 1 |
| chr7_-_142162390 | 0.67 |
ENST00000390371.3
|
TRBV6-6
|
T cell receptor beta variable 6-6 |
| chr2_-_87248975 | 0.67 |
ENST00000409310.2
ENST00000355705.3 |
PLGLB1
|
plasminogen-like B1 |
| chr5_-_39203093 | 0.66 |
ENST00000515010.1
|
FYB
|
FYN binding protein |
| chr6_-_135375986 | 0.66 |
ENST00000525067.1
ENST00000367822.5 ENST00000367837.5 |
HBS1L
|
HBS1-like (S. cerevisiae) |
| chr7_-_142251148 | 0.66 |
ENST00000390360.3
|
TRBV6-4
|
T cell receptor beta variable 6-4 |
| chr1_-_154164534 | 0.66 |
ENST00000271850.7
ENST00000368530.2 |
TPM3
|
tropomyosin 3 |
| chr1_-_247615308 | 0.66 |
ENST00000318749.6
|
OR2B11
|
olfactory receptor, family 2, subfamily B, member 11 |
| chr11_-_71810258 | 0.65 |
ENST00000544594.1
|
LAMTOR1
|
late endosomal/lysosomal adaptor, MAPK and MTOR activator 1 |
| chr17_+_7358889 | 0.64 |
ENST00000575379.1
|
CHRNB1
|
cholinergic receptor, nicotinic, beta 1 (muscle) |
| chr12_-_18890940 | 0.64 |
ENST00000543242.1
ENST00000539072.1 ENST00000541966.1 ENST00000266505.7 ENST00000447925.2 ENST00000435379.1 |
PLCZ1
|
phospholipase C, zeta 1 |
| chr11_+_112047087 | 0.63 |
ENST00000526088.1
ENST00000532593.1 ENST00000531169.1 |
BCO2
|
beta-carotene oxygenase 2 |
| chr9_-_116163400 | 0.63 |
ENST00000277315.5
ENST00000448137.1 ENST00000409155.3 |
ALAD
|
aminolevulinate dehydratase |
| chr12_-_7656357 | 0.63 |
ENST00000396620.3
ENST00000432237.2 ENST00000359156.4 |
CD163
|
CD163 molecule |
| chr16_+_57481382 | 0.62 |
ENST00000564655.1
ENST00000567072.1 ENST00000567933.1 ENST00000563166.1 |
COQ9
|
coenzyme Q9 |
| chr2_+_172309634 | 0.62 |
ENST00000339506.3
|
DCAF17
|
DDB1 and CUL4 associated factor 17 |
| chr17_+_44790515 | 0.62 |
ENST00000576346.1
|
NSF
|
N-ethylmaleimide-sensitive factor |
| chr17_-_33390667 | 0.62 |
ENST00000378516.2
ENST00000268850.7 ENST00000394597.2 |
RFFL
|
ring finger and FYVE-like domain containing E3 ubiquitin protein ligase |
| chr17_+_80843910 | 0.62 |
ENST00000572984.1
|
TBCD
|
tubulin folding cofactor D |
| chr10_-_52008313 | 0.62 |
ENST00000329428.6
ENST00000395526.4 ENST00000447815.1 |
ASAH2
|
N-acylsphingosine amidohydrolase (non-lysosomal ceramidase) 2 |
| chr17_+_46189311 | 0.62 |
ENST00000582481.1
|
SNX11
|
sorting nexin 11 |
| chr15_-_55562479 | 0.61 |
ENST00000564609.1
|
RAB27A
|
RAB27A, member RAS oncogene family |
| chr6_-_160679905 | 0.61 |
ENST00000366953.3
|
SLC22A2
|
solute carrier family 22 (organic cation transporter), member 2 |
| chr1_+_40713573 | 0.61 |
ENST00000372766.3
|
TMCO2
|
transmembrane and coiled-coil domains 2 |
| chr15_-_52263937 | 0.61 |
ENST00000315141.5
ENST00000299601.5 |
LEO1
|
Leo1, Paf1/RNA polymerase II complex component, homolog (S. cerevisiae) |
| chr4_-_70725856 | 0.61 |
ENST00000226444.3
|
SULT1E1
|
sulfotransferase family 1E, estrogen-preferring, member 1 |
| chrX_+_142967173 | 0.60 |
ENST00000370494.1
|
UBE2NL
|
ubiquitin-conjugating enzyme E2N-like |
| chr9_+_4839762 | 0.60 |
ENST00000448872.2
ENST00000441844.1 |
RCL1
|
RNA terminal phosphate cyclase-like 1 |
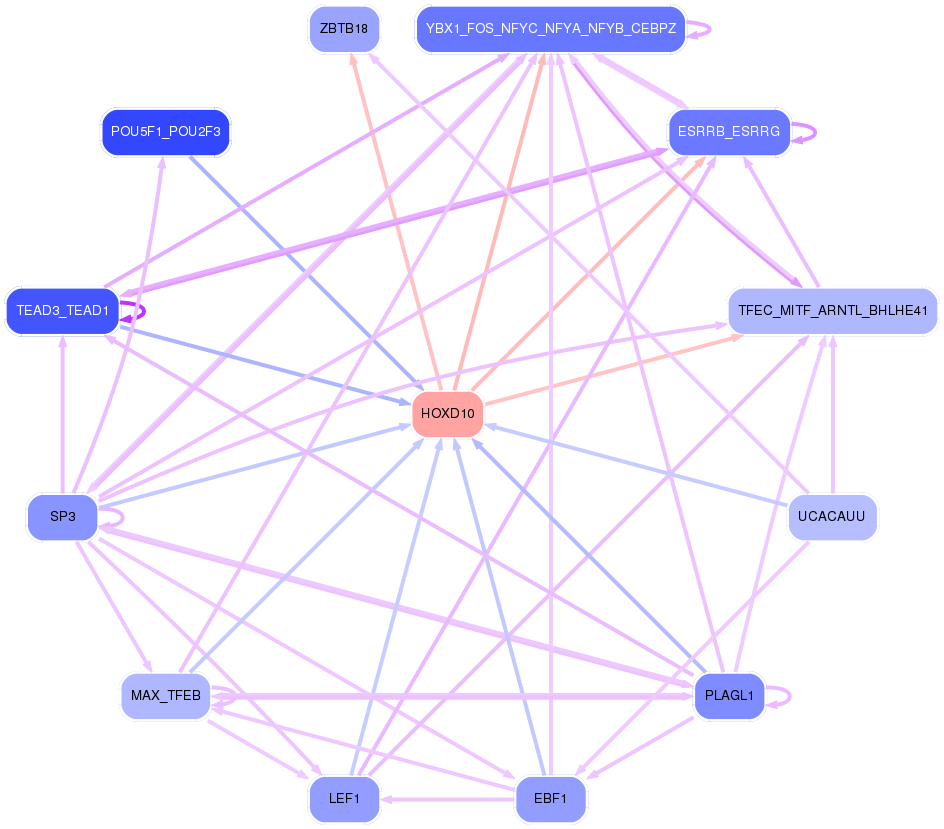
Network of associatons between targets according to the STRING database.

First level regulatory network of HOXD10
Gene Ontology Analysis
Gene overrepresentation in biological_process category:
| Log-likelihood per target | Total log-likelihood | Term | Description |
|---|---|---|---|
| 1.4 | 7.1 | GO:0030573 | bile acid catabolic process(GO:0030573) |
| 0.8 | 4.2 | GO:0051919 | positive regulation of fibrinolysis(GO:0051919) |
| 0.6 | 15.7 | GO:0007597 | blood coagulation, intrinsic pathway(GO:0007597) |
| 0.5 | 6.6 | GO:0072378 | blood coagulation, fibrin clot formation(GO:0072378) |
| 0.5 | 3.4 | GO:0019805 | quinolinate biosynthetic process(GO:0019805) |
| 0.5 | 2.4 | GO:1904845 | response to L-glutamine(GO:1904844) cellular response to L-glutamine(GO:1904845) |
| 0.4 | 1.6 | GO:0003331 | regulation of extracellular matrix constituent secretion(GO:0003330) positive regulation of extracellular matrix constituent secretion(GO:0003331) |
| 0.3 | 3.1 | GO:0045959 | regulation of complement activation, classical pathway(GO:0030450) negative regulation of complement activation, classical pathway(GO:0045959) |
| 0.3 | 1.2 | GO:0045209 | MAPK phosphatase export from nucleus(GO:0045208) MAPK phosphatase export from nucleus, leptomycin B sensitive(GO:0045209) |
| 0.3 | 1.2 | GO:0045356 | positive regulation of interferon-alpha biosynthetic process(GO:0045356) |
| 0.3 | 1.1 | GO:0009236 | cobalamin biosynthetic process(GO:0009236) |
| 0.3 | 1.9 | GO:0016098 | monoterpenoid metabolic process(GO:0016098) |
| 0.3 | 1.9 | GO:0046440 | L-lysine catabolic process to acetyl-CoA(GO:0019474) L-lysine catabolic process(GO:0019477) L-lysine metabolic process(GO:0046440) |
| 0.3 | 0.8 | GO:0072616 | interleukin-18 secretion(GO:0072616) |
| 0.3 | 1.3 | GO:0000117 | regulation of transcription involved in G2/M transition of mitotic cell cycle(GO:0000117) |
| 0.2 | 2.2 | GO:0046618 | drug export(GO:0046618) |
| 0.2 | 13.9 | GO:0043252 | sodium-independent organic anion transport(GO:0043252) |
| 0.2 | 1.9 | GO:0036438 | maintenance of lens transparency(GO:0036438) |
| 0.2 | 4.3 | GO:0015939 | pantothenate metabolic process(GO:0015939) |
| 0.2 | 0.9 | GO:0030806 | negative regulation of cyclic nucleotide catabolic process(GO:0030806) negative regulation of cAMP catabolic process(GO:0030821) negative regulation of purine nucleotide catabolic process(GO:0033122) |
| 0.2 | 1.3 | GO:0009804 | coumarin metabolic process(GO:0009804) |
| 0.2 | 1.1 | GO:0002528 | regulation of vascular permeability involved in acute inflammatory response(GO:0002528) |
| 0.2 | 2.1 | GO:1902897 | regulation of postsynaptic density protein 95 clustering(GO:1902897) |
| 0.2 | 0.8 | GO:0006556 | S-adenosylmethionine biosynthetic process(GO:0006556) |
| 0.2 | 0.6 | GO:0042214 | terpene metabolic process(GO:0042214) |
| 0.2 | 0.6 | GO:0006711 | estrogen catabolic process(GO:0006711) |
| 0.2 | 1.2 | GO:0046121 | deoxyribonucleoside catabolic process(GO:0046121) |
| 0.2 | 1.8 | GO:0044800 | fusion of virus membrane with host plasma membrane(GO:0019064) membrane fusion involved in viral entry into host cell(GO:0039663) multi-organism membrane fusion(GO:0044800) |
| 0.2 | 1.4 | GO:0000821 | regulation of arginine metabolic process(GO:0000821) |
| 0.2 | 0.8 | GO:0046338 | phosphatidylethanolamine catabolic process(GO:0046338) |
| 0.2 | 2.3 | GO:0019530 | taurine metabolic process(GO:0019530) |
| 0.2 | 0.5 | GO:0030505 | inorganic diphosphate transport(GO:0030505) |
| 0.2 | 0.5 | GO:1903988 | spleen trabecula formation(GO:0060345) iron cation export(GO:1903414) ferrous iron export(GO:1903988) |
| 0.2 | 1.0 | GO:2001271 | negative regulation of cysteine-type endopeptidase activity involved in execution phase of apoptosis(GO:2001271) |
| 0.2 | 1.0 | GO:0072658 | maintenance of protein location in membrane(GO:0072658) maintenance of protein location in plasma membrane(GO:0072660) positive regulation of membrane depolarization during cardiac muscle cell action potential(GO:1900827) |
| 0.2 | 1.2 | GO:0006543 | glutamine catabolic process(GO:0006543) |
| 0.2 | 1.2 | GO:0050955 | thermoception(GO:0050955) |
| 0.2 | 1.4 | GO:0000023 | maltose metabolic process(GO:0000023) |
| 0.2 | 1.3 | GO:0070885 | positive regulation of sodium:proton antiporter activity(GO:0032417) negative regulation of calcineurin-NFAT signaling cascade(GO:0070885) |
| 0.2 | 0.5 | GO:0002188 | translation reinitiation(GO:0002188) |
| 0.2 | 0.9 | GO:0002729 | positive regulation of natural killer cell cytokine production(GO:0002729) |
| 0.2 | 0.6 | GO:0071284 | cellular response to lead ion(GO:0071284) |
| 0.2 | 0.5 | GO:1900158 | negative regulation of bone mineralization involved in bone maturation(GO:1900158) |
| 0.2 | 0.5 | GO:0072579 | molybdenum incorporation into molybdenum-molybdopterin complex(GO:0018315) metal incorporation into metallo-molybdopterin complex(GO:0042040) glycine receptor clustering(GO:0072579) |
| 0.1 | 0.4 | GO:0061534 | gamma-aminobutyric acid secretion, neurotransmission(GO:0061534) |
| 0.1 | 0.7 | GO:0043328 | protein targeting to vacuole involved in ubiquitin-dependent protein catabolic process via the multivesicular body sorting pathway(GO:0043328) |
| 0.1 | 0.8 | GO:0090131 | mesenchyme migration(GO:0090131) |
| 0.1 | 4.5 | GO:0042359 | vitamin D metabolic process(GO:0042359) |
| 0.1 | 1.7 | GO:0070294 | renal sodium ion absorption(GO:0070294) |
| 0.1 | 0.5 | GO:0035188 | blastocyst hatching(GO:0001835) hatching(GO:0035188) organism emergence from protective structure(GO:0071684) |
| 0.1 | 0.9 | GO:0097056 | selenocysteinyl-tRNA(Sec) biosynthetic process(GO:0097056) |
| 0.1 | 0.3 | GO:0035038 | female pronucleus assembly(GO:0035038) |
| 0.1 | 1.1 | GO:0006572 | tyrosine catabolic process(GO:0006572) |
| 0.1 | 0.6 | GO:0007343 | egg activation(GO:0007343) |
| 0.1 | 1.0 | GO:1901529 | positive regulation of anion channel activity(GO:1901529) |
| 0.1 | 1.8 | GO:0034197 | acylglycerol transport(GO:0034196) triglyceride transport(GO:0034197) |
| 0.1 | 0.5 | GO:0060152 | peroxisome localization(GO:0060151) microtubule-based peroxisome localization(GO:0060152) |
| 0.1 | 0.7 | GO:0060620 | regulation of cholesterol import(GO:0060620) regulation of sterol import(GO:2000909) |
| 0.1 | 1.7 | GO:0046085 | adenosine metabolic process(GO:0046085) |
| 0.1 | 1.7 | GO:0046415 | urate metabolic process(GO:0046415) |
| 0.1 | 0.9 | GO:0001920 | negative regulation of receptor recycling(GO:0001920) |
| 0.1 | 0.5 | GO:2000638 | regulation of SREBP signaling pathway(GO:2000638) negative regulation of SREBP signaling pathway(GO:2000639) |
| 0.1 | 0.4 | GO:0002949 | tRNA threonylcarbamoyladenosine modification(GO:0002949) |
| 0.1 | 0.4 | GO:0046013 | regulation of T cell homeostatic proliferation(GO:0046013) |
| 0.1 | 0.4 | GO:1905205 | positive regulation of connective tissue replacement(GO:1905205) |
| 0.1 | 1.2 | GO:0044539 | long-chain fatty acid import(GO:0044539) |
| 0.1 | 0.3 | GO:0021526 | medial motor column neuron differentiation(GO:0021526) |
| 0.1 | 0.4 | GO:1990502 | dense core granule maturation(GO:1990502) |
| 0.1 | 0.5 | GO:0007060 | male meiosis chromosome segregation(GO:0007060) |
| 0.1 | 0.3 | GO:0003094 | glomerular filtration(GO:0003094) renal filtration(GO:0097205) |
| 0.1 | 0.6 | GO:1903435 | positive regulation of constitutive secretory pathway(GO:1903435) |
| 0.1 | 0.5 | GO:0031860 | telomeric 3' overhang formation(GO:0031860) |
| 0.1 | 1.1 | GO:0034372 | very-low-density lipoprotein particle remodeling(GO:0034372) phosphatidylcholine catabolic process(GO:0034638) |
| 0.1 | 0.8 | GO:0097646 | calcitonin family receptor signaling pathway(GO:0097646) amylin receptor signaling pathway(GO:0097647) |
| 0.1 | 1.9 | GO:0034975 | protein folding in endoplasmic reticulum(GO:0034975) |
| 0.1 | 0.4 | GO:2000471 | regulation of hematopoietic stem cell migration(GO:2000471) positive regulation of hematopoietic stem cell migration(GO:2000473) |
| 0.1 | 0.5 | GO:0006432 | phenylalanyl-tRNA aminoacylation(GO:0006432) |
| 0.1 | 0.5 | GO:0051697 | protein delipidation(GO:0051697) |
| 0.1 | 0.5 | GO:0006001 | fructose catabolic process(GO:0006001) fructose catabolic process to hydroxyacetone phosphate and glyceraldehyde-3-phosphate(GO:0061624) |
| 0.1 | 1.0 | GO:2001214 | positive regulation of vasculogenesis(GO:2001214) |
| 0.1 | 0.5 | GO:0090669 | telomerase RNA stabilization(GO:0090669) |
| 0.1 | 0.5 | GO:0061484 | hematopoietic stem cell homeostasis(GO:0061484) |
| 0.1 | 0.6 | GO:0000480 | endonucleolytic cleavage in 5'-ETS of tricistronic rRNA transcript (SSU-rRNA, 5.8S rRNA, LSU-rRNA)(GO:0000480) |
| 0.1 | 2.4 | GO:0007095 | mitotic G2 DNA damage checkpoint(GO:0007095) |
| 0.1 | 0.5 | GO:0019918 | peptidyl-arginine methylation, to symmetrical-dimethyl arginine(GO:0019918) |
| 0.1 | 0.6 | GO:0035494 | SNARE complex disassembly(GO:0035494) |
| 0.1 | 0.8 | GO:0043569 | negative regulation of insulin-like growth factor receptor signaling pathway(GO:0043569) |
| 0.1 | 1.4 | GO:0019373 | epoxygenase P450 pathway(GO:0019373) |
| 0.1 | 0.5 | GO:0021796 | cerebral cortex regionalization(GO:0021796) |
| 0.1 | 1.4 | GO:0052695 | cellular glucuronidation(GO:0052695) |
| 0.1 | 0.7 | GO:0061732 | mitochondrial acetyl-CoA biosynthetic process from pyruvate(GO:0061732) |
| 0.1 | 1.1 | GO:0001865 | NK T cell differentiation(GO:0001865) |
| 0.1 | 0.5 | GO:0032468 | Golgi calcium ion homeostasis(GO:0032468) |
| 0.1 | 0.3 | GO:0036152 | phosphatidylserine acyl-chain remodeling(GO:0036150) phosphatidylethanolamine acyl-chain remodeling(GO:0036152) |
| 0.1 | 0.5 | GO:0022027 | interkinetic nuclear migration(GO:0022027) |
| 0.1 | 0.6 | GO:0031120 | snRNA pseudouridine synthesis(GO:0031120) |
| 0.1 | 0.6 | GO:0086024 | adrenergic receptor signaling pathway involved in positive regulation of heart rate(GO:0086024) |
| 0.1 | 0.3 | GO:1901475 | pyruvate transport(GO:0006848) pyruvate transmembrane transport(GO:1901475) |
| 0.1 | 2.8 | GO:0030220 | platelet formation(GO:0030220) |
| 0.1 | 1.4 | GO:0050849 | negative regulation of calcium-mediated signaling(GO:0050849) |
| 0.1 | 0.5 | GO:1901660 | calcium ion export(GO:1901660) calcium ion export from cell(GO:1990034) |
| 0.1 | 1.8 | GO:0035435 | phosphate ion transmembrane transport(GO:0035435) |
| 0.1 | 0.6 | GO:0007023 | post-chaperonin tubulin folding pathway(GO:0007023) |
| 0.1 | 0.6 | GO:0035095 | behavioral response to nicotine(GO:0035095) |
| 0.1 | 0.5 | GO:0043950 | positive regulation of cAMP-mediated signaling(GO:0043950) |
| 0.1 | 1.0 | GO:0046058 | cAMP metabolic process(GO:0046058) |
| 0.1 | 0.8 | GO:0031848 | protection from non-homologous end joining at telomere(GO:0031848) |
| 0.1 | 0.6 | GO:1901374 | acetate ester transport(GO:1901374) |
| 0.1 | 0.2 | GO:0010430 | fatty acid omega-oxidation(GO:0010430) |
| 0.0 | 0.2 | GO:1990481 | mRNA pseudouridine synthesis(GO:1990481) |
| 0.0 | 0.3 | GO:2000234 | positive regulation of ribosome biogenesis(GO:0090070) positive regulation of rRNA processing(GO:2000234) |
| 0.0 | 0.4 | GO:0040032 | post-embryonic body morphogenesis(GO:0040032) regulation of parathyroid hormone secretion(GO:2000828) |
| 0.0 | 0.9 | GO:0090435 | protein localization to nuclear envelope(GO:0090435) |
| 0.0 | 0.5 | GO:0034375 | high-density lipoprotein particle remodeling(GO:0034375) |
| 0.0 | 0.8 | GO:0015014 | heparan sulfate proteoglycan biosynthetic process, polysaccharide chain biosynthetic process(GO:0015014) |
| 0.0 | 0.4 | GO:0097338 | response to clozapine(GO:0097338) |
| 0.0 | 0.3 | GO:0002329 | pre-B cell differentiation(GO:0002329) |
| 0.0 | 0.3 | GO:0070164 | negative regulation of adiponectin secretion(GO:0070164) |
| 0.0 | 0.5 | GO:0038044 | transforming growth factor-beta secretion(GO:0038044) |
| 0.0 | 0.8 | GO:0040015 | negative regulation of multicellular organism growth(GO:0040015) |
| 0.0 | 1.2 | GO:0009651 | response to salt stress(GO:0009651) |
| 0.0 | 0.4 | GO:0042426 | choline catabolic process(GO:0042426) |
| 0.0 | 0.2 | GO:0052027 | modulation of signal transduction in other organism(GO:0044501) modulation by symbiont of host signal transduction pathway(GO:0052027) modulation of signal transduction in other organism involved in symbiotic interaction(GO:0052250) modulation by symbiont of host I-kappaB kinase/NF-kappaB cascade(GO:0085032) |
| 0.0 | 0.4 | GO:0002074 | extraocular skeletal muscle development(GO:0002074) |
| 0.0 | 1.0 | GO:0015671 | oxygen transport(GO:0015671) |
| 0.0 | 0.4 | GO:0090162 | establishment of epithelial cell polarity(GO:0090162) |
| 0.0 | 0.6 | GO:2000675 | negative regulation of type B pancreatic cell apoptotic process(GO:2000675) |
| 0.0 | 0.4 | GO:0046598 | positive regulation of viral entry into host cell(GO:0046598) |
| 0.0 | 2.4 | GO:1904837 | beta-catenin-TCF complex assembly(GO:1904837) |
| 0.0 | 0.1 | GO:0010897 | negative regulation of triglyceride catabolic process(GO:0010897) |
| 0.0 | 0.2 | GO:0006420 | arginyl-tRNA aminoacylation(GO:0006420) |
| 0.0 | 1.7 | GO:0006607 | NLS-bearing protein import into nucleus(GO:0006607) |
| 0.0 | 0.6 | GO:0060155 | platelet dense granule organization(GO:0060155) |
| 0.0 | 0.2 | GO:0006311 | meiotic gene conversion(GO:0006311) |
| 0.0 | 0.2 | GO:0001180 | transcription initiation from RNA polymerase I promoter for nuclear large rRNA transcript(GO:0001180) |
| 0.0 | 0.3 | GO:1903265 | positive regulation of tumor necrosis factor-mediated signaling pathway(GO:1903265) |
| 0.0 | 0.3 | GO:0071896 | protein localization to adherens junction(GO:0071896) |
| 0.0 | 0.5 | GO:0030422 | production of siRNA involved in RNA interference(GO:0030422) |
| 0.0 | 2.0 | GO:0046627 | negative regulation of insulin receptor signaling pathway(GO:0046627) |
| 0.0 | 1.4 | GO:0051016 | barbed-end actin filament capping(GO:0051016) |
| 0.0 | 0.5 | GO:1902916 | positive regulation of protein polyubiquitination(GO:1902916) |
| 0.0 | 5.1 | GO:0006805 | xenobiotic metabolic process(GO:0006805) |
| 0.0 | 0.4 | GO:0030207 | chondroitin sulfate catabolic process(GO:0030207) |
| 0.0 | 0.3 | GO:0070973 | protein localization to endoplasmic reticulum exit site(GO:0070973) |
| 0.0 | 1.0 | GO:0006646 | phosphatidylethanolamine biosynthetic process(GO:0006646) |
| 0.0 | 0.3 | GO:1901620 | regulation of smoothened signaling pathway involved in dorsal/ventral neural tube patterning(GO:1901620) |
| 0.0 | 1.8 | GO:0006270 | DNA replication initiation(GO:0006270) |
| 0.0 | 0.4 | GO:0001778 | plasma membrane repair(GO:0001778) |
| 0.0 | 1.5 | GO:0043928 | exonucleolytic nuclear-transcribed mRNA catabolic process involved in deadenylation-dependent decay(GO:0043928) |
| 0.0 | 0.3 | GO:0090063 | positive regulation of microtubule nucleation(GO:0090063) |
| 0.0 | 1.0 | GO:0046839 | phospholipid dephosphorylation(GO:0046839) phosphatidylinositol dephosphorylation(GO:0046856) |
| 0.0 | 0.1 | GO:0070175 | positive regulation of enamel mineralization(GO:0070175) |
| 0.0 | 0.2 | GO:0006707 | cholesterol catabolic process(GO:0006707) sterol catabolic process(GO:0016127) |
| 0.0 | 0.2 | GO:2001137 | positive regulation of endocytic recycling(GO:2001137) |
| 0.0 | 0.6 | GO:0030889 | negative regulation of B cell proliferation(GO:0030889) |
| 0.0 | 5.7 | GO:0034605 | cellular response to heat(GO:0034605) |
| 0.0 | 0.3 | GO:2000774 | positive regulation of cellular senescence(GO:2000774) |
| 0.0 | 0.4 | GO:0090160 | Golgi to lysosome transport(GO:0090160) |
| 0.0 | 0.7 | GO:0043968 | histone H2A acetylation(GO:0043968) |
| 0.0 | 1.5 | GO:0006953 | acute-phase response(GO:0006953) |
| 0.0 | 0.6 | GO:1901663 | ubiquinone biosynthetic process(GO:0006744) quinone biosynthetic process(GO:1901663) |
| 0.0 | 0.3 | GO:0006682 | galactosylceramide biosynthetic process(GO:0006682) galactolipid biosynthetic process(GO:0019375) |
| 0.0 | 0.3 | GO:0019885 | antigen processing and presentation of endogenous peptide antigen via MHC class I(GO:0019885) |
| 0.0 | 0.8 | GO:0006622 | protein targeting to lysosome(GO:0006622) |
| 0.0 | 0.2 | GO:1904381 | Golgi apparatus mannose trimming(GO:1904381) |
| 0.0 | 0.3 | GO:0090091 | positive regulation of extracellular matrix disassembly(GO:0090091) |
| 0.0 | 1.0 | GO:0003298 | physiological muscle hypertrophy(GO:0003298) physiological cardiac muscle hypertrophy(GO:0003301) cell growth involved in cardiac muscle cell development(GO:0061049) |
| 0.0 | 0.3 | GO:0021759 | globus pallidus development(GO:0021759) |
| 0.0 | 1.7 | GO:0021762 | substantia nigra development(GO:0021762) |
| 0.0 | 1.5 | GO:0045540 | regulation of cholesterol biosynthetic process(GO:0045540) |
| 0.0 | 1.1 | GO:1903959 | regulation of anion transmembrane transport(GO:1903959) |
| 0.0 | 0.7 | GO:0042776 | mitochondrial ATP synthesis coupled proton transport(GO:0042776) |
| 0.0 | 0.3 | GO:0038003 | opioid receptor signaling pathway(GO:0038003) |
| 0.0 | 1.0 | GO:0002755 | MyD88-dependent toll-like receptor signaling pathway(GO:0002755) |
| 0.0 | 0.5 | GO:0072643 | interferon-gamma secretion(GO:0072643) |
| 0.0 | 0.7 | GO:0045898 | regulation of RNA polymerase II transcriptional preinitiation complex assembly(GO:0045898) |
| 0.0 | 1.5 | GO:0070527 | platelet aggregation(GO:0070527) |
| 0.0 | 0.1 | GO:0019236 | response to pheromone(GO:0019236) |
| 0.0 | 2.1 | GO:0030239 | myofibril assembly(GO:0030239) |
| 0.0 | 0.3 | GO:0070986 | left/right axis specification(GO:0070986) |
| 0.0 | 0.5 | GO:0032897 | negative regulation of viral transcription(GO:0032897) |
| 0.0 | 0.1 | GO:1904749 | regulation of protein localization to nucleolus(GO:1904749) |
| 0.0 | 0.4 | GO:0043407 | negative regulation of MAP kinase activity(GO:0043407) |
| 0.0 | 0.3 | GO:0051775 | response to redox state(GO:0051775) |
| 0.0 | 1.7 | GO:0006073 | glycogen metabolic process(GO:0005977) cellular glucan metabolic process(GO:0006073) glucan metabolic process(GO:0044042) |
| 0.0 | 1.1 | GO:0010506 | regulation of autophagy(GO:0010506) |
| 0.0 | 0.1 | GO:0034398 | telomere tethering at nuclear periphery(GO:0034398) meiotic telomere tethering at nuclear periphery(GO:0044821) meiotic attachment of telomere to nuclear envelope(GO:0070197) chromosome attachment to the nuclear envelope(GO:0097240) |
| 0.0 | 0.2 | GO:0071397 | cellular response to cholesterol(GO:0071397) |
| 0.0 | 0.2 | GO:0048280 | vesicle fusion with Golgi apparatus(GO:0048280) |
| 0.0 | 0.5 | GO:0045948 | positive regulation of translational initiation(GO:0045948) |
| 0.0 | 0.3 | GO:0007084 | mitotic nuclear envelope reassembly(GO:0007084) |
| 0.0 | 0.3 | GO:0007097 | nuclear migration(GO:0007097) |
| 0.0 | 0.3 | GO:0045109 | intermediate filament organization(GO:0045109) |
| 0.0 | 0.5 | GO:0033198 | response to ATP(GO:0033198) |
| 0.0 | 0.9 | GO:0034260 | negative regulation of GTPase activity(GO:0034260) |
| 0.0 | 0.7 | GO:0060765 | regulation of androgen receptor signaling pathway(GO:0060765) |
| 0.0 | 0.2 | GO:0048739 | cardiac muscle fiber development(GO:0048739) |
| 0.0 | 0.2 | GO:0070307 | lens fiber cell development(GO:0070307) |
| 0.0 | 0.4 | GO:0000301 | retrograde transport, vesicle recycling within Golgi(GO:0000301) |
| 0.0 | 0.1 | GO:0006127 | glycerophosphate shuttle(GO:0006127) |
| 0.0 | 0.3 | GO:0007254 | JNK cascade(GO:0007254) |
| 0.0 | 0.2 | GO:1900364 | negative regulation of mRNA polyadenylation(GO:1900364) |
| 0.0 | 5.3 | GO:0000209 | protein polyubiquitination(GO:0000209) |
| 0.0 | 2.8 | GO:0050911 | detection of chemical stimulus involved in sensory perception of smell(GO:0050911) |
| 0.0 | 1.1 | GO:0007193 | adenylate cyclase-inhibiting G-protein coupled receptor signaling pathway(GO:0007193) |
| 0.0 | 0.7 | GO:0030049 | muscle filament sliding(GO:0030049) actin-myosin filament sliding(GO:0033275) |
Gene overrepresentation in cellular_component category:
| Log-likelihood per target | Total log-likelihood | Term | Description |
|---|---|---|---|
| 0.5 | 6.6 | GO:0005577 | fibrinogen complex(GO:0005577) |
| 0.3 | 2.6 | GO:0031232 | extrinsic component of external side of plasma membrane(GO:0031232) other organism cell membrane(GO:0044218) other organism membrane(GO:0044279) |
| 0.3 | 0.8 | GO:0048269 | methionine adenosyltransferase complex(GO:0048269) |
| 0.2 | 0.7 | GO:0000814 | ESCRT II complex(GO:0000814) |
| 0.2 | 0.6 | GO:0002947 | tumor necrosis factor receptor superfamily complex(GO:0002947) |
| 0.2 | 1.8 | GO:0043235 | receptor complex(GO:0043235) |
| 0.2 | 0.5 | GO:0034685 | integrin alphav-beta6 complex(GO:0034685) |
| 0.1 | 1.5 | GO:0016602 | CCAAT-binding factor complex(GO:0016602) |
| 0.1 | 0.3 | GO:0097025 | MPP7-DLG1-LIN7 complex(GO:0097025) |
| 0.1 | 0.4 | GO:0005863 | striated muscle myosin thick filament(GO:0005863) |
| 0.1 | 2.4 | GO:0043020 | NADPH oxidase complex(GO:0043020) |
| 0.1 | 14.8 | GO:0031093 | platelet alpha granule lumen(GO:0031093) |
| 0.1 | 1.0 | GO:0031466 | Cul5-RING ubiquitin ligase complex(GO:0031466) |
| 0.1 | 2.1 | GO:0016342 | catenin complex(GO:0016342) |
| 0.1 | 0.6 | GO:0071598 | neuronal ribonucleoprotein granule(GO:0071598) |
| 0.1 | 0.7 | GO:0070695 | FHF complex(GO:0070695) |
| 0.1 | 1.3 | GO:0032039 | integrator complex(GO:0032039) |
| 0.1 | 2.1 | GO:0030285 | integral component of synaptic vesicle membrane(GO:0030285) intrinsic component of synaptic vesicle membrane(GO:0098563) |
| 0.1 | 1.4 | GO:0008290 | F-actin capping protein complex(GO:0008290) |
| 0.1 | 0.3 | GO:0031592 | centrosomal corona(GO:0031592) |
| 0.1 | 0.5 | GO:1990452 | Parkin-FBXW7-Cul1 ubiquitin ligase complex(GO:1990452) |
| 0.1 | 0.9 | GO:0042584 | chromaffin granule membrane(GO:0042584) |
| 0.1 | 1.5 | GO:0034663 | endoplasmic reticulum chaperone complex(GO:0034663) |
| 0.1 | 0.7 | GO:0045254 | pyruvate dehydrogenase complex(GO:0045254) |
| 0.1 | 0.2 | GO:0032302 | MutSbeta complex(GO:0032302) |
| 0.1 | 0.6 | GO:0072588 | box H/ACA snoRNP complex(GO:0031429) box H/ACA RNP complex(GO:0072588) |
| 0.1 | 0.4 | GO:0005826 | actomyosin contractile ring(GO:0005826) |
| 0.1 | 4.0 | GO:0031907 | peroxisomal matrix(GO:0005782) microbody lumen(GO:0031907) |
| 0.1 | 0.4 | GO:0000408 | EKC/KEOPS complex(GO:0000408) |
| 0.0 | 0.7 | GO:0071986 | Ragulator complex(GO:0071986) |
| 0.0 | 1.2 | GO:0045009 | melanosome membrane(GO:0033162) chitosome(GO:0045009) |
| 0.0 | 2.0 | GO:0034364 | high-density lipoprotein particle(GO:0034364) |
| 0.0 | 0.8 | GO:0031080 | nuclear pore outer ring(GO:0031080) |
| 0.0 | 1.2 | GO:0036020 | endolysosome membrane(GO:0036020) |
| 0.0 | 0.3 | GO:0005947 | mitochondrial alpha-ketoglutarate dehydrogenase complex(GO:0005947) |
| 0.0 | 0.8 | GO:0044754 | autolysosome(GO:0044754) |
| 0.0 | 0.5 | GO:0030870 | Mre11 complex(GO:0030870) |
| 0.0 | 0.7 | GO:0000276 | mitochondrial proton-transporting ATP synthase complex, coupling factor F(o)(GO:0000276) |
| 0.0 | 0.4 | GO:0016593 | Cdc73/Paf1 complex(GO:0016593) |
| 0.0 | 0.1 | GO:0005944 | phosphatidylinositol 3-kinase complex, class IB(GO:0005944) |
| 0.0 | 0.2 | GO:0020016 | ciliary pocket(GO:0020016) ciliary pocket membrane(GO:0020018) |
| 0.0 | 0.7 | GO:0044615 | nuclear pore nuclear basket(GO:0044615) |
| 0.0 | 3.5 | GO:0044215 | other organism(GO:0044215) other organism cell(GO:0044216) other organism part(GO:0044217) |
| 0.0 | 1.0 | GO:0014731 | spectrin-associated cytoskeleton(GO:0014731) |
| 0.0 | 0.7 | GO:0005862 | muscle thin filament tropomyosin(GO:0005862) |
| 0.0 | 0.5 | GO:0005686 | U2 snRNP(GO:0005686) |
| 0.0 | 1.1 | GO:0042101 | T cell receptor complex(GO:0042101) |
| 0.0 | 0.5 | GO:0034709 | methylosome(GO:0034709) |
| 0.0 | 0.4 | GO:0044233 | ER-mitochondrion membrane contact site(GO:0044233) |
| 0.0 | 0.3 | GO:0030688 | preribosome, small subunit precursor(GO:0030688) |
| 0.0 | 0.5 | GO:0017101 | aminoacyl-tRNA synthetase multienzyme complex(GO:0017101) |
| 0.0 | 0.2 | GO:0005955 | calcineurin complex(GO:0005955) |
| 0.0 | 2.4 | GO:0044438 | microbody part(GO:0044438) peroxisomal part(GO:0044439) |
| 0.0 | 0.1 | GO:0000308 | cytoplasmic cyclin-dependent protein kinase holoenzyme complex(GO:0000308) |
| 0.0 | 0.5 | GO:0005671 | Ada2/Gcn5/Ada3 transcription activator complex(GO:0005671) |
| 0.0 | 1.3 | GO:0000791 | euchromatin(GO:0000791) |
| 0.0 | 10.8 | GO:0016323 | basolateral plasma membrane(GO:0016323) |
| 0.0 | 0.8 | GO:0036379 | myofilament(GO:0036379) |
| 0.0 | 0.6 | GO:0005892 | acetylcholine-gated channel complex(GO:0005892) |
| 0.0 | 0.9 | GO:0043189 | NuA4 histone acetyltransferase complex(GO:0035267) H4/H2A histone acetyltransferase complex(GO:0043189) H4 histone acetyltransferase complex(GO:1902562) |
| 0.0 | 1.5 | GO:0045171 | intercellular bridge(GO:0045171) |
| 0.0 | 0.9 | GO:0035371 | microtubule plus-end(GO:0035371) |
| 0.0 | 0.1 | GO:1990037 | Lewy body core(GO:1990037) |
| 0.0 | 0.9 | GO:0001772 | immunological synapse(GO:0001772) |
| 0.0 | 0.3 | GO:0030123 | AP-3 adaptor complex(GO:0030123) |
| 0.0 | 0.6 | GO:0005839 | proteasome core complex(GO:0005839) |
| 0.0 | 1.5 | GO:0016459 | myosin complex(GO:0016459) |
| 0.0 | 0.4 | GO:0031235 | intrinsic component of the cytoplasmic side of the plasma membrane(GO:0031235) |
| 0.0 | 0.4 | GO:0005885 | Arp2/3 protein complex(GO:0005885) |
| 0.0 | 3.2 | GO:0031225 | anchored component of membrane(GO:0031225) |
| 0.0 | 4.9 | GO:0009897 | external side of plasma membrane(GO:0009897) |
| 0.0 | 3.1 | GO:0072562 | blood microparticle(GO:0072562) |
| 0.0 | 3.3 | GO:0030018 | Z disc(GO:0030018) |
| 0.0 | 6.9 | GO:0000151 | ubiquitin ligase complex(GO:0000151) |
| 0.0 | 0.6 | GO:0000145 | exocyst(GO:0000145) |
| 0.0 | 0.4 | GO:1902711 | GABA-A receptor complex(GO:1902711) |
| 0.0 | 0.2 | GO:0044232 | organelle membrane contact site(GO:0044232) |
| 0.0 | 1.5 | GO:0043005 | neuron projection(GO:0043005) |
| 0.0 | 1.1 | GO:0035577 | azurophil granule membrane(GO:0035577) |
| 0.0 | 0.8 | GO:0005881 | cytoplasmic microtubule(GO:0005881) |
| 0.0 | 0.5 | GO:0012506 | vesicle membrane(GO:0012506) cytoplasmic vesicle membrane(GO:0030659) |
| 0.0 | 1.4 | GO:0005884 | actin filament(GO:0005884) |
| 0.0 | 0.7 | GO:0031594 | neuromuscular junction(GO:0031594) |
| 0.0 | 7.4 | GO:0005759 | mitochondrial matrix(GO:0005759) |
| 0.0 | 0.6 | GO:0016328 | lateral plasma membrane(GO:0016328) |
| 0.0 | 0.3 | GO:0030992 | intraciliary transport particle B(GO:0030992) |
| 0.0 | 0.9 | GO:0034704 | calcium channel complex(GO:0034704) |
| 0.0 | 1.6 | GO:0031902 | late endosome membrane(GO:0031902) |
| 0.0 | 0.3 | GO:0097038 | perinuclear endoplasmic reticulum(GO:0097038) |
Gene overrepresentation in molecular_function category:
| Log-likelihood per target | Total log-likelihood | Term | Description |
|---|---|---|---|
| 1.4 | 4.1 | GO:1902271 | D3 vitamins binding(GO:1902271) |
| 1.1 | 3.3 | GO:1904854 | proteasome core complex binding(GO:1904854) |
| 1.0 | 4.8 | GO:0047787 | delta4-3-oxosteroid 5beta-reductase activity(GO:0047787) |
| 0.7 | 4.3 | GO:0017159 | pantetheine hydrolase activity(GO:0017159) |
| 0.6 | 1.7 | GO:0050146 | nucleoside phosphotransferase activity(GO:0050146) |
| 0.4 | 1.3 | GO:0008511 | sodium:potassium:chloride symporter activity(GO:0008511) |
| 0.4 | 2.9 | GO:0050294 | steroid sulfotransferase activity(GO:0050294) |
| 0.4 | 1.2 | GO:0004139 | deoxyribose-phosphate aldolase activity(GO:0004139) |
| 0.4 | 10.8 | GO:0015125 | bile acid transmembrane transporter activity(GO:0015125) |
| 0.4 | 1.1 | GO:0070546 | L-phenylalanine aminotransferase activity(GO:0070546) L-phenylalanine:2-oxoglutarate aminotransferase activity(GO:0080130) |
| 0.4 | 2.2 | GO:0015307 | drug:proton antiporter activity(GO:0015307) |
| 0.4 | 2.1 | GO:0051373 | FATZ binding(GO:0051373) |
| 0.3 | 1.9 | GO:0016647 | oxidoreductase activity, acting on the CH-NH group of donors, oxygen as acceptor(GO:0016647) |
| 0.3 | 4.1 | GO:0004321 | fatty-acyl-CoA synthase activity(GO:0004321) |
| 0.2 | 1.9 | GO:0008109 | N-acetyllactosaminide beta-1,6-N-acetylglucosaminyltransferase activity(GO:0008109) |
| 0.2 | 3.1 | GO:1901702 | urate transmembrane transporter activity(GO:0015143) salt transmembrane transporter activity(GO:1901702) |
| 0.2 | 3.5 | GO:0005436 | sodium:phosphate symporter activity(GO:0005436) |
| 0.2 | 0.5 | GO:0097689 | iron channel activity(GO:0097689) |
| 0.2 | 1.0 | GO:0090554 | phosphatidylcholine-translocating ATPase activity(GO:0090554) |
| 0.2 | 1.4 | GO:0032450 | maltose alpha-glucosidase activity(GO:0032450) |
| 0.2 | 1.0 | GO:0008195 | phosphatidate phosphatase activity(GO:0008195) |
| 0.2 | 2.3 | GO:0016290 | palmitoyl-CoA hydrolase activity(GO:0016290) |
| 0.2 | 0.6 | GO:0005277 | acetylcholine transmembrane transporter activity(GO:0005277) secondary active organic cation transmembrane transporter activity(GO:0008513) acetate ester transmembrane transporter activity(GO:1901375) |
| 0.2 | 0.5 | GO:0061598 | molybdopterin adenylyltransferase activity(GO:0061598) molybdopterin molybdotransferase activity(GO:0061599) |
| 0.1 | 1.2 | GO:0004359 | glutaminase activity(GO:0004359) |
| 0.1 | 3.4 | GO:0008392 | arachidonic acid monooxygenase activity(GO:0008391) arachidonic acid epoxygenase activity(GO:0008392) |
| 0.1 | 1.4 | GO:0004687 | myosin light chain kinase activity(GO:0004687) |
| 0.1 | 0.4 | GO:0004423 | iduronate-2-sulfatase activity(GO:0004423) |
| 0.1 | 0.4 | GO:0061711 | N(6)-L-threonylcarbamoyladenine synthase(GO:0061711) |
| 0.1 | 0.6 | GO:0003963 | RNA-3'-phosphate cyclase activity(GO:0003963) |
| 0.1 | 13.6 | GO:0004869 | cysteine-type endopeptidase inhibitor activity(GO:0004869) |
| 0.1 | 0.6 | GO:0004616 | phosphogluconate dehydrogenase (decarboxylating) activity(GO:0004616) |
| 0.1 | 3.6 | GO:0050664 | oxidoreductase activity, acting on NAD(P)H, oxygen as acceptor(GO:0050664) |
| 0.1 | 2.1 | GO:0045295 | gamma-catenin binding(GO:0045295) |
| 0.1 | 1.8 | GO:0019957 | C-C chemokine binding(GO:0019957) |
| 0.1 | 0.5 | GO:0035529 | NADH pyrophosphatase activity(GO:0035529) |
| 0.1 | 0.5 | GO:0050816 | phosphothreonine binding(GO:0050816) |
| 0.1 | 0.5 | GO:0048248 | CXCR3 chemokine receptor binding(GO:0048248) |
| 0.1 | 0.3 | GO:0017130 | poly(C) RNA binding(GO:0017130) |
| 0.1 | 0.8 | GO:0015016 | [heparan sulfate]-glucosamine N-sulfotransferase activity(GO:0015016) |
| 0.1 | 0.2 | GO:0001181 | transcription factor activity, core RNA polymerase I binding(GO:0001181) |
| 0.1 | 0.5 | GO:0004826 | phenylalanine-tRNA ligase activity(GO:0004826) |
| 0.1 | 0.6 | GO:0050815 | phosphoserine binding(GO:0050815) |
| 0.1 | 0.5 | GO:0099580 | ion antiporter activity involved in regulation of postsynaptic membrane potential(GO:0099580) |
| 0.1 | 0.7 | GO:0034603 | pyruvate dehydrogenase activity(GO:0004738) pyruvate dehydrogenase [NAD(P)+] activity(GO:0034603) pyruvate dehydrogenase (NAD+) activity(GO:0034604) |
| 0.1 | 0.7 | GO:0046912 | transferase activity, transferring acyl groups, acyl groups converted into alkyl on transfer(GO:0046912) |
| 0.1 | 0.5 | GO:0035243 | protein-arginine omega-N symmetric methyltransferase activity(GO:0035243) |
| 0.1 | 0.4 | GO:0030144 | alpha-1,6-mannosylglycoprotein 6-beta-N-acetylglucosaminyltransferase activity(GO:0030144) |
| 0.1 | 3.7 | GO:0015020 | glucuronosyltransferase activity(GO:0015020) |
| 0.1 | 0.6 | GO:0017040 | ceramidase activity(GO:0017040) |
| 0.1 | 0.3 | GO:0005477 | pyruvate secondary active transmembrane transporter activity(GO:0005477) |
| 0.1 | 0.2 | GO:0050429 | calcium-dependent phospholipase C activity(GO:0050429) |
| 0.1 | 1.2 | GO:0017017 | MAP kinase tyrosine/serine/threonine phosphatase activity(GO:0017017) |
| 0.1 | 0.8 | GO:0035312 | 5'-3' exodeoxyribonuclease activity(GO:0035312) |
| 0.1 | 1.4 | GO:0015174 | basic amino acid transmembrane transporter activity(GO:0015174) |
| 0.1 | 1.0 | GO:0052629 | phosphatidylinositol-3,5-bisphosphate 3-phosphatase activity(GO:0052629) |
| 0.1 | 0.2 | GO:0000406 | double-strand/single-strand DNA junction binding(GO:0000406) dinucleotide repeat insertion binding(GO:0032181) |
| 0.1 | 0.6 | GO:0034513 | box H/ACA snoRNA binding(GO:0034513) |
| 0.1 | 1.3 | GO:0016671 | oxidoreductase activity, acting on a sulfur group of donors, disulfide as acceptor(GO:0016671) |
| 0.1 | 2.4 | GO:0004709 | MAP kinase kinase kinase activity(GO:0004709) |
| 0.1 | 1.1 | GO:0031698 | beta-2 adrenergic receptor binding(GO:0031698) |
| 0.1 | 1.7 | GO:0017081 | chloride channel regulator activity(GO:0017081) |
| 0.1 | 1.5 | GO:0034185 | apolipoprotein binding(GO:0034185) |
| 0.1 | 0.5 | GO:0018479 | benzaldehyde dehydrogenase (NAD+) activity(GO:0018479) |
| 0.1 | 0.2 | GO:0004031 | aldehyde oxidase activity(GO:0004031) |
| 0.1 | 0.4 | GO:0047961 | glycine N-acyltransferase activity(GO:0047961) |
| 0.0 | 1.1 | GO:0016500 | protein-hormone receptor activity(GO:0016500) |
| 0.0 | 0.4 | GO:0005134 | interleukin-2 receptor binding(GO:0005134) glycosphingolipid binding(GO:0043208) |
| 0.0 | 1.7 | GO:0031489 | myosin V binding(GO:0031489) |
| 0.0 | 0.4 | GO:0047617 | acyl-CoA hydrolase activity(GO:0047617) |
| 0.0 | 1.4 | GO:0102391 | decanoate--CoA ligase activity(GO:0102391) |
| 0.0 | 0.1 | GO:0016503 | pheromone receptor activity(GO:0016503) |
| 0.0 | 0.9 | GO:0031545 | peptidyl-proline 4-dioxygenase activity(GO:0031545) |
| 0.0 | 1.0 | GO:0005344 | oxygen transporter activity(GO:0005344) |
| 0.0 | 1.2 | GO:0008235 | metallocarboxypeptidase activity(GO:0004181) metalloexopeptidase activity(GO:0008235) |
| 0.0 | 0.4 | GO:0015220 | choline transmembrane transporter activity(GO:0015220) |
| 0.0 | 0.3 | GO:0023024 | MHC class I protein complex binding(GO:0023024) |
| 0.0 | 6.9 | GO:0051087 | chaperone binding(GO:0051087) |
| 0.0 | 1.5 | GO:0003746 | translation elongation factor activity(GO:0003746) |
| 0.0 | 1.1 | GO:0005247 | voltage-gated chloride channel activity(GO:0005247) |
| 0.0 | 0.6 | GO:0000014 | single-stranded DNA endodeoxyribonuclease activity(GO:0000014) |
| 0.0 | 1.1 | GO:0005068 | transmembrane receptor protein tyrosine kinase adaptor activity(GO:0005068) |
| 0.0 | 0.2 | GO:0004814 | arginine-tRNA ligase activity(GO:0004814) |
| 0.0 | 2.2 | GO:0016831 | carboxy-lyase activity(GO:0016831) |
| 0.0 | 2.7 | GO:0005548 | phospholipid transporter activity(GO:0005548) |
| 0.0 | 0.9 | GO:0005095 | GTPase inhibitor activity(GO:0005095) |
| 0.0 | 0.7 | GO:0004559 | alpha-mannosidase activity(GO:0004559) |
| 0.0 | 1.1 | GO:0003887 | DNA-directed DNA polymerase activity(GO:0003887) |
| 0.0 | 0.5 | GO:0008429 | phosphatidylethanolamine binding(GO:0008429) |
| 0.0 | 0.6 | GO:0043024 | ribosomal small subunit binding(GO:0043024) |
| 0.0 | 0.3 | GO:0043515 | kinetochore binding(GO:0043515) |
| 0.0 | 1.1 | GO:0000993 | RNA polymerase II core binding(GO:0000993) |
| 0.0 | 1.0 | GO:0004115 | 3',5'-cyclic-AMP phosphodiesterase activity(GO:0004115) |
| 0.0 | 0.6 | GO:0022848 | acetylcholine-gated cation channel activity(GO:0022848) |
| 0.0 | 2.0 | GO:0030971 | receptor tyrosine kinase binding(GO:0030971) |
| 0.0 | 0.5 | GO:0010314 | phosphatidylinositol-5-phosphate binding(GO:0010314) |
| 0.0 | 0.6 | GO:0050700 | CARD domain binding(GO:0050700) |
| 0.0 | 1.0 | GO:0008093 | cytoskeletal adaptor activity(GO:0008093) |
| 0.0 | 0.3 | GO:0050694 | galactosylceramide sulfotransferase activity(GO:0001733) galactose 3-O-sulfotransferase activity(GO:0050694) |
| 0.0 | 0.7 | GO:0042923 | neuropeptide binding(GO:0042923) |
| 0.0 | 0.4 | GO:0016018 | cyclosporin A binding(GO:0016018) |
| 0.0 | 0.7 | GO:0023026 | MHC class II protein complex binding(GO:0023026) |
| 0.0 | 0.4 | GO:0005049 | nuclear export signal receptor activity(GO:0005049) |
| 0.0 | 2.5 | GO:0004715 | non-membrane spanning protein tyrosine kinase activity(GO:0004715) |
| 0.0 | 0.3 | GO:0004465 | lipoprotein lipase activity(GO:0004465) |
| 0.0 | 0.7 | GO:0030275 | LRR domain binding(GO:0030275) |
| 0.0 | 1.0 | GO:0051959 | dynein light intermediate chain binding(GO:0051959) |
| 0.0 | 0.7 | GO:0008200 | ion channel inhibitor activity(GO:0008200) |
| 0.0 | 0.5 | GO:0048018 | receptor agonist activity(GO:0048018) |
| 0.0 | 0.7 | GO:0051371 | muscle alpha-actinin binding(GO:0051371) |
| 0.0 | 0.7 | GO:0005487 | nucleocytoplasmic transporter activity(GO:0005487) |
| 0.0 | 0.4 | GO:0004691 | cAMP-dependent protein kinase activity(GO:0004691) |
| 0.0 | 0.9 | GO:0042056 | chemoattractant activity(GO:0042056) |
| 0.0 | 0.4 | GO:0030296 | protein tyrosine kinase activator activity(GO:0030296) |
| 0.0 | 0.3 | GO:0048156 | tau protein binding(GO:0048156) |
| 0.0 | 2.3 | GO:0003727 | single-stranded RNA binding(GO:0003727) |
| 0.0 | 0.1 | GO:0015173 | aromatic amino acid transmembrane transporter activity(GO:0015173) |
| 0.0 | 0.3 | GO:0047144 | 2-acylglycerol-3-phosphate O-acyltransferase activity(GO:0047144) |
| 0.0 | 0.6 | GO:0004435 | phosphatidylinositol phospholipase C activity(GO:0004435) |
| 0.0 | 0.4 | GO:0004535 | poly(A)-specific ribonuclease activity(GO:0004535) |
| 0.0 | 0.4 | GO:0004143 | diacylglycerol kinase activity(GO:0004143) |
| 0.0 | 0.2 | GO:0008503 | benzodiazepine receptor activity(GO:0008503) |
| 0.0 | 0.6 | GO:0017075 | syntaxin-1 binding(GO:0017075) |
| 0.0 | 0.4 | GO:0008139 | nuclear localization sequence binding(GO:0008139) |
| 0.0 | 0.2 | GO:0009982 | pseudouridine synthase activity(GO:0009982) |
| 0.0 | 0.8 | GO:0043531 | ADP binding(GO:0043531) |
| 0.0 | 0.9 | GO:0008137 | NADH dehydrogenase (ubiquinone) activity(GO:0008137) NADH dehydrogenase (quinone) activity(GO:0050136) |
| 0.0 | 0.9 | GO:0000049 | tRNA binding(GO:0000049) |
| 0.0 | 0.3 | GO:0001671 | ATPase activator activity(GO:0001671) |
| 0.0 | 0.1 | GO:0052591 | sn-glycerol-3-phosphate:ubiquinone oxidoreductase activity(GO:0052590) sn-glycerol-3-phosphate:ubiquinone-8 oxidoreductase activity(GO:0052591) |
| 0.0 | 0.3 | GO:0031432 | titin binding(GO:0031432) |
| 0.0 | 0.3 | GO:0001161 | intronic transcription regulatory region sequence-specific DNA binding(GO:0001161) intronic transcription regulatory region DNA binding(GO:0044213) |
| 0.0 | 0.3 | GO:0008175 | tRNA methyltransferase activity(GO:0008175) |
| 0.0 | 0.4 | GO:0016922 | ligand-dependent nuclear receptor binding(GO:0016922) |
| 0.0 | 0.1 | GO:0035005 | 1-phosphatidylinositol-4-phosphate 3-kinase activity(GO:0035005) |
| 0.0 | 0.2 | GO:0030280 | structural constituent of epidermis(GO:0030280) |
| 0.0 | 1.8 | GO:0070491 | repressing transcription factor binding(GO:0070491) |
| 0.0 | 0.5 | GO:0005388 | calcium-transporting ATPase activity(GO:0005388) |
| 0.0 | 0.2 | GO:0008494 | translation activator activity(GO:0008494) |
| 0.0 | 1.0 | GO:0050681 | androgen receptor binding(GO:0050681) |
| 0.0 | 1.2 | GO:0048306 | calcium-dependent protein binding(GO:0048306) |
| 0.0 | 0.6 | GO:0047485 | protein N-terminus binding(GO:0047485) |
| 0.0 | 0.4 | GO:0000146 | microfilament motor activity(GO:0000146) |
| 0.0 | 0.5 | GO:1990841 | promoter-specific chromatin binding(GO:1990841) |
| 0.0 | 0.3 | GO:0043325 | phosphatidylinositol-3,4-bisphosphate binding(GO:0043325) |
| 0.0 | 2.8 | GO:0004984 | olfactory receptor activity(GO:0004984) |
| 0.0 | 0.3 | GO:0070006 | metalloaminopeptidase activity(GO:0070006) |
Gene overrepresentation in curated gene sets: canonical pathways category:
| Log-likelihood per target | Total log-likelihood | Term | Description |
|---|---|---|---|
| 0.3 | 20.7 | PID INTEGRIN2 PATHWAY | Beta2 integrin cell surface interactions |
| 0.1 | 1.6 | PID P38 ALPHA BETA PATHWAY | Regulation of p38-alpha and p38-beta |
| 0.1 | 1.4 | SA PTEN PATHWAY | PTEN is a tumor suppressor that dephosphorylates the lipid messenger phosphatidylinositol triphosphate. |
| 0.1 | 3.1 | PID CD40 PATHWAY | CD40/CD40L signaling |
| 0.1 | 1.7 | PID INSULIN GLUCOSE PATHWAY | Insulin-mediated glucose transport |
| 0.0 | 2.4 | PID P38 MKK3 6PATHWAY | p38 MAPK signaling pathway |
| 0.0 | 1.3 | PID DNA PK PATHWAY | DNA-PK pathway in nonhomologous end joining |
| 0.0 | 4.2 | PID INSULIN PATHWAY | Insulin Pathway |
| 0.0 | 3.1 | PID AMB2 NEUTROPHILS PATHWAY | amb2 Integrin signaling |
| 0.0 | 3.5 | PID CMYB PATHWAY | C-MYB transcription factor network |
| 0.0 | 2.1 | ST T CELL SIGNAL TRANSDUCTION | T Cell Signal Transduction |
| 0.0 | 2.1 | PID PTP1B PATHWAY | Signaling events mediated by PTP1B |
| 0.0 | 2.4 | PID RAC1 PATHWAY | RAC1 signaling pathway |
| 0.0 | 2.3 | PID NFAT TFPATHWAY | Calcineurin-regulated NFAT-dependent transcription in lymphocytes |
| 0.0 | 3.3 | PID E2F PATHWAY | E2F transcription factor network |
| 0.0 | 1.6 | PID IL12 2PATHWAY | IL12-mediated signaling events |
| 0.0 | 2.2 | PID P53 REGULATION PATHWAY | p53 pathway |
| 0.0 | 1.1 | PID HIF1A PATHWAY | Hypoxic and oxygen homeostasis regulation of HIF-1-alpha |
| 0.0 | 1.9 | PID HNF3B PATHWAY | FOXA2 and FOXA3 transcription factor networks |
| 0.0 | 2.6 | PID CASPASE PATHWAY | Caspase cascade in apoptosis |
| 0.0 | 0.8 | ST DIFFERENTIATION PATHWAY IN PC12 CELLS | Differentiation Pathway in PC12 Cells; this is a specific case of PAC1 Receptor Pathway. |
| 0.0 | 1.3 | PID TCR PATHWAY | TCR signaling in naïve CD4+ T cells |
| 0.0 | 0.4 | PID IL3 PATHWAY | IL3-mediated signaling events |
| 0.0 | 0.5 | PID INTEGRIN5 PATHWAY | Beta5 beta6 beta7 and beta8 integrin cell surface interactions |
| 0.0 | 1.9 | PID MYC REPRESS PATHWAY | Validated targets of C-MYC transcriptional repression |
| 0.0 | 0.3 | PID CIRCADIAN PATHWAY | Circadian rhythm pathway |
| 0.0 | 0.4 | PID TNF PATHWAY | TNF receptor signaling pathway |
| 0.0 | 0.5 | PID BARD1 PATHWAY | BARD1 signaling events |
| 0.0 | 0.3 | PID ARF6 DOWNSTREAM PATHWAY | Arf6 downstream pathway |
| 0.0 | 0.5 | PID CXCR3 PATHWAY | CXCR3-mediated signaling events |
Gene overrepresentation in curated gene sets: REACTOME pathways category:
| Log-likelihood per target | Total log-likelihood | Term | Description |
|---|---|---|---|
| 0.7 | 13.2 | REACTOME RECYCLING OF BILE ACIDS AND SALTS | Genes involved in Recycling of bile acids and salts |
| 0.7 | 17.3 | REACTOME INTRINSIC PATHWAY | Genes involved in Intrinsic Pathway |
| 0.4 | 8.4 | REACTOME COMMON PATHWAY | Genes involved in Common Pathway |
| 0.4 | 4.8 | REACTOME SYNTHESIS OF BILE ACIDS AND BILE SALTS VIA 24 HYDROXYCHOLESTEROL | Genes involved in Synthesis of bile acids and bile salts via 24-hydroxycholesterol |
| 0.3 | 1.8 | REACTOME BINDING AND ENTRY OF HIV VIRION | Genes involved in Binding and entry of HIV virion |
| 0.2 | 3.4 | REACTOME XENOBIOTICS | Genes involved in Xenobiotics |
| 0.2 | 3.3 | REACTOME ABACAVIR TRANSPORT AND METABOLISM | Genes involved in Abacavir transport and metabolism |
| 0.1 | 2.5 | REACTOME BILE SALT AND ORGANIC ANION SLC TRANSPORTERS | Genes involved in Bile salt and organic anion SLC transporters |
| 0.1 | 2.9 | REACTOME CHYLOMICRON MEDIATED LIPID TRANSPORT | Genes involved in Chylomicron-mediated lipid transport |
| 0.1 | 2.6 | REACTOME REGULATION OF INSULIN LIKE GROWTH FACTOR IGF ACTIVITY BY INSULIN LIKE GROWTH FACTOR BINDING PROTEINS IGFBPS | Genes involved in Regulation of Insulin-like Growth Factor (IGF) Activity by Insulin-like Growth Factor Binding Proteins (IGFBPs) |
| 0.1 | 2.8 | REACTOME GLUCURONIDATION | Genes involved in Glucuronidation |
| 0.1 | 2.9 | REACTOME CYTOSOLIC SULFONATION OF SMALL MOLECULES | Genes involved in Cytosolic sulfonation of small molecules |
| 0.1 | 4.1 | REACTOME STEROID HORMONES | Genes involved in Steroid hormones |
| 0.1 | 1.2 | REACTOME TRAFFICKING AND PROCESSING OF ENDOSOMAL TLR | Genes involved in Trafficking and processing of endosomal TLR |
| 0.1 | 2.5 | REACTOME REGULATION OF COMPLEMENT CASCADE | Genes involved in Regulation of Complement cascade |
| 0.1 | 5.0 | REACTOME PHASE II CONJUGATION | Genes involved in Phase II conjugation |
| 0.1 | 1.5 | REACTOME TRYPTOPHAN CATABOLISM | Genes involved in Tryptophan catabolism |
| 0.1 | 0.2 | REACTOME SYNTHESIS OF BILE ACIDS AND BILE SALTS VIA 7ALPHA HYDROXYCHOLESTEROL | Genes involved in Synthesis of bile acids and bile salts via 7alpha-hydroxycholesterol |
| 0.0 | 2.4 | REACTOME LATENT INFECTION OF HOMO SAPIENS WITH MYCOBACTERIUM TUBERCULOSIS | Genes involved in Latent infection of Homo sapiens with Mycobacterium tuberculosis |
| 0.0 | 1.8 | REACTOME CASPASE MEDIATED CLEAVAGE OF CYTOSKELETAL PROTEINS | Genes involved in Caspase-mediated cleavage of cytoskeletal proteins |
| 0.0 | 1.2 | REACTOME ALPHA LINOLENIC ACID ALA METABOLISM | Genes involved in alpha-linolenic acid (ALA) metabolism |
| 0.0 | 1.2 | REACTOME AMINO ACID SYNTHESIS AND INTERCONVERSION TRANSAMINATION | Genes involved in Amino acid synthesis and interconversion (transamination) |
| 0.0 | 1.4 | REACTOME SYNTHESIS OF PC | Genes involved in Synthesis of PC |
| 0.0 | 0.7 | REACTOME ETHANOL OXIDATION | Genes involved in Ethanol oxidation |
| 0.0 | 0.7 | REACTOME REGULATION OF PYRUVATE DEHYDROGENASE PDH COMPLEX | Genes involved in Regulation of pyruvate dehydrogenase (PDH) complex |
| 0.0 | 1.4 | REACTOME POST CHAPERONIN TUBULIN FOLDING PATHWAY | Genes involved in Post-chaperonin tubulin folding pathway |
| 0.0 | 1.5 | REACTOME OXYGEN DEPENDENT PROLINE HYDROXYLATION OF HYPOXIA INDUCIBLE FACTOR ALPHA | Genes involved in Oxygen-dependent Proline Hydroxylation of Hypoxia-inducible Factor Alpha |
| 0.0 | 0.3 | REACTOME IRAK2 MEDIATED ACTIVATION OF TAK1 COMPLEX UPON TLR7 8 OR 9 STIMULATION | Genes involved in IRAK2 mediated activation of TAK1 complex upon TLR7/8 or 9 stimulation |
| 0.0 | 3.0 | REACTOME AMINO ACID AND OLIGOPEPTIDE SLC TRANSPORTERS | Genes involved in Amino acid and oligopeptide SLC transporters |
| 0.0 | 2.3 | REACTOME MYOGENESIS | Genes involved in Myogenesis |
| 0.0 | 1.3 | REACTOME TIGHT JUNCTION INTERACTIONS | Genes involved in Tight junction interactions |
| 0.0 | 3.0 | REACTOME TCR SIGNALING | Genes involved in TCR signaling |
| 0.0 | 1.5 | REACTOME NEP NS2 INTERACTS WITH THE CELLULAR EXPORT MACHINERY | Genes involved in NEP/NS2 Interacts with the Cellular Export Machinery |
| 0.0 | 1.1 | REACTOME SYNTHESIS OF PIPS AT THE PLASMA MEMBRANE | Genes involved in Synthesis of PIPs at the plasma membrane |
| 0.0 | 0.6 | REACTOME METABOLISM OF PORPHYRINS | Genes involved in Metabolism of porphyrins |
| 0.0 | 0.5 | REACTOME IRON UPTAKE AND TRANSPORT | Genes involved in Iron uptake and transport |
| 0.0 | 2.4 | REACTOME NOTCH1 INTRACELLULAR DOMAIN REGULATES TRANSCRIPTION | Genes involved in NOTCH1 Intracellular Domain Regulates Transcription |
| 0.0 | 0.8 | REACTOME REGULATION OF GENE EXPRESSION IN BETA CELLS | Genes involved in Regulation of gene expression in beta cells |
| 0.0 | 0.4 | REACTOME CALNEXIN CALRETICULIN CYCLE | Genes involved in Calnexin/calreticulin cycle |
| 0.0 | 0.7 | REACTOME ENDOSOMAL SORTING COMPLEX REQUIRED FOR TRANSPORT ESCRT | Genes involved in Endosomal Sorting Complex Required For Transport (ESCRT) |
| 0.0 | 0.5 | REACTOME TIE2 SIGNALING | Genes involved in Tie2 Signaling |
| 0.0 | 1.3 | REACTOME DARPP 32 EVENTS | Genes involved in DARPP-32 events |
| 0.0 | 0.5 | REACTOME MITOCHONDRIAL TRNA AMINOACYLATION | Genes involved in Mitochondrial tRNA aminoacylation |
| 0.0 | 0.5 | REACTOME DESTABILIZATION OF MRNA BY KSRP | Genes involved in Destabilization of mRNA by KSRP |
| 0.0 | 1.1 | REACTOME TRANSPORT TO THE GOLGI AND SUBSEQUENT MODIFICATION | Genes involved in Transport to the Golgi and subsequent modification |
| 0.0 | 0.5 | REACTOME HOMOLOGOUS RECOMBINATION REPAIR OF REPLICATION INDEPENDENT DOUBLE STRAND BREAKS | Genes involved in Homologous recombination repair of replication-independent double-strand breaks |
| 0.0 | 0.5 | REACTOME CYTOSOLIC TRNA AMINOACYLATION | Genes involved in Cytosolic tRNA aminoacylation |
| 0.0 | 0.5 | REACTOME METABOLISM OF NON CODING RNA | Genes involved in Metabolism of non-coding RNA |
| 0.0 | 0.7 | REACTOME ION TRANSPORT BY P TYPE ATPASES | Genes involved in Ion transport by P-type ATPases |
| 0.0 | 0.5 | REACTOME PLATELET CALCIUM HOMEOSTASIS | Genes involved in Platelet calcium homeostasis |
| 0.0 | 0.6 | REACTOME TRAFFICKING OF GLUR2 CONTAINING AMPA RECEPTORS | Genes involved in Trafficking of GluR2-containing AMPA receptors |
| 0.0 | 0.9 | REACTOME GLYCOSPHINGOLIPID METABOLISM | Genes involved in Glycosphingolipid metabolism |
| 0.0 | 0.4 | REACTOME IL RECEPTOR SHC SIGNALING | Genes involved in Interleukin receptor SHC signaling |
| 0.0 | 0.4 | REACTOME HS GAG DEGRADATION | Genes involved in HS-GAG degradation |
| 0.0 | 0.6 | REACTOME MRNA SPLICING MINOR PATHWAY | Genes involved in mRNA Splicing - Minor Pathway |
| 0.0 | 0.7 | REACTOME G1 PHASE | Genes involved in G1 Phase |
| 0.0 | 0.3 | REACTOME UNBLOCKING OF NMDA RECEPTOR GLUTAMATE BINDING AND ACTIVATION | Genes involved in Unblocking of NMDA receptor, glutamate binding and activation |
| 0.0 | 0.4 | REACTOME ADVANCED GLYCOSYLATION ENDPRODUCT RECEPTOR SIGNALING | Genes involved in Advanced glycosylation endproduct receptor signaling |
| 0.0 | 0.4 | REACTOME SIGNALING BY FGFR1 FUSION MUTANTS | Genes involved in Signaling by FGFR1 fusion mutants |
| 0.0 | 0.4 | REACTOME PROSTACYCLIN SIGNALLING THROUGH PROSTACYCLIN RECEPTOR | Genes involved in Prostacyclin signalling through prostacyclin receptor |
| 0.0 | 0.3 | REACTOME CIRCADIAN REPRESSION OF EXPRESSION BY REV ERBA | Genes involved in Circadian Repression of Expression by REV-ERBA |
| 0.0 | 0.8 | REACTOME INTERFERON GAMMA SIGNALING | Genes involved in Interferon gamma signaling |
| 0.0 | 3.5 | REACTOME ANTIGEN PROCESSING UBIQUITINATION PROTEASOME DEGRADATION | Genes involved in Antigen processing: Ubiquitination & Proteasome degradation |
| 0.0 | 1.3 | REACTOME IMMUNOREGULATORY INTERACTIONS BETWEEN A LYMPHOID AND A NON LYMPHOID CELL | Genes involved in Immunoregulatory interactions between a Lymphoid and a non-Lymphoid cell |
| 0.0 | 0.3 | REACTOME RNA POL I TRANSCRIPTION INITIATION | Genes involved in RNA Polymerase I Transcription Initiation |
| 0.0 | 0.5 | REACTOME SEMA4D INDUCED CELL MIGRATION AND GROWTH CONE COLLAPSE | Genes involved in Sema4D induced cell migration and growth-cone collapse |